Sample Category Title
EUR/USD Weekly Outlook
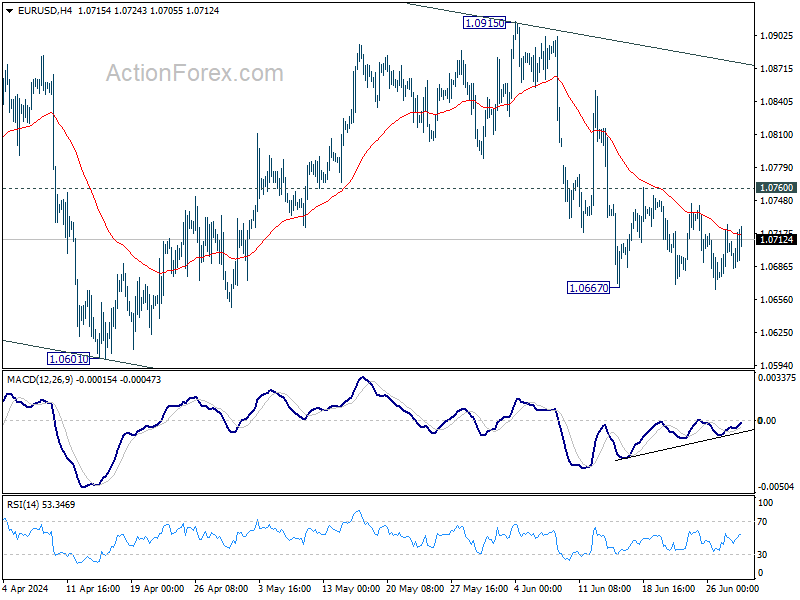
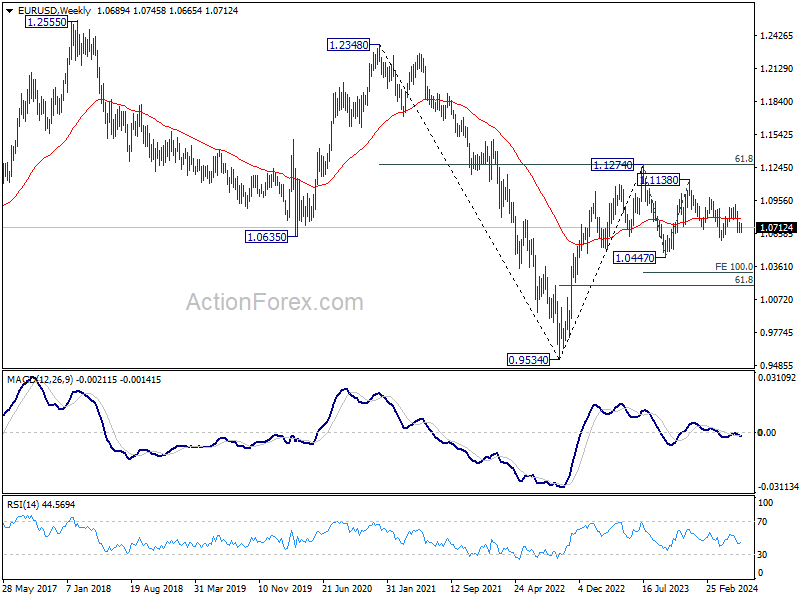
EUR/USD's consolidation form 1.0667 continued last week and outlook is unchanged. Initial bias remains neutral this week first and further fall is expected with 1.0760 resistance intact. Decline from 1.0915 is seen as another leg in the larger corrective pattern. Firm break of 1.0667 will target 1.0601 and below. However, decisive break of 1.0760 will turn intraday bias back to the upside for stronger rebound.
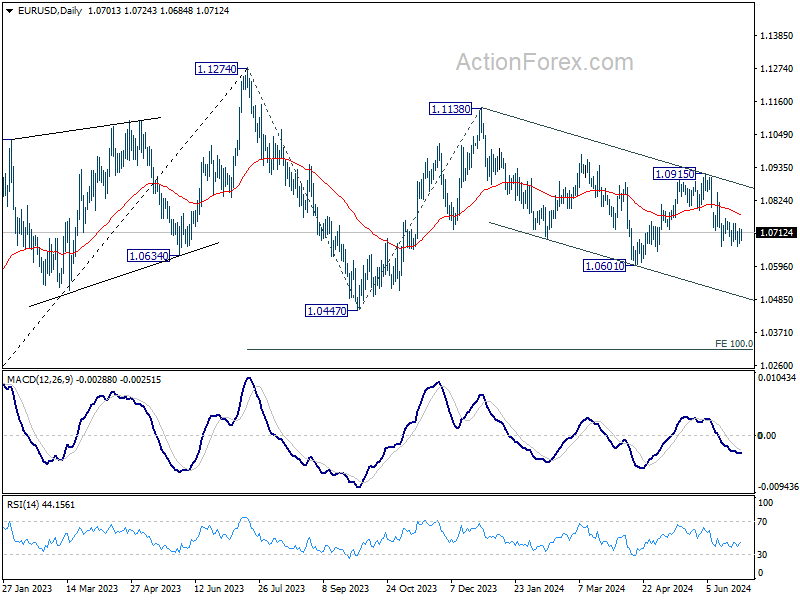
In the bigger picture, price actions from 1.1274 are viewed as a corrective pattern that's still in progress. Break of 1.0601 will target 1.0447 support and possibly further to 100% projection of 1.1274 to 1.0447 from 1.1138 at 1.0311. For now, this will remain the favored case as long as 1.0915 resistance holds, in case of rebound.
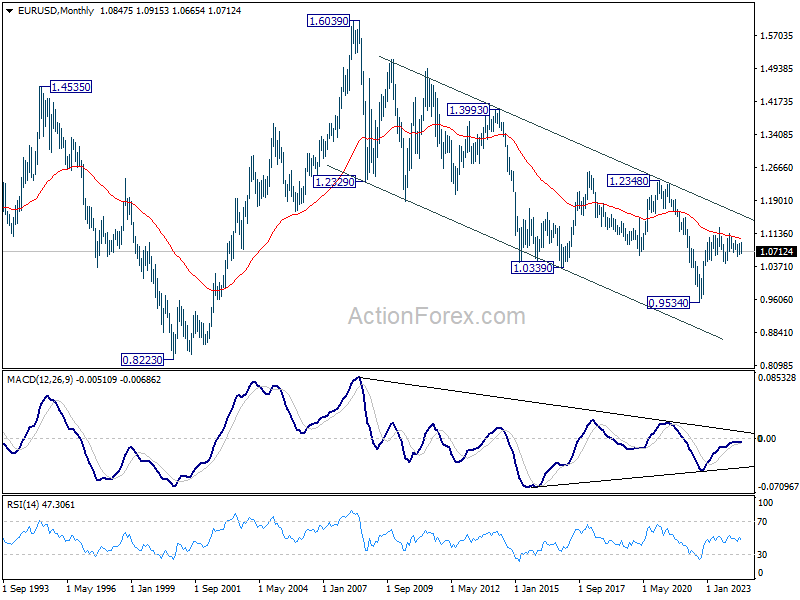
In the long term picture, a long term bottom is in place at 0.9534 (2022 low). But considering that upside is still capped below 55 M EMA (now at 1.1018), there is no sign of trend reversal yet. Down trend from 1.6039 (2008 high) could resume at a later stage if current selloff picks up momentum.
USD/JPY Weekly Outlook
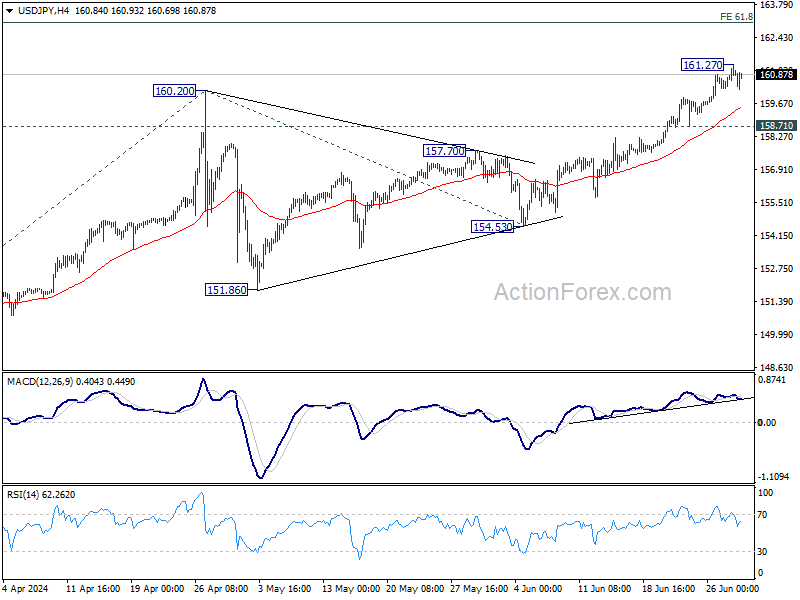
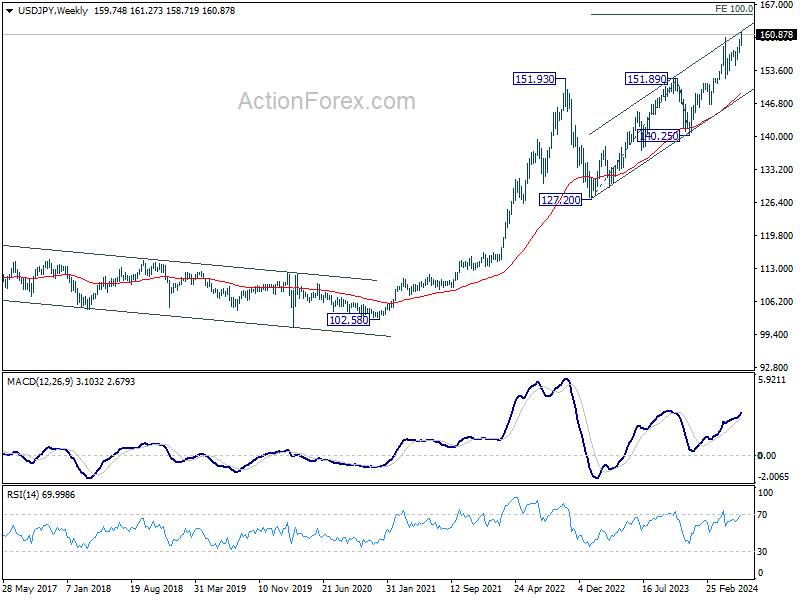
USD/JPY's break of 160.20 resistance last week confirmed long term up trend resumption. But as a temporary top was formed at 161.27, initial bias remains neutral this week for consolidations. Downside should be contained by 158.71 support to bring another rally. Break of 161.27 will target 61.8% projection of 146.47 to 160.20 from 154.53 at 163.01.
In the bigger picture, long term up trend is still in progress. Further rise is expected as long as 154.53 support holds. Next target is 100% projection of 127.20 (2023 low) to 151.89 (2023 high) from 140.25 at 164.94.
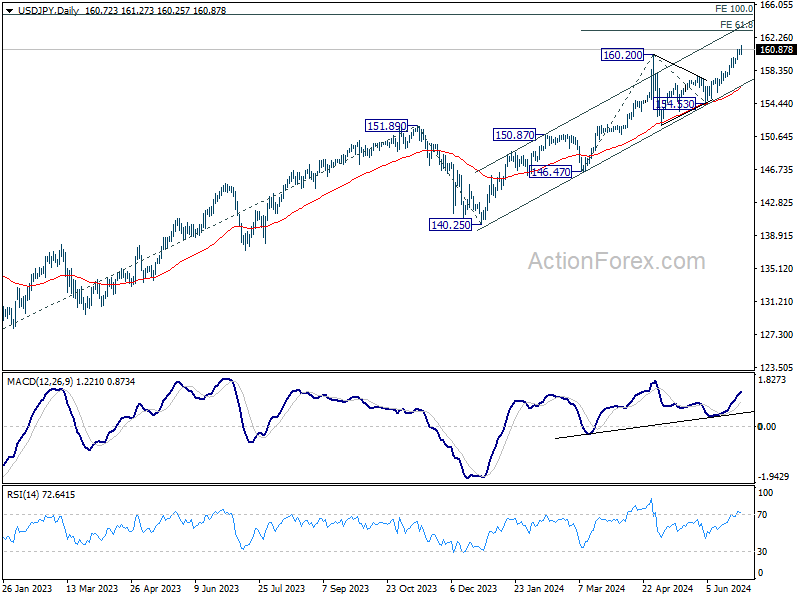
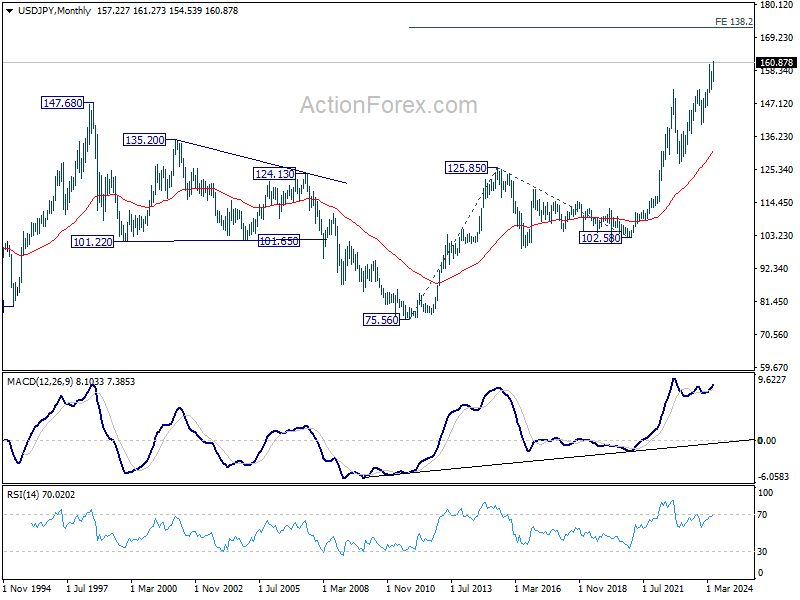
In the long term picture, as long as 140.25 support holds, up trend from 75.56 (2011 low) is still in progress. Next target is 138.2% projection of 75.56 (2011 low) to 125.85 (2015 high) from 102.58 at 172.08.
GBP/USD Weekly Outlook
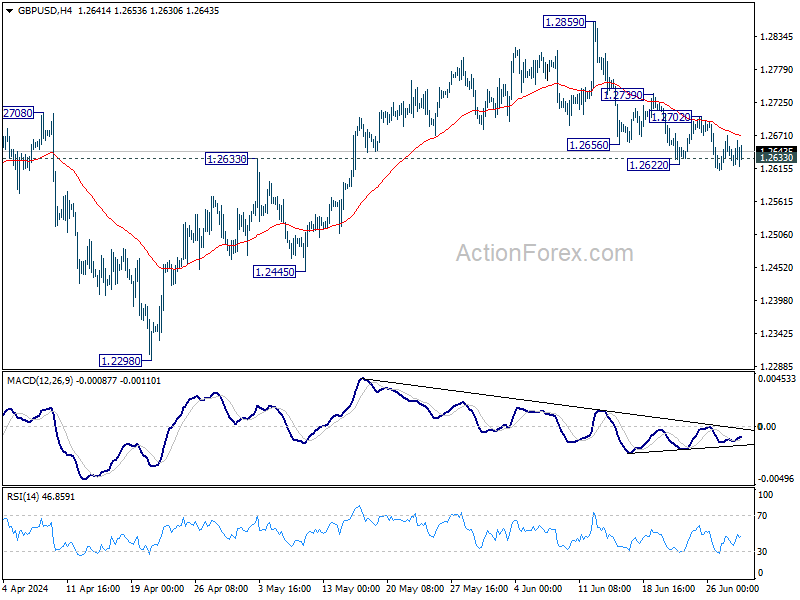
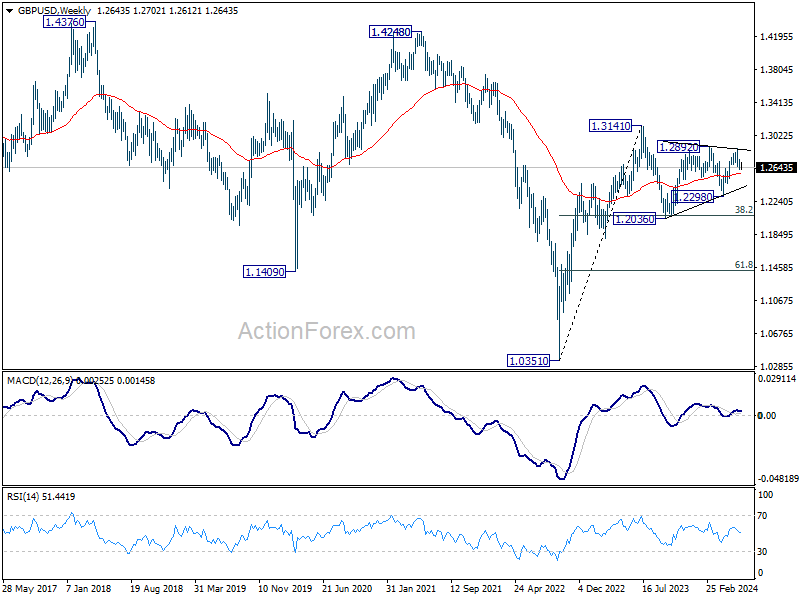
GBP/USD's fall from 1.2859 tied to continued last week but failed to sustain below 1.2633 resistance turned support. Still, further decline is expected as long as 1.2702 resistance holds. Sustained trading below 1.2633 resistance turned support will argue that whole rise from 1.2298 has completed, and target 1.2445 and below. On the upside, however, firm break of 1.2702 resistance will argue that pull back from 1.2859 has completed, and bring retest of this high instead.
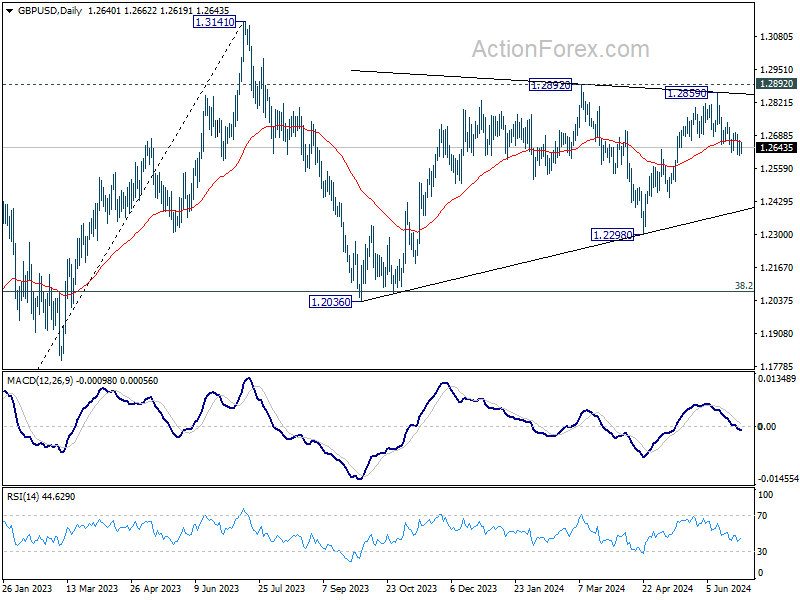
In the bigger picture, price actions from 1.3141 medium term top are seen as a corrective pattern that is still in progress. Break of 1.2445 support will confirm that another falling leg has started and target 1.2036 cluster support again (38.2% retracement of 1.0351 (2022 low) to 1.3141 at 1.2075. Nevertheless, break of 1.2892 resistance will argue that larger up trend from 1.0351is ready to resume through 1.3141.
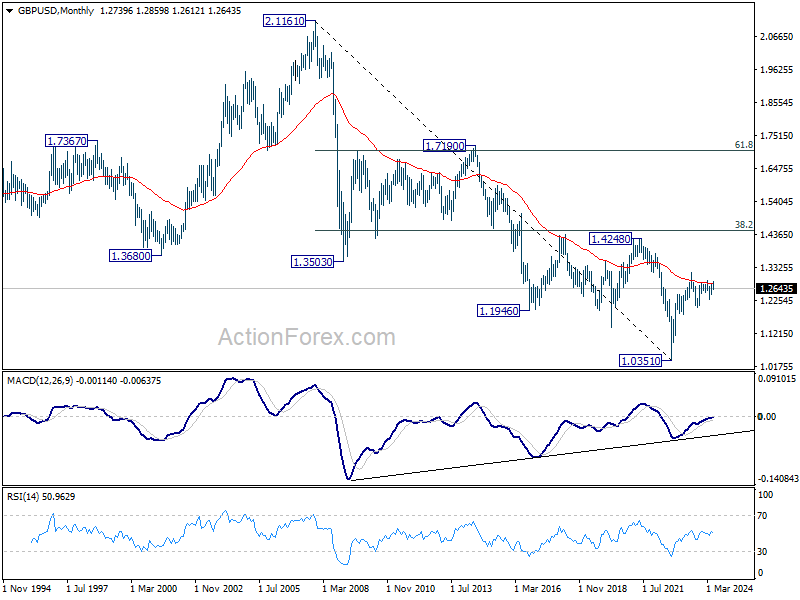
In the long term picture, a long term bottom should be in place at 1.0351 on bullish convergence condition in M MACD. But momentum of the rebound from 1.3051 argues GBP/USD is merely in consolidation, rather than trend reversal. Range trading is likely between 1.0351/4248 for some more time.
USD/CHF Weekly Outlook
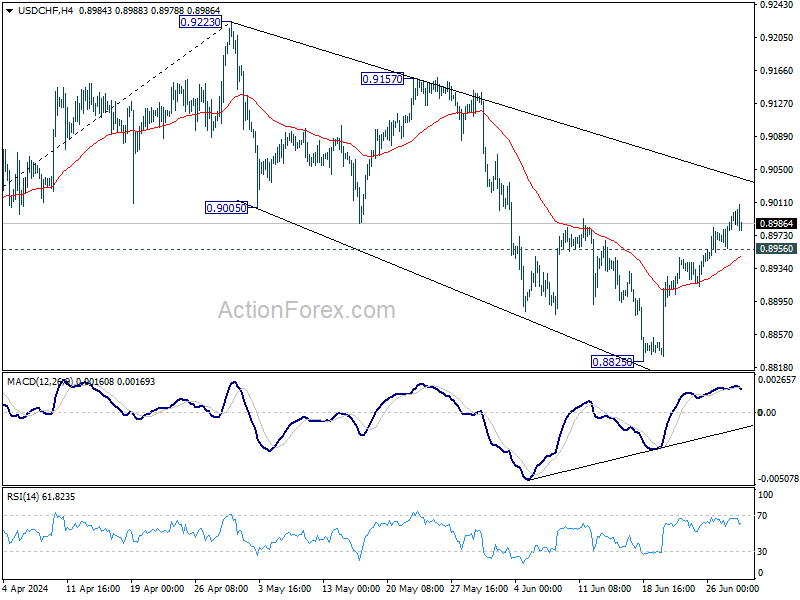
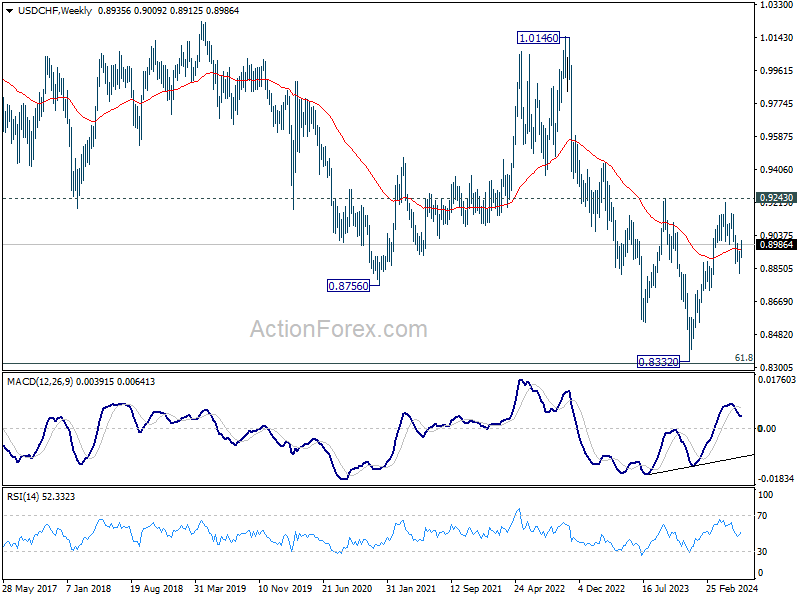
USD/CHF's stronger than expected rebound argues that fall from 0.9223 might have completed as a three-wave corrective move to 0.8825. Initial bias is mildly on the upside for channel resistance (now at 0.9037). Firm break there will target 0.9157 resistance next. On the downside, below 0.8956 minor support will turn intraday bias neutral gain first.
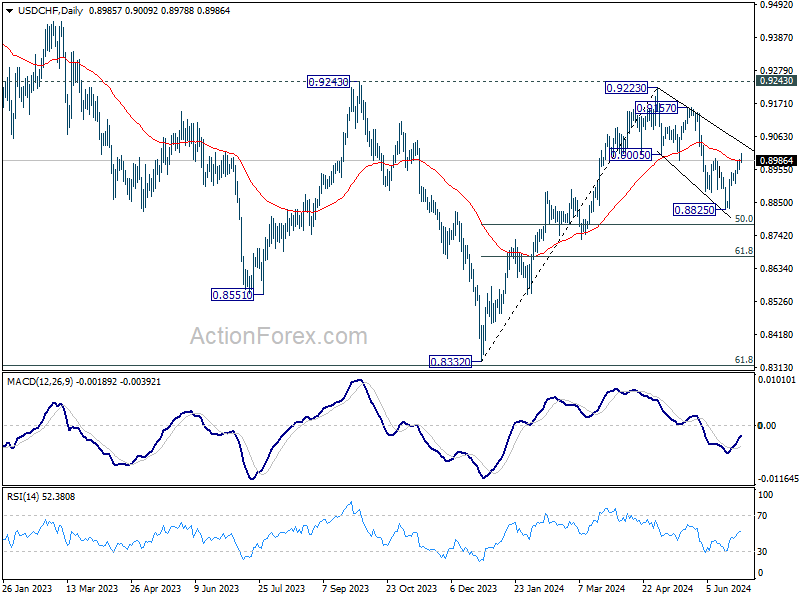
In the bigger picture, price actions from 0.8332 medium term bottom are seen as developing into a corrective pattern to the down trend from 1.0146 (2022 high). Rejection by 0.9243 resistance affirms this case, and maintains medium term bearishness. While more range trading could be seen between 0.8332/0.9243 first, downside breakout is mildly in favor at a later stage.
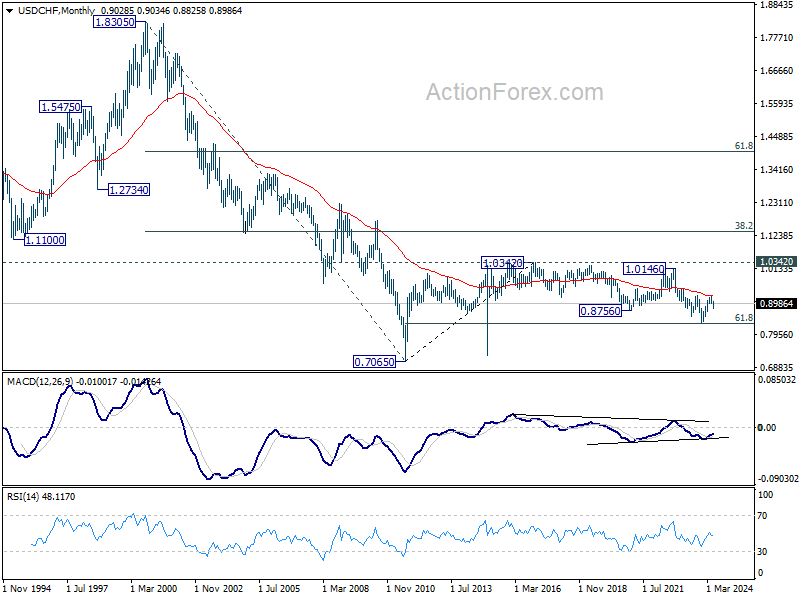
In the long term picture, price action from 0.7065 (2011 high) are seen as a corrective pattern to the multi-decade down trend from 1.8305 (2000 high). Strong rebound from 61.8% retracement of 0.7065 to 1.0342 (2016 high) will start the third leg as a medium term rally. But there will be no sign of long term reversal until firm break of 38.2% retracement of 1.8305 to 0.7065 at 1.1359.
AUD/USD Weekly Report
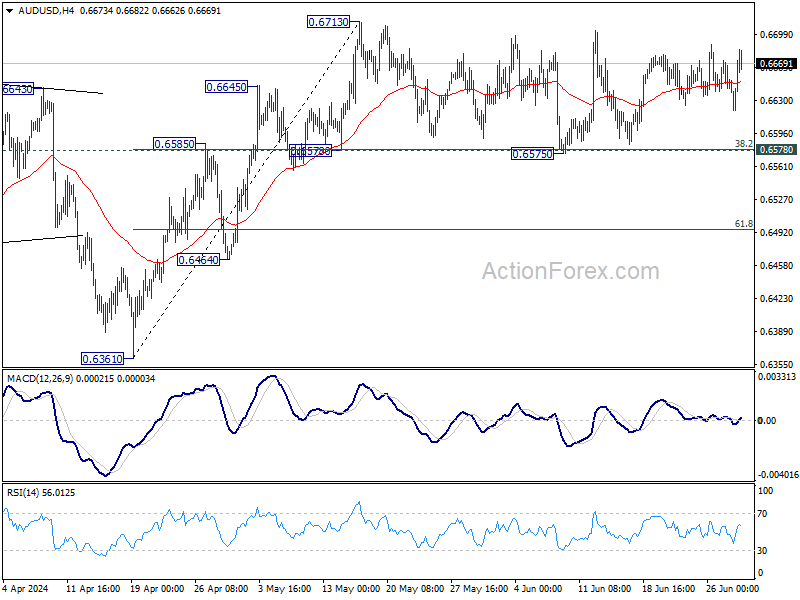
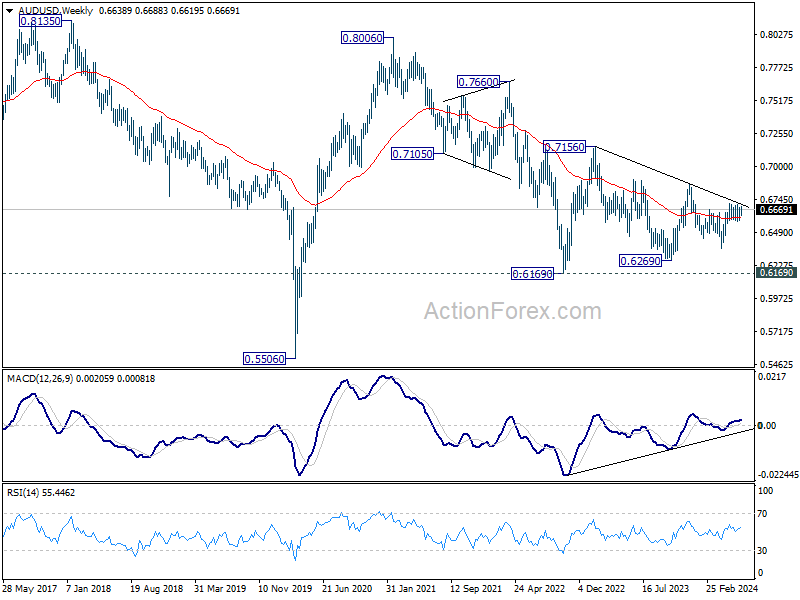
AUD/USD extended consolidation from 0.6713 last week and outlook remains unchanged. Initial bias stays neutral this week first. Further rally is in favor with 0.6578 cluster support (38.2% retracement of 0.6361 to 0.6713 at 0.6579) intact. On the upside, firm break of 0.6713 will resume whole rise from 0.6361 to 0.6870 resistance next. However, sustained break of 0.6578 will dampen this bullish view, and bring deeper fall to 61.8% retracement at 0.6495.
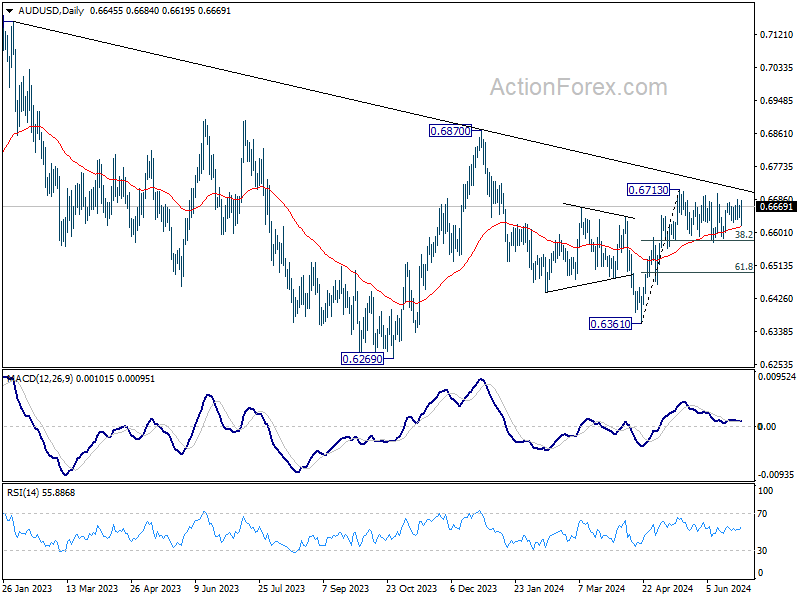
In the bigger picture, price actions from 0.6169 (2022 low) are seen as a medium term corrective pattern to the down trend from 0.8006 (2021 high). Fall from 0.7156 (2023 high) is seen as the second leg, which could have completed at 0.6269 already. Rise from there is seen as the third leg which is now trying to resume through 0.6870 resistance.
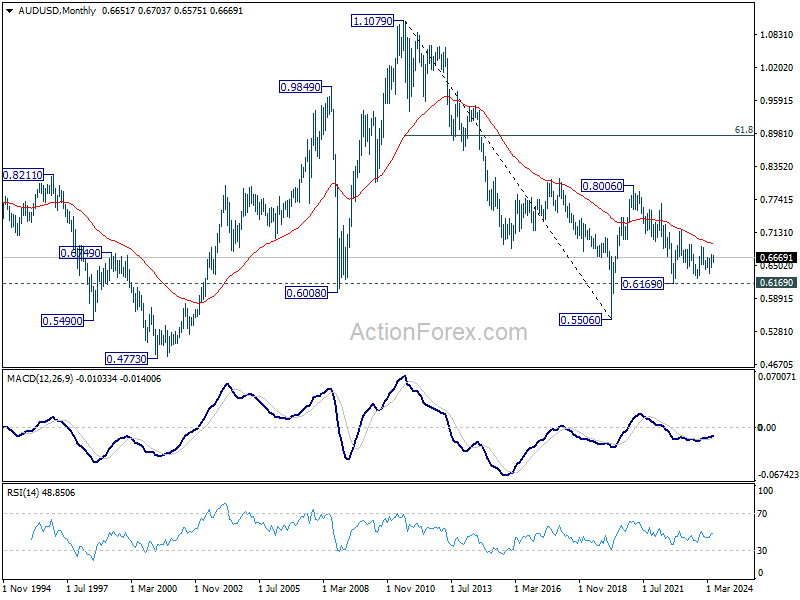
In the long term picture, the down trend from 1.1079 (2011 high) should have completed at 0.5506 (2020 low) already. It's unsure yet whether price actions from 0.5506 are developing into a corrective pattern, or trend reversal. But in either case, fall from 0.8006 is seen as the second leg of the pattern. Hence, in case of deeper decline, strong support should emerge above 0.5506 to bring reversal.
USD/CAD Weekly Outlook
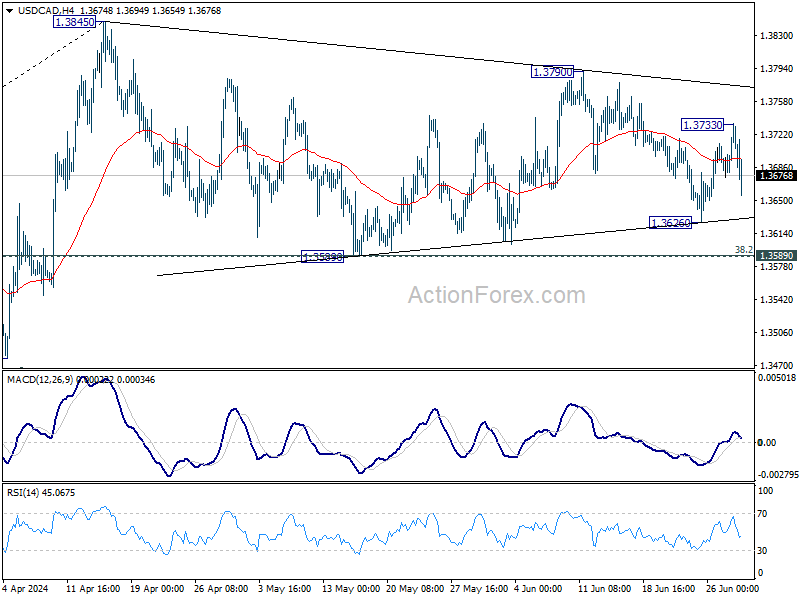
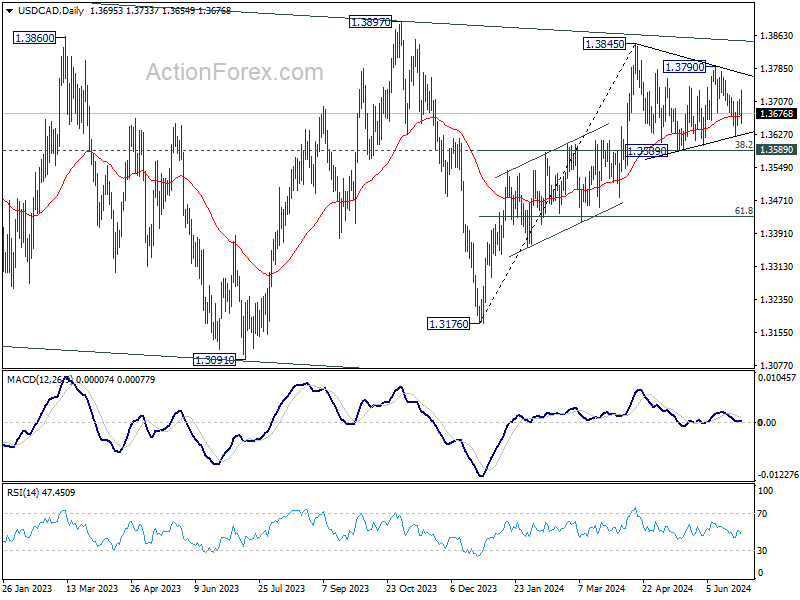
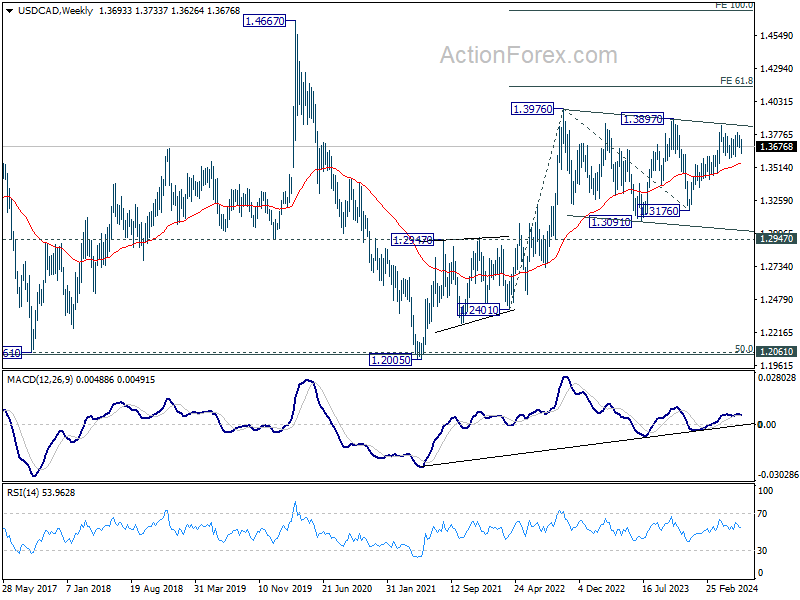
USD/CAD rebounded after dipping to 1.3626, but failed to extend gain after hitting 1.3733. Overall, consolidation pattern from 1.3845 is extending. Initial bias remains neutral this week first. While deeper fall could be seen, downside should be contained by 1.3589 cluster support (38.2% retracement of 1.3176 to 1.3845 at 1.3589) to bring rebound. Break of 1.3790 resistance will argue that larger rise is ready to resume and target 1.3845 resistance.
In the bigger picture, price actions from 1.3976 (2022 high) are viewed as a corrective pattern. In case of another fall, strong support should emerge above 1.2947 resistance turned support to bring rebound. Firm break of 1.3976 will confirm up resumption of whole up trend from 1.2005 (2021 low). Next target is 61.8% projection of 1.2401 to 1.3976 from 1.3176 at 1.4149.
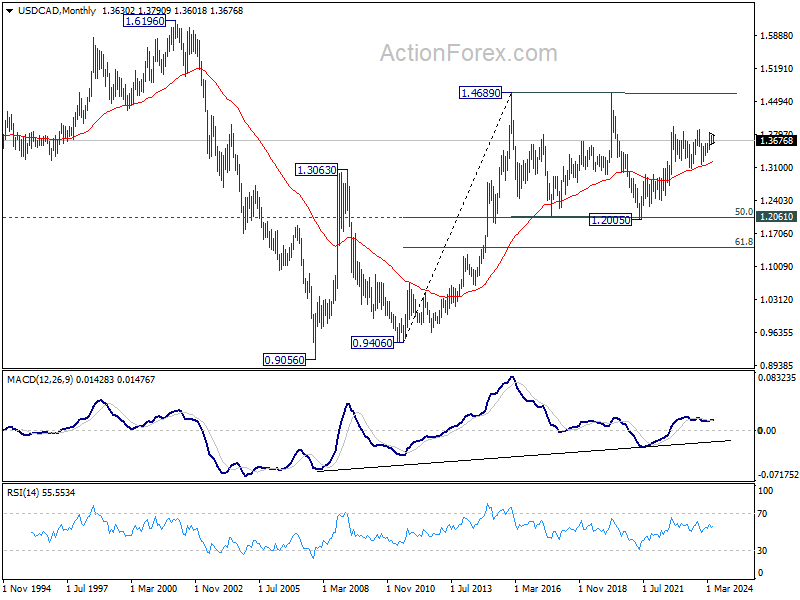
In the longer term picture, price actions from 1.4689 (2016 high) are seen as a consolidation pattern, which might have completed at 1.2005. That is, up trend from 0.9506 (2007 low) is expected to resume at a later stage. This will remain the favored case as long as 1.2947 resistance turned support holds.
GBP/JPY Weekly Outlook
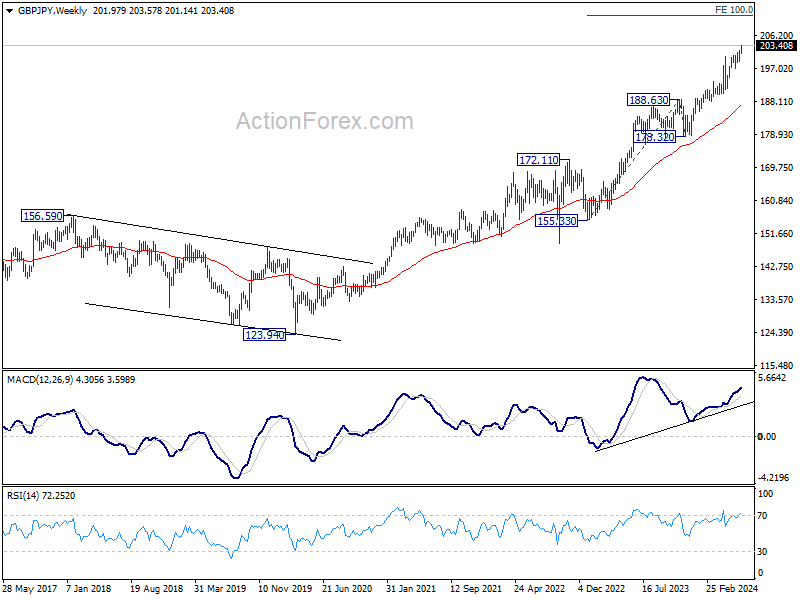
GBP/JPY's up trend continued last week and outlook is unchanged. Initial bias stays on the upside this week. Next target is 100% projection of 191.34 to 200.72 from 197.18 at 206.56 next. On the downside, below 202.41 minor support will turn intraday bias neutral and bring consolidations. But outlook will remain bullish as long as 200.72 resistance turned support holds, in case of retreat.
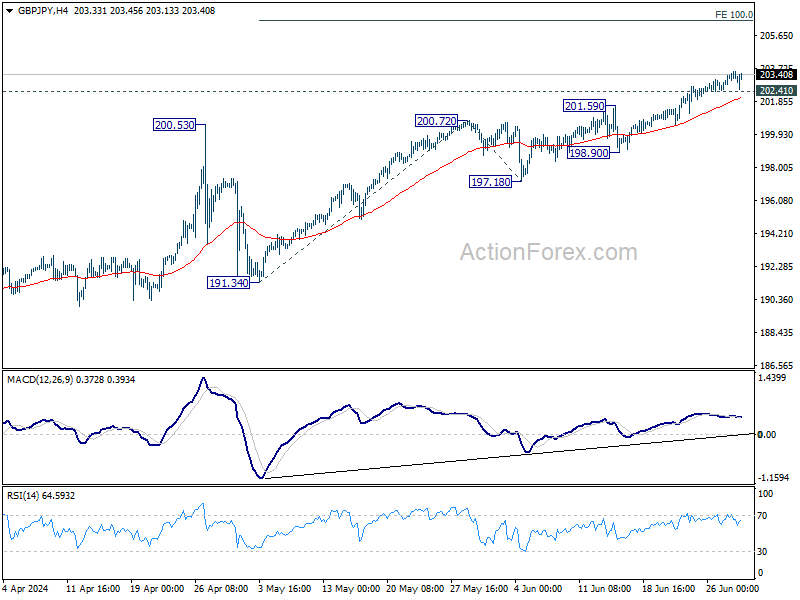
In the bigger picture, long term up trend is still in progress. Next target is 100% projection of 155.33 to 188.63 from 178.32 at 211.62. Outlook will stay bullish as long as 197.18 support holds, even in case of deep pullback.
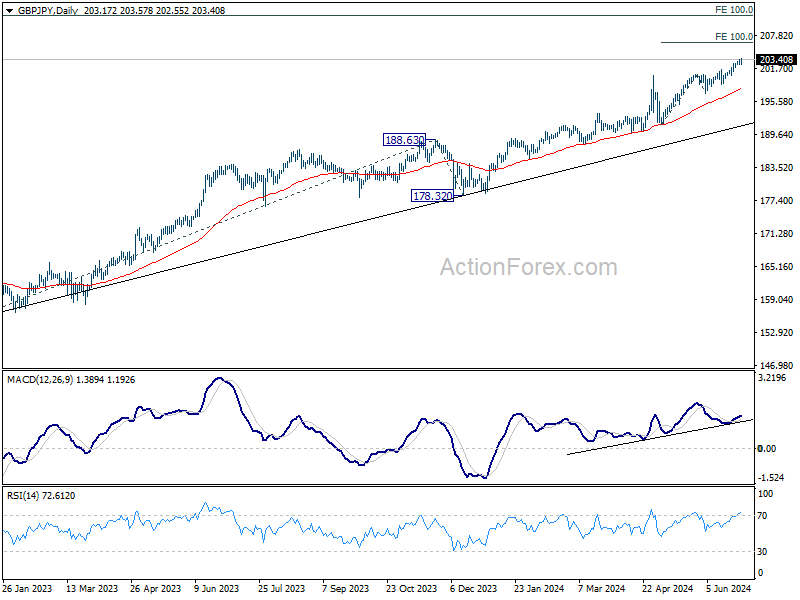
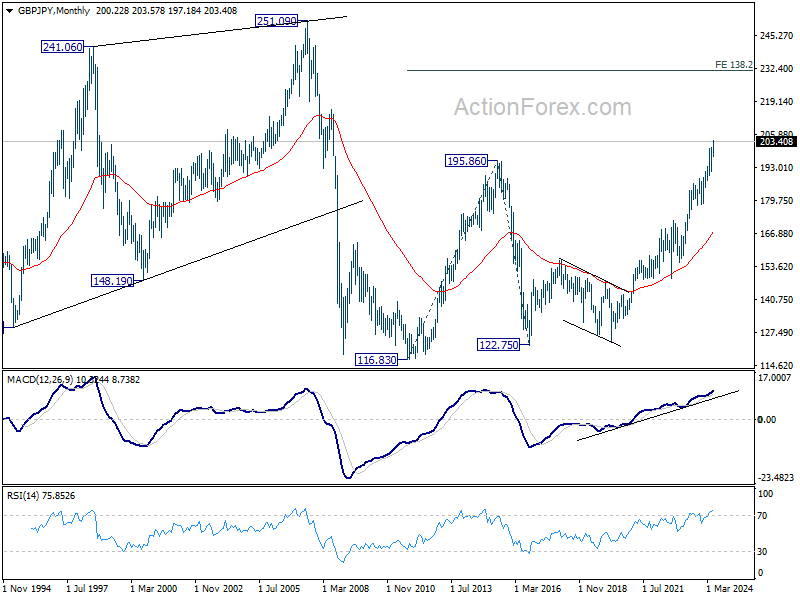
In the longer term picture, rise from 122.75 (2016 low) is seen as the third leg of the pattern from 116.83 (2011 low). Next target is 138.2% projection of 116.83 to 195.86 from 122.75 at 231.96. Outlook will stay bullish as long as 178.32 support holds.
EUR/JPY Weekly Outlook
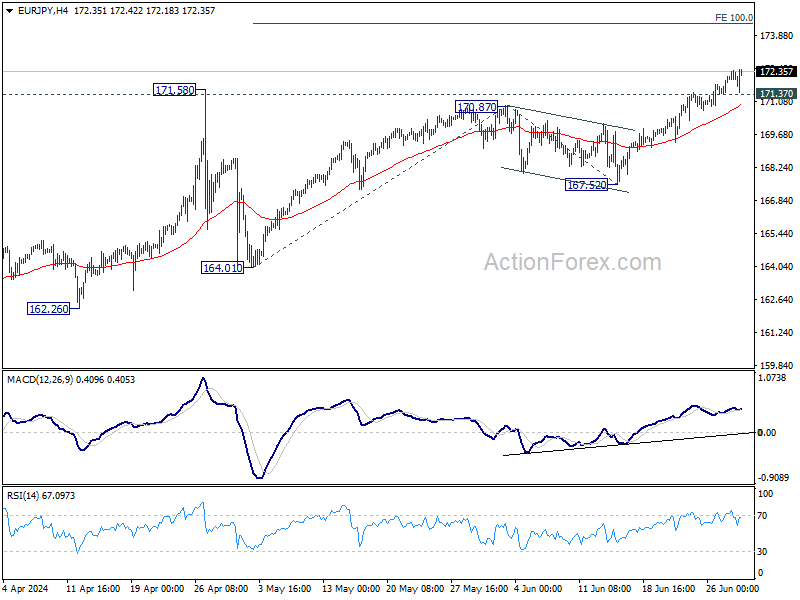
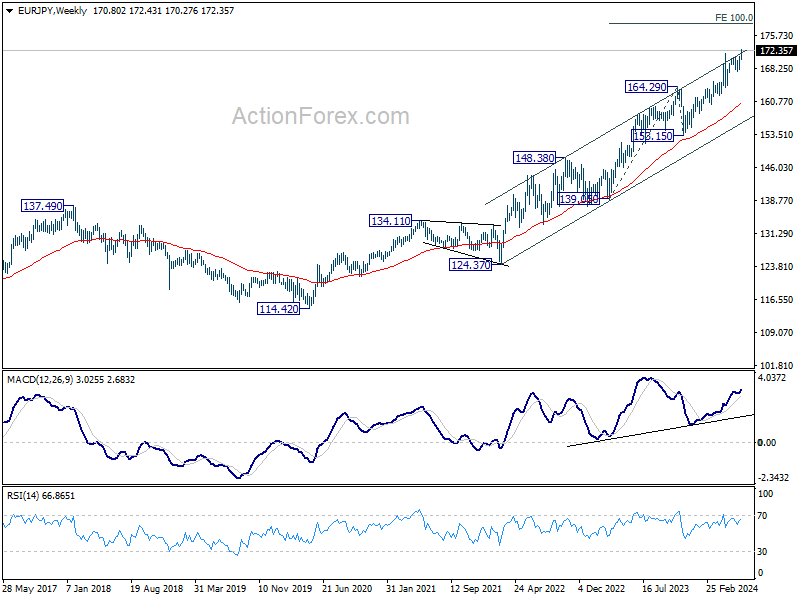
EUR/JPY's break of 171.58 resistance last week confirmed up trend resumption. Initial bias stays on the upside this week. Next target is 100% projection of 164.01 to 170.87 from 167.52 at 174.38. On the downside, below 171.37 minor support will turn intraday bias neutral and bring consolidations first, before staging another rally.
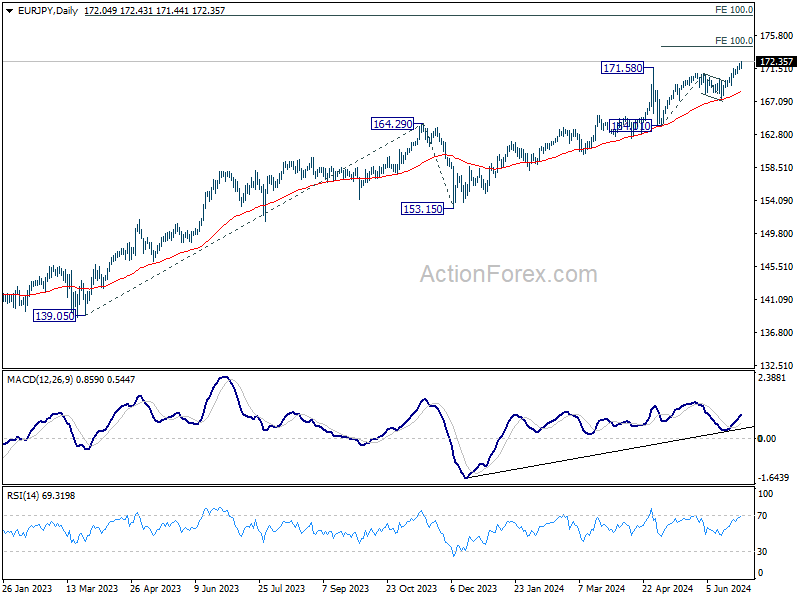
In the bigger picture, long term up trend is still in progress. Next target is 100% projection of 139.05 to 164.29 from 153.15 at 178.38. For now outlook will stay bullish as long as 167.52 support holds, even in case of deep pullback.
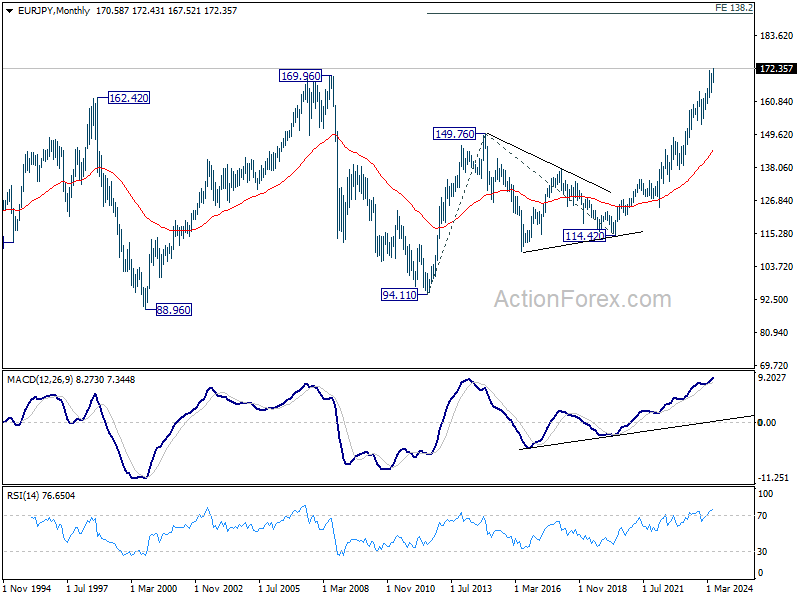
In the long term picture, rise from 114.42 (2020 low) is seen as the third leg of the whole up trend from 94.11 (2012 low). Next target is 138.2% projection of 94.11 to 149.76 from 114.42 at 191.32. This will remain the favored case as long as 153.15 support holds.
EUR/GBP Weekly Outlook
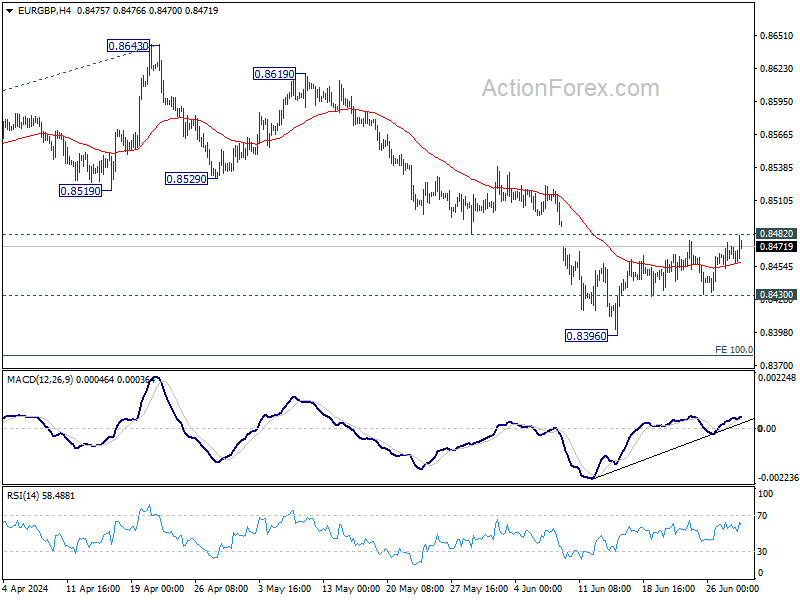
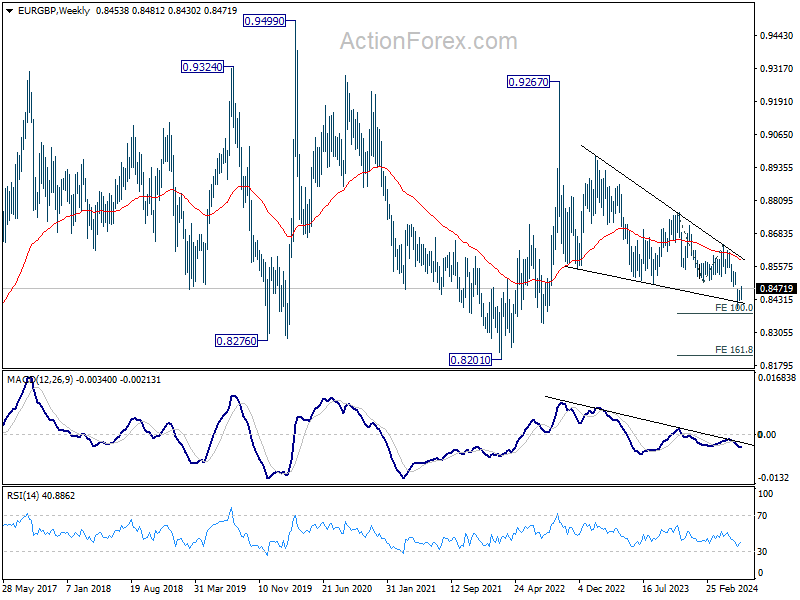
EUR/GBP's recovery from 0.8396 continued last week but upside remains capped below by 0.8482 support turned resistance. Initial bias stays neutral this week and outlook remains bearish bearish. On the downside, below 0.8430 support will turn bias back to the downside for 0.8396 support first. Firm break there will resume larger down trend to 0.8376 projection level next. However, sustained break of 0.8482 will turn bias to the upside for stronger rebound instead.
In the bigger picture, down trend from 0.9267 (2022 high) is in progress. Next target is 100% projection of 0.8764 to 0.8497 from 0.8643 at 0.8376. Sustained break there will target 161.8% projection at 0.8211 next. For now, outlook will remain bearish as long as 0.8643 resistance holds, even in case of stronger rebound.
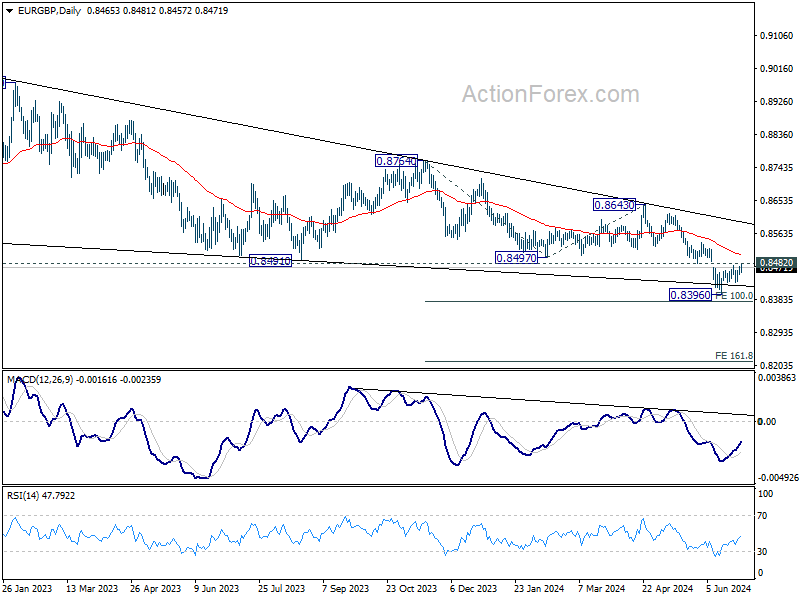
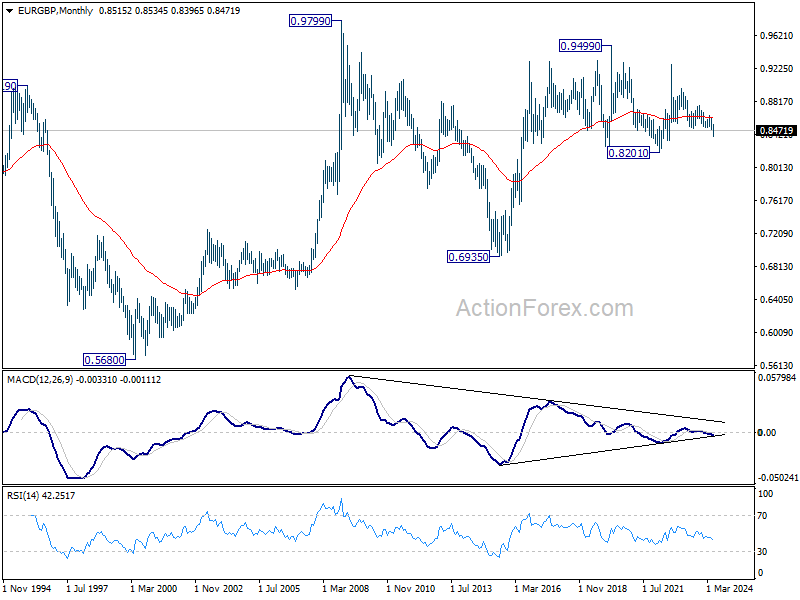
In the long term picture, price action from 0.9499 (2020 high) is seen as part of the long term range pattern from 0.9799 (2008 high). Range trading should continue between 0.8201 and 0.9499, until there is clear signal of imminent breakout.
EUR/AUD Weekly Outlook
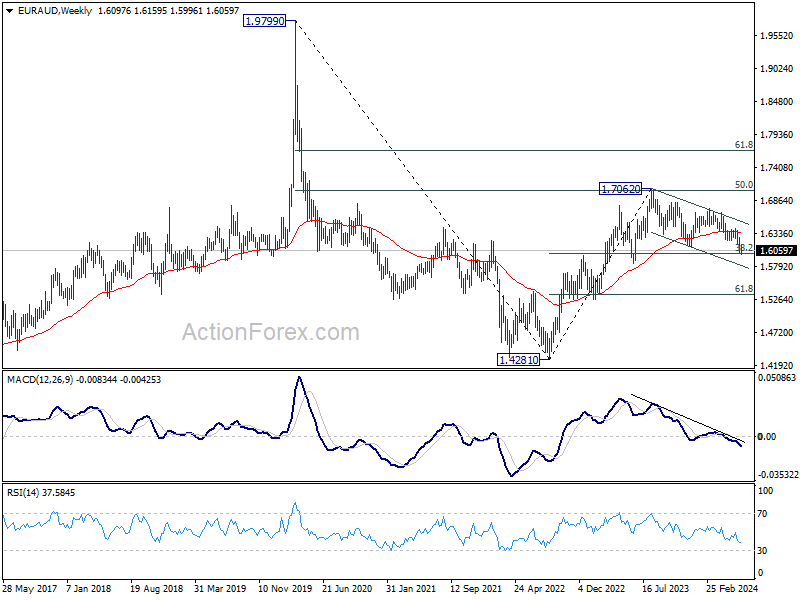
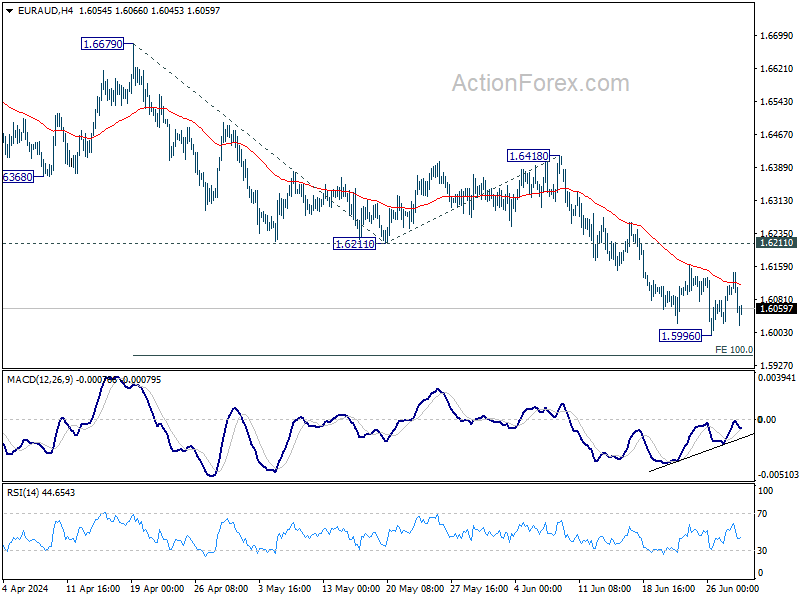
EUR/AUD edged lower to 1.5996 last week but recovered since then. Initial bias remains neutral this week first, and outlook stays bearish as long as 1.6211 support turned resistance holds. On the downside, break of 1.5996 will target 100% projection of 1.6679 to 1.6211 from 1.6418 at 1.5950. Firm break there will target 1.5846 key support next.
In the bigger picture, fall from 1.7062 medium term top is seen as a correction to the up trend from 1.4281 (2022 low) only. Strong support is still expected between 1.5846 and 38.2% retracement of 1.4281 to 1.7062 at 1.6000 to bring rebound. Break of 1.6148 resistance will argue that the correction has completed.

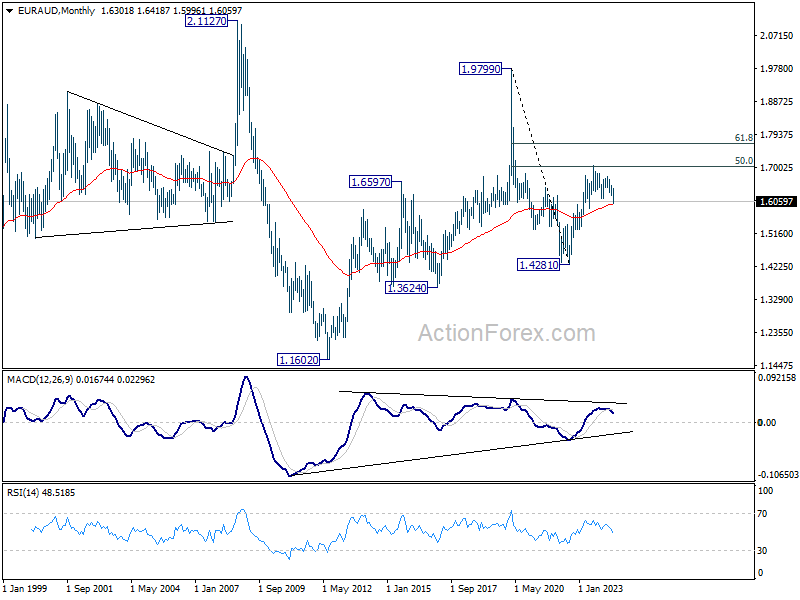
In the longer term picture, price actions from 1.9799 (2020 high) are seen as a long term decline at the same scale as the rise from 1.1602 (2012 low). Rebound from 1.4281 is seen as the second leg. As long as 55 M EMA (now at 1.5966) holds, this second leg could still extend higher. However, sustained trading below 55 M EMA will open up the bearish case for extending the decline through 1.4281 low.