Sample Category Title
Euro, European Equities Rally, But French Election Tempest Far From Over
Yes, Mesdames et Messieurs, the first round of the French legislative election went totally according to the plan for Marine Le Pen’s Nationally Rally which secured one vote over three and became the first far-right party to top the legislative elections in France. The New Popular Front – the alliance of left and greens - won 28% of the votes and Emmanuel Macron’s party posted a miserable 20%. The second round is due next weekend.
The kneejerk reaction was a jump in the euro in the early week trading. The EURUSD jumped past 1.0750, the euro-pound flirted with the 0.85 level and the European futures trade in the positive as a ‘buy the rumour sell the fact’ reaction to the election outcome - and also on chatter that National Rally may not secure an absolute majority in the second round. But there is a non-neglectable chance for Marine Le Pen and Mr, Bardella to win the parliamentary majority next week and that risk will unlikely let the euro run too high before more clarity.
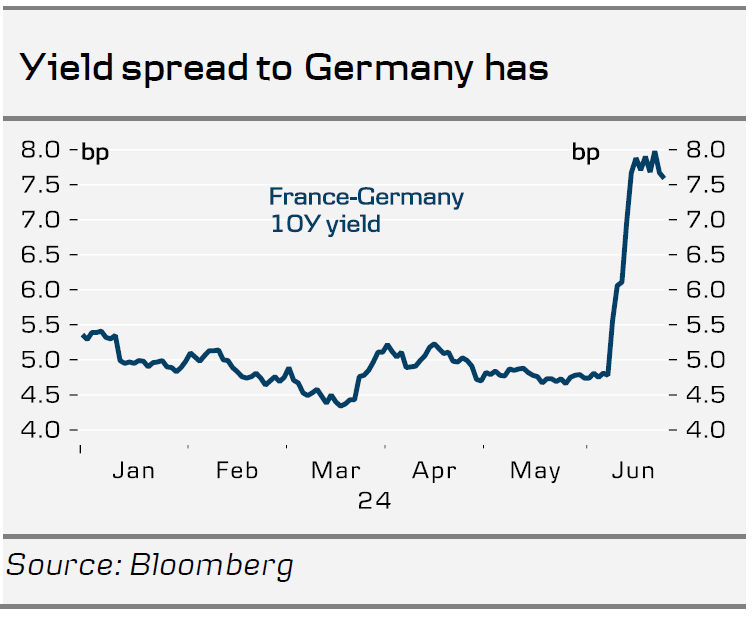
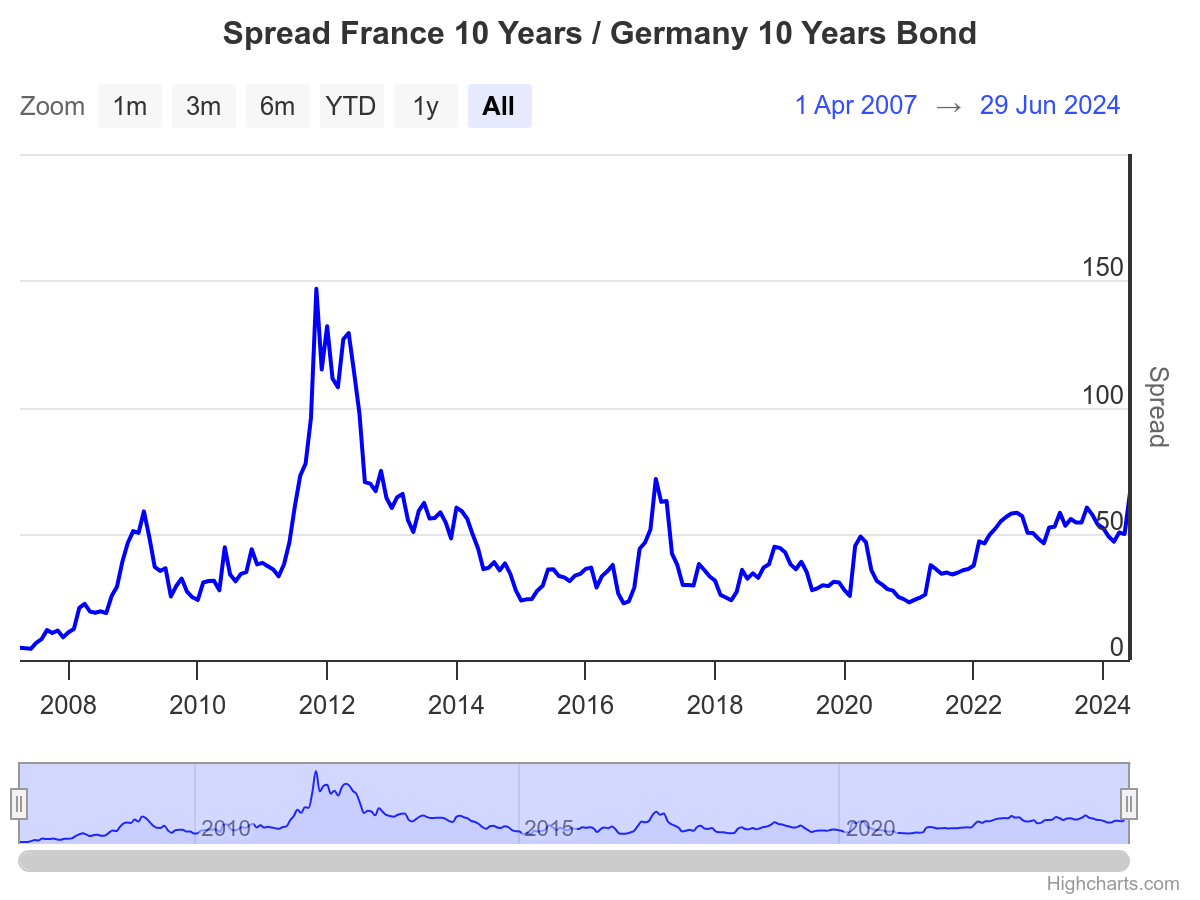
The spread between the French and German 10-year yields topped 80bp last week, a level that has not been seen since the European debt crisis back more than a decade ago. But the French-German spread has room to widen and a Le Pen majority could revive that demon.
Across the Channel, the week starts with increased election vibes as well, because Brits will be headed to their own general election this Thursday with little suspense on the horizon. A Labour win is seen as a net positive for financial markets, and would benefit to banks, homebuilders and groceries the most according to JP Morgan. A Labour should also benefit to the British pound in the long run on hope of improved relations with Europe post- Brexit. In the short run, however, a Labour win is broadly priced in. Therefore the return of the Bank of England (BoE) doves following the election could keep the pound’s upside potential limited. Cable trades around its 50-DMA this morning and may not clear the 1.28 offers even after the election dust settles.
Good news from the data front
Released on Friday, the US core PCE slowed as expected in May as personal spending fell short of expectations. Combined to Thursday’s soft GDP number, last week’s US data was supportive of the Federal Reserve (Fed) doves. The S&P500 hit a fresh record, though closed the session in the negative.
But looking back, the S&P500 and Nasdaq had a stellar H1 thanks to the extension of the tech rally. It would be healthy to see the rally broaden to other sectors provided that the narrow breadth increases the risk of sudden and sharp selloffs. According to Bank of America, the algorithmic models boosted their exposure to technology to such extent that the stop-loss triggers became very tight. In numbers, the commodity trader advisors, so the automated trade models, can start unwinding their long positions when the US futures drop 2.8% or more, while this threshold was at 4% a month ago. This means that the margin for a misstep becomes narrower and the risk of long squeeze rises as the major US indices travel through uncharted territories on the shoulders of just a few tech names that are probably overpriced.
French Election: Public Spending Not Set to Rise Significantly
- Initial projections, alongside statements from Macron and Melenchon on Sunday, indicate that the most probable outcome is that no party will achieve an absolute majority, resulting in a 'hung parliament'. Hence, public spending in France is not set to rise significantly (see scenario 1, page 2).
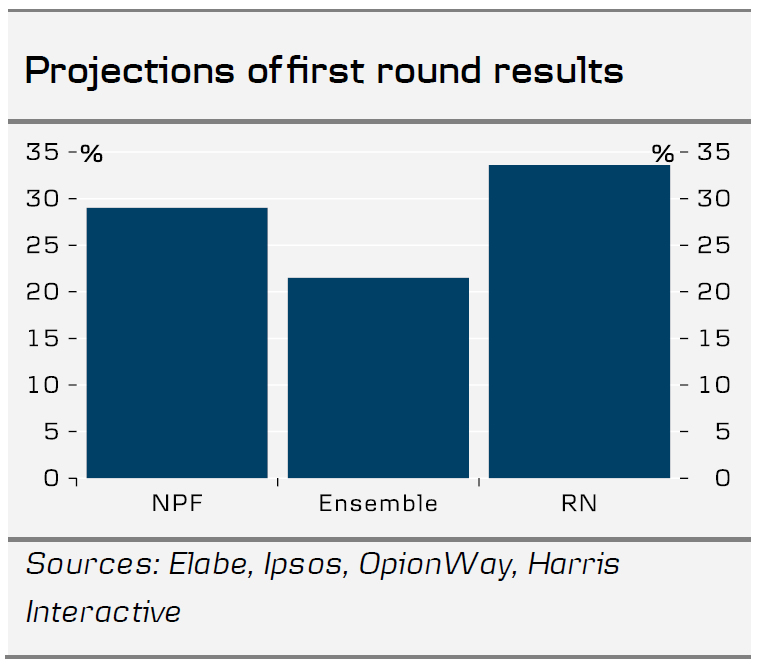
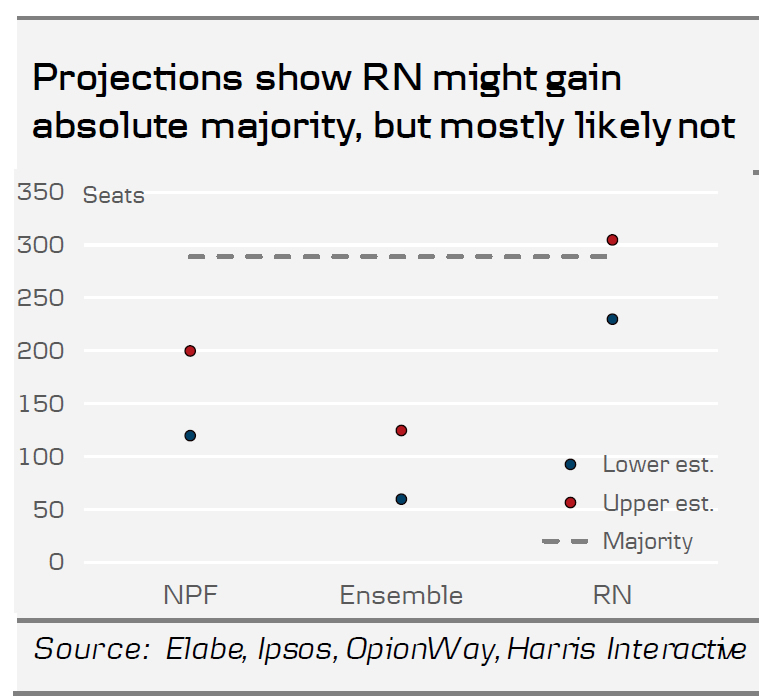
- Projections indicate that National Rally (RN) won the first round with around 33.5% of the votes, which translates to 230-305 seats in the National Assembly. A party needs 289 to gain an absolute majority. The left-wing New Popular Front (NPF) came second with around 28.9% (120-200 seats) and Macron's centrist alliance (Ensemble) third with around 21.4% (60-125 seats). The final result is determined on Sunday 7 July.
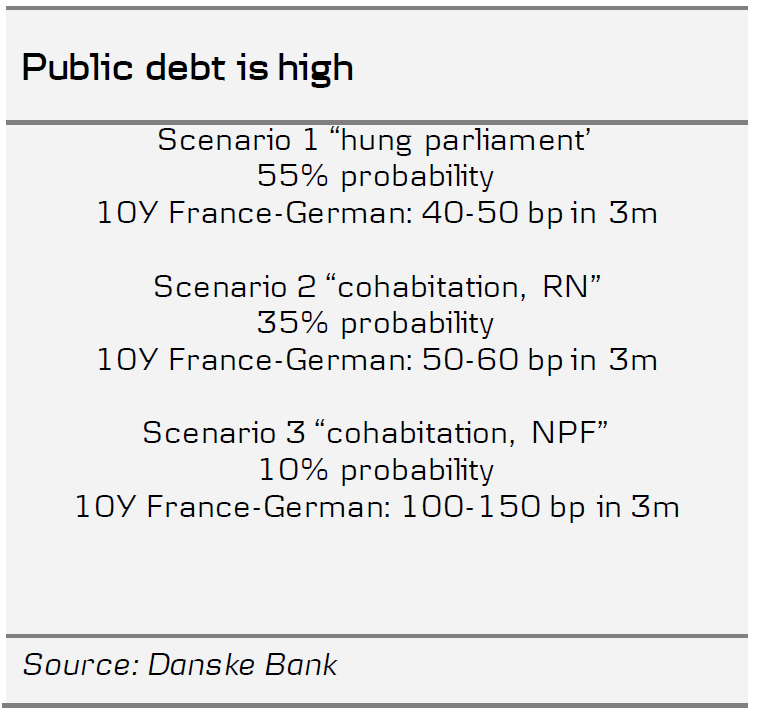
- The most likely scenario (55% probability) is a 'hung parliament' in the National Assembly after the second round. In this main scenario, we thus expect the 10y yield spread between France and Germany to tighten by some 30bp to 40-60 bp within 3 months as fears over spending increases fade.
- Due to record-high voter turnout, approximately 300 constituencies will have three candidates in the final round. However, both Macron and left-wing leader Melenchon have pledged to withdraw candidates within the next 48 hours to defeat the RN.
- In the "cohabitation" scenario (35% probability) where Le Pen's party, Rassemblement National (RN), wins an absolute majority and Jordan Bardella becomes the next prime minister, we also expect the 10y yield spread between France and Germany to tighten, albeit to a less extend and trade between 50-60 bp within 3 months.
The first round of the election makes 'hung parliament' most likely
Initial projections, alongside statements from Macron and Melenchon on Sunday, indicate that the most probable outcome is that no party will achieve an absolute majority, resulting in a 'hung parliament'. Hence, public spending in France is not set to rise significantly (see scenario 1, page 2). The second most likely scenario is an absolute majority for the National Rally, especially if third candidates from the NPF and Ensemble do not withdraw as previously stated. Notably for the markets, the scenario where the left-wing NPF secures an absolute majority is considered the least likely, so the worst fears of spending increases should fade.
The most updated projections from four pollsters' show that the National Rally (RN) won the first round with around 33.5% of the votes, which translates to 230-305 seats in the National Assembly. Gaining an absolute majority requires a party to secure 289 seats, and while it is uncertain if National Rally (RN) has achieved this, it appears most likely that they have not. The left-wing New Popular Front (NPF) came second with around 28.9% (120-200 seats) and Macron's centrist alliance (Ensemble) third with around 21.4% (60-125 seats). The projection is not the actual result of the first-round, but it indicates that RN had a slightly worse result than polls suggested and Ensemble and NPF a slightly better result.
In the second round on Sunday, July 7, there will be runoffs between the two candidates who received the most votes along with any third or fourth candidate who garnered more than 12.5% of all eligible votes. Due to the record high voter turnout, it is estimated that around 300 constituencies will feature three candidates. This situation presents a clear advantage for the National Rally, as votes will be split between the centre and the left. However, the left-wing NPF leader, Melenchon, has encouraged all third-placed candidates from his group to withdraw in an effort to unite against the sRN along with Macron's Ensemble. Macron himself has called for "a broad, clearly democratic and republican alliance for the second round." He stated that they would withdraw candidates where they placed third to support those who uphold "the values of the republic" in defeating the National Rally. Candidates now have 48 hours to withdraw in what promises to be a period of intense negotiations that is crucial to monitor.
Three scenarios for the second-round result and their impact on markets
The most likely scenario (scenario 1, probability: 55%) is a 'hung parliament' where no group or party obtains an absolute majority in the National Assembly. In this scenario, the new government will need to seek ad-hoc support for legislation, necessitating compromise. Given the division in the French parliament we find it unlikely that the new government can find support for any larger increases in spending. As the government needs to use the so-called article 49.3 to pass legislation (including the budget) through without a majority, we find large changes in policies unlikely as it then requires that the government survives a "no confidence" vote. Consequently, we should expect a status quo in France and its public finances. In this main scenario, we thus expect the 10y yield spread between France and Germany will tighten to 40-50 bp within 3 months as fears over spending increases fade.
In the "cohabitation" scenario (scenario 2, probability 35%) where Le Pen's party, National Rally (RN), wins an absolute majority and Jordan Bardella becomes the next prime minister, we expect only a gradual implementation of the party programme and no large immediate increases in public spending. This is supported by the fact that RN has rolled back the costliest initiatives from the previous campaign. Bardella, who is the prime minister candidate has particularly softened his rhetoric's on EU and public spending and in a recent FT interview Bardella said that "I do not intend to go to war with Brussels" and that the EU fiscal rules of a maximum deficit of 3% of GDP "remains an objective" and that "it will require me to prioritise". Moreover, Bardella said he will undertake an audit of French public finances before deciding on spending priorities in the autumn. However, we note that his first priority will be to cut the VAT on energy and petrol, which will cost EUR12bn a year (0.4% of GDP) which he intends to fund this by raising various taxes, cutting tax loopholes and the France's contribution to the EU budget. Yet, we assess that ambitions of turning the fiscal policy substantially more expansionary will be dampened by the risk of exclusion from EU/ECB support programmes or possible punishment in financial markets. Hence, in the scenario where Le Pen's party wins an absolute majority, we also expect the 10y yield spread between France and Germany to tighten to 50-60 bp within 3 months.
In the third scenario, also a "cohabitation" situation, the left-wing New Popular Front (NPF) coalition secures an absolute majority (scenario 3, probability: 10%). Here, we anticipate an increase in public spending and potential confrontations with the EU. Unlike Bardella and RN, the left-wing alliance has maintained a firm stance in its communications recently. They want to increase spending by some €EUR150bn (5% of GDP) by 2026-2027, lower the pension age from 64 to 60, and at the same time increase taxes similarly in order not to increase the deficit. However, as details on funding are sparse and the risk of anti-establishment increases, we expect the immediate reaction in this scenario will likely be a significant increase in the spread between France and Germany to 100-150 bp within 3 months. Whether the government then will be able to work together in such a scenario is very uncertain though as the NPF coalition consists of four very different parties with contrasting views on topics such as Russia and Israel. Especially, it is important to note, that the left-wing coalition includes a more modest party like the socialist party with former president François Hollande, and we do not think they would tolerate market turmoil going this badly for a prolonged period, as they would lose all credibility of them being fit to govern in the future.
EUR/USD Daily Outlook
Daily Pivots: (S1) 1.0692; (P) 1.0708; (R1) 1.0731; More....
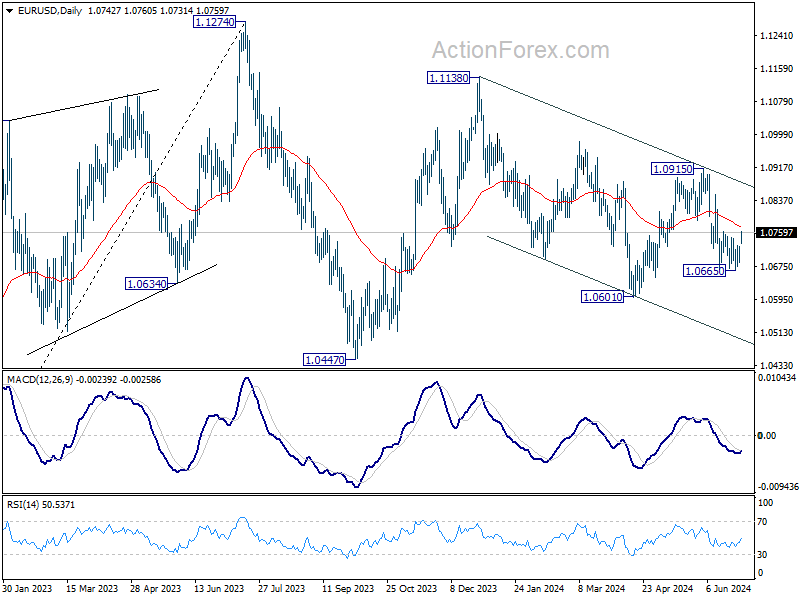
Immediate focus in now on 1.0760 resistance as EUR/USD extends the rebound from 1.0665. Decisive break there will argue that pull back from 1.0915 has completed. Intraday bias will be back on the upside for 55 D EMA (now at 1.0773) and above. Meanwhile, rejection by 1.0760 will maintain near term bearishness for another fall through 1.0665 later.
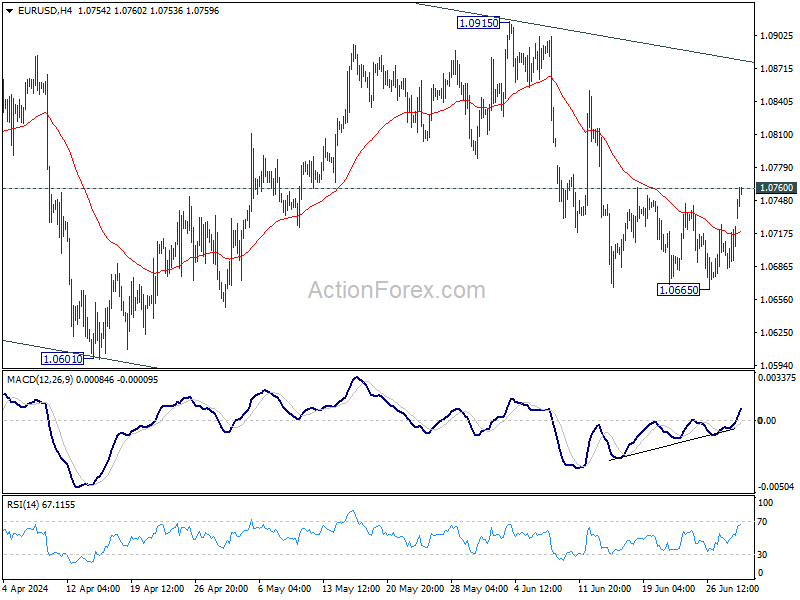
In the bigger picture, price actions from 1.1274 are viewed as a corrective pattern that's still in progress. Break of 1.0601 will target 1.0447 support and possibly below. For now, this will remain the favored case as long as 1.0915 resistance holds, in case of rebound.
Euro Rebounds on French Election Relief; Market Eyes Central Bank Minutes and Key Data
Euro is staging a solid rebound today, with investors feeling somewhat reassured by the preliminary results of French parliamentary elections. While the far-right National Rally made significant gains with approximately 34% of votes in the first round, this is insufficient for an outright majority in the second round scheduled for July 7. The National Rally's aggressive fiscal policy stance has heightened concerns over France's already strained fiscal situation. However, the prospect of a more centrist or balanced government composition is perceived as a positive development for Euro.
The days ahead are critical for French politics, as much depends on how President Emmanuel Macron's Together alliance, which garnered 20-23% of the vote, and the left-wing coalition New Popular Front, with 29% of the vote, will navigate their strategies to prevent the far-right from gaining control. It's important to remember that the initial vote percentages may not accurately predict the final seat distribution in the national assembly, adding another layer of uncertainty.
In the broader currency markets, Kiwi is trailing Euro as the second strongest currency today. Sterling is also showing strength, positioned as the third strongest, as it braces for its general elections on July 4. Conversely, Swiss Franc is the weakest performer due to Euro's rebound, with Yen and Australian Dollar following as the next weakest. Dollar and Canadian Dollar are showing moderate performance, positioned in the middle of the pack. Beyond the political developments, this week promises a slew of significant events, including the release of minutes from RBA, FOMC, and ECB meetings, alongside crucial data such as US non-farm payrolls and Eurozone inflation figures.
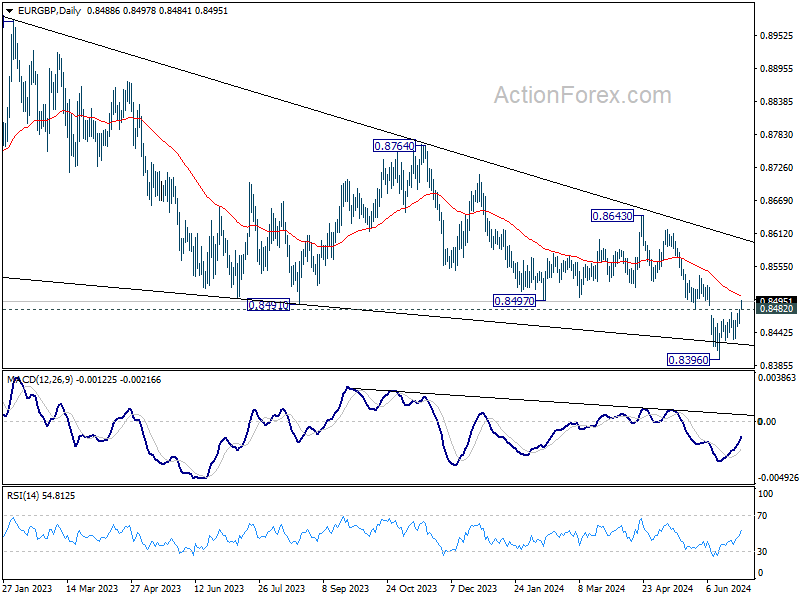
Technically, EUR/GBP's break of 0.8482 support turned resistance suggests that fall from 0.8643 has completed at 0.8396. While it's still early to call for bullish trend reversal, stronger rebound is anticipated in the near term through 55 D EMA (now at 0.8505). Focuses will also be on whether EUR/USD would break through 1.0760 resistance to start a stronger rally, and whether EUR/CHF would follow by breaking through 0.9683 resistance too.
In Asia, at the time of writing, Nikkei is down -0.04%. Hong Kong is on holiday. China Shanghai SSE is up 0.53%. Singapore Strait Times is up 0.08%. Japan 10-year JGB yield is up 0.0203 at 1.069.
Japan's Tankan manufacturing improves but non-manufacturing may have peaked
BoJ's closely watched Tankan survey revealed that while manufacturing sector showed continued improvement, sentiment among non-manufacturers appeared to have peaked, which may complicate BoJ's considerations for another rate hike later this month.
The Tankan survey reported that large manufacturing index rose from 11 to 13, reaching its highest level since March 2022. Large manufacturing outlook also increased from 10 to 14. However, non-manufacturing index dipped slightly from 34 to 33, marking its first decline in 16 quarters, and non-manufacturing outlook remained unchanged at 27.
Long-term corporate inflation expectations edged up, with companies forecasting inflation to hit 2.3% in three years and 2.2% in five years. Despite these rising expectations, the mixed sentiment data do not strongly support another imminent rate hike by BoJ.
In a separate development, an unscheduled revision to historical data indicated that Japan's real GDP contracted at an annualized rate of -2.9% in January-March, a much steeper decline than the previously estimated -1.8% contraction. This significant revision is likely to impact BoJ's upcoming quarterly growth and price forecasts, which are due at the July 30-31 policy meeting.
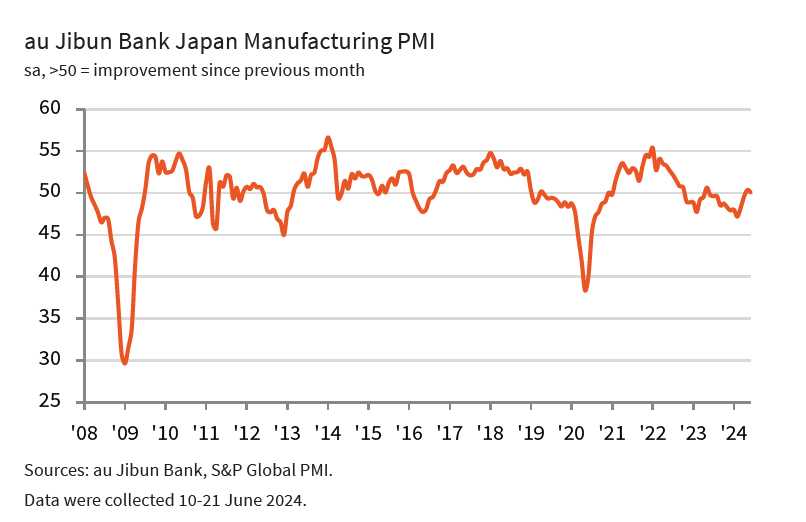
Japan's PMI manufacturing finalized at 50, stagnation amid cost pressures and weak demand
Japan's PMI Manufacturing index for June was finalized at 50.0, slightly down from May's 50.4, indicating a stagnation in the sector. S&P Global highlighted a marginal increase in manufacturing production, but new orders continued to decline, albeit slightly. Employment in the sector expanded, with business confidence reaching a six-month high.
Pollyanna De Lima at S&P Global Market Intelligence stated, "Notably, the latest PMI data revealed the first rise in Japanese factory production for over a year, and a rebound in business confidence."
However, she also pointed out significant challenges, including heightened cost pressures due to Yen depreciation, which increased the price of imported materials. Labor costs also strained budgets.
"There was clear evidence that the sharp rise in overall purchasing prices was not caused by supply-chain issues, as delivery times improved to the greatest extent in over 15 years," she added.
Consequently, manufacturers raised their selling prices at the highest rate in over a year, a move seen as unfavorable given the weak domestic and external demand.
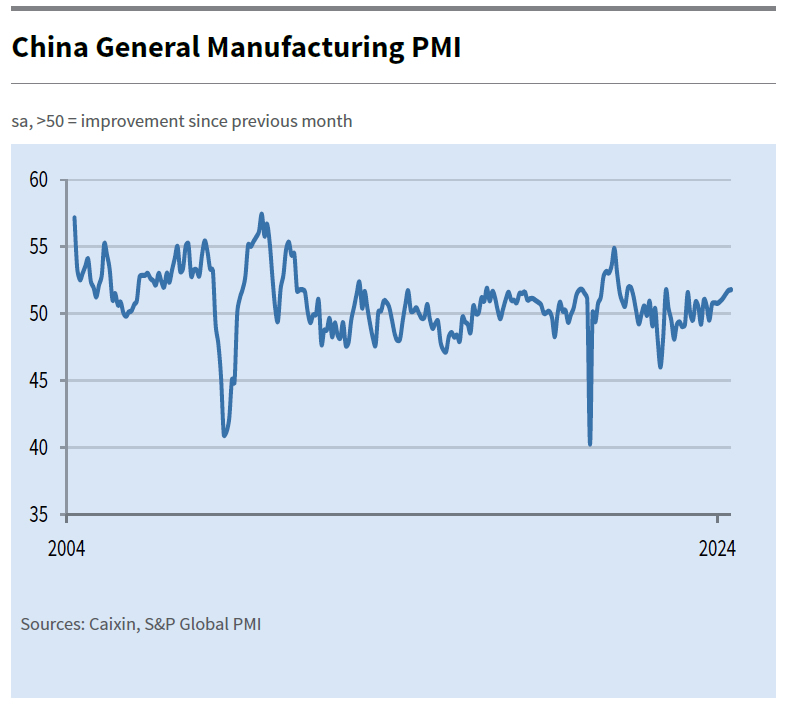
China's Caixin PMI manufacturing rises to 51.8, growth continues but optimism dips
China's Caixin PMI Manufacturing index edged up from 51.7 to 51.8 in June, surpassing expectations of 51.2 and marking its highest level since May 2021. This rise keeps the index in expansionary territory for the eighth consecutive month. Notably, output price inflation reached an eight-month high, reflecting increased activity in the sector.
Wang Zhe, Senior Economist at Caixin Insight Group, noted, "Overall, the manufacturing sector kept improving in June, with supply, domestic demand, and exports continuing to grow." He highlighted that manufacturers increased their purchases, resulting in higher inventory and price levels. Despite this positive trend, optimism among surveyed companies fell significantly, suggesting that market expectations need further strengthening.
Fed, ECB, RBA minutes, Eurozone CPI, and US NFP on the radar
The upcoming week will feature significant minutes from three major central banks and a slew of key economic data. Investors and analysts will be closely monitoring these developments for any signals that might indicate future monetary policy directions.
The minutes from FOMC's June meeting are expected to attract substantial attention. The latest economic projections indicated a notable shift, showing only one expected rate cut this year, compared to three projected in March. This hawkish shift, underscored by 11 members favoring one or no cuts versus 8 members favoring two cuts, will be a primary focus. Additionally, any discussions about the long-term neutral rate, which has been raised, will be closely analyzed for further insights.
Also from the US, ISM indexes and Non-Farm Payroll report will be crucial data points. The manufacturing sector's brief revival seems to have faltered, with ISM manufacturing index staying below 50 since November 2022, except for March this year. Conversely, the services sector has shown resilience, rebounding strongly in May after dipping below 50 in April. While many market participants view September as the tentative month for the first rate cut, Fed might remain cautious about premature easing if the services sector continues to show strength and the job market sustains solid growth with high wage increases.
ECB's meeting accounts will be scrutinized for insights into the rationale behind June's rate cut, the first in the current easing cycle. The Governing Council's perspectives, especially those of Chief Economist Philip Lane, on the future path of policy easing will be critical. Additionally, Eurozone CPI flash report will provide crucial information for markets to adjust their expectations. Currently, it is likely that ECB will cut rates once or twice more this year, with the next one in September, but this outlook is not set in stone.
Minutes from RBA's June meeting will also be significant. Governor Michele Bullock has indicated that a rate cut was not even discussed at the meeting. The minutes might reveal how concerned the board is about upside inflation risks, which somewhat materialized in May's CPI data already. Any hints on what level of upside surprises in Q2 CPI data, due on July 31, might prompt an August rate hike will be closely watched by investors.
Other key economic data to watch include Japan's Tankan survey, China's Caixin PMIs, and Canada's employment figures.
Here are some highlights for the week:
- Monday: Japan Tankan survey, PMI manufacturing final, consumer confidence; China Caixin PMI manufacturing; Germany PMI flash; Swiss retail sales, PMI manufacturing; Eurozone PMI manufacturing final; UK PMI manufacturing final, M4 money supply, mortgage approvals; US PMI manufacturing final, ISM manufacturing, construction spending.
- Tuesday: New Zealand building permits; Japan monetary base; Australia RBA minutes; Eurozone CPI flash, unemployment rate; Canada PMI manufacturing.
- Wednesday: Australia retail sales, building approvals, China Caixin PMI services; Eurozone PMI services final, PPI; UK PMI services final; Canada trade balance; US ADP employment, trade balance, ISM services, factory orders, FOMC minutes.
- Thursday: Australia trade balance; Swiss unemployment rate, CPI; Germany factory orders; UK PMI construction; ECB meeting accounts.
- Friday: Japan household spending, leading indicators; Germany industrial production; France industrial production; trade balance; Swiss foreign currency reserves; Eurozone retail sales; Canada employment, Ivey PMI; US non-farm payrolls.
EUR/USD Daily Outlook
Daily Pivots: (S1) 1.0692; (P) 1.0708; (R1) 1.0731; More....
Immediate focus in now on 1.0760 resistance as EUR/USD extends the rebound from 1.0665. Decisive break there will argue that pull back from 1.0915 has completed. Intraday bias will be back on the upside for 55 D EMA (now at 1.0773) and above. Meanwhile, rejection by 1.0760 will maintain near term bearishness for another fall through 1.0665 later.
In the bigger picture, price actions from 1.1274 are viewed as a corrective pattern that's still in progress. Break of 1.0601 will target 1.0447 support and possibly below . For now, this will remain the favored case as long as 1.0915 resistance holds, in case of rebound.
Economic Indicators Update
| GMT | Ccy | Events | Actual | Forecast | Previous | Revised |
|---|---|---|---|---|---|---|
| 23:50 | JPY | Tankan Large Manufacturing Index Q2 | 13 | 11 | 11 | |
| 23:50 | JPY | Tankan Large Manufacturing Outlook Q2 | 14 | 10 | ||
| 23:50 | JPY | Tankan Non - Manufacturing Index Q2 | 33 | 33 | 34 | |
| 23:50 | JPY | Tankan Non - Manufacturing Outlook Q2 | 27 | 27 | ||
| 23:50 | JPY | Tankan Large All Industry Capex Q2 | 11.10% | 4% | ||
| 00:30 | JPY | Manufacturing PMI Jun F | 50 | 50.1 | 50.1 | |
| 01:45 | CNY | Caixin Manufacturing PMI Jun | 51.8 | 51.2 | 51.7 | |
| 05:00 | JPY | Consumer Confidence Jun | 36.4 | 36.5 | 36.2 | |
| 06:30 | CHF | Real Retail Sales Y/Y May | 2.50% | 2.70% | ||
| 07:30 | CHF | Manufacturing PMI Jun | 44.9 | 46.4 | ||
| 07:45 | EUR | Italy Manufacturing PMI Jun | 44.5 | 45.6 | ||
| 07:50 | EUR | France Manufacturing PMI Jun F | 45.3 | 45.3 | ||
| 07:55 | EUR | Germany Manufacturing PMI Jun F | 43.4 | 43.4 | ||
| 08:30 | GBP | Manufacturing PMI Jun F | 51.4 | 51.4 | ||
| 08:30 | GBP | M4 Money Supply M/M May | 0.20% | 0.10% | ||
| 08:30 | GBP | Mortgage Approvals May | 61K | 61K | ||
| 12:00 | EUR | Germany CPI M/M Jun P | 0.20% | 0.10% | ||
| 12:00 | EUR | Germany CPI Y/Y Jun P | 2.40% | |||
| 13:45 | USD | Manufacturing PMI Jun F | 51.7 | 51.7 | ||
| 14:00 | USD | ISM Manufacturing PMI Jun | 49.3 | 48.7 | ||
| 14:00 | USD | ISM Manufacturing Prices Paid Jun | 55.9 | 57 | ||
| 14:00 | USD | ISM Manufacturing Employment Index Jun | 51.1 | |||
| 14:00 | USD | Construction Spending M/M May | 0.30% | -0.10% |
China’s Caixin PMI manufacturing rises to 51.8, growth continues but optimism dips
China's Caixin PMI Manufacturing index edged up from 51.7 to 51.8 in June, surpassing expectations of 51.2 and marking its highest level since May 2021. This rise keeps the index in expansionary territory for the eighth consecutive month. Notably, output price inflation reached an eight-month high, reflecting increased activity in the sector.
Wang Zhe, Senior Economist at Caixin Insight Group, noted, "Overall, the manufacturing sector kept improving in June, with supply, domestic demand, and exports continuing to grow." He highlighted that manufacturers increased their purchases, resulting in higher inventory and price levels. Despite this positive trend, optimism among surveyed companies fell significantly, suggesting that market expectations need further strengthening.
Japan’s PMI manufacturing finalized at 50, stagnation amid cost pressures and weak demand
Japan's PMI Manufacturing index for June was finalized at 50.0, slightly down from May's 50.4, indicating a stagnation in the sector. S&P Global highlighted a marginal increase in manufacturing production, but new orders continued to decline, albeit slightly. Employment in the sector expanded, with business confidence reaching a six-month high.
Pollyanna De Lima at S&P Global Market Intelligence stated, "Notably, the latest PMI data revealed the first rise in Japanese factory production for over a year, and a rebound in business confidence."
However, she also pointed out significant challenges, including heightened cost pressures due to Yen depreciation, which increased the price of imported materials. Labor costs also strained budgets.
"There was clear evidence that the sharp rise in overall purchasing prices was not caused by supply-chain issues, as delivery times improved to the greatest extent in over 15 years," she added.
Consequently, manufacturers raised their selling prices at the highest rate in over a year, a move seen as unfavorable given the weak domestic and external demand.
Japan’s Tankan manufacturing improves but non-manufacturing may have peaked
BoJ's closely watched Tankan survey revealed that while manufacturing sector showed continued improvement, sentiment among non-manufacturers appeared to have peaked, which may complicate BoJ's considerations for another rate hike later this month.
The Tankan survey reported that large manufacturing index rose from 11 to 13, reaching its highest level since March 2022. Large manufacturing outlook also increased from 10 to 14. However, non-manufacturing index dipped slightly from 34 to 33, marking its first decline in 16 quarters, and non-manufacturing outlook remained unchanged at 27.
Long-term corporate inflation expectations edged up, with companies forecasting inflation to hit 2.3% in three years and 2.2% in five years. Despite these rising expectations, the mixed sentiment data do not strongly support another imminent rate hike by BoJ.
In a separate development, an unscheduled revision to historical data indicated that Japan's real GDP contracted at an annualized rate of -2.9% in January-March, a much steeper decline than the previously estimated -1.8% contraction. This significant revision is likely to impact BoJ's upcoming quarterly growth and price forecasts, which are due at the July 30-31 policy meeting.
EUR/USD Recovery Runs Into Resistance, Can It Continue Higher?
Key Highlights
- EUR/USD started a recovery wave above the 1.0710 resistance.
- It cleared a major bearish trend line with resistance at 1.0725 on the 4-hour chart.
- GBP/USD is facing resistance near the 1.2680 zone.
- The US ISM Manufacturing Index could remain below 50.0 at 49.0 in June 2024.
EUR/USD Technical Analysis
The Euro started a decent recovery wave from the 1.0665 zone against the US Dollar. EUR/USD cleared the 1.0710 resistance to move into a short-term positive zone.
Looking at the 4-hour chart, the pair cleared a major bearish trend line with resistance at 1.0725. There was a move above the 38.2% Fib retracement level of the downward move from the 1.0852 swing high to the 1.0666 low.
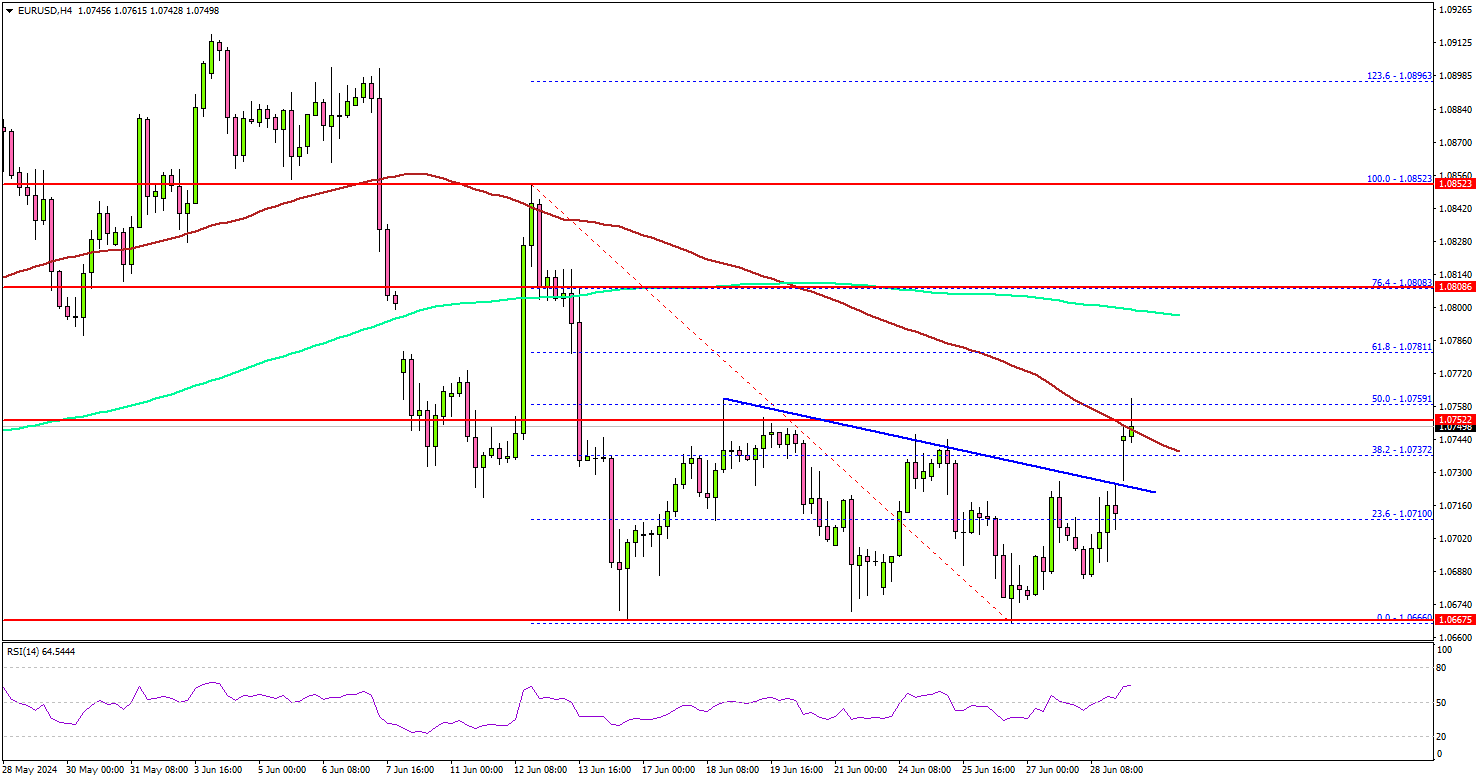
However, the pair is now facing resistance near the 1.0760 zone and the 100 simple moving average (red, 4-hour). The 50% Fib retracement level of the downward move from the 1.0852 swing high to the 1.0666 low is also acting as a resistance.
The next resistance sits at 1.0800 and the 200 simple moving average (green, 4-hour). A clear move above the 1.0800 resistance might send it toward the 1.0850 level.
Any more gains might open the doors for a test of the 1.0920 zone in the coming days. Immediate support is near the 1.0730 level. The next major support is near the 1.0700 level. A downside break and close below the 1.0700 support zone could open the doors for a larger decline. In the stated case, the pair could decline toward the 1.0665 level.
Looking at GBP/USD, the pair remained stable above the 1.2600 support zone but faces many hurdles near the 1.2680 zone.
Economic Releases
- Euro Zone Manufacturing PMI for June 2024 – Forecast 45.6, versus 45.6 previous.
- UK Manufacturing PMI for June 2024 – Forecast 51.4, versus 51.4 previous.
- US ISM Manufacturing Index for June 2024 – Forecast 49.0, versus 48.7 previous.
Yen Hits Multi-Decade Lows, Euro Bounces Back, Dollar Remains Indecisive
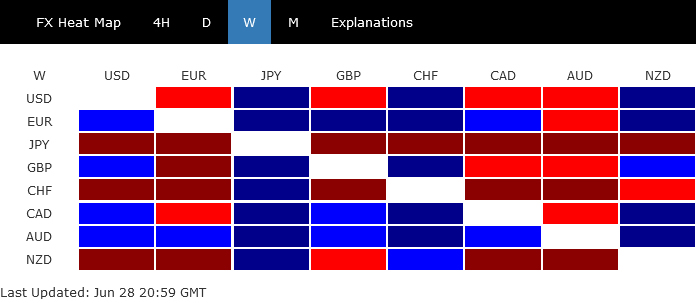
Yen remained in the spotlight last week, dominating headlines even as some significant global inflation data also moved markets. The Japanese currency continued its downtrend, reaching multi-decade lows. Despite the prolonged decline, Japanese authorities refrained from intervening directly in the markets. However, the looming threat of intervention kept traders cautious, resulting in a more controlled descent. Nevertheless, Yen ended the week as the worst-performing currency.
In contrast, Australian dollar emerged as the strongest performer, buoyed by increased speculations of another RBA rate hike following robust inflation data. Canadian dollar also showed strength, securing the third spot due to strong inflation figures that diminished the likelihood of an imminent rate cut by BoC. Euro, which had been impacted by political uncertainties in France, recovered and became the second strongest currency of the week. Despite this recovery, Euro remains the second weakest currency for the month, just ahead of Yen.
Swiss franc was the second weakest performer of the week. Global inflation data suggested that the monetary easing cycle would continue at a slow pace, keeping rate gap with SNB wide. New Zealand Dollar also struggled, ending as the third worst performer, partly due to additional pressure from its decline against Aussie.
Dollar and the British Pound finished in middle positions. While the greenback fell against Euro, Sterling, Loonie and Aussie, it remained within the previous week's range. Market participants have become cautious ahead of the upcoming election risks in France and the plethora of US economic data, including non-farm payrolls report, scheduled for the coming week. Similarly, the Pound has not found a clear direction, with UK's upcoming elections adding to the uncertainty.
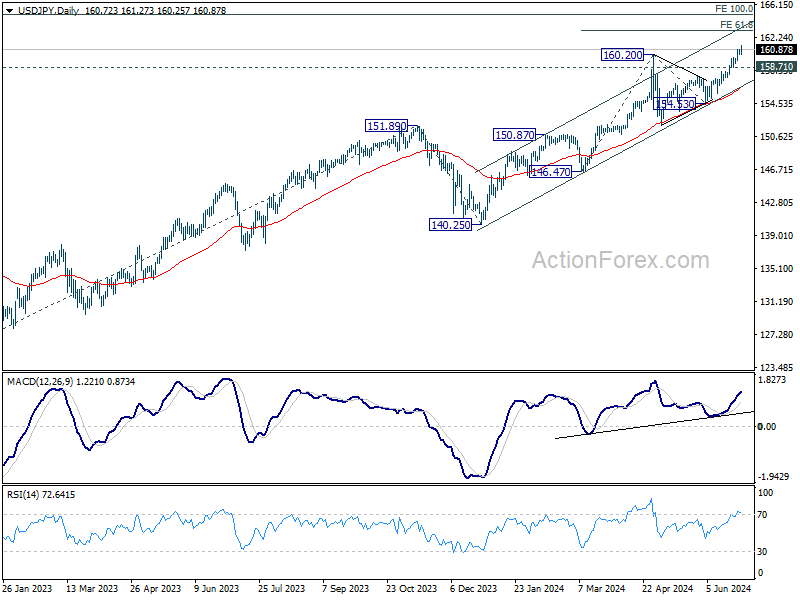
Yen Hits 38-Year Low Against Dollar, Japan Appoints New Currency Head
Japanese Yen continued to dominate headlines last week, plummeting to a 38-year low against Dollar and closing below the critical 160 threshold. This significant drop has heightened concerns and led Japanese authorities to ramp up verbal interventions. Finance Minister Shunichi Suzuki expressed his "high sense of urgency" in monitoring Yen's movements, using language similar to that employed before the April intervention. Despite these strong words, no concrete action has been taken by Japan to halt Yen's decline.
In a related development, Japan has appointed Atsushi Mimura as the new top currency diplomat, replacing Masato Kanda at the end of July. Currently serving as the director-general of the Ministry of Finance's international bureau, Mimura's approach to achieving a stable currency that reflects economic fundamentals is largely unknown. His forthcoming statements and actions will be crucial and closely watched by market participants.
US/JPY's break of 160.20 resistance last week confirmed long term up trend resumption. While some consolidations might be seen, outlook will stay bullish as long as 158.71 support holds. Next target is 61.8% projection of 146.47 to 160.20 from 154.53 at 163.01. However, the pressing question remains: will Japan step in now, or allow USD/JPY to climb further to 165 before intervening?
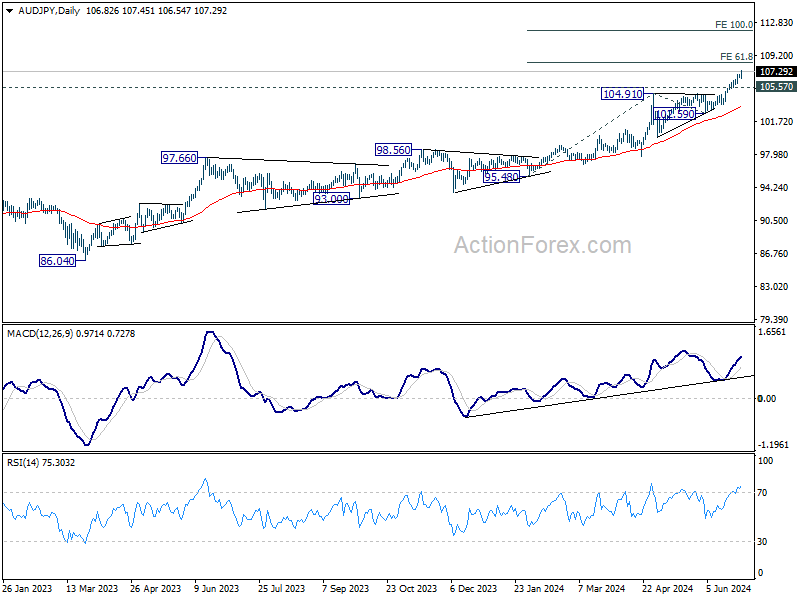
Yen Also Slides Significantly Against Aussie and Loonie
Talking about Yen, its declines against both Aussie and Loonie were also significantly. In particular, 's 1.12% gain was partly driven by stronger-than-expected May monthly CPI data from Australia, indicating surprised reacceleration in inflation.
RBA Deputy Governor Andrew Hauser attempted to downplay the impact of a single data point, and emphasized the importance of upcoming data before RBA's next meeting in August. The robust inflation figures have fueled speculations about a potential rate hike at the meeting. For now, most economists still anticipate the next move will be a rate cut, albeit at a later date, but the risks have certainly increased. While opinions may differ, all would agree that Q2 inflation report, due on July 31, will be crucial in shaping RBA's decision.
AUD/JPY's outlook will stay bullish as long as 105.57 support holds, even in case of retreat. Next target is 61.8% projection of 95.48 to 104.91 from 102.59 at 108.41. Decisive break there could prompt upside acceleration to 100% projection at 112.02.
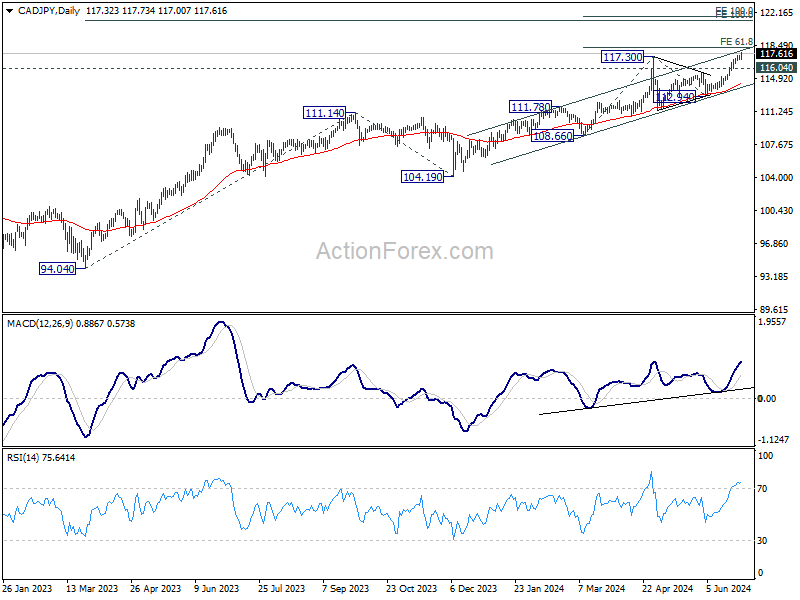
Similarly, Yen fell to its lowest level against the Canadian dollar in more than 15 years. The unexpected acceleration in Canadian inflation for May led traders to reduce bets on another rate cut by BoC in July. However, with another CPI report due on July 16 before the BoC meeting on July 24, nothing is set in stone.
For now, CAD/JPY's near term outlook will stay bullish as long as 116.04 support holds. Next target is 61.8% projection of 108.66 to 117.30 from 112.94 at 118.27. Decisive break there could prompt upside acceleration to 100% projection at 121.58.
Euro Withstands Pressure Despite Uncertainties in French Elections
Euro demonstrated unexpected resilience last week despite significant political uncertainties in France ahead of the upcoming snap elections. Investors' concerns were evident as French debt risk premium surged, with the spread between French and German borrowing costs reaching its highest level since 2012. Both French and German bonds were heavily sold off, leading to the German 10-year yield surpassing 2.5% and the French 10-year yield climbing above 3.25%. CAC 40 also experienced renewed selling pressure on Friday, although DAX remained relatively stable.
The far-right National Rally has extended its lead in the polls, followed by the left-wing alliance in second place. President Emmanuel Macron's centrist party appears headed for a significant defeat, potentially leading to either a National Rally-led government or a hung parliament, which could result in political paralysis. Investors are particularly concerned about the potential radicalization of economic policy from both the right and left, fearing unrealistic economic programs.
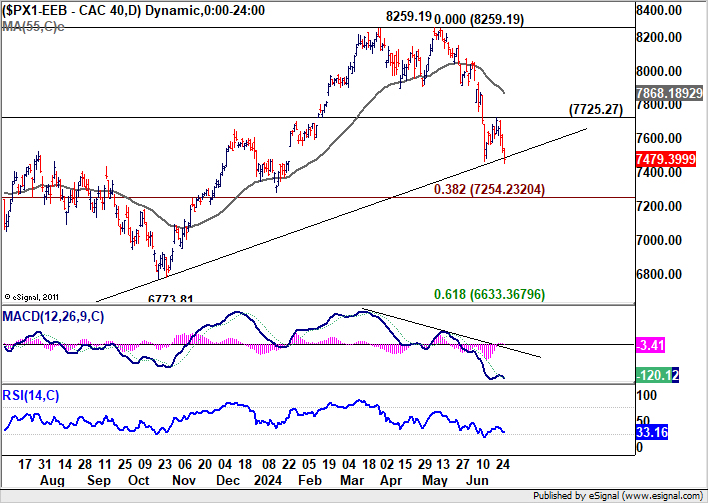
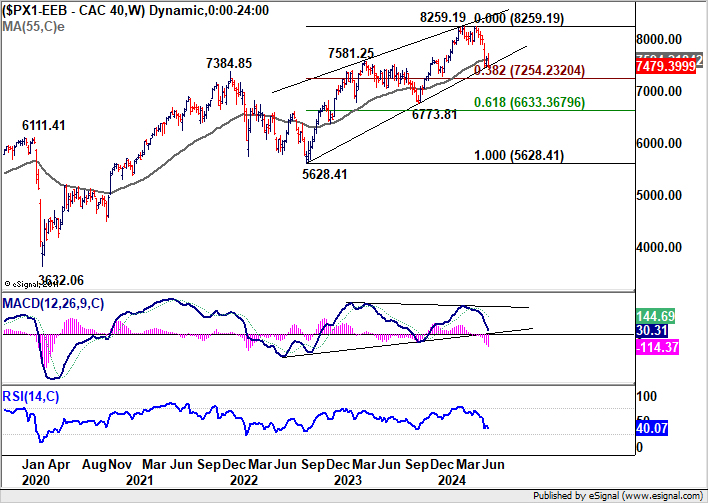
From a technical perspective, CAC 40 is now back at a crucial support zone after a brief recovery over the past two weeks. The zone include 55 W EMA (now at 7859.20), trend line support at around 7490, 38.2 retracement of 5638.42 to 8259.19 at 7254.23. Decisive break of this support zone will argue that CAC is probably already in a medium term down trend that could extend beyond 6773.81 support. Nevertheless, strong bounce from current level, followed by break of 7725.27 resistance will confirm short term bottoming, and bring stronger rebound to 55 EMA (now at 7868.18) before deciding what's next.
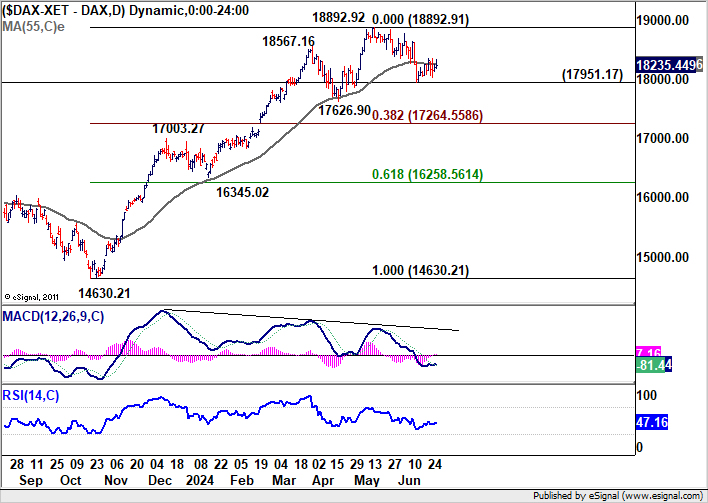
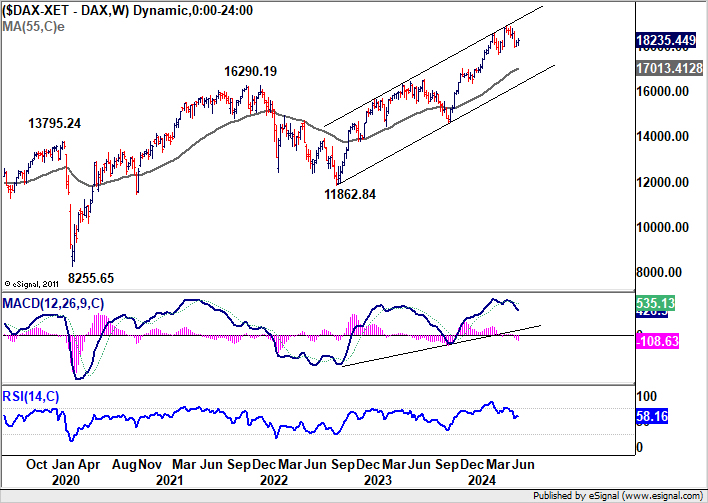
DAX has been resilient so far but the price actions from 17951.17 look like a near term consolidation pattern at best. Break of 17951.17 support will resume the fall from 18892.92. Even just as a correction to the rise from 14630.21, DAX would decline to 38.2% retracement of 14630.21 to 18892.91 at 17264.55, or even further to 55 W EMA (now at 17013.41).
As for EUR/USD, it extended the sideway consolidations from 1.0667 last week. Outlook will stay bearish as long as 1.0760 resistance holds. Break of 1.0667 will resume the fall from 1.0915, as the third leg of the decline from 1.1138, through 1.0601 support.

Dollar Index's Rebound Continues With Indecisive Momentum
While Dollar showed strength against the yen and some resilience against the Swiss franc, is was largely indecisive against other currencies. May's PCE inflation data, a key gauge for Fed, indicated continued progress in disinflation, which should be welcomed by Fed policymakers. Yet, the path to the first rate cut remains fraught with uncertainties. Traders are also beginning to look beyond September, the likely timing for the first cut, considering the path of rate adjustments into the next year.
Despite the encouraging disinflation data, the broader economic state suggests that substantial progress in reducing inflation and cooling the job market will be necessary for Fed to embark on a sustained path of rate cuts. The possibility of a first rate cut in September is becoming more realistic, but Fed will likely proceed with caution. Unless there is a significant broadening of disinflationary trends and a noticeable cooling in the labor market, the pace of monetary easing is expected to be gradual at best.
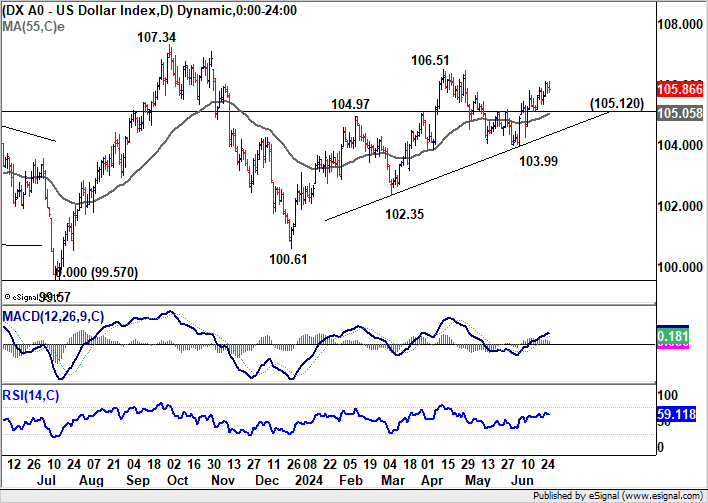
Dollar Index's rebound from 103.99 continued throughout the week, though the momentum appeared rather unconvincing. This lack of conviction was primarily due to EUR/USD's failure to break downward from its near term range. For now, outlook will stay bullish as long as 105.12 support holds. Rise from 100.61 should still be in progress through 106.51, and possibly 107.34 resistance too. But break of 105.12 will raise the chance that Dollar index's rebound is over and it's heading back to 103.99 support and below.
GBP/USD Weekly Outlook
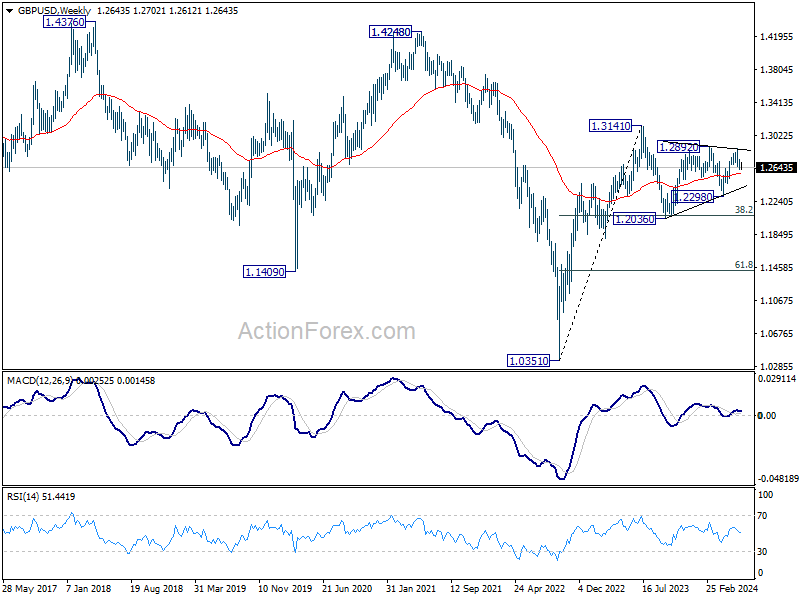
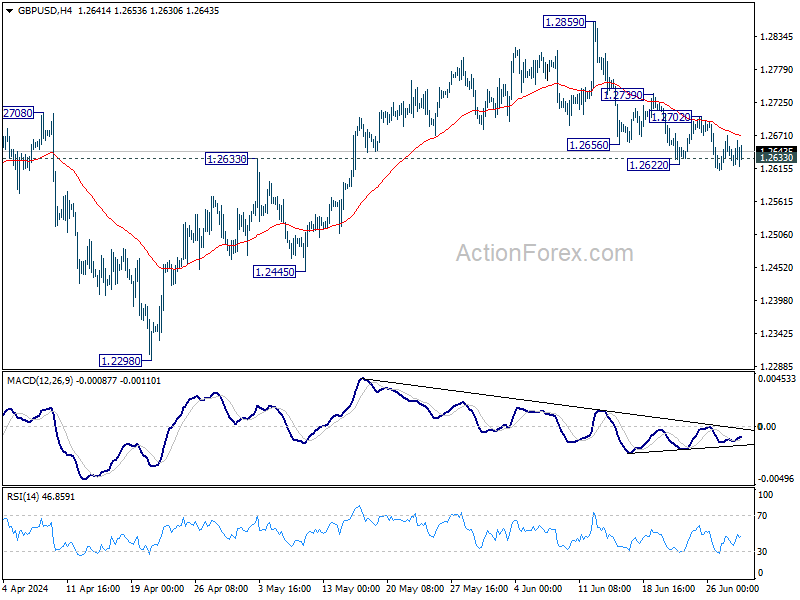
GBP/USD's fall from 1.2859 tied to continued last week but failed to sustain below 1.2633 resistance turned support. Still, further decline is expected as long as 1.2702 resistance holds. Sustained trading below 1.2633 resistance turned support will argue that whole rise from 1.2298 has completed, and target 1.2445 and below. On the upside, however, firm break of 1.2702 resistance will argue that pull back from 1.2859 has completed, and bring retest of this high instead.
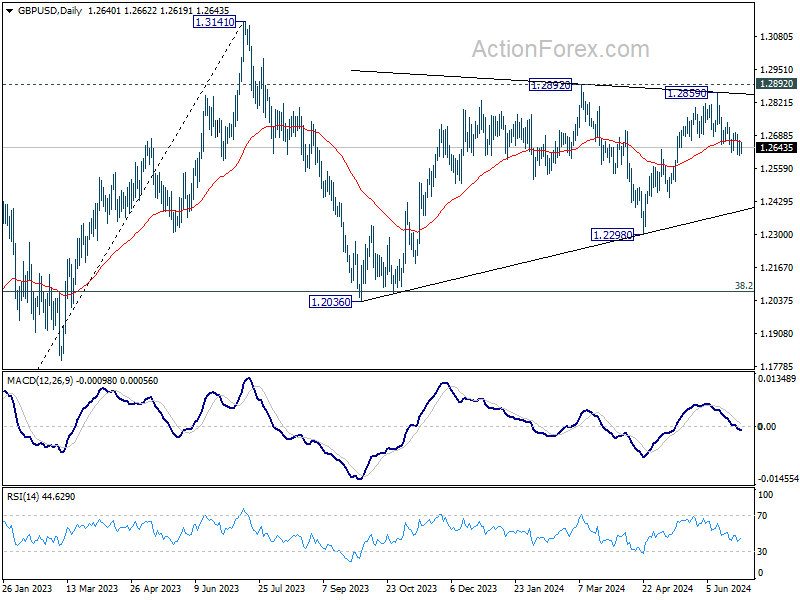
In the bigger picture, price actions from 1.3141 medium term top are seen as a corrective pattern that is still in progress. Break of 1.2445 support will confirm that another falling leg has started and target 1.2036 cluster support again (38.2% retracement of 1.0351 (2022 low) to 1.3141 at 1.2075. Nevertheless, break of 1.2892 resistance will argue that larger up trend from 1.0351is ready to resume through 1.3141.
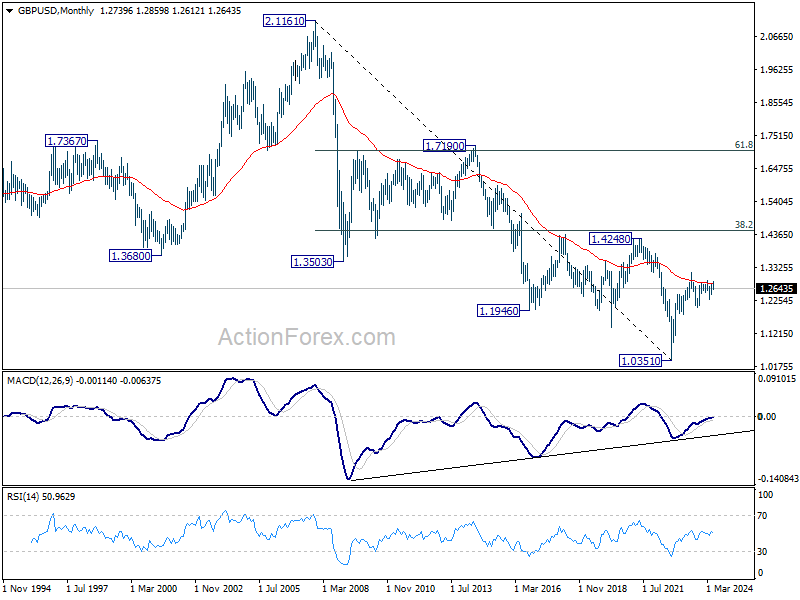
In the long term picture, a long term bottom should be in place at 1.0351 on bullish convergence condition in M MACD. But momentum of the rebound from 1.3051 argues GBP/USD is merely in consolidation, rather than trend reversal. Range trading is likely between 1.0351/4248 for some more time.