Sample Category Title
Euro Rises Despite France’s Vote for the Right
The euro has started the week with strong gains. EUR/USD is trading at 1.0756 in the European session, up 0.41% on the day at the time of writing. The euro is at its highest level since June 14.
Macron takes a drubbing in round one
France went to the polls on Sunday, with voter turnout at a four-decade high. The vote was a stinging rebuke for French President Emmanuel Macron, whose Ensemble alliance came in a distant third in the three-way race. The big winner was the far-right, as Marie Le Pen’s National Rally (RN) party won 33% of the vote and will likely be the largest party in the next parliament.
If the RN doesn’t win a majority, that could set the stage for a hung parliament and political uncertainty, which would not bode well for the French financial markets and the euro. Interestingly, the French markets and the euro are in positive territory on Monday, as investors appear relieved that the RN might miss out on a majority in parliament. The relief on investors’ faces today could be quickly erased, however, if the NR has a strong showing in the second round of voting, which takes place on July 7.
Market focus will shift from France and focus on German inflation, which will be released later today. German CPI is expected to dip to 2.3% y/y in June, compared to 2.4% in May. Monthly, the market estimate stands at 0.2%, following 0.1% gain in May. Eurozone inflation follows on Tuesday with an estimate of 2.8% y/y in June, compared to 2.9% a month earlier.
EUR/USD Technical
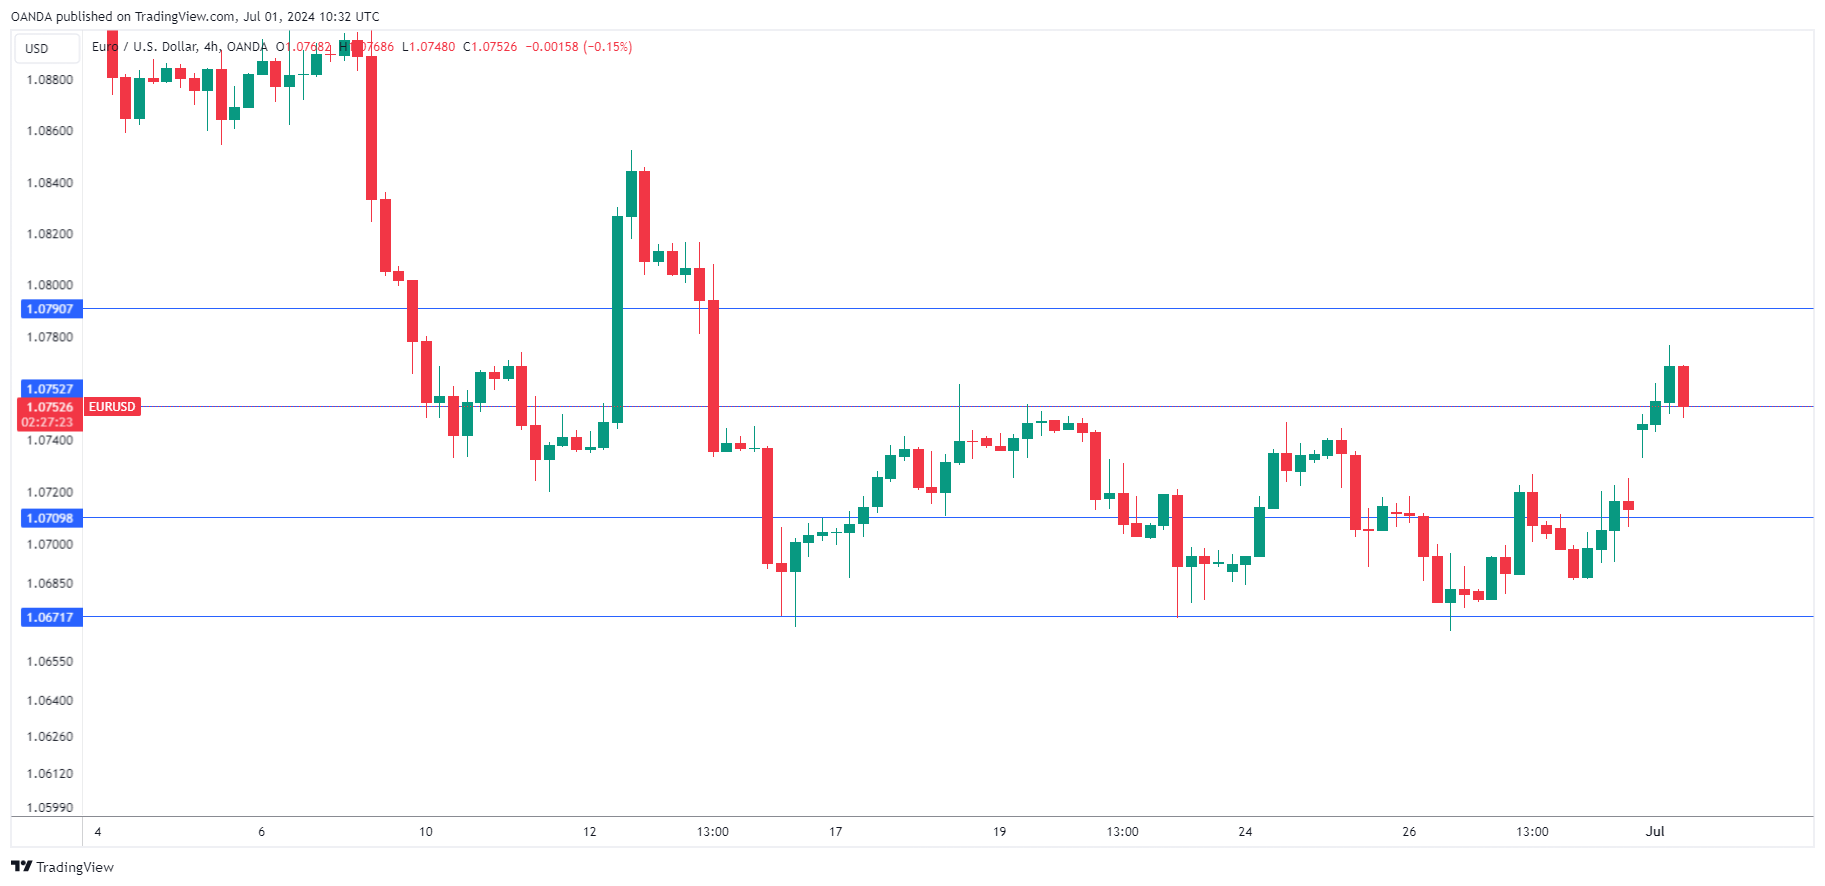
- EUR/USD is testing resistance at 1.0752. Above, there is resistance at 1.0790
- 1.0709 and 1.0671 are the next support lines
Bitcoin Pushes up from Retracement Support
Market picture
The crypto market has been enjoying an influx of buyers since Saturday, with a visible acceleration on Monday. Over the past 24 hours, capitalisation has risen 3.6% to $2.33 trillion. Last week’s drop in the crypto sentiment index to 30 (fear zone) reversed the price twice, showing that the market is dominated by a ‘buy the dip’ pattern.
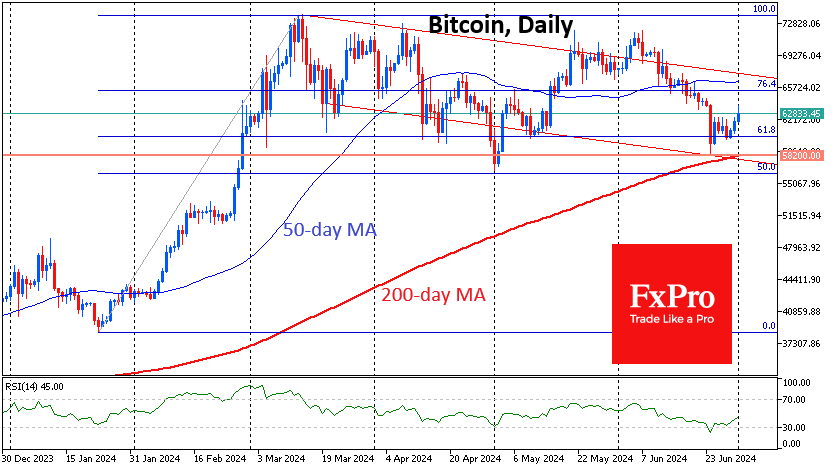
Bitcoin is trading near $63.3K, adding 5% since Saturday morning and reaffirming the importance of the 61.8% retracement of the Jan-March rally. From another perspective, Bitcoin is adding and bouncing off the lower boundary of the downward channel. Likely, the price is now moving towards the upper boundary at $67K. However, cautious buyers may prefer to wait for confirmation with the price rising above $72-73K – the pivot area of the last four months – which would be confirmation of the start of a new impulsive wave of growth.
Bitcoin ended June down 8.5% to $61.9K. In terms of seasonality, July is considered quite successful for BTC, adding eight times (22.3% on average) out of the last 13 and declining on five occasions (-7.8% on average).
News background
Ethereum-ETFs will not begin trading in early July. The SEC has returned Forms S-1 to potential issuers of spot ETH-ETFs for corrections. The regulator expects corrected filings to be returned by 8th July.
CryptoQuant recorded an easing of Bitcoin miner sales pressure. The end of these sales could set the stage for a resumption of the rally, and this could happen in Q3.
According to Santiment, the level of bullish sentiment on social media has significantly decreased, and traders have lost confidence in the markets. This can be seen as one factor in Bitcoin reaching a possible bottom.
The SEC sued ConsenSys, the developer of the MetaMask wallet. According to the agency, the firm violated the law by selling unregistered securities through the MetaMask Staking service.
VanEck Investment Company filed a form with the SEC to register a spot ETF based on the Solana cryptocurrency (SOL). Swiss company 21Shares also filed the same application with the SEC a little later. According to Bloomberg, the chances of approval of SOL-ETF after the pre-election debates in the U.S. have increased. The new president and the change of the head of the SEC may change the situation.
EUR/USD Rate Rises After First Round of Voting in France
According to Reuters, exit polls show that Marine Le Pen's far-right party, the National Rally (RN), won the first round of parliamentary elections in France on Sunday.
The financial market reacted to this with a rise in the euro's exchange rate against other currencies.
Specifically, the EUR/USD rate jumped to its highest level since June 13.
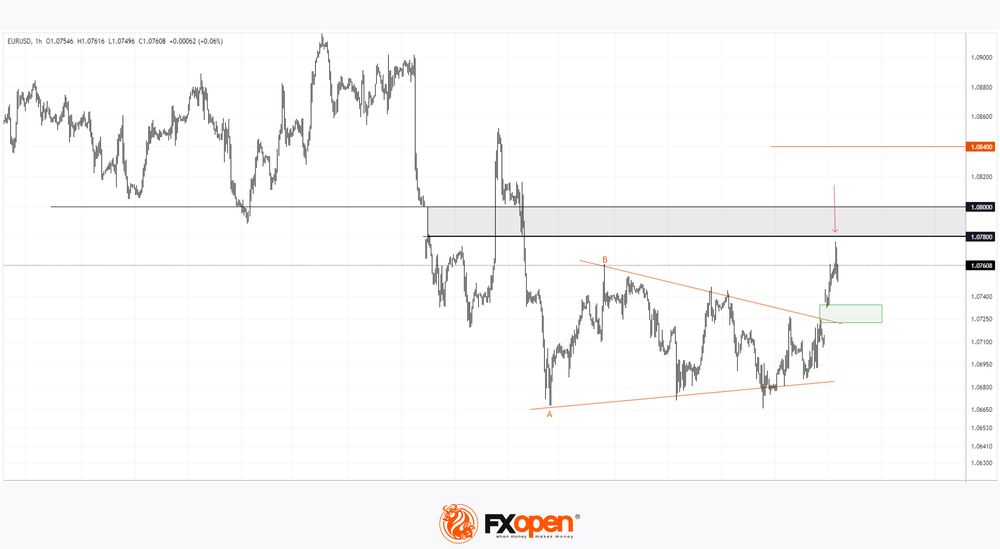
The EUR/USD chart shows that:
→ At the end of June, the price formed a consolidation pattern (shown as an orange triangle);
→ But today's bullish gap (shown in green) broke through it.
According to the principles of technical analysis, if the height of the consolidation pattern is measured through the A-B extremes, the rise could reach the level of 1.08400 (the height of the pattern, projected from the breakout level).
However, for this to happen, bulls need to overcome the resistance zone of 1.080-1.078.
Note that at the Monday morning high, the EUR/USD price sharply reversed downwards (indicated by an arrow). This indicates the activity of supply forces, so traders should not rule out a scenario where the price retraces to the breakout level, into the zone of the bullish gap.
Trade over 50 forex markets 24 hours a day with FXOpen. Take advantage of low commissions, deep liquidity, and spreads from 0.0 pips. Open your FXOpen account now or learn more about trading forex with FXOpen.
This article represents the opinion of the Companies operating under the FXOpen brand only. It is not to be construed as an offer, solicitation, or recommendation with respect to products and services provided by the Companies operating under the FXOpen brand, nor is it to be considered financial advice.
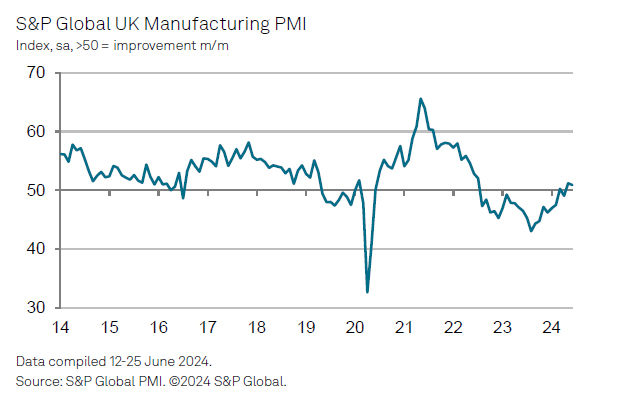
UK’s PMI manufacturing finalized at 50.9, renewed cost pressures despite growth
UK's PMI Manufacturing was finalized at 50.9 in June, slightly down from May's 22-month high of 51.2. This marks a continued period of growth for the sector, but with some emerging concerns.
Rob Dobson, Director at S&P Global Market Intelligence, commented, "The UK manufacturing sector is enjoying its strongest spell of growth for over two years". Performance of the domestic market remains a "real positive." However, he noted the persistent challenges in export markets, with manufacturers struggling to secure new business in the US, China, and mainland Europe.
Despite the overall optimism for future growth, manufacturers are focusing heavily on cost minimization and cash flow protection. This cautious approach has resulted in further job losses, cuts to non-essential spending, and leaner stock holdings. The renewed cost inflation pressure is also a significant concern, with input prices rising at the fastest pace since early 2023.
This surge in manufacturing costs will likely heighten worries among hawkish policymakers at BoE regarding the persistence of underlying inflationary pressures.
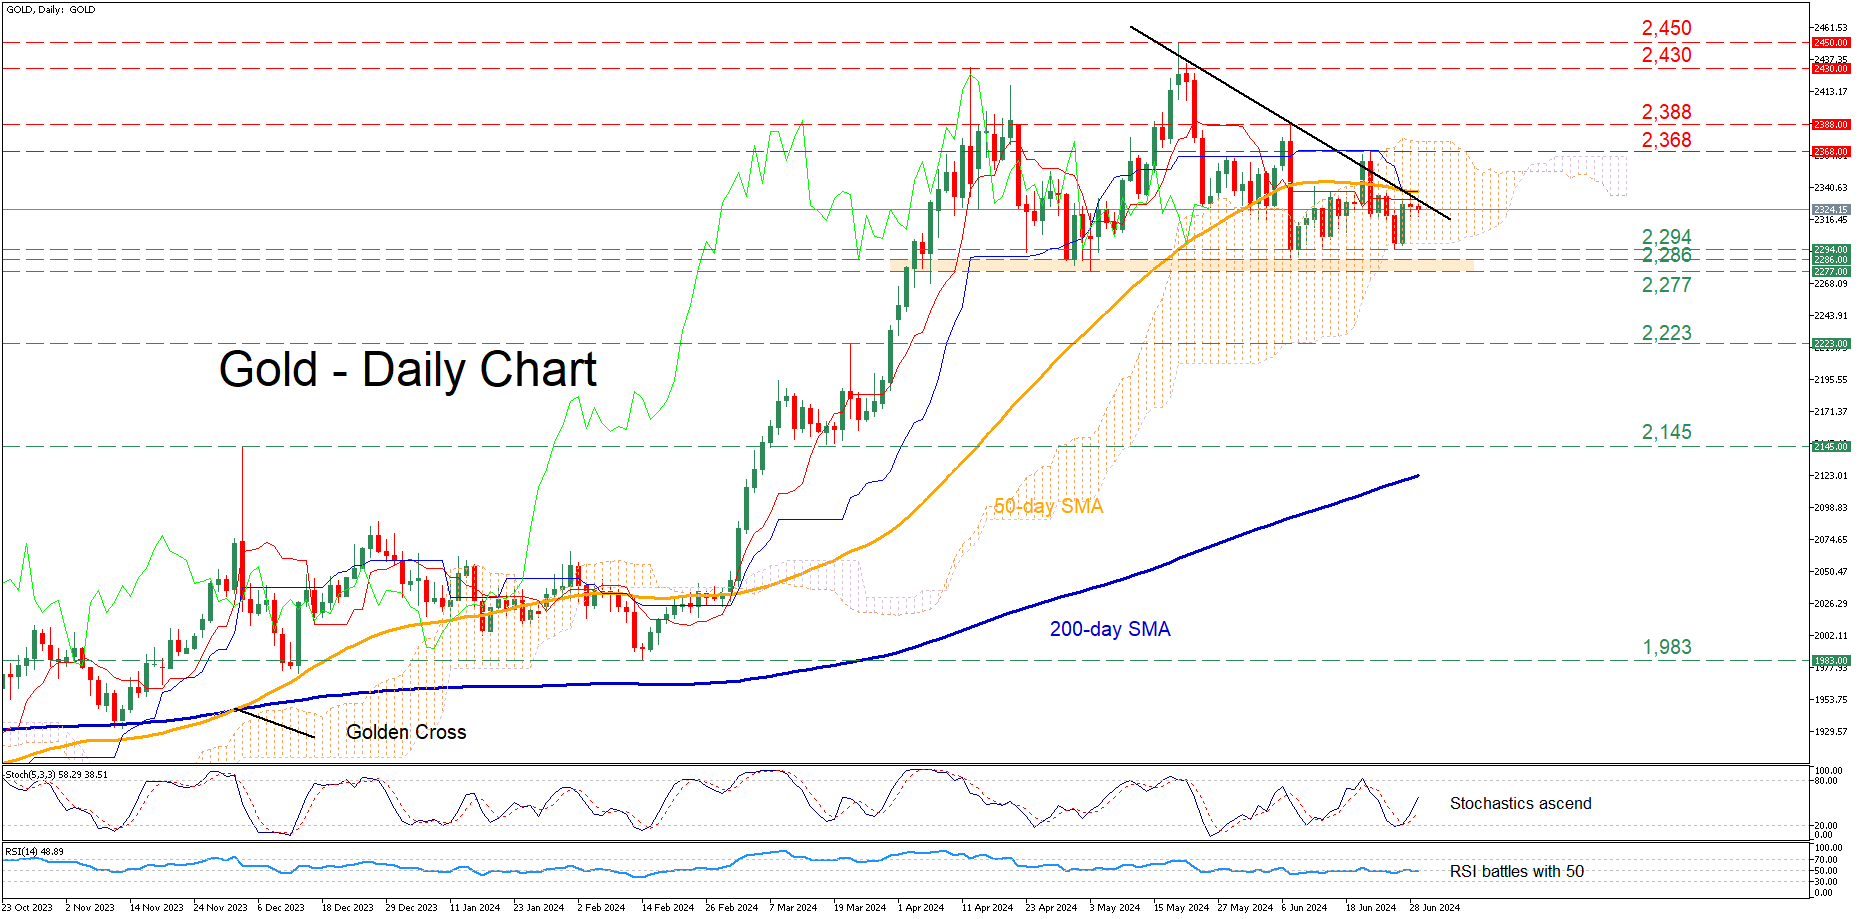
Gold Battles with Descending Trendline
- Gold trades back and forth in the past few sessions
- Price fails to claim 50-day SMA and restrictive trendline
- Momentum indicators are neutral-to-bullish
Gold has been under pressure lately following its break below the 50-day simple moving average (SMA). Although the price managed to find its feet at the lower end of the Ichimoku cloud, it has failed to jump back above the downward sloping trendline drawn from the all-time high of 2,450.
Should the latest weakness persist, the price could test the recent support of 2,294. Further declines could then stall at the 2,286-2,777 range, defined by the May and June lows. Even lower, bullion might face the March resistance of 2,223, which could serve as support in the future.
On the flipside, if the price rotates back above the 50-day SMA, the latest rejection region of 2,368 could prove to be the first barricade for the bulls to overcome. Higher, the June peak of 2,388 may prevent further upside attempts. Failing to halt there, the price may revisit the April high of 2,430.
In brief, gold dipped below its 50-day SMA, extending its structure of lower highs. Therefore, a solid move above the restrictive trendline drawn by connecting these lower highs is needed for the price to escape its short-term bearish pattern.
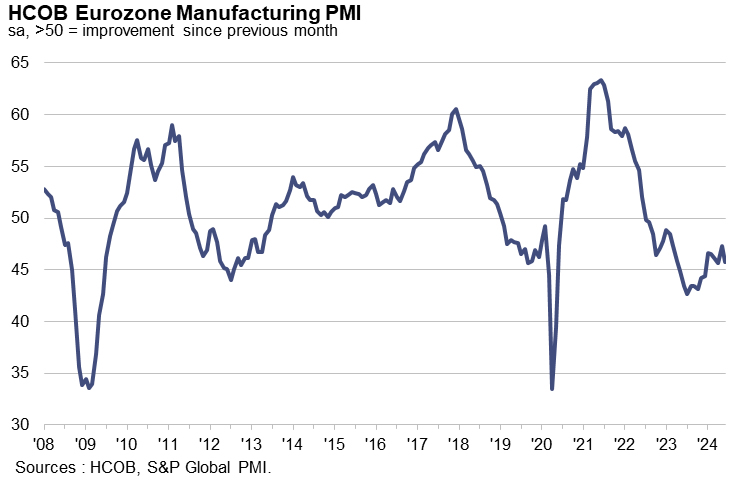
Eurozone PMI manufacturing finalized at 45.8, recovery pushed to late summer
Eurozone manufacturing PMI for June was finalized at 45.8, down from May's 47.3, signaling continued contraction in the manufacturing sector. This decline indicates ongoing challenges for manufacturers, with only Italy showing some improvement among the member countries.
Country-specific data for June showed Greece at 54.0, Spain at 52.3, the Netherlands at 50.7, and Ireland at 47.4. Italy recorded a slight improvement at 45.7, while France was at 45.4, Austria at 43.6, and Germany at 43.5. All these figures reflect either multi-month lows that are insufficient to suggest a strong recovery.
Cyrus de la Rubia, Chief Economist at Hamburg Commercial Bank, highlighted that despite the decline in PMI indices across most Eurozone countries, the trend appears to be a "temporary blip" rather than a sign of a prolonged downturn. He pointed out that the global recovery provides a "supportive backdrop" for Eurozone manufacturers. Moreover, optimism about future production remains high, similar to levels seen in May, indicating sustained confidence among businesses for the upcoming year.
However, de la Rubia also noted a troubling trend in new orders, which are falling at an accelerated pace. This decline follows a record stretch of 25 consecutive months of falling demand. Despite a brief improvement in May, the June data suggests that any significant recovery will likely be "postponed" until at least the end of summer or early fall.
EUR/CHF Daily Outlook
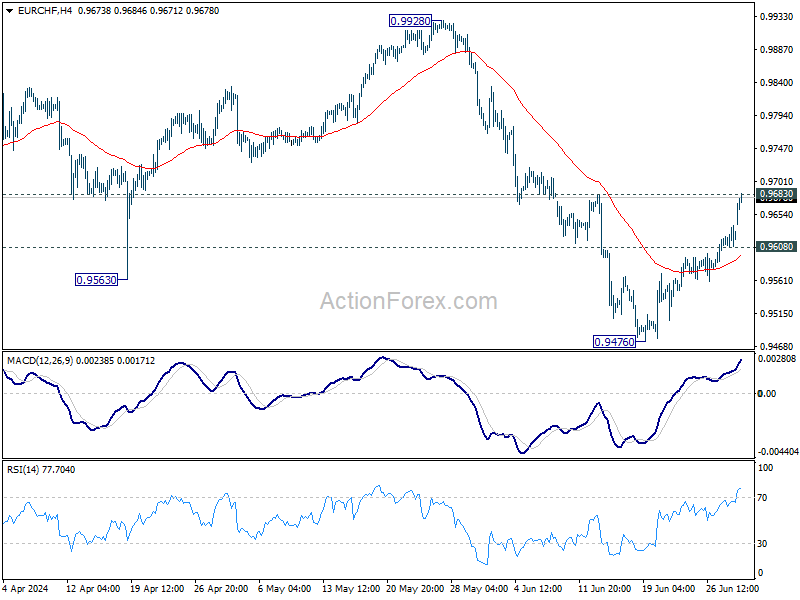
Daily Pivots: (S1) 0.9607; (P) 0.9624; (R1) 0.9644; More....
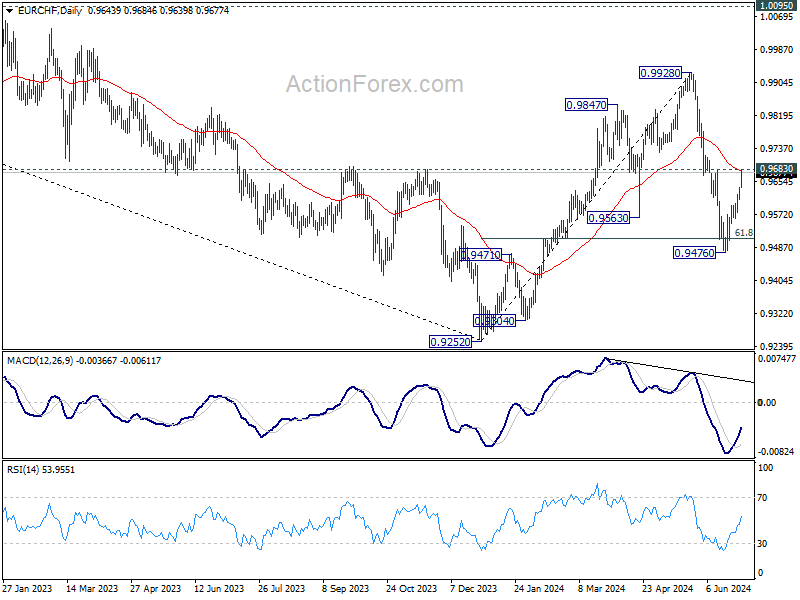
Immediate focus is now on 0.9683 as EUR/CHF extended the rebound from 0.9476. Decisive break there will argue that Fall from 0.9928 has completed, probably as a correction. Intraday bias will be back on the upside for retesting 0.9928 resistance. Nevertheless, rejection by 0.9683 will maintain near term bearishness. break of 0.9560 minor support bring retest of 0.9476.
In the bigger picture, rebound from 0.9252 should have completed at 0.9228. Medium term outlook remains bearish with 1.0095 resistance intact. Firm break of 0.9252 will resume the down trend from 1.2004 (2018 high).
EUR/GBP Daily Outlook
Daily Pivots: (S1) 0.8460; (P) 0.8471; (R1) 0.8484; More...
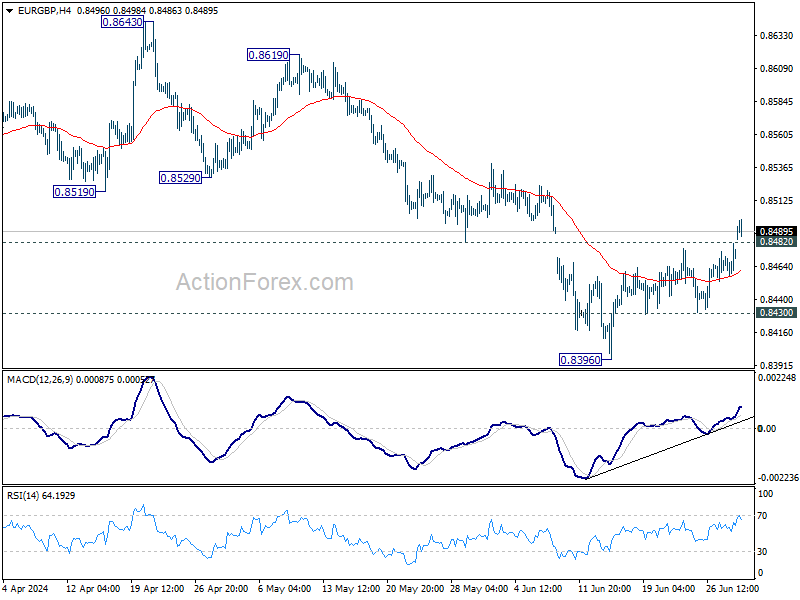
EUR/GBP's break of 0.8482 support turned resistance indicates short term bottoming a 0.8396. Intraday bias is back on the upside. Break of 55 D EMA (now at 0.8505) will target 0.8529 support turned resistance. on the downside, break of 0.8493 support will bring retest of 0.8396 low instead.
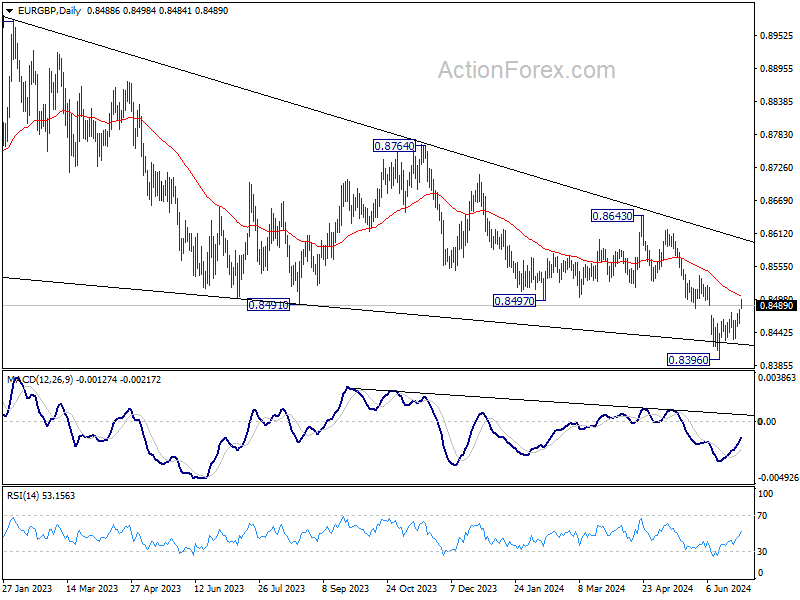
In the bigger picture, down trend from 0.9267 (2022 high) is in progress. Break of 0.8396 will target 0.8201 (2022 low). For now, outlook will remain bearish as long as 0.8643 resistance holds, even in case of stronger rebound.
EUR/AUD Daily Outlook
Daily Pivots: (S1) 1.6006; (P) 1.6077; (R1) 1.6132; More...
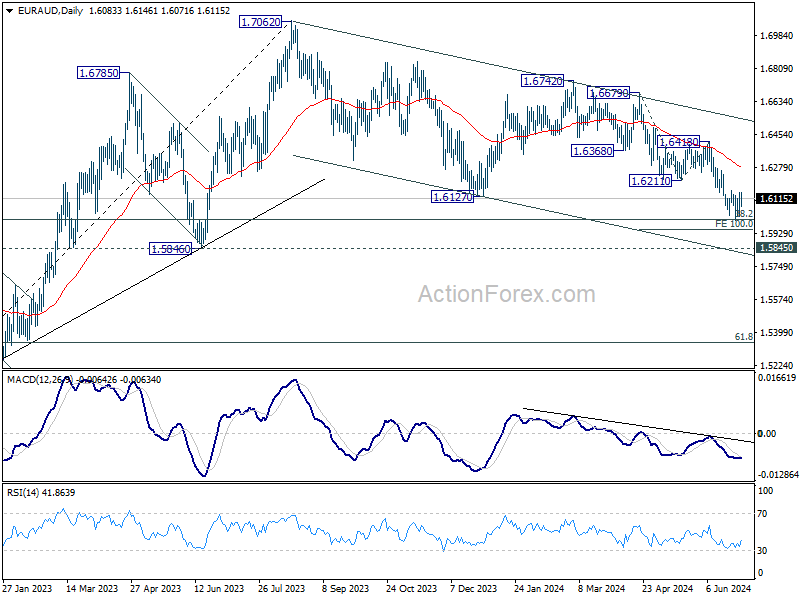
Intraday bias in EUR/AUD remains neutral for the moment and some more consolidations could be seen above 1.5996. But outlook stays bearish as long as 1.6211 support turned resistance holds. On the downside, break of 1.5996 will target 100% projection of 1.6679 to 1.6211 from 1.6418 at 1.5950. Firm break there will target 1.5846 key support next.
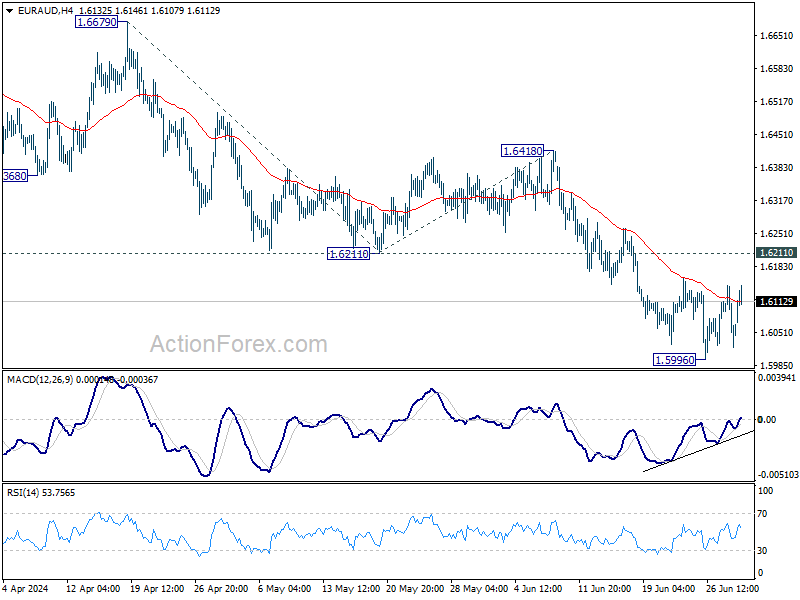
In the bigger picture, fall from 1.7062 medium term top is seen as a correction to the up trend from 1.4281 (2022 low) only. Strong support is still expected between 1.5846 and 38.2% retracement of 1.4281 to 1.7062 at 1.6000 to bring rebound. Break of 1.6148 resistance will argue that the correction has completed.
EUR/JPY Daily Outlook
Daily Pivots: (S1) 171.74; (P) 172.10; (R1) 172.73; More...
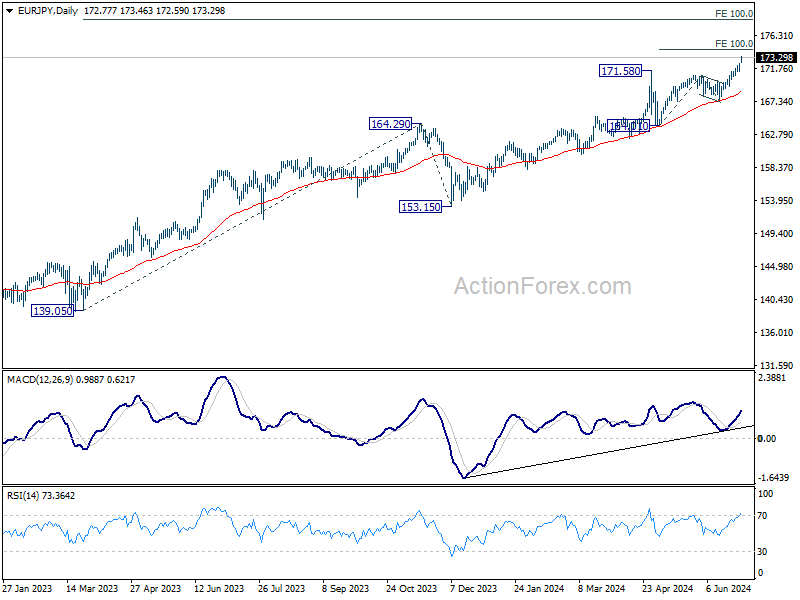
EUR/JPY's rally continues today and intraday bias stays on the upside. Next target is 100% projection of 164.01 to 170.87 from 167.52 at 174.38. On the downside, below 171.36 minor support will turn intraday bias neutral and bring consolidations first. But outlook will remain bullish as long as 170.87 resistance turned support holds.
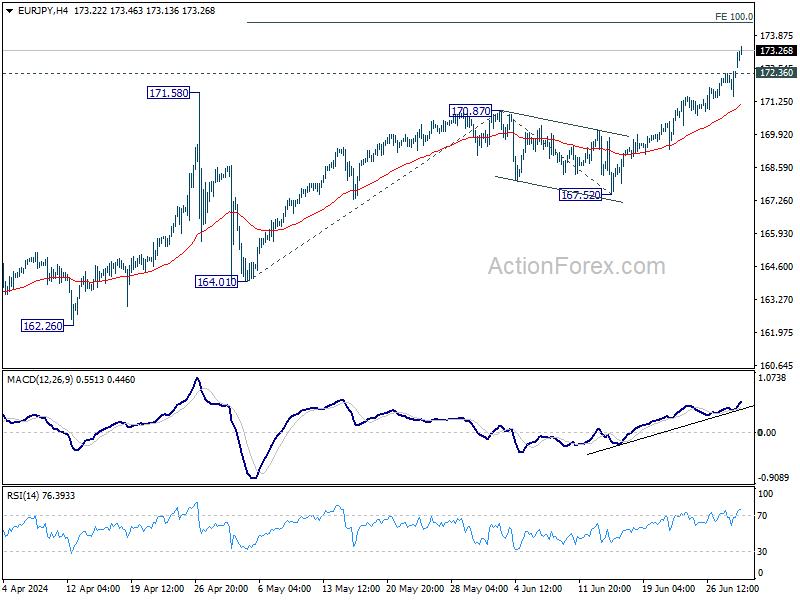
In the bigger picture, long term up trend is still in progress. Next target is 100% projection of 139.05 to 164.29 from 153.15 at 178.38. For now outlook will stay bullish as long as 167.52 support holds, even in case of deep pullback.