
Sample Category Title
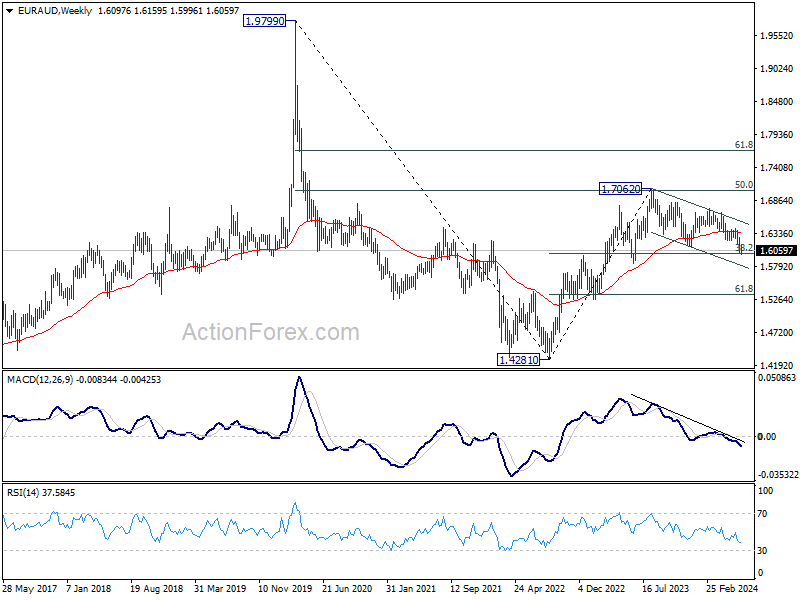
EUR/AUD Weekly Outlook
EUR/AUD edged lower to 1.5996 last week but recovered since then. Initial bias remains neutral this week first, and outlook stays bearish as long as 1.6211 support turned resistance holds. On the downside, break of 1.5996 will target 100% projection of 1.6679 to 1.6211 from 1.6418 at 1.5950. Firm break there will target 1.5846 key support next.
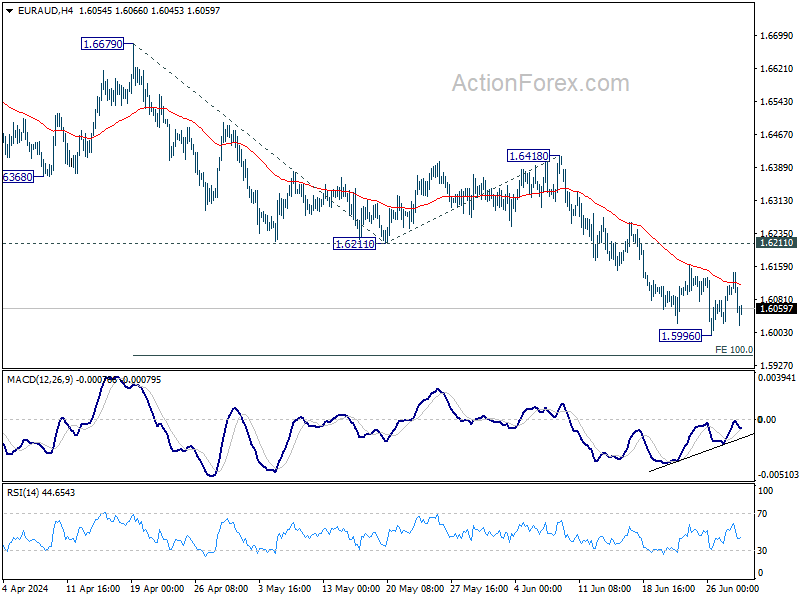
In the bigger picture, fall from 1.7062 medium term top is seen as a correction to the up trend from 1.4281 (2022 low) only. Strong support is still expected between 1.5846 and 38.2% retracement of 1.4281 to 1.7062 at 1.6000 to bring rebound. Break of 1.6148 resistance will argue that the correction has completed.

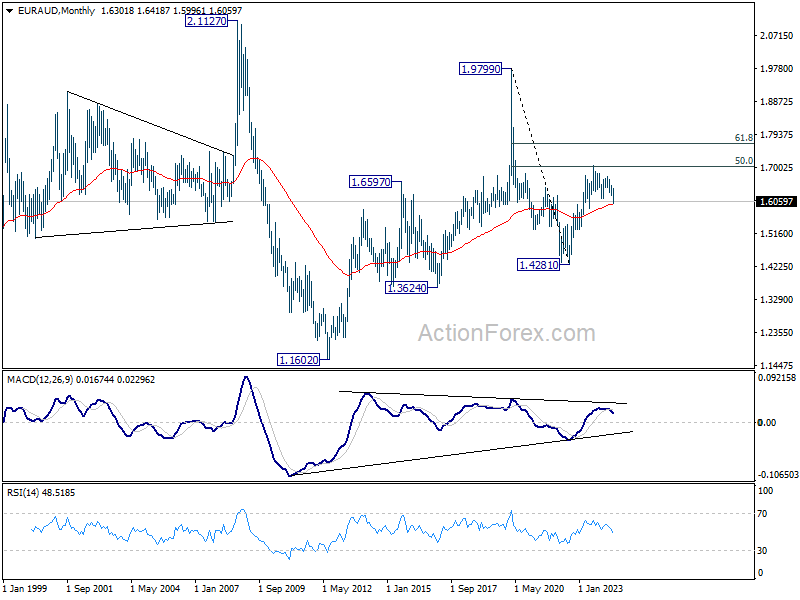
In the longer term picture, price actions from 1.9799 (2020 high) are seen as a long term decline at the same scale as the rise from 1.1602 (2012 low). Rebound from 1.4281 is seen as the second leg. As long as 55 M EMA (now at 1.5966) holds, this second leg could still extend higher. However, sustained trading below 55 M EMA will open up the bearish case for extending the decline through 1.4281 low.
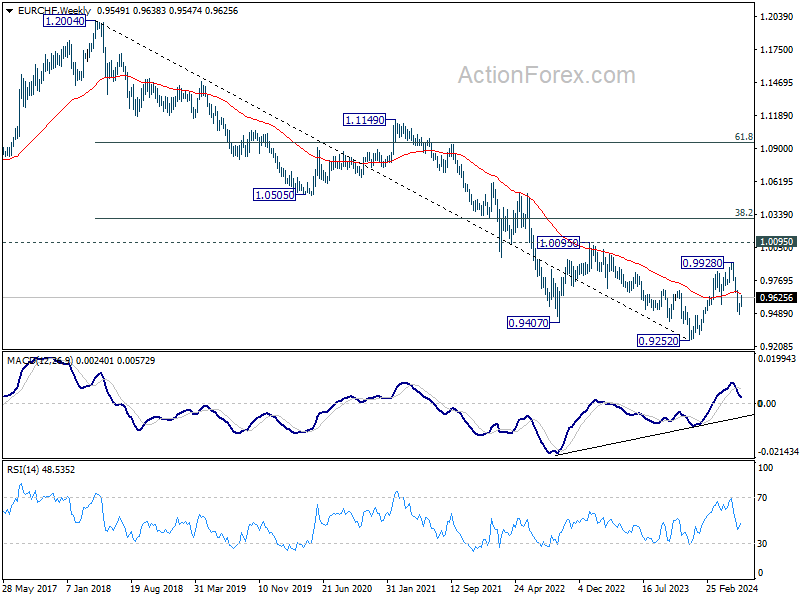
EUR/CHF Weekly Outlook
While EUR/CHF's recovery from 0.9476 extended higher last week, outlook stays bearish with 0.9683 resistance intact. Initial bias remains neutral this week first. On the downside, below 0.9560 minor support will suggest that the rebound has completed and bring retest of 0.9476. Further break there and and sustained trading below 61.8% retracement of 0.9252 to 0.9928 at 0.9510 will extend the fall from 0.9928 to retest 0.9252 low.
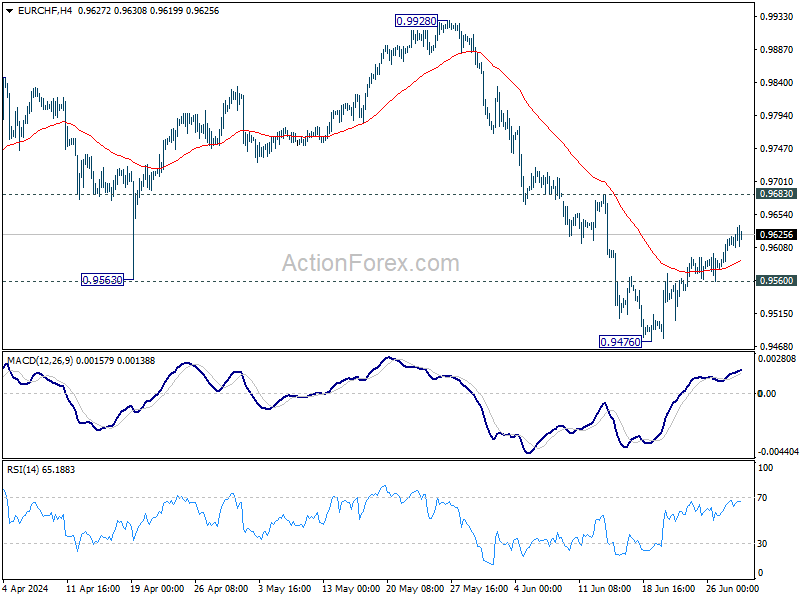
In the bigger picture, rebound from 0.9252 should have completed at 0.9228. Medium term outlook remains bearish with 1.0095 resistance intact. Firm break of 0.9252 will resume the down trend from 1.2004 (2018 high).
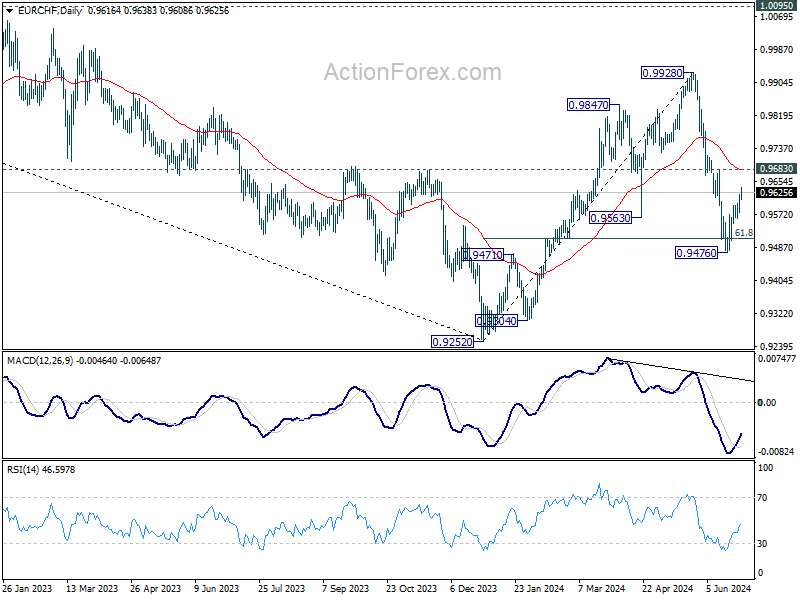
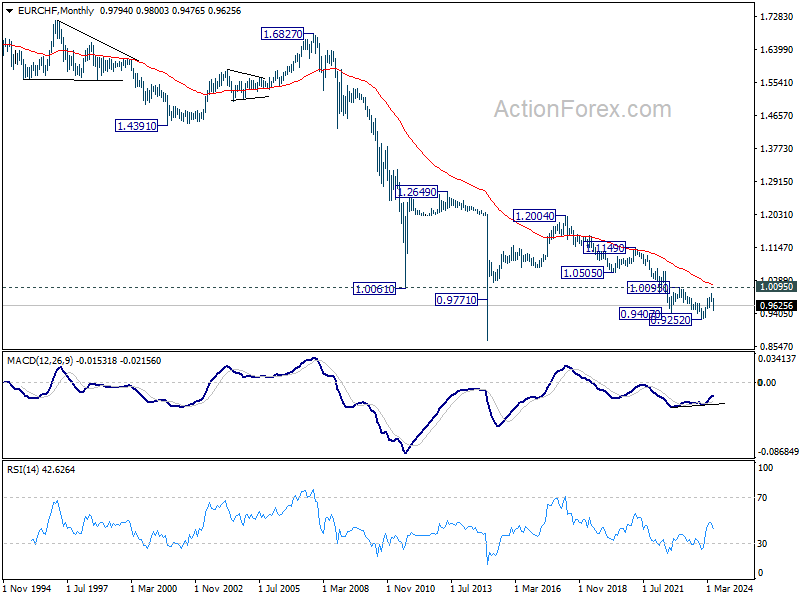
In the long term picture, fall from 1.2004 (2018 high) is part of the multi-decade down trend. Firm break of 1.0095 resistance is needed to be the first sign of long term bottoming. Otherwise, outlook will remain bearish.
Summary 7/1 – 7/5
Monday, Jul 1, 2024
| GMT | Ccy | Events | Consensus | Previous |
|---|---|---|---|---|
| 23:50 | JPY | Tankan Large Manufacturing Index Q2 | 11 | 11 |
| 23:50 | JPY | Tankan Large Manufacturing Outlook Q2 | 10 | |
| 23:50 | JPY | Tankan Non - Manufacturing Index Q2 | 33 | 34 |
| 23:50 | JPY | Tankan Non - Manufacturing Outlook Q2 | 27 | |
| 23:50 | JPY | Tankan Large All Industry Capex Q2 | 4% | |
| 00:30 | JPY | Manufacturing PMI Jun F | 50.1 | 50.1 |
| 01:45 | CNY | Caixin Manufacturing PMI Jun | 51.2 | 51.7 |
| 05:00 | JPY | Consumer Confidence Jun | 36.5 | 36.2 |
| 06:30 | CHF | Real Retail Sales Y/Y May | 2.50% | 2.70% |
| 07:30 | CHF | Manufacturing PMI Jun | 44.9 | 46.4 |
| 07:45 | EUR | Italy Manufacturing PMI Jun | 44.5 | 45.6 |
| 07:50 | EUR | France Manufacturing PMI Jun F | 45.3 | 45.3 |
| 07:55 | EUR | Germany Manufacturing PMI Jun F | 43.4 | 43.4 |
| 08:30 | GBP | Manufacturing PMI Jun F | 51.4 | 51.4 |
| 08:30 | GBP | M4 Money Supply M/M May | 0.20% | 0.10% |
| 08:30 | GBP | Mortgage Approvals May | 61K | 61K |
| 12:00 | EUR | Germany CPI M/M Jun P | 0.20% | 0.10% |
| 12:00 | EUR | Germany CPI Y/Y Jun P | 2.40% | |
| 13:45 | USD | Manufacturing PMI Jun F | 51.7 | 51.7 |
| 14:00 | USD | ISM Manufacturing PMI Jun | 49.3 | 48.7 |
| 14:00 | USD | ISM Manufacturing Prices Paid Jun | 55.9 | 57.0 |
| 14:00 | USD | ISM Manufacturing Employment Index Jun | 51.1 | |
| 14:00 | USD | Construction Spending M/M May | 0.30% | -0.10% |
| 22:45 | NZD | Building Permits M/M May | -1.90% |
| GMT | Ccy | Events | |
|---|---|---|---|
| 23:50 | JPY | Tankan Large Manufacturing Index Q2 | |
| Forecast: 11 | Previous: 11 | ||
| 23:50 | JPY | Tankan Large Manufacturing Outlook Q2 | |
| Forecast: | Previous: 10 | ||
| 23:50 | JPY | Tankan Non - Manufacturing Index Q2 | |
| Forecast: 33 | Previous: 34 | ||
| 23:50 | JPY | Tankan Non - Manufacturing Outlook Q2 | |
| Forecast: | Previous: 27 | ||
| 23:50 | JPY | Tankan Large All Industry Capex Q2 | |
| Forecast: | Previous: 4% | ||
| 00:30 | JPY | Manufacturing PMI Jun F | |
| Forecast: 50.1 | Previous: 50.1 | ||
| 01:45 | CNY | Caixin Manufacturing PMI Jun | |
| Forecast: 51.2 | Previous: 51.7 | ||
| 05:00 | JPY | Consumer Confidence Jun | |
| Forecast: 36.5 | Previous: 36.2 | ||
| 06:30 | CHF | Real Retail Sales Y/Y May | |
| Forecast: 2.50% | Previous: 2.70% | ||
| 07:30 | CHF | Manufacturing PMI Jun | |
| Forecast: 44.9 | Previous: 46.4 | ||
| 07:45 | EUR | Italy Manufacturing PMI Jun | |
| Forecast: 44.5 | Previous: 45.6 | ||
| 07:50 | EUR | France Manufacturing PMI Jun F | |
| Forecast: 45.3 | Previous: 45.3 | ||
| 07:55 | EUR | Germany Manufacturing PMI Jun F | |
| Forecast: 43.4 | Previous: 43.4 | ||
| 08:30 | GBP | Manufacturing PMI Jun F | |
| Forecast: 51.4 | Previous: 51.4 | ||
| 08:30 | GBP | M4 Money Supply M/M May | |
| Forecast: 0.20% | Previous: 0.10% | ||
| 08:30 | GBP | Mortgage Approvals May | |
| Forecast: 61K | Previous: 61K | ||
| 12:00 | EUR | Germany CPI M/M Jun P | |
| Forecast: 0.20% | Previous: 0.10% | ||
| 12:00 | EUR | Germany CPI Y/Y Jun P | |
| Forecast: | Previous: 2.40% | ||
| 13:45 | USD | Manufacturing PMI Jun F | |
| Forecast: 51.7 | Previous: 51.7 | ||
| 14:00 | USD | ISM Manufacturing PMI Jun | |
| Forecast: 49.3 | Previous: 48.7 | ||
| 14:00 | USD | ISM Manufacturing Prices Paid Jun | |
| Forecast: 55.9 | Previous: 57.0 | ||
| 14:00 | USD | ISM Manufacturing Employment Index Jun | |
| Forecast: | Previous: 51.1 | ||
| 14:00 | USD | Construction Spending M/M May | |
| Forecast: 0.30% | Previous: -0.10% | ||
| 22:45 | NZD | Building Permits M/M May | |
| Forecast: | Previous: -1.90% | ||
Tuesday, Jul 2, 2024
| GMT | Ccy | Events | Consensus | Previous |
|---|---|---|---|---|
| 01:30 | AUD | RBA Meeting Minutes | ||
| 09:00 | EUR | Eurozone Unemployment Rate May | 6.40% | 6.40% |
| 09:00 | EUR | Eurozone CPI Y/Y Jun P | 2.50% | 2.60% |
| 09:00 | EUR | Eurozone CPI Core Y/Y Jun P | 2.80% | 2.90% |
| 13:30 | CAD | Manufacturing PMI Jun | 50.2 | 49.3 |
| GMT | Ccy | Events | |
|---|---|---|---|
| 01:30 | AUD | RBA Meeting Minutes | |
| Forecast: | Previous: | ||
| 09:00 | EUR | Eurozone Unemployment Rate May | |
| Forecast: 6.40% | Previous: 6.40% | ||
| 09:00 | EUR | Eurozone CPI Y/Y Jun P | |
| Forecast: 2.50% | Previous: 2.60% | ||
| 09:00 | EUR | Eurozone CPI Core Y/Y Jun P | |
| Forecast: 2.80% | Previous: 2.90% | ||
| 13:30 | CAD | Manufacturing PMI Jun | |
| Forecast: 50.2 | Previous: 49.3 | ||
Wednesday, Jul 3, 2024
| GMT | Ccy | Events | Consensus | Previous |
|---|---|---|---|---|
| 01:30 | AUD | Retail Sales M/M May | 0.30% | 0.10% |
| 01:30 | AUD | Building Permits M/M May | 1.60% | -0.30% |
| 01:45 | CNY | Caixin Services PMI Jun | 53.4 | 54.0 |
| 07:45 | EUR | Italy Services PMI Jun | 54.2 | |
| 07:50 | EUR | France Services PMI Jun F | 48.8 | 48.8 |
| 07:55 | EUR | Germany Services PMI Jun F | 53.5 | 53.5 |
| 08:00 | EUR | Eurozone Services PMI Jun F | 52.6 | 52.6 |
| 08:30 | GBP | Services PMI Jun F | 51.2 | 51.2 |
| 09:00 | EUR | Eurozone PPI M/M May | 0.00% | -1.00% |
| 09:00 | EUR | Eurozone PPI Y/Y May | -5.70% | |
| 11:30 | USD | Challenger Job Cuts Y/Y Jun | -20.30% | |
| 12:15 | USD | ADP Employment Change Jun | 158K | 152K |
| 12:30 | CAD | Trade Balance (CAD) May | -0.8B | -1.0B |
| 12:30 | USD | Trade Balance (USD) May | -76.0B | -74.6B |
| 12:30 | USD | Initial Jobless Claims (Jun 28) | 235K | 233K |
| 13:45 | USD | Services PMI Jun F | 55.1 | 55.1 |
| 14:00 | USD | ISM Services PMI Jun | 52.5 | 53.8 |
| 14:00 | USD | Factory Orders M/M May | 0.30% | 0.70% |
| 14:30 | USD | Crude Oil Inventories | 3.6M | |
| 16:00 | USD | Natural Gas Storage | 52B | |
| 18:00 | USD | FOMC Minutes |
| GMT | Ccy | Events | |
|---|---|---|---|
| 01:30 | AUD | Retail Sales M/M May | |
| Forecast: 0.30% | Previous: 0.10% | ||
| 01:30 | AUD | Building Permits M/M May | |
| Forecast: 1.60% | Previous: -0.30% | ||
| 01:45 | CNY | Caixin Services PMI Jun | |
| Forecast: 53.4 | Previous: 54.0 | ||
| 07:45 | EUR | Italy Services PMI Jun | |
| Forecast: | Previous: 54.2 | ||
| 07:50 | EUR | France Services PMI Jun F | |
| Forecast: 48.8 | Previous: 48.8 | ||
| 07:55 | EUR | Germany Services PMI Jun F | |
| Forecast: 53.5 | Previous: 53.5 | ||
| 08:00 | EUR | Eurozone Services PMI Jun F | |
| Forecast: 52.6 | Previous: 52.6 | ||
| 08:30 | GBP | Services PMI Jun F | |
| Forecast: 51.2 | Previous: 51.2 | ||
| 09:00 | EUR | Eurozone PPI M/M May | |
| Forecast: 0.00% | Previous: -1.00% | ||
| 09:00 | EUR | Eurozone PPI Y/Y May | |
| Forecast: | Previous: -5.70% | ||
| 11:30 | USD | Challenger Job Cuts Y/Y Jun | |
| Forecast: | Previous: -20.30% | ||
| 12:15 | USD | ADP Employment Change Jun | |
| Forecast: 158K | Previous: 152K | ||
| 12:30 | CAD | Trade Balance (CAD) May | |
| Forecast: -0.8B | Previous: -1.0B | ||
| 12:30 | USD | Trade Balance (USD) May | |
| Forecast: -76.0B | Previous: -74.6B | ||
| 12:30 | USD | Initial Jobless Claims (Jun 28) | |
| Forecast: 235K | Previous: 233K | ||
| 13:45 | USD | Services PMI Jun F | |
| Forecast: 55.1 | Previous: 55.1 | ||
| 14:00 | USD | ISM Services PMI Jun | |
| Forecast: 52.5 | Previous: 53.8 | ||
| 14:00 | USD | Factory Orders M/M May | |
| Forecast: 0.30% | Previous: 0.70% | ||
| 14:30 | USD | Crude Oil Inventories | |
| Forecast: | Previous: 3.6M | ||
| 16:00 | USD | Natural Gas Storage | |
| Forecast: | Previous: 52B | ||
| 18:00 | USD | FOMC Minutes | |
| Forecast: | Previous: | ||
Thursday, Jul 4, 2024
| GMT | Ccy | Events | Consensus | Previous |
|---|---|---|---|---|
| 01:30 | AUD | Trade Balance (AUD) May | 6.30B | 6.55B |
| 06:00 | EUR | Germany Factory Orders M/M May | 0.90% | -0.20% |
| 06:30 | CHF | CPI M/M Jun | 0.10% | 0.30% |
| 06:30 | CHF | CPI Y/Y Jun | 1.40% | 1.40% |
| 08:30 | GBP | Construction PMI Jun | 54.0 | 54.7 |
| 11:30 | EUR | ECB Meeting Accounts | ||
| 23:30 | JPY | Household Spending Y/Y May | 0.20% | 0.50% |
| GMT | Ccy | Events | |
|---|---|---|---|
| 01:30 | AUD | Trade Balance (AUD) May | |
| Forecast: 6.30B | Previous: 6.55B | ||
| 06:00 | EUR | Germany Factory Orders M/M May | |
| Forecast: 0.90% | Previous: -0.20% | ||
| 06:30 | CHF | CPI M/M Jun | |
| Forecast: 0.10% | Previous: 0.30% | ||
| 06:30 | CHF | CPI Y/Y Jun | |
| Forecast: 1.40% | Previous: 1.40% | ||
| 08:30 | GBP | Construction PMI Jun | |
| Forecast: 54.0 | Previous: 54.7 | ||
| 11:30 | EUR | ECB Meeting Accounts | |
| Forecast: | Previous: | ||
| 23:30 | JPY | Household Spending Y/Y May | |
| Forecast: 0.20% | Previous: 0.50% | ||
Friday, Jul 5, 2024
| GMT | Ccy | Events | Consensus | Previous |
|---|---|---|---|---|
| 05:00 | JPY | Leading Economic Index May P | 111.1 | 110.9 |
| 06:00 | EUR | Germany Industrial Production M/M May | 0.20% | -0.10% |
| 06:45 | EUR | France Trade Balance (EUR) May | -7.2B | -7.6B |
| 06:45 | EUR | Industrial Output M/M May | -0.20% | 0.50% |
| 07:00 | CHF | Foreign Currency Reserves (CHF) Jun | 718B | |
| 08:00 | EUR | Italy Retail Sales M/M May | 0.20% | -0.10% |
| 09:00 | EUR | Eurozone Retail Sales M/M May | 0.20% | -0.50% |
| 12:30 | USD | Nonfarm Payrolls Jun | 180K | 272K |
| 12:30 | USD | Unemployment Rate Jun | 4.00% | 4.00% |
| 12:30 | USD | Average Hourly Earnings M/M Jun | 0.30% | 0.40% |
| 12:30 | CAD | Net Change in Employment Jun | 25.0K | 26.7K |
| 12:30 | CAD | Unemployment Rate Jun | 6.30% | 6.20% |
| 14:00 | CAD | Ivey PMI Jun | 53 | 52 |
| GMT | Ccy | Events | |
|---|---|---|---|
| 05:00 | JPY | Leading Economic Index May P | |
| Forecast: 111.1 | Previous: 110.9 | ||
| 06:00 | EUR | Germany Industrial Production M/M May | |
| Forecast: 0.20% | Previous: -0.10% | ||
| 06:45 | EUR | France Trade Balance (EUR) May | |
| Forecast: -7.2B | Previous: -7.6B | ||
| 06:45 | EUR | Industrial Output M/M May | |
| Forecast: -0.20% | Previous: 0.50% | ||
| 07:00 | CHF | Foreign Currency Reserves (CHF) Jun | |
| Forecast: | Previous: 718B | ||
| 08:00 | EUR | Italy Retail Sales M/M May | |
| Forecast: 0.20% | Previous: -0.10% | ||
| 09:00 | EUR | Eurozone Retail Sales M/M May | |
| Forecast: 0.20% | Previous: -0.50% | ||
| 12:30 | USD | Nonfarm Payrolls Jun | |
| Forecast: 180K | Previous: 272K | ||
| 12:30 | USD | Unemployment Rate Jun | |
| Forecast: 4.00% | Previous: 4.00% | ||
| 12:30 | USD | Average Hourly Earnings M/M Jun | |
| Forecast: 0.30% | Previous: 0.40% | ||
| 12:30 | CAD | Net Change in Employment Jun | |
| Forecast: 25.0K | Previous: 26.7K | ||
| 12:30 | CAD | Unemployment Rate Jun | |
| Forecast: 6.30% | Previous: 6.20% | ||
| 14:00 | CAD | Ivey PMI Jun | |
| Forecast: 53 | Previous: 52 | ||
Markets Weekly Outlook: French, UK Elections in Focus Followed by NFP Data
- Despite a decline in core PCE numbers, hawkish comments from Fed policymakers cast doubt on a September rate cut.
- The first half of 2024 saw a widening gap between growth and value stocks, with the former outperforming the S&P 500.
- Concerns over central bank policy divergence and a weakening Yen add to market uncertainty. The week ahead brings key data releases, including US non-farm payroll and unemployment figures.
- Chart of the week: S&P 500 RSI divergence hints at further downside.
Week in Review: PCE fails to deliver clarity, door still open for September rate cut
A big week for markets ended with somewhat of a whimper. Market participants were bracing for US PCE in the hopes of finding clarity on the Federal Reserve’s monetary policy stance. The decline in core PCE numbers bodes well for the Fed and leaves the door open to a September rate cut.
However, if rhetoric from Fed policymakers is followed, a September rate cut is likely out of the question. The back end of the week brought comments from both Rafael Bostic and Mary Daly which struck a rather hawkish tone. Atlanta Fed President Bostic said he saw one rate cut in Q4 of 2024 before a slew of cuts in 2025 as he would like to ensure that inflation is indeed on course for a sub 2% print. Mary Daly who is the San Francisco Fed President went further saying that she sees inflation continue to print above 2% through 2025.
Interest Rate Probability – US Federal Reserve, June 28, 2024
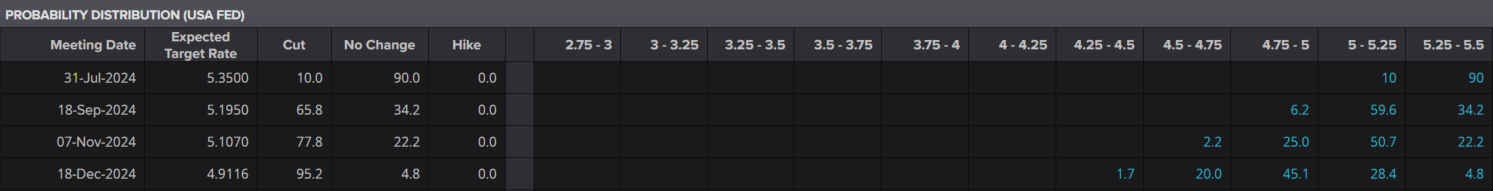
Source: LSEG
The US Presidential debate also added a new dimension for global markets. Following the debate there has been growing rumors that Joe Biden might not even secure the Democratic nomination to stand in the November election. Calls have been made in the past citing President Biden’s age as a major concern. According to data put out by the Kobeissi Letter, the chance of President Biden dropping out of the election more than doubled following the debate last night, upto 43% from around 21% prior. It will be interesting to gauge how this develops next week as despite his legal troubles, Trump still enjoys significant support on Wall Street and is seen as pro-business.
As Q2 comes to a close it is key to note the performance of global stocks in the first half of 2024. The S&P 500 hit a fresh high on Friday before a selloff saw the index trade around -0.35% at the time of writing. The Nasdaq 100 for its part failed to print a fresh high but piqued just above the 20000 mark once more. The most notable takeaway from the first half of the year is the widening gap between growth and value stocks. Growth stocks led by the FANG+ group put in gains of around 30% YTD in comparison to the broader S&P 500 which put in gains of around 15%. The question however as Q3 beckons, is this sustainable…?
The Week Ahead: Q3 starts with French, UK election
Looking ahead to next week, there is a lot happening globally which could have an impact on financial markets. This kicks off on Sunday which is the first round of Parliamentary elections in France.
Polling in France has delivered a wide range of estimates, but the one thing they all have in common is a victory for the “far-right” National Rally led by Marine Le Pen. Polling puts support for Le Pen at 34% while others believe the National Rally is on course for a majority victory.
Given the uncertainty of a new Government as well as concerns about the policies that may come into force, it’s no surprise that financial markets are spooked. A sign of the concern was reflected in the risk premium of French Government Bonds hit highs last seen during the 2012 euro area crisis.
An outright win for the National Rally could weigh on French Government Bonds and may also have a slight impact on the Euro as uncertainty around the dynamics of how the Government would work. It would be the first time a French President would have to share power with a party outside the political mainstream.
UK elections on July 4, 2024 is revealing a similar story in that it seems a foregone conclusion that a new Government will be elected. The Labor Party led by Keir Starmer are overwhelming favorites based on polling, with Prime Minister Rishi Sunak facing a tough week ahead.
Unlike the French election however, volatility around the UK election is likely to disappoint. Markets have been eerily calm despite polling and there are a host of reasons that could explain this. For starters, very little is expected to change from a fiscal standpoint regardless of who is elected. Secondly, two topics which dominated the agenda heading into the 2019 election was Brexit and a Scottish referendum. Brexit has well and truly been handled while a Scottish referendum seems a way off at present as the implosion of the Scottish National Party (SNP) continues to drag on. Lastly, despite all the hype around elections this year, monetary policy remains the key for 2024, and no matter who wins the UK election that will not change.
Elsewhere in Europe we have the ECB Forum on Central Banking in Sintra, Portugal. The Forum brings together central bank governors, policymakers, academics, and financial market representatives from around the world to discuss critical issues affecting the global economy and monetary policy. The forum serves as a platform for sharing insights, debating economic policies, and exploring challenges and opportunities facing central banks. It plays a key role in shaping future monetary policy directions and fostering international cooperation among central banks.
Given growing concern around Central Bank policy divergence in the months ahead, this may provide insights into where Central Banks stand in relation to one another and what we may expect in Q3 and Q4.
Asian Markets Outlook
Asian markets will see a barrage of PMI and inflation data in the week ahead. China is always the most important one while developments in Japan and particularly the Japanese Yen will be key in the week ahead.
Japanese officials are facing renewed pressure as the Yen weakened beyond the critical 160.00 mark against the US Dollar. Analysts and market participants viewed this level as a threshold likely to trigger FX intervention by the Bank of Japan. Various Japanese officials have issued warnings about the excessive exchange rate and indicated potential intervention.
USD/JPY Daily Chart, June 28, 2024
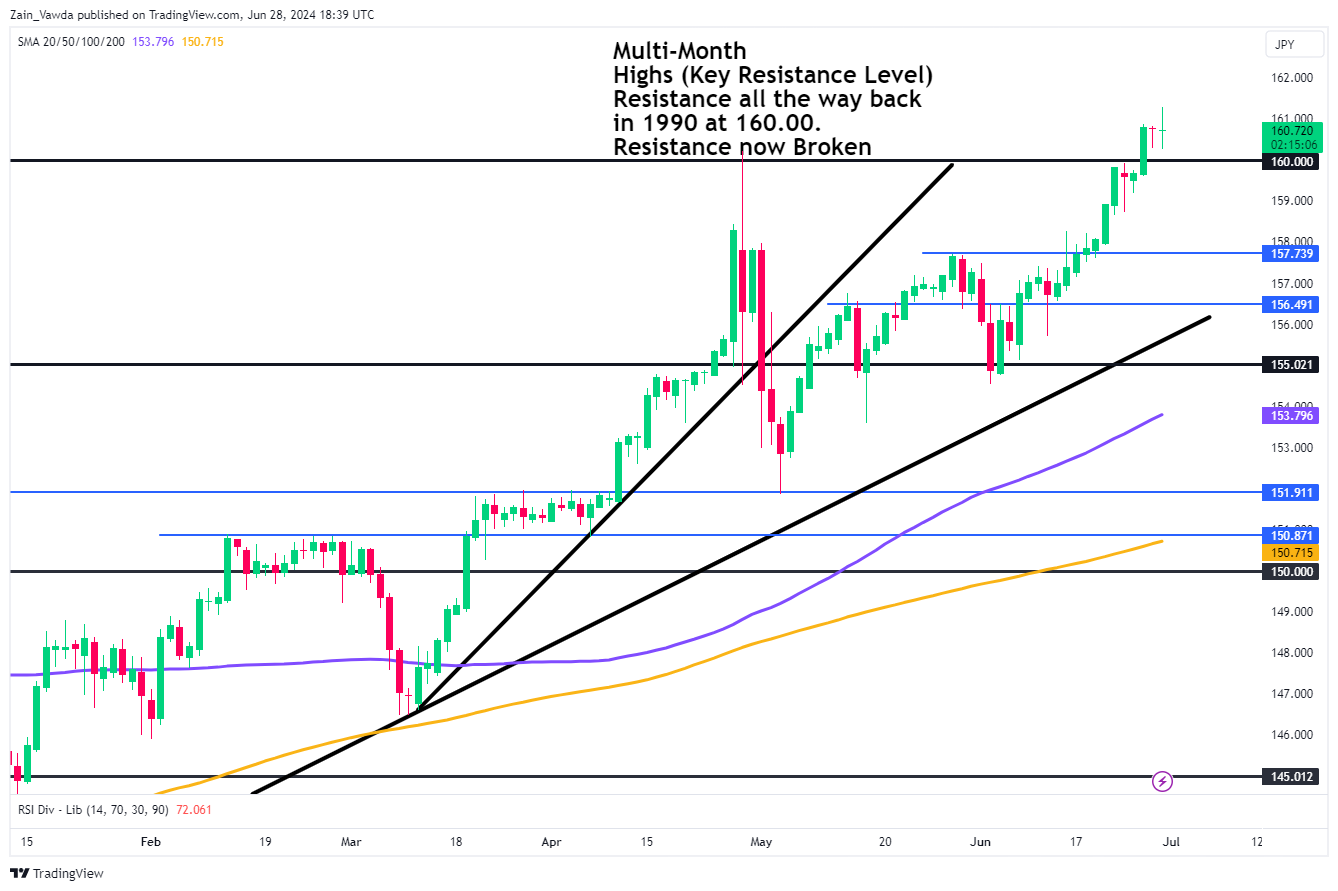
Source: TradingView.Com (click to enlarge)
Looking at the yen chart above, price has found acceptance above the 160.00 handle with two successive daily candle closes. The 160.00 is key support moving forward and the longer price remains above this level the more nerves we may see from market participants that intervention may materialize. Keep this in mind in the week ahead.
Back to the US and the week will end with the non-farm payroll and unemployment data from the US. Just another data point for the Fed to consider and could either add more uncertainty or validate market participants who are currently pricing in a 64% chance of a rate cut in September.
Chart of the Week
The chart of the week that I will be focusing on is the S&P 500. The reason is Friday’s rejection of the 5500 psychological level once more which coincides with RSi divergence. The RSI has printed a lower high while price action has printed a higher high, which could be a sign that a selloff may be imminent and worth keeping an eye on in the week ahead.
S&P 500 Daily Chart – June 28, 2024
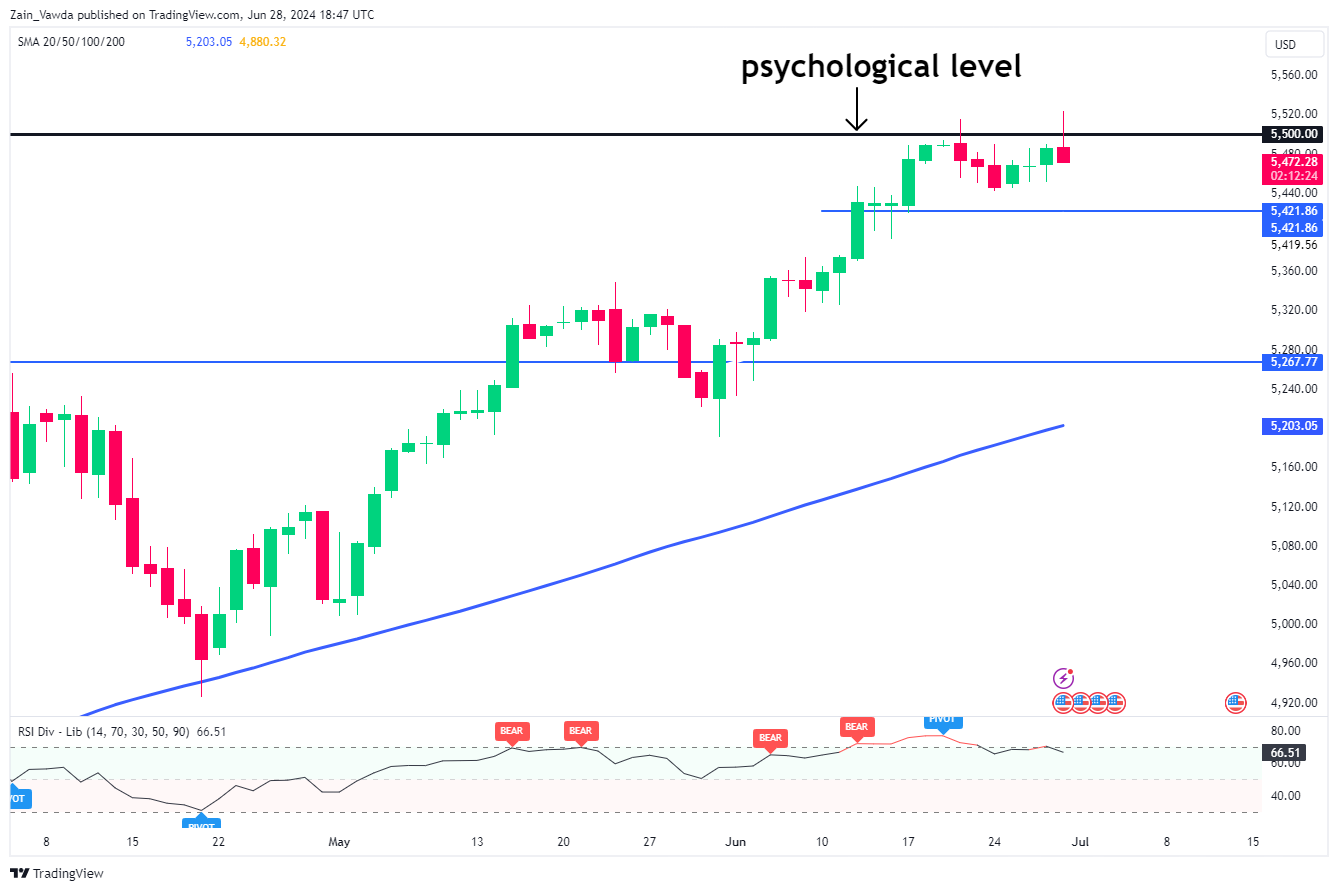
Source:TradingView.Com (click to enlarge)
Key Levels to Consider:
Support:
- 5421
- 5330
- 5267
- 5200 (100-day MA)
Resistance:
- 5500
- 5600
- 5750
The Weekly Bottom Line: Services Spending and Prices Starting to Settle
U.S. Highlights
- Headline PCE inflation came in flat for the month of May and core PCE inflation eased.
- Personal income posted a strong gain last month, while spending growth was more moderate, leading to an uptick in the savings rate.
- The heat in the economy still looks mainly to be in the service sector, as goods-producing industries contracted last quarter and goods prices continued to retreat in May.
Canadian Highlights
- May’s disappointing inflation report slashed the odds of a follow up rate cut by the BoC in July and is more consistent with our view that the next move down in rates will be in September.
- May’s report notwithstanding, inflation should cool moving forward, consistent with a softening jobs market. Data this week showed a dip in payrolls employment.
- Overall economic growth was firm in April. However, May’s preliminary forecast was soft. An economy currently in excess supply implies further downward pressure on inflation.
U.S. – Services Spending and Prices Starting to Settle
The past week had a relatively light data calendar for the U.S. economy, which continued on relative cruise control to gradually moderating economic growth and inflation. The current state of the economy was well summarized by Federal Reserve Board Governor Bowman in her speech earlier this week, which emphasized that we have seen only modest progress on inflation in 2024, despite moderating economic growth. The message holds true in the week’s data, which included an update on consumer prices and personal spending, as well as the revised reading on first-quarter GDP.
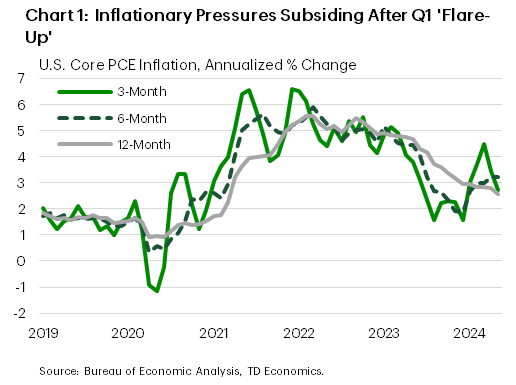
Inflation – as measured by the personal consumption (PCE) deflator – continued to moderate in May, with the core PCE deflator posting a ‘soft’ gain of 0.1% m/m – down sharply from the 0.3% gain registered the month prior. The deceleration in price pressures was entirely driven by another month of declines in goods prices and a further slowing in non-housing services prices. More critically, the three-month trend eased to a five-month low of 2.7% (annualized). Fed Governor Bowman repeated earlier this week that inflation has been slow to come down and more progress towards 2% is needed to support rate cuts this year. This morning’s data showed another (small) step in the right direction, though Fed officials will likely need to see at least another several ‘good’ inflation readings before having enough confidence to start dialing back the policy rate.
On the spending side, the release of May’s data showed some retrenchment in the goods and services split, with goods leading personal spending growth after having recorded declines in three of the four prior months. Overall, the softer gain in services spending implies our Q2 tracking for consumer spending is likely closer to 1.5%, which is a bit lower than what was assumed in our updated forecast published earlier this week.
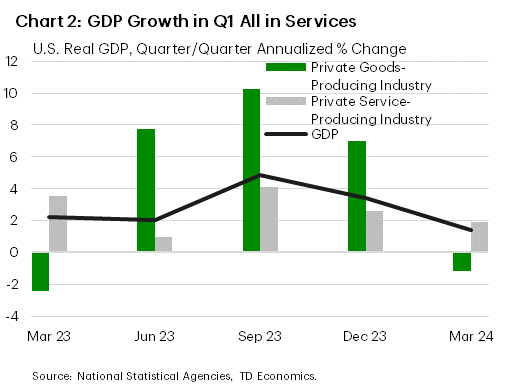
The last big piece of data out this week was the third estimate of first-quarter GDP. Usually, the 3rd estimate is not very exciting – after all, the first estimate was released two months ago, and revised minimally last month, only to be revised minimally again this week. Mostly old news, in that sense, but in the 3rd estimate we do get one new piece of data: the first look at GDP by industry for the quarter. Here, two observations quickly become clear – goods-producing industries contracted in the first quarter following several quarters of high growth in 2023, and services-producing industries, which had been supporting growth for over a year now, posted moderate growth relative to the last two quarters. The moderation of services growth coinciding with the downtrend in services inflation is an encouraging combination.
Next week, we will be closely following Chairman Powell’s words at the European Central Bank’s policy extravaganza at Sintra for a better view of how the central bank is digesting the latest data. Markets and other observers will also be focused on next week’s jobs data for any signs that the cooling we have seen in spending and prices is spilling over to the labour market.
Canada – Disappointing Inflation Print Affords Patience for the BoC
Market action this week was dictated by inflation reports from both north and south of the border. A disappointing Canadian report caused markets to push back strongly on the notion of a follow-up rate cut by the Bank of Canada in July. It also supports our call that the Bank can afford to wait until September until trimming its policy rate again. Bonds sold off in the wake of the report, pushing Canadian yields higher across the curve, although they gave up some of these gains on Friday amid a soft U.S. inflation print that showed some welcome cooling in price pressures. For its part, the loonie was down slightly on the week and remains in the lower end of the $0.72 - $0.76 USD range that’s been in place for the better part of two years.
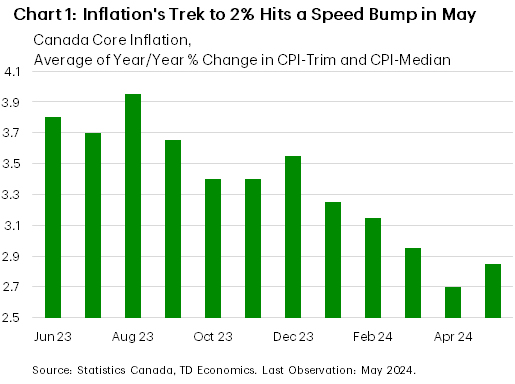
Canadian inflation had been on an improving trend for the first four months of 2024, increasing the Bank of Canada’s confidence that it was on a sustainable path back to 2% and paving the way for an early June rate cut – the first in four years. Against this promising backdrop, the May report landed with a thud, as both headline inflation and the Bank of Canada’s preferred core measures surprised to the upside. Indeed, both overall inflation and the average of the Bank’s core metrics ticked 0.2 percentage points higher to 2.9% year-on-year in May, boosted by shelter prices. However, nowhere is it written that inflation must take a straight line down to the 2% target, and there were bound to be some bumps along the way (Chart 1). An obvious example of this is in the U.S., where inflation heated up in the first quarter, before giving back some ground in recent months.
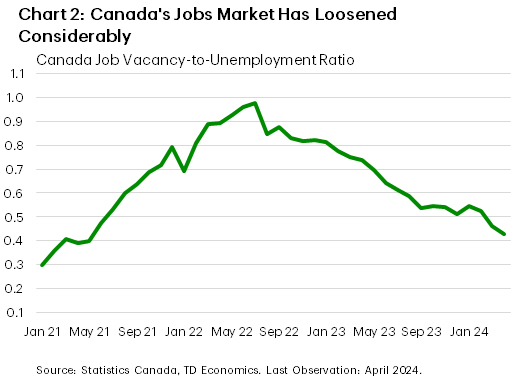
A potential concern coming out of Canada’s May CPI print is whether it’s a harbinger of some potential stickiness in inflation, raising the potential for higher for longer interest rates. While it’s too early to tell, our latest forecast anticipates a gradual easing in inflation pressures over the rest of 2024. A softening jobs market is a key reason that we expect inflation to ease further, with data this week showing that payroll employment declined in April. Meanwhile, both the job vacancy rate and the ratio of vacancies to the number of unemployed people (indicators of job market tightness) continued to decline from the highs observed a few years ago (Chart 2).Also encouraging was progress on wage growth, with average weekly earnings and the fixed-weight index of average hourly earnings both decelerating in April.
The likelihood that overall economic growth will be subdued moving forward is another good reason to expect inflation to be brought to heel. While this morning’s data showed that the economy expanded at an above-trend 0.3% month-on-month (m/m) in April, supported by monthly gains in 15 of 20 industries, May’s preliminary number was considerably weaker, showing a 0.1% m/m advance. All told, the second quarter is shaping up to be a decent one for growth. However, even with this performance the economy was likely in an “excess supply” position, meaning that the economy’s performance should be pressuring inflation lower, not higher, going forward.
Weekly Economic & Financial Commentary: Yen Reaches Its Weakest Level Against the Greenback since 1986
Summary
United States: It May Be Hot Outside, but Inflation Is Finally Cooling
- According to the Federal Reserve's preferred gauge, core inflation cooled to its softest pace in more than three years in May against a backdrop of measured consumer spending and still-strong personal income. Elsewhere, the effect of higher rates remains evident in uninspiring data on capital investment and the housing market.
- Next week: Construction Spending (Mon.), ISM Manufacturing (Mon.), Employment (Fri.)
International: Bird Food: Some Dovish Central Bank Rate Holds Amid Lighter Global Data Week
- Although this week's central bank decision lineup was somewhat lighter than last week's, multiple institutions delivered updates to their monetary policy assessments. Sweden's Riksbank delivered a dovish policy rate hold. In Mexico, Banxico held rates steady at 11.00% and offered commentary consistent with our outlook for cautious central bank easing.
- Next week: China PMIs (Sun.), Japan Tankan Survey (Mon.), Eurozone CPI (Tue.)
Interest Rate Watch: QT Gradually Putting Upward Pressure on Money Market Rates
- The FOMC has left its main policy tool, the federal funds rate, unchanged for nearly a year as it awaits further progress on bringing inflation back down to 2%. However, the Federal Reserve continues to reduce the size of its balance sheet as part of its quantitative tightening (QT) program. Ongoing QT is gradually starting to put upward pressure on money market rates, such as the Secured Overnight Financing Rate (SOFR).
Credit Market Insights: Strong Net Worth Gains Cloud Slowing Growth in Cash
- Household net worth climbed to new highs across all wealth cohorts in Q1. Most of household wealth is tied up in relatively illiquid assets such as corporate equities and real estate. How are liquid “cash” assets holding up for households relative to pre-pandemic and over the past year?
Topic of the Week: Yen Reaches Its Weakest Level Against the Greenback since 1986
- This week, the yen reached its weakest intraday level against the greenback since 1986. The currency's dramatic slide over the past few years has spurred Japan's Ministry of Finance to intervene a couple of times. Will Japan continue to intervene, and how long can it do so?
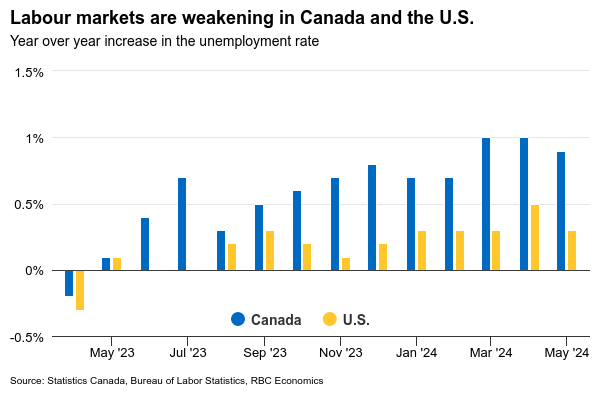
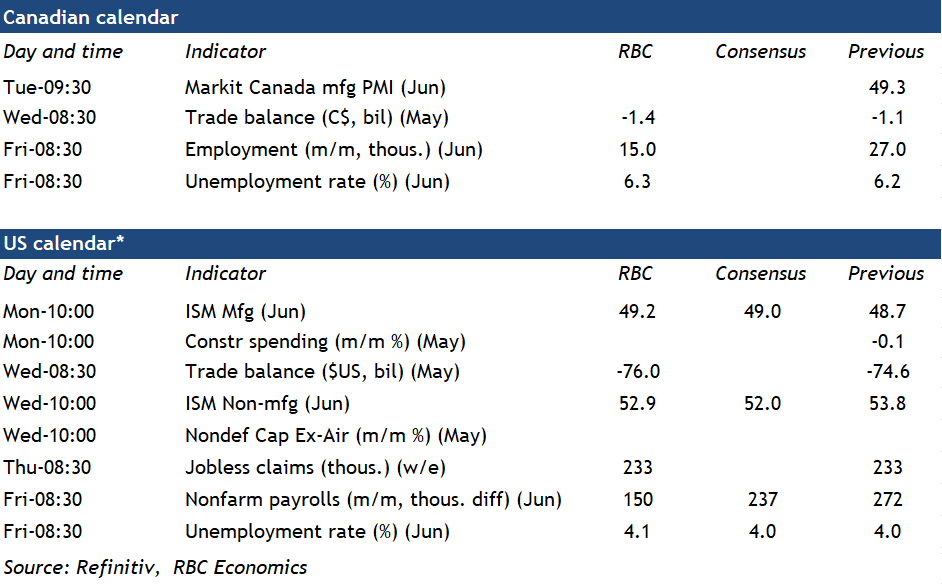
Labour Markets in Canada and the U.S. to Show Key Signs of Weakness
Central banks in Canada and the United States will be closely watching labour market data on Friday after May inflation numbers sent some mixed signals, broadly surprising to the upside in Canada and the downside in the U.S.
The tick-up in Canadian inflation in May followed a string of downside surprises this year, and further signs of softening in labour markets would help to reassure the Bank of Canada that inflation pressures are more likely to drift lower going forward. We expect employment continued to inch higher, but alongside another increase in the unemployment rate to 6.3% in June as labour force growth outpaced hiring again because the population continued to surge. Wage growth in the labour force survey has remained persistently high, but other estimates of wages from business payrolls have been showing more signs of softening. The combination of fewer job openings – which continued to decline into June – and higher unemployment is tilting bargaining power in wage negotiations away from workers. Overall, a softer labour market report should take some of the heat away from the upside CPI surprise in May. We continue to expect inflation will drift broadly lower this year and look for another 25 basis point cut from the BoC at its next meeting in July to build on the first cut in June.
We expect U.S. labour market data will also start to show more signs of cooling in June. Payroll employment growth has remained strong, but job openings, hire and quits rates have all been showing persistent slowing in labour demand for months. The unemployment rate—albeit rising slower than in Canada—has increased by 0.6% from a recent trough in April 2023 and wage growth has also slowed. Overall, we think payroll employment growth will stay at a stronger 237,000 in June, similar to the average gain of 250,000 in the three months before but expect the unemployment rate will rise again to 4.1%. Gradually cooling labour market conditions, however, are not expected to prompt an immediate response from the Fed, who is still expected to cut rates in December, contingent on a trail of slower inflation readings from now.
Week ahead data watch
We expect Canada’s trade deficit widened to $1.4 billion in May from a $1.1 billion shortfall in April with a 7% drop in oil prices weighing on exports. Imports also likely declined with domestic demand remaining soft. Machinery and equipment import volumes have been running ~4% below year-ago levels in a sign amid sluggish business investment.
Advance estimates in the U.S. showed a 2.7 billion widening in the goods trade deficit in May that we expect will be broadly reflected in a wider overall trade balance for the month. The advance indicators report pointed to a 2.7% drop in goods exports and a 0.7% drop in imports.
What Can We Expect from ISM Business PMIs Next Week?
- ISM manufacturing PMI to tick higher; services PMI to lose some pace
- Business outlook could stay unchanged; rate cut forecasts will remain inflation-driven
- EURUSD stays neutral after core PCE inflation; needs a strong rebound above 1.0885
What happened previously?
Dollar traders will pay close attention to the US ISM manufacturing and non-manufacturing PMI readings for June due on Monday and Wednesday respectively at 14:00 GMT.
While Friday's US nonfarm payrolls report will be the big event next week, business surveys could showcase early signs of hiring trends and changes in inflationary pressures, and therefore influence investors’ thoughts on rate cut timing.
May’s ISM PMI release came below expectations, displaying a faster moderation in manufacturing activity for the second consecutive month in the contraction area below 50. The overall reaction in the US dollar was negative as the price paid and new orders sub-indices eased significantly, but the response could have been worse if the employment index would not have returned to the expansion area.
Encouragingly, the non-manufacturing PMI survey came to overshadow the weakness in the manufacturing sector two days later, boosting the composite index back to the growth territory. The report showed services activities rising to the highest in nine-months led by real estate and health care businesses, while the details revealed progress in employment and softer increases in prices paid, although challenges regarding high interest rates and increased wages remained. Still, the US dollar could not sustain its bullish action until a stronger-than-expected nonfarm payrolls came to its aid in fully healing its wounds.
What will June's ISM business PMIs show?
The truth is that the first quarter was not fruitful for the US economy, with GDP growth falling by half to 1.4% from 3.4% in Q4 - the lowest in almost two years. Nevertheless, the first-quarter GDP data, aside from some pandemic-related distortions, tends to be relatively lackluster following the holiday season.
Economic statistics in the second quarter haven’t been impressive so far either, but they came out better than expected, pushing rate cut projections towards the September-December 2024 period, when the US general election will also take place.

Perhaps an upbeat PMI report could raise doubts about whether a rate cut is necessary in September. Forecasts point to a slightly higher ISM manufacturing PMI of 49.0 compared to 48.7 in May and a softer services PMI of 52 from 53.8 previously, which, if correct, wouldn’t drastically change the outlook for the US economy overall.

The focus will remain on inflation
The S&P Global business PMIs could be more encouraging next week, with analysts predicting a rebound both in the manufacturing and services indices. Nevertheless, inflationary pressures may continue to play a significant role in determining monetary easing decisions. Moreover, with the manufacturing sector experiencing one of its longest periods within the contraction region and the services sector struggling to resume a positive trajectory, rate cut projections may linger.
The Fed’s favorite inflation measure, the core PCE index, met forecasts for a slowdown to 2.6% from 2.8% previously – the lowest level reached since the measure spiked from 1.9% to 3.1% in April 2021. The data increased the odds for a September rate cut above 60% despite an upside surprise in personal income.
Comments from the San Francisco Fed president, who indicated that the central bank is still uncertain about when to slash interest rates, also helped. Perhaps the Fed might wisely take its time during the summer to monitor changes in inflation ahead of the Jackson Hall symposium in August and before making any serious policy decision in September.
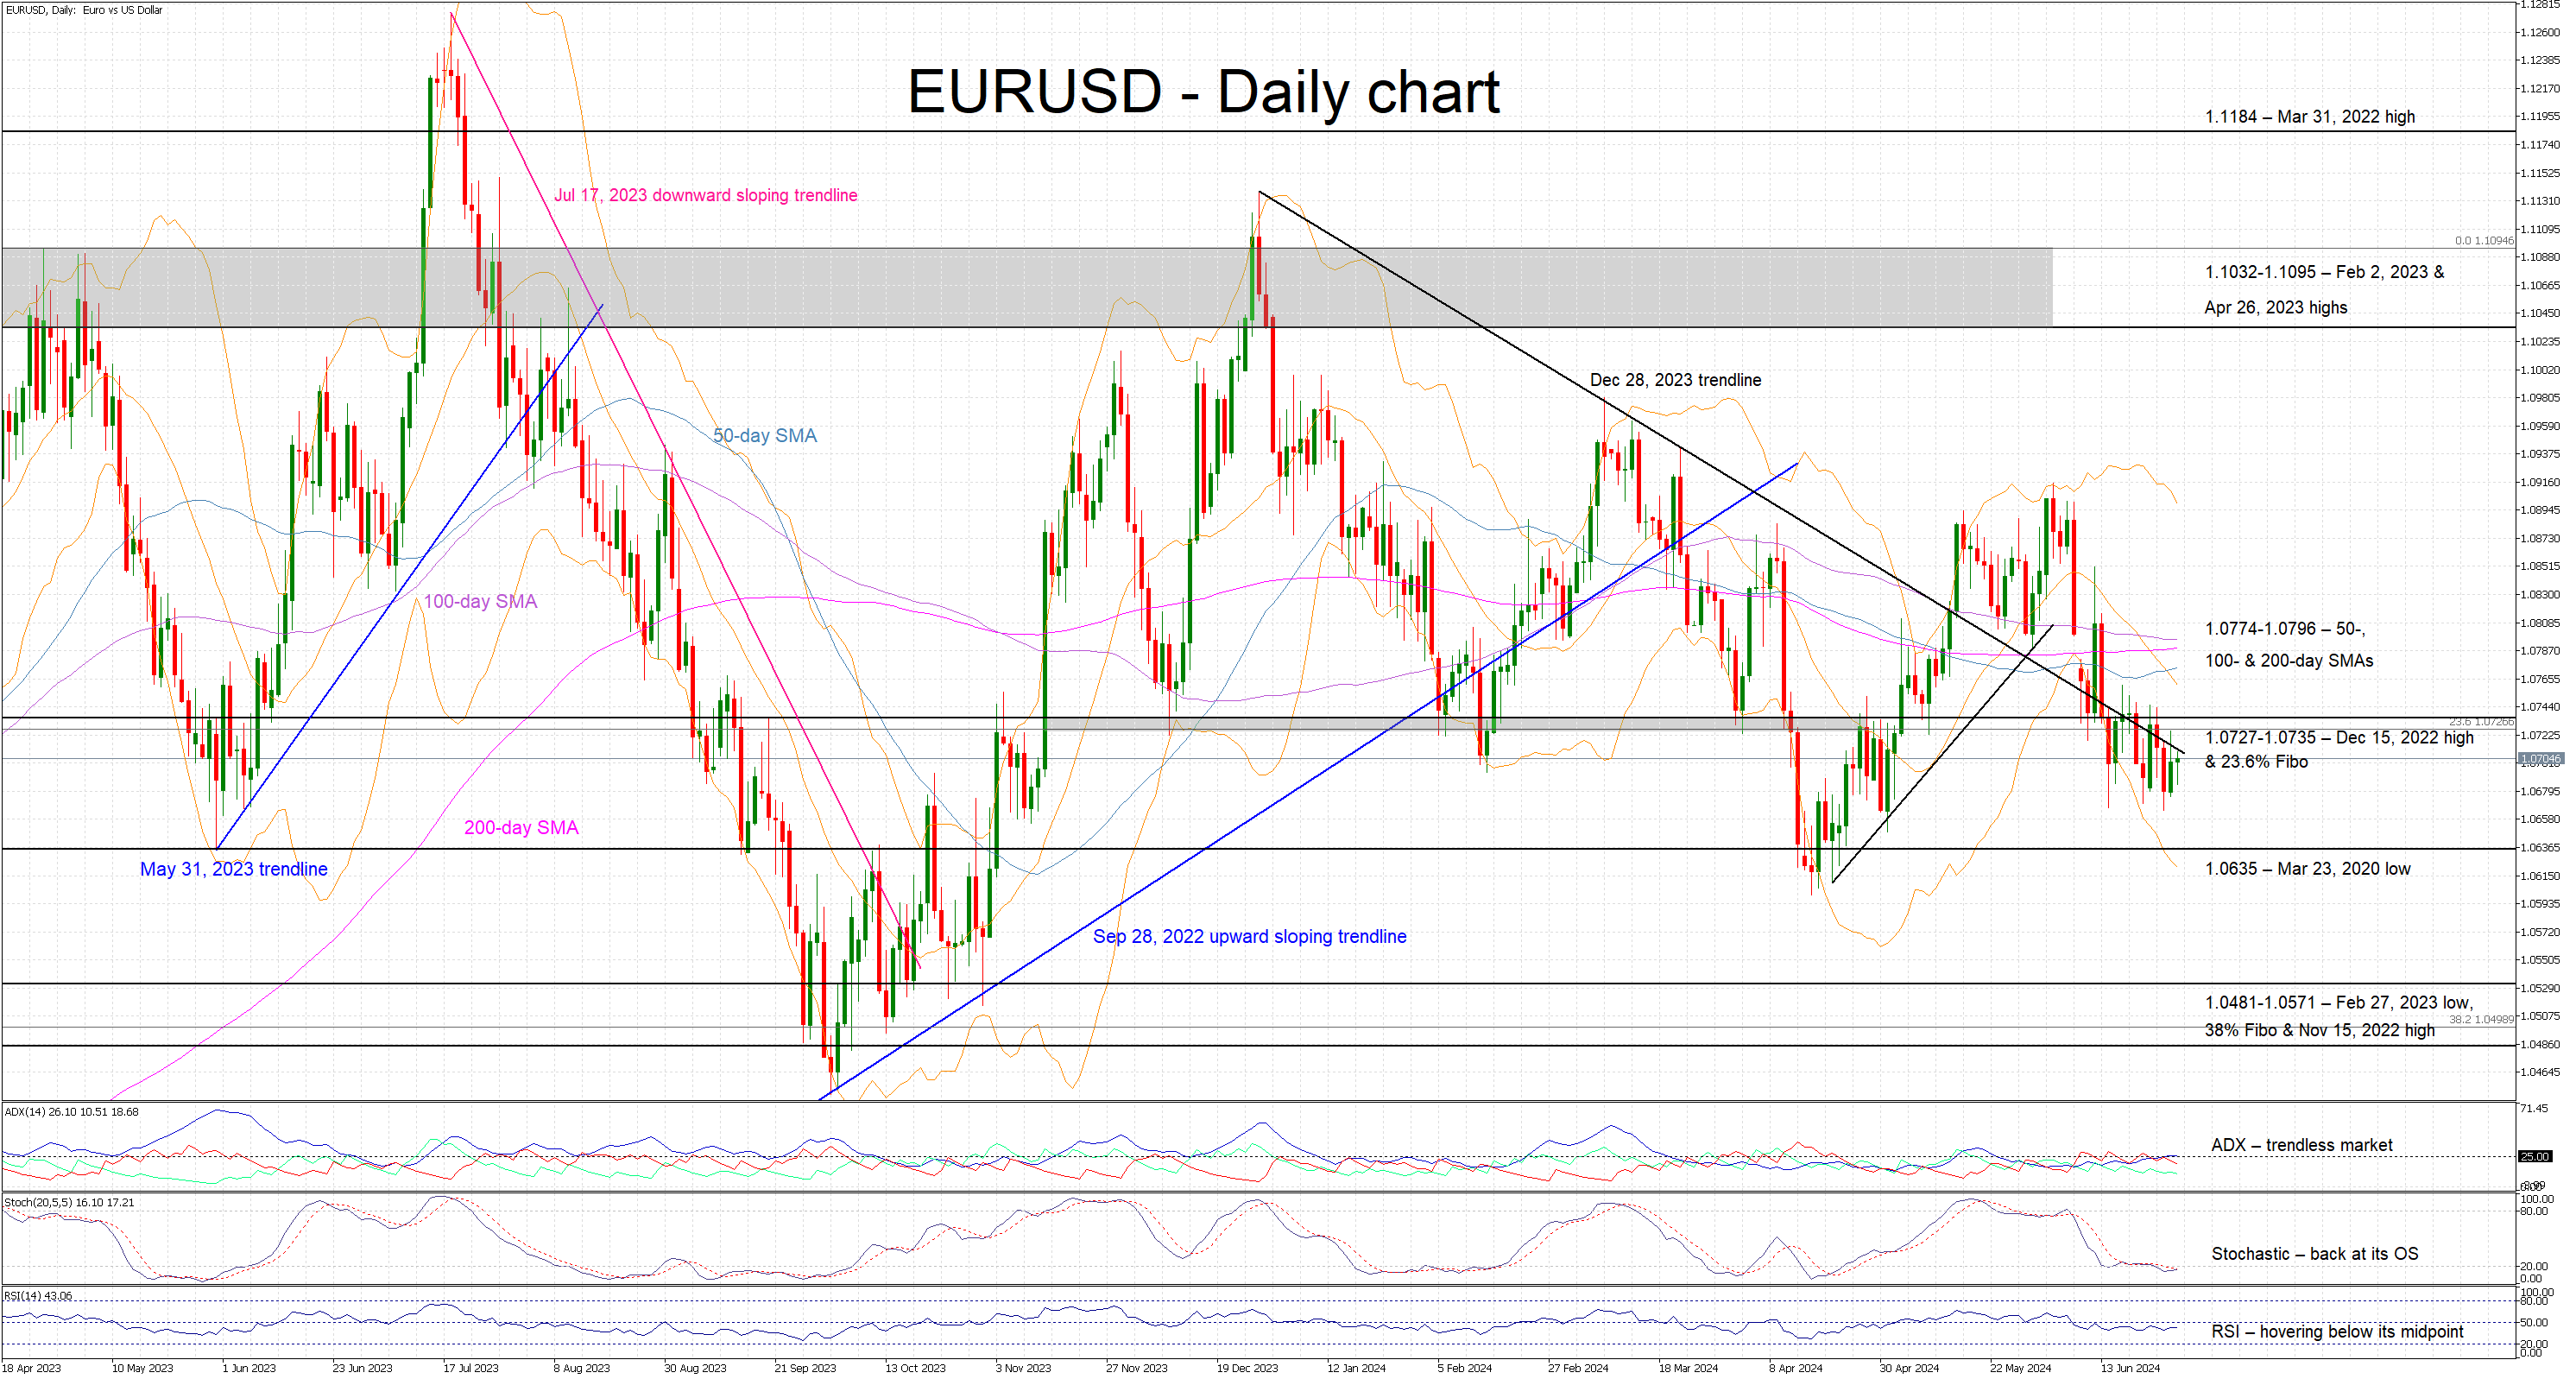
EURUSD levels to watch
In any case, the core PCE inflation index did not cause strong volatility in EURUSD today, leaving the pair below the nearby resistance of 1.0725. For the bulls to stay in the driver’s seat in the coming sessions, the pair must claim its simple moving averages (SMAs) within the 1.0770-1.0788 region in order to advance towards the 1.0850 barrier, which blocked buyers on June 12. Even higher, a sustainable rally above 1.0885 could shift the focus back to April’s upleg.
On the downside, sellers could take control below the 1.0660 support area, likely pressing the price towards the 1.0600 round level. If that floor cracks, the decline could worsen towards the 1.0515 area.

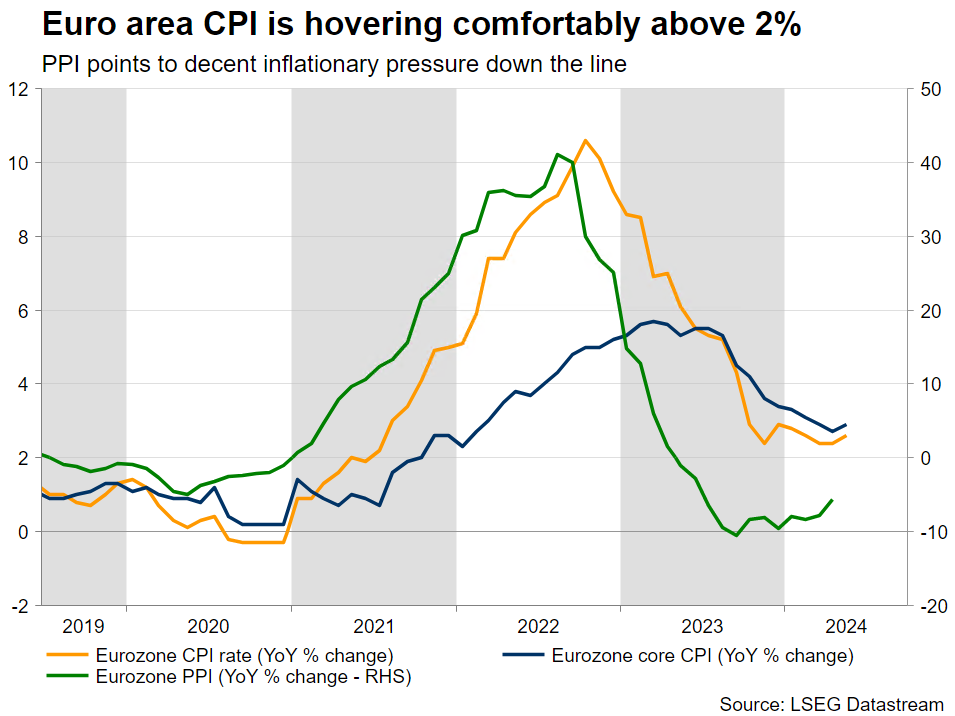
Eurozone CPI Report: Further Noise or a Proper Signal to Cut Rates Again?
- ECB members disagree about the rates outlook
- Key data releases including the June CPI figures
- A soft inflation report is unlikely to result in a dovish July ECB meeting
- Political risks keep the euro under pressure
The ECB hawks are clearly upset
It has been three weeks since the first ECB rate cut, and the situation feels very different to a traditional monetary policy easing cycle. Under normal conditions, every meeting would be considered a “live” one with most ECB members happily singing the same tune. However, this is not the case at this juncture.
The main message from the June 6 ECB gathering was that President Lagarde et al made the first crucial step, but they need to see a plethora of data confirming the disinflation process in order to cut rates again. This statement captures the sentiment in the ECB hawks’ ranks. They feel that they were pinned in the corner and hence forced to agree on a rate cut in June without really being convinced of the need for such an action.
However, they voted in favour of the rate move as backing down from a barrage of dovish comments, mostly from ECB doves, would have dealt another very serious blow to ECB’s credibility. Thursday’s release of the ECB meeting minutes could shed more light on the difficult behind-the-door discussions.
The barrier for another rate cut is higher now
The end product of this growing dichotomy is that the barrier for the next rate cut is much higher now. A month of weak data will not lead to a cut as the hawks want strong evidence that inflation is slowing down, especially in the services sector. Therefore, they appear determined to block any rate cut discussions until September when the new ECB staff projections will be ready. As such, the July meeting is not expected to produce a surprise.
The doves, though, remain committed to further ease monetary policy. Comments from ECB members Rehn and Knot about three rate cuts being reasonable in 2024 means that the debate during the next ECB meetings, starting with the July 18 one, could be described as hostile with President Lagarde facing her toughest challenge yet.
Maybe the ECB forum on Central Banking held in Sintra, Portugal on July 1-3 could help mend some of the ECB members’ differences. In addition, with the far-right parties faring well in the recent European elections, the ECB will probably draw even more criticisms than praise going forward. Hence, it is imperative for the next ECB actions to be extremely well thought-out and have the unanimous backing of the entire ECB council.
All eyes on the CPI report
At the end of the day, ECB members agree that the data will determine the ECB’s next steps. With the market most likely digesting the result of the first round of the French parliamentary election held this weekend, which could potentially unsettle even more the fragile European political scene, next week’s calendar starts on a high note.
The preliminary inflation report from Germany will be published on Monday with the Eurozone aggregate figures following on Tuesday. The final PMI surveys will also be released during the week with a decent chance of an upward revision in the German figures, but not in the French numbers as the local economy remains numb ahead of the parliamentary elections.
The market is currently expecting both the eurozone headline and core inflation rates to ease to 2.5% and 2.8% year-on-year respectively. The initial inflation prints from France, Italy and Spain point to a small possibility of an upside surprise to Tuesday’s prints. However, even in this case, the ECB doves will quickly try to dismiss the report. Chief Economist and Executive Board members Philip Lane has already been on the wires downgrading the importance of the monthly inflation reports, particularly when they are deemed to contain more noise than signaling power.
Euro remains under pressure as political risks linger
The euro remains on the backfoot against the US dollar as eurozone political risks linger and because the US continues to enjoy strong economic data that gradually push out the date of the first Fed rate cut. The outcome of the French elections could set the tone for next week, but the inflation report could quickly dictate the market moves.
A strong CPI report could help the euro reclaim the 1.0735 level and then tentatively open the door to a move towards the busier 1.0774-1.0796 area. On the flip side, a weak set of CPI prints might not increase the chances of a July ECB rate cut but it could add to the already negative market sentiment for the euro. A retest of the early April low at 1.0600 could reignite discussions about euro/dollar parity.
Week Ahead – French and UK Elections on the Horizon, US Jobs Report Eyed Too
- France and UK go to the polls; will elections bring chaos or order?
- US payrolls report for June awaited as Fed hawks don’t budge
- Eurozone CPI, Fed minutes and ECB forum also on investors’ radar
Macron’s gamble set to backfire
Political risks came back to haunt the euro in June as the resurgence in popularity for far-right parties sparked jitters in financial markets. France has been at the centre of this resurgence where Marine Le Pen’s National Rally party is on course to repeat its success in the European elections in the country’s legislative vote. The first round of the election takes place on Sunday, June 30, with the second round due a week later.
Most polls show that President Macron’s decision to call snap elections in the likely hope of forming a new coalition against the far right will not pay off. But markets are no longer as worried about a far-right government as they were in the immediate aftermath of the European election results. The National Rally party appears to have shifted towards the mainstream in its bid to appeal to more voters and secure an absolute majority, rowing back on some of its more radical pledges. It's even said it will abide by the EU’s fiscal rules, which has been music to investors’ ears.
A bigger problem now for the markets is the possibility of the left-wing coalition leading the next government, which is more likely to spend recklessly and trigger a Liz Truss-style debt crisis. The left-wing alliance has overtaken Macron’s Ensemble coalition in the polls so should it come a close second after the National Rally, it could be in a position to form the next government.
Markets seem just as worried about the prospect of political paralysis in the event of a hung parliament. Even if the major parties were to put their differences aside and agree to a unity government to end a stalemate or keep the far right out of power, there is a danger that it may not survive long, hence the nervousness in the markets.
Will flash CPI boost ECB cut bets?
A strong showing for the National Rally could send the euro as well as French stocks and bonds lower on Monday in a knee jerk reaction before potentially rebounding, whereas a better-than-expected outcome for the other parties might initially be seen as positive before caution sets in.
Uncertainty about the French elections as well as concerns about political stability in other Eurozone countries has already started to weigh on business confidence and should that begin to hurt the growth outlook, the European Central Bank would be less likely to hesitate to cut interest rates again.
On that front, policymakers will be closely monitoring Tuesday's flash CPI readings for the euro area following the surprise uptick in May in the headline figure to 2.6% y/y. The forecasts point to a small drop to 2.5% in June, which if confirmed, the euro could come under slight pressure as traders would raise their bets of a September cut.
But investors will be just as interested to hear what Lagarde & Co. will have to say on the price outlook during the three-day forum on central banking organized by the ECB in Sintra, Portugal. Fed officials, including Chair Powell will also be in attendance and take part in a panel discussion with President Lagarde on Tuesday.
UK’s Labour expected to win landslide
Across the Channel, there is less uncertainty surrounding the outcome of the UK general election on Thursday. Prime Minister Rishi Sunak has failed to turn the ruling Conservatives’ fortunes around despite a hard-fought campaign. The opposition Labour party are riding high in the opinion polls and could even win a supermajority.
As appealing as a stable government is for sterling right now given how tumultuous the past few years have been under the Tories, a weak opposition might worry some investors. There is a risk that the Conservatives might even be beaten to third place, losing out to Britain’s own far-right party, Reform UK, led by Brexiteer Nigel Farage.
However, it’s also possible that the Tories might do somewhat better than the polls suggest, giving Labour a narrower victory, and this could be positive for UK assets. But the real test for the pound will probably come after Keir Starmer has settled into Number 10 and the new finance minister, expected to be Rachel Reeves, has started to outline more details about Labour’s economic agenda.
Will NFP and ISM PMIs spoil the dollar’s bullish run?
With both the euro and pound gripped by domestic politics, investors are only slowly turning their attention to the upcoming US presidential election and monetary policy continues to be the dominant theme for the US dollar. The recent encouraging data on inflation as well as the signs of a slowdown in consumer spending and the housing market have bolstered hopes of a September rate cut by the Fed even though policymakers don’t yet seem convinced.
The ongoing tightness of the labour market is probably the main reason why the Fed is reluctant to drop its hawkish bias and Friday’s jobs report might not do much in changing that. Nonfarm payrolls are projected to have increased by 180k in June, which would be down from 272k in the prior month but still considered as a solid print.
The unemployment rate is forecast to have remained steady at 4.0% in June, while average hourly earnings are expected to have risen by 0.3% m/m versus 0.4% in May.
Ahead of the NFP release, there will be other gauges on the labour market, including the JOLTS job openings and Challenger layoffs on Tuesday, as well as the ADP employment report on Wednesday. In addition, the minutes of the June FOMC meeting will be published on Wednesday and may reveal more on policymakers’ thinking after most pencilled in just one cut for 2024 in the latest dot plot.
Should investors fail to get much clarity from the job indicators, they will focus more on the ISM PMIs. The manufacturing PMI is out on Monday and the services PMI follows on Wednesday.
The former is forecast to edge up to from 48.7 to 49.0, while the latter is expected to dip from 53.8 to 52.0. A weaker services PMI would be positive for Wall Street, as long as it doesn’t decline more than anticipated. But more importantly, markets will be hoping to see a deceleration in factory gate inflation.
The dollar is vulnerable to a selloff should the incoming data be broadly on the soft side following the steady gains over the past month.
Loonie and kiwi on data watch ahead of July rate decisions
Canada will also see the release of jobs numbers on Friday, which could prove crucial for the Bank of Canada’s July policy decision. Expectations for a rate cut next month fell sharply after the hotter-than-expected May CPI figures. Wage growth is also a bit of a concern as it accelerated to 5.2% y/y in May. Any moderation in June could lift the odds of a back-to-back rate cut, pulling the Canadian dollar lower.
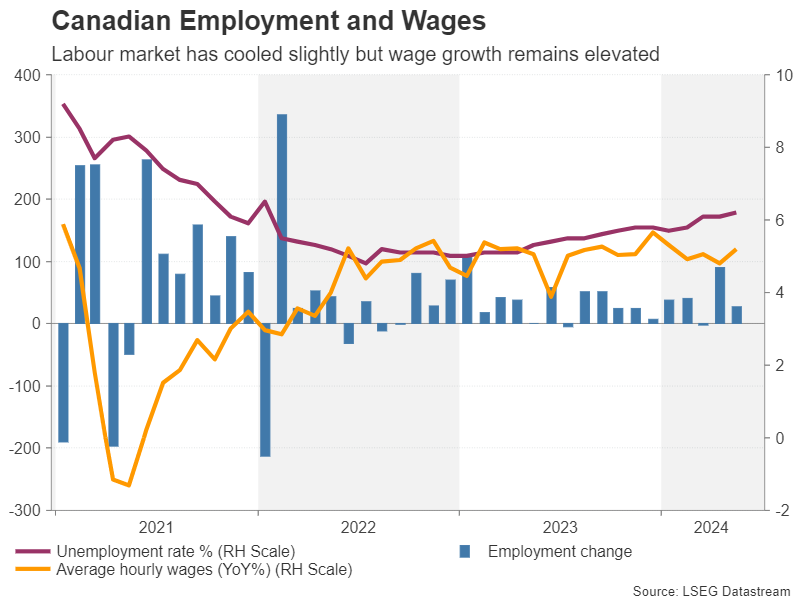
In the bigger picture, Canada’s labour market has been slowly cooling, with the jobless rate edging up from 2022’s post-pandemic lows, despite a healthy rise in employment.
In New Zealand, the kiwi will be keeping an eye on Tuesday’s NZIER business confidence gauge as the RBNZ’s next policy decision approaches on July 10, while its aussie cousin will be watching PMI numbers out of China.
The official manufacturing PMI due on Monday is expected to hold unchanged below 50 at 49.5 in June, but the Caixin equivalent is forecast to have eased slightly to 51.2.
Adding to Monday’s unusually busy start to the week is the Bank of Japan’s quarterly Tankan business survey. The outlook by businesses was likely little changed compared to the previous survey but which nevertheless doesn’t reflect the sluggish growth seen in the hard data. So, signs of ongoing optimism may offer the battered yen a supportive hand.