Sample Category Title
Cliff Notes: The Slow Grind
Key insights from the week that was.
In Australia, the release of the week was certainly the Monthly CPI Indicator for May which reported a lift in headline inflation from 3.6%yr in April to 4.0%yr – as Westpac forecast – and a lift in the annual trimmed mean from 4.1%yr to 4.4%yr. Being the mid-month of the quarter, the May release importantly provided an update on services inflation. While the acceleration in service inflation from 4.0%yr to 4.8%yr was headline grabbing, the underlying composition was of less concern.
To start, the surge in holiday travel and accommodation – which has the equal-highest weight within the services category – surged from –6.2%yr in April to +2.9%yr in May; however, this was largely due to base effects as May 2023’s massive 11.3%mth decline cycled out of the annual rate calculation. Other major services components were either unmeasured, unchanged, or even down slightly in the case of rents and restaurant meals, while small services components were mixed. Goods inflation meanwhile held flat at 3.3%yr.
This detail emphasises the importance of gauging measures which smooth out volatility, such as the index that excludes ‘volatile items’ and holiday travel. In May, this measure moderated from 4.1%yr to 4.0%yr in contrast to the lift in headline inflation. While still consistent with persistent inflation pressures, it does not suggest a re-acceleration in price pressures or new risks.
In this week’s essay, Chief Economist Luci Ellis considers how this update may be perceived by the RBA, drawing on information from this week’s speeches from RBA Assistant Governor (Financial Markets) Kent on Tuesday and Deputy Governor Hauser last night.
Against this backdrop, it is hardly surprising that consumer confidence remains weak. The June Westpac-MI Consumer Sentiment Survey reported a slight 1.3% improvement to 83.6, a level only previously seen during other major economic dislocations. A lift across both ‘family finances vs a year ago’ (+9.7% to 69.3) and ‘time to buy a major item’ sub-indexes (+4.2% to 79.7) is certainly welcome, but both sub-indexes also remain well below their respective long-run averages (88.3 and 124.4 respectively). Views around the labour market also look to have shifted from constructive to cautious, consistent with a softening labour market and moderating job vacancies.
Crucial to the near-term outlook for confidence will be households’ responses to imminent fiscal stimulus, both state and federal, and their views on the chances and scale of interest rate relief. On the latter, the latest updates are not encouraging. Sentiment deteriorated materially between those surveyed before the RBA policy meeting (90.0) and after (80.1), suggesting the RBA’s ‘vigilance’ to upside inflation risks was a cause for concern. Indeed, Westpac-MI mortgage rate expectations correspondingly surged, with around half of consumers now anticipating an increase in mortgage rates over the next year.
Before moving offshore, a final note on industry. The Q2 ACCI-Westpac Business Survey showcased an improvement in conditions for the manufacturing sector moving into mid-year, the Westpac-ACCI Actual Composite lifting back into expansionary territory, from 43.4 to 54.1, after a slower-than-usual start to the year. The rebound in new orders and subsequent lift in output growth was key, both of which have scope to continue contributing positively over the period ahead, not only in manufacturing but also the broader economy (as explored in our latest Coast-to-Coast). However, the survey reminds us that there remain significant challenges facing the sector, particularly around difficulties in finding skilled labour and elevated cost pressures, which are in part being passed on in the form of higher prices. The survey adds to the evidence that supports the RBA’s “vigilant” stance to possible upside inflation risks; but as emphasised above, the Q2 CPI update will be all-important in gauging the extent to which these may materialise.
Offshore, the data this week was mixed, as was commentary from FOMC members.
Canadian inflation surprised to the upside in May, the CPI rising 0.6% against a 0.3% expectation, leaving annual inflation at 2.9%yr compared to 2.7%yr in April. The average of the two core measures is also around 2.9%yr, from 2.7%yr. Unsurprisingly, services inflation was behind the lift in headline and core inflation, accelerating to 4.6%yr from 4.0% previously. While one month’s data does not make a trend, the May outcomes make clear that monetary policy normalisation is likely to prove protracted and result in a return to near neutral policy, not an expansionary setting.
In the US, Q1 GDP edged higher in the third estimate from 1.3% annualised to 1.4%. However, revisions to the detail pointed to softer private demand and inflation prospects. Upward revisions to growth in business investment (from 6.0% annualised to 7.0%), government spending (from 1.3% annualised to 1.8%) and the contribution from net exports (from -0.89ppts to -0.65ppts) were offset by weaker momentum in consumption (growth marked down from 2.0% to 1.5% annualised). Below-trend momentum for the consumer has also been seen at the start of Q2, justifying a belief that demand pressures for inflation are continuing to dissipate.
Durable goods orders held up better than expected in May, rising 0.1%. However, the 0.4% downward revision to April offset the upside surprise in May. Core durable orders (ex transport and defence) were weak in May at -0.6% and April's small gain was little changed at 0.3%, suggesting a decline in real business equipment investment in Q2. The regional Fed manufacturing gauges released this week also pointed to weakness in the business sector, but initial jobless claims remained near their historic lows. It is little wonder that the US consumer remains concerned about the near-term outlook while remaining constructive on medium-term prospects.
Commentary from FOMC members this week was atypical, with concern shown over both downside risks to activity and upside risks for inflation. Thankfully, these risks are not expected to coincide. Rather the varied views speak to a high degree of uncertainty over the outlook. In an interview with CNBC, Chicago Fed President Goolsbee highlighted "a couple of warning signs" with respect to consumer demand. San Francisco Fed President Daly separately noted that we "are getting nearer to a point where the outcomes on employment might be less benign", i.e. where firms need to reduce employment levels not just the pace of hiring. Fed Governor Cook subsequently provided a balanced view on the outlook, consistent with the median expectations of the Committee. Fed Governor Bowman instead focused on upside price risks. Both Governors saw 2025 as the year when inflation would materially decelerate from its current level to near target. Underlying this view is an expectation of persistent strength in the economy and, arguably, little weight on the downside risks that Presidents Daly and Goolsbee highlighted.
Elliott Wave Intraday Analysis Looking for USDCHF to Correct in Wave 2
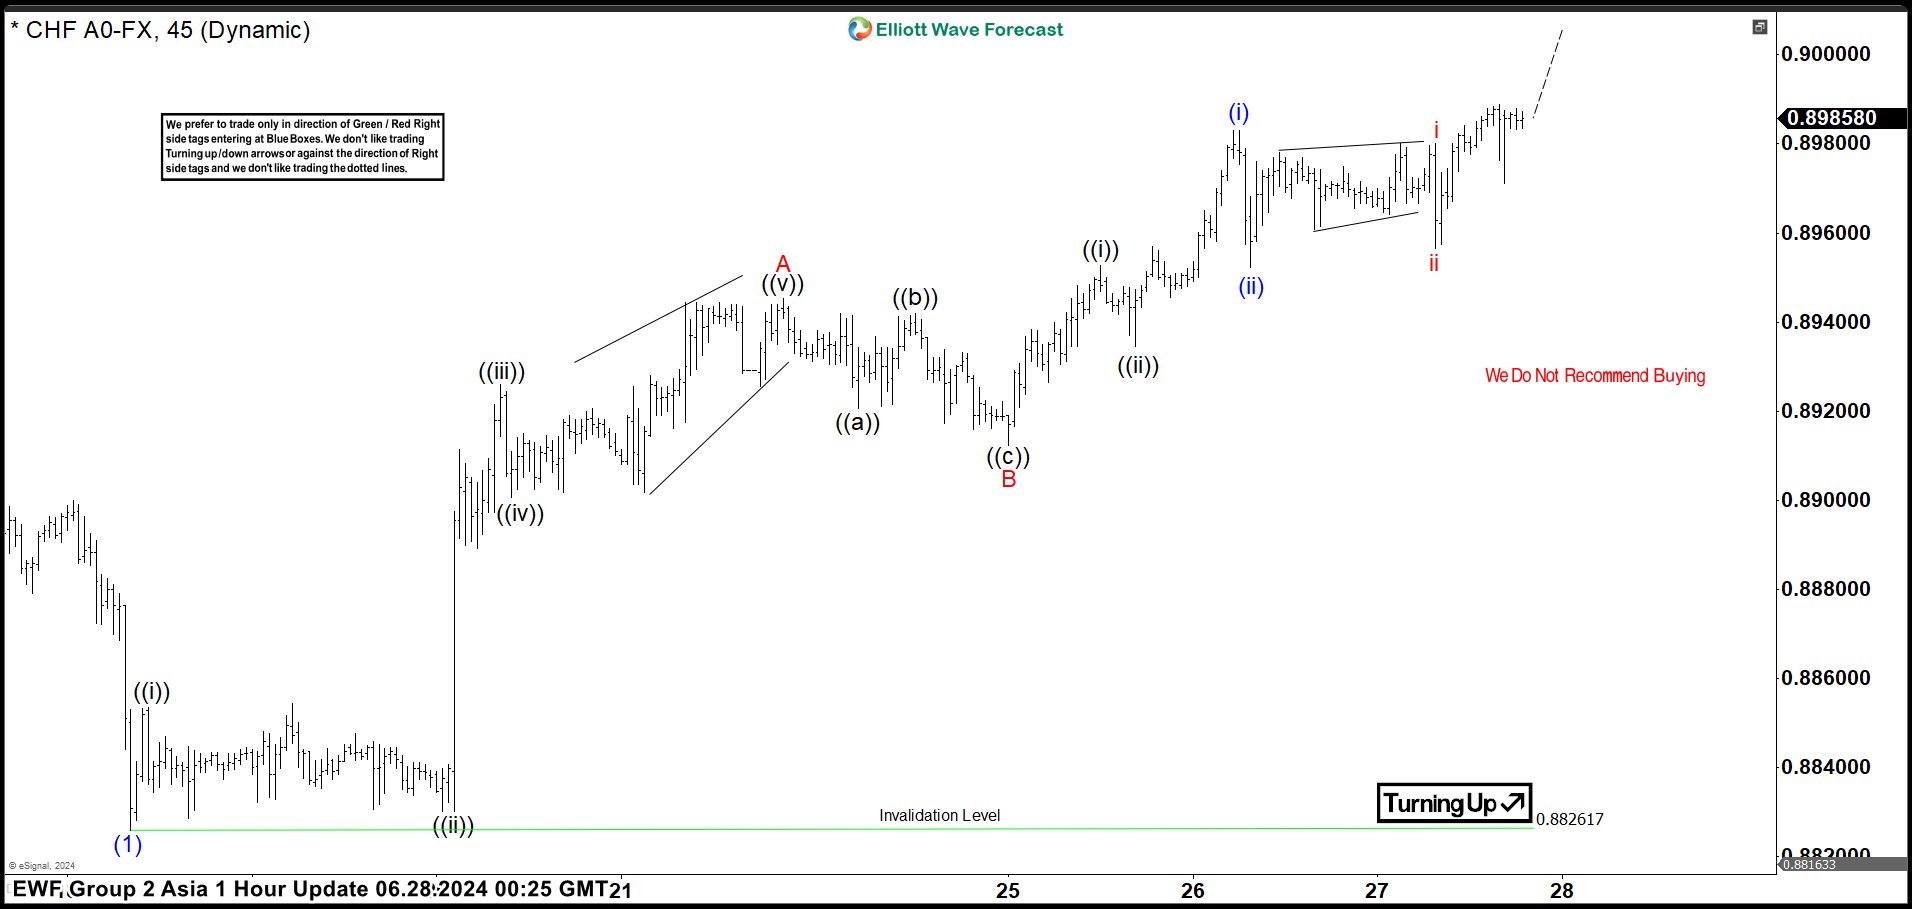
Short Term Elliott Wave in USDCHF suggests pair ended the move down from 5.1.2024 high as wave (1) at 0.882. Wave (2) corrective rally is now in progress to correct cycle from 5.1.2024 high. Internal subdivision of wave (2) is unfolding as a zigzag Elliott Wave structure. Up from wave (1), wave ((i)) ended at 0.8853 and dips in wave ((ii)) ended at 0.883. Pair extended higher in wave ((iii)) towards 0.8926 and pullback in wave ((iv)) ended at 0.89. Final leg wave ((v)) ended at 0.8945 which completed wave A in higher degree.
Down from wave A, wave ((a)) ended at 0.892 and rally in wave ((b)) ended at 0.8942. Wave ((c)) lower ended at 0.8912 which completed wave B in higher degree. Pair has resumed higher in wave C. Up from wave B, wave ((i)) ended at 0.895 and pullback in wave ((ii)) ended at 0.8934. Pair extended higher in wave (i) towards 0.8983 and pullback in wave (ii) ended at 0.8952. Up from there, wave i higher ended at 0.898 and pullback in wave ii ended at 0.8956. Near term, as far as pivot at 0.882 low stays intact, expect pullback to find support in 3, 7, or 11 swing and pair to extend higher. ind support in 3, 7, or 11 swing for further upside.
USDCHF 45 Minutes Elliott Wave Chart
USDCHF Elliott Wave Video
https://www.youtube.com/watch?v=JEa7vn_4E4s
Euro, Yen Under Pressure, USD Bid
Mood yesterday was mixed on a series of mixed economic and corporate news. In Europe, the business and consumer survey came in slightly lower than expected, the CAC 40 lost more than 1%, the Stoxx 600 fell. The German stocks did better than their European peers as some big names like Siemens and SAP outperformed, while in the UK, the FTSE 100 sank below its 50-DMA despite a softer pound and a positive breakout in oil prices.
US crude finally cleared the critical $82pb resistance, and returned to the positive trend that was building at the start of the year. The April to June selloff is fully behind us now, trend and momentum indicators remain positive while the market is not yet in the overbought territory meaning that there is room for further gains in the short run. From a technical perspective, the outlook has improved. From a fundamental point of view, news are supportive as well. Yesterday’s GDP update from the US confirmed that the US economy slowed in Q1 to grow just 1.4%, but the print was slightly better than the 1.3% expected, and down from 3.4% printed a quarter earlier. Sales and consumer spending halved, inventories rose. Price indications were not enchanting but investors looked past these components as the uptick we saw in first quarter inflation is thought to have slowed past the Q1. All in all data was positive for the reflation trade.
Other than that, the US trade deficit widened to highest levels in 2 years, pending home sales fell 2% and the jobless claims rose to the highest levels since last summer. Data hinted at further slowdown in the US economy, but the slowdown didn’t look catastrophic. As such, the data fueled the dovish Fed expectations and boosted appetite for the US treasuries, as well, along with a strong sale of 7-year bonds, following good sales of 2 and 5-year bonds earlier in the week. The US 2-year yield tested but remained above the 4.70% level, the 10-year yield fluctuated near 4.30%. The S&P500 and Nasdaq eked out small gains as Federal Reserve (Fed) rate cut hopes rose, with some investors expecting up to two rate cuts from now to the end of the year, and the US dollar eased, but rebounded in Asia as the presidential debate between Trump and Biden favoured… Trump.
There is one more thing to watch before this week ends: the core PCE data – the Fed’s favourite gauge of inflation that’s expected to show further weakness in both headline and core numbers. If that’s the case, combined with yesterday’s softish growth data, we could see the Fed doves remain in charge of the market. The latter could help broaden the US stock rally to non-tech sectors, and toward the reflation-friendly European markets.
Euro under pressure
Some Eurozone countries will reveal their preliminary inflation numbers for June today. Sufficiently soft data is needed to keep the European Central Bank (ECB) doves alive, but for the euro, the upcoming French election this weekend is probably more important than the inflation figures as regardless of the data – unless we see something very much unexpected – many investors will probably chose to go into the French election weekend without a positive exposure to the euro given that Marine Le Pen’s National Rally is seen securing one vote out of three, and that’s not the outcome that the market is happy with. The spread between the French and German 10-year yield is back above 80bp and could further widen depending on the French election outcome. Higher yield differential means lower appetite for euro. It could be that a blow to Macron has already priced in (and overly priced in) and the euro could rebound in a typical ‘buy the rumour sell the fact’ move on Monday open, but volatility will likely be on the menu and the euro could – regardless of the inflation figures on both sides of the Atlantic – further ease against the greenback before the weekly close. The EURUSD currently trades below 1.07 mark. We could see the pair fall below the 1.0660 level – that acted as a support since Macron called for the snap election.
A last word for the yen: the USDJPY was trading past the 161 level this morning, with no news of intervention on the wire just yet. The yen bears are looking for the limit, while the risk of intervention grows with every pip higher.
EUR/JPY Daily Outlook
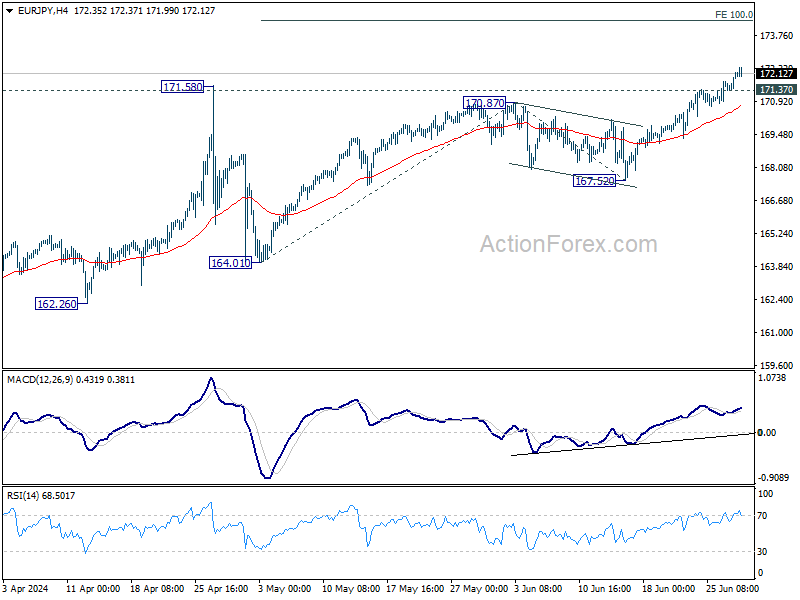
Daily Pivots: (S1) 171.60; (P) 171.89; (R1) 172.38; More...
Intraday bias in EUR/JPY remains on the upside as up trend continues. Next target is 100% projection of 164.01 to 170.87 from 167.52 at 174.38. On the downside, below 171.37 minor support will turn intraday bias neutral and bring consolidations first, before staging another rally.
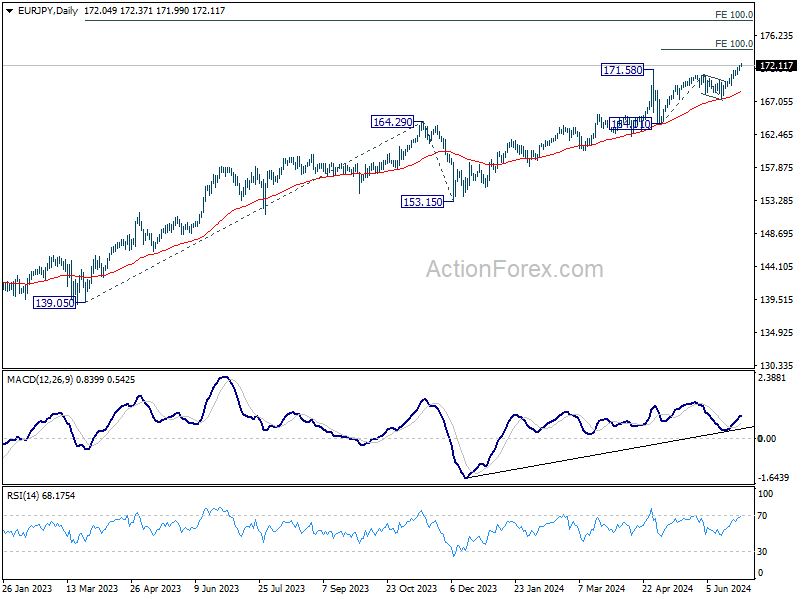
In the bigger picture, strong support from 55 D EMA indicates that the long term up trend is still in progress. Decisive break of 171.58 will confirm resumption and target 100% projection of 139.05 to 164.29 from 153.15 at 178.38. For now outlook will stay bullish as long as 164.01 support holds, even in case of deep pullback.
Dollar Gains Traction Ahead of Key Inflation Data, Yen Struggles Despite Stronger Tokyo CPI
Dollar is showing renewed strength in Asian session, particularly against commodity currencies. Market reactions to the televised debate between US President Joe Biden and former President Donald Trump have been muted, with traders shifting their focus to upcoming inflation data.
Both headline and core PCE inflation are expected to dip to 2.6% in May. For Fed to consider lowering interest rates, disinflation needs to show consistent progress for several more months. Currently, Fed fund futures indicate around a 65% chance of a 25bps rate cut in September.
Yen continues to weaken despite stronger-than-expected Tokyo CPI core readings. BoJ has explicitly indicated a possible rate hike in July. But even if it materializes, it is likely to be more symbolic than impactful. Recent global inflation surprises suggest that the interest rate gap between Japan and other major economies will remain wide for the foreseeable future.
Meanwhile, Japan has appointed a new top currency diplomat, Atsushi Mimura, to replace Masato Kanda starting July 31. It remains to be seen if Mimura will implement significant changes to Japan's strategy regarding Yen's prolonged depreciation.
In the broader currency markets, Dollar is currently the top performer for the week, followed by Euro and Sterling. New Zealand Dollar is the weakest, trailed by Yen and Swiss Franc. Australian and Canadian Dollars are positioned in the middle.
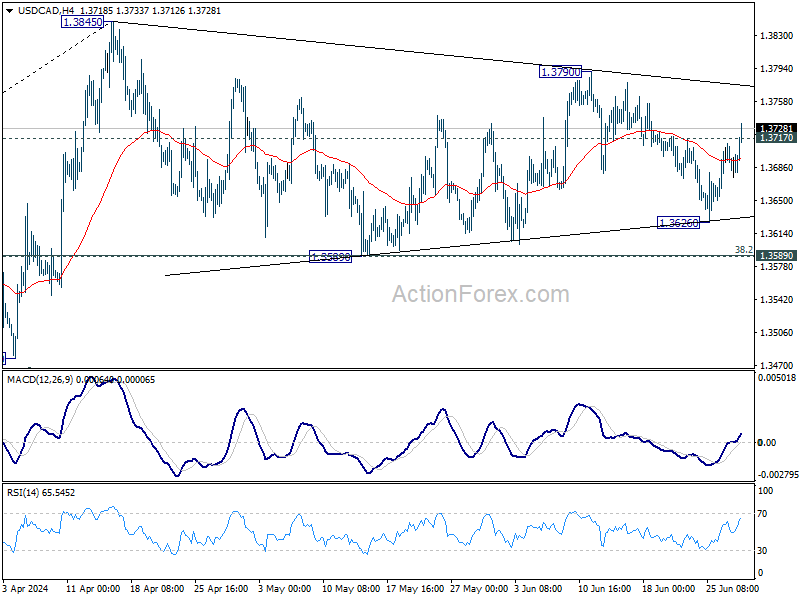
Technically, USD/CAD's break of 1.3717 resistance suggests that fall from 1.3790 has completed at 1.3626 already. The whole corrective pattern from 1.3845 might be finished with three waves to 1.3626 too. Further rise is now in favor to 1.3790 resistance first. Decisive break there will raise the chance of larger up trend resumption through 1.3845. The next significant moves will probably be influenced by today's US PCE inflation data and Canada's GDP release.
In Asia, at the time of writing, Nikkei is up 0.71%. Hong Kong HSI is up 0.56%. China Shanghai SSE is up 0.98%. Singapore Strait Times is down -0.24%. Japan 10-year JGB yield is down -0.0025 at 1.071. Overnight, DOW rose 0.09%. S&P 500 rose 0.09%. NASDAQ rose 0.30%. 10-year yield fell -0.028 to 4.288.
Tokyo CPI surpasses expectations, Japan's industrial output rebounds
Japan's Tokyo CPI core (excluding food) rose to 2.1% yoy in June, beating expectations of 2.0% yoy and up from May's 1.9% yoy. CPI core-core (excluding food and energy) increased from 1.7% yoy to 1.8% yoy. Headline CPI also ticked up from 2.2% to 2.3% year-on-year. Monthly figures showed Tokyo's CPI core rose by 0.4% mom, core-core by 0.3% mom, and headline CPI by 0.3% mom.
In addition, Japan's industrial production saw a significant boost in May, rising 2.8% mom, surpassing the forecasted 2.0%. Of the 15 industrial sectors covered, 13 reported higher output while only two experienced declines.
A Ministry of Economy, Trade and Industry official noted, "The private sector's sentiment toward output is improving as auto production started to pick up." Despite this, the ministry maintained its previous assessment that industrial production "showed weakness while fluctuating indecisively." According to a poll of manufacturers, output is expected to decrease by -4.8% in June but increase by 3.6% in July.
Fed's Bowman cites multiple risks to inflation, rules out rate cuts for now
In a speech overnight, Fed Governor Michelle Bowman reiterated that Fed is "still not yet at the point where it is appropriate to lower the policy rate." She emphasized that several upside risks to inflation persist, making it premature to consider rate cuts.
Bowman highlighted several concerns impacting inflation. She noted that further improvements on the supply side are unlikely, and geopolitical developments could disrupt global supply chains, adding to inflationary pressures. Additionally, loosening in financial conditions might increase demand, potentially stalling disinflation progress. Furthermore, increased immigration and continued labor market tightness could lead to persistently high core services inflation.
Bowman stressed that monetary policy is "not on a preset course." She remains willing to raise interest rates if incoming data suggest that progress on inflation has stalled or reversed.
Looking ahead
Germany import price index and unemployment, France consumer spending, UK Q1 GDP final, and Swiss KOF economic barometer will be released in European session.
Later in the day, Canada will publish GDP. US will release personal income and spending, PCE price index, Chicago PMI.
EUR/JPY Daily Outlook
Daily Pivots: (S1) 171.60; (P) 171.89; (R1) 172.38; More...
Intraday bias in EUR/JPY remains on the upside as up trend continues. Next target is 100% projection of 164.01 to 170.87 from 167.52 at 174.38. On the downside, below 171.37 minor support will turn intraday bias neutral and bring consolidations first, before staging another rally.
In the bigger picture, strong support from 55 D EMA indicates that the long term up trend is still in progress. Decisive break of 171.58 will confirm resumption and target 100% projection of 139.05 to 164.29 from 153.15 at 178.38. For now outlook will stay bullish as long as 164.01 support holds, even in case of deep pullback.
Economic Indicators Update
| GMT | Ccy | Events | Actual | Forecast | Previous | Revised |
|---|---|---|---|---|---|---|
| 23:30 | JPY | Tokyo CPI Y/Y Jun | 2.30% | 2.20% | ||
| 23:30 | JPY | Tokyo CPI ex Fresh Food Y/Y Jun | 2.10% | 2.00% | 1.90% | |
| 23:30 | JPY | Tokyo CPI ex Food & Energy Y/Y Jun | 1.80% | 1.70% | ||
| 23:30 | JPY | Unemployment Rate May | 2.60% | 2.60% | 2.60% | |
| 23:50 | JPY | Industrial Production M/M May P | 2.80% | 2.00% | -0.90% | |
| 01:30 | AUD | Private Sector Credit M/M May | 0.40% | 0.40% | 0.50% | |
| 05:00 | JPY | Housing Starts Y/Y May | -6.00% | 13.90% | ||
| 06:00 | EUR | Germany Import Price Index M/M May | 0.20% | 0.70% | ||
| 06:00 | GBP | GDP Q/Q Q1 F | 0.60% | 0.60% | ||
| 06:00 | GBP | Current Account (GBP) Q1 | -17.7B | -21.2B | ||
| 06:45 | EUR | France Consumer Spending M/M May | 0.20% | -0.80% | ||
| 07:00 | CHF | KOF Economic Barometer Jun | 100.5 | 100.3 | ||
| 07:55 | EUR | Germany Unemployment Change Jun | 15K | 25K | ||
| 07:55 | EUR | Germany Unemployment Rate Jun | 5.90% | 5.90% | ||
| 12:30 | CAD | GDP M/M Apr | 0.30% | 0.00% | ||
| 12:30 | USD | Personal Income M/M May | 0.40% | 0.30% | ||
| 12:30 | USD | Personal Spending M/M May | 0.30% | 0.20% | ||
| 12:30 | USD | PCE Price Index M/M May | 0.00% | 0.30% | ||
| 12:30 | USD | PCE Price Index Y/Y May | 2.60% | 2.70% | ||
| 12:30 | USD | Core PCE Price Index M/M May | 0.10% | 0.20% | ||
| 12:30 | USD | Core PCE Price Index Y/Y May | 2.60% | 2.80% | ||
| 13:45 | USD | Chicago PMI Jun | 40 | 35.4 | ||
| 14:00 | USD | Michigan Consumer Sentiment Index Jun F | 65.6 | 65.6 |
Tokyo CPI surpasses expectations, Japan’s industrial output rebounds
Japan's Tokyo CPI core (excluding food) rose to 2.1% yoy in June, beating expectations of 2.0% yoy and up from May's 1.9% yoy. CPI core-core (excluding food and energy) increased from 1.7% yoy to 1.8% yoy. Headline CPI also ticked up from 2.2% to 2.3% year-on-year. Monthly figures showed Tokyo's CPI core rose by 0.4% mom, core-core by 0.3% mom, and headline CPI by 0.3% mom.
In addition, Japan's industrial production saw a significant boost in May, rising 2.8% mom, surpassing the forecasted 2.0%. Of the 15 industrial sectors covered, 13 reported higher output while only two experienced declines.
A Ministry of Economy, Trade and Industry official noted, "The private sector's sentiment toward output is improving as auto production started to pick up." Despite this, the ministry maintained its previous assessment that industrial production "showed weakness while fluctuating indecisively." According to a poll of manufacturers, output is expected to decrease by -4.8% in June but increase by 3.6% in July.
Fed’s Bowman cites multiple risks to inflation, rules out rate cuts for now
In a speech overnight, Fed Governor Michelle Bowman reiterated that Fed is "still not yet at the point where it is appropriate to lower the policy rate." She emphasized that several upside risks to inflation persist, making it premature to consider rate cuts.
Bowman highlighted several concerns impacting inflation. She noted that further improvements on the supply side are unlikely, and geopolitical developments could disrupt global supply chains, adding to inflationary pressures. Additionally, loosening in financial conditions might increase demand, potentially stalling disinflation progress. Furthermore, increased immigration and continued labor market tightness could lead to persistently high core services inflation.
Bowman stressed that monetary policy is "not on a preset course." She remains willing to raise interest rates if incoming data suggest that progress on inflation has stalled or reversed.
When Stars Collide
This week’s inflation data was in line with Westpac’s expectations. But what matters is whether the RBA was surprised. We do not think it was, and note that despite personnel changes, the RBA’s analysis and strategy have not changed.
This week’s inflation data were not a surprise to the Westpac Economics team and so did not change our view of the outlook for interest rates. As our Westpac Economics colleague Justin Smirk previewed last week, we had expected that base effects would lead the monthly indicator to print at 4% over the year to May. Clearly, the disinflation journey is becoming more difficult, and the RBA is becoming more nervous that its strategy may not work as planned. And as our colleague Pat Bustamante also highlighted recently, some recent state government budgets are not helping.
The real question is not whether we were surprised by the May inflation data but whether the RBA was. We can assume that the staff know how to account for one-off factors like changes in electricity rebates, or noise factors such as fruit and vegetable prices. Given their above-market forecast for June quarter headline CPI in the May Statement on Monetary Policy, we suspect that this week’s data were no surprise to the RBA, either. An ugly June quarter CPI release together with strong labour market data could tip the balance and force a rate hike, but this is not our base case and is not supported by currently available information.
In this context, the Deputy Governor’s speech last night was an important steer on the Bank’s view. While the speech itself was not about current developments, Deputy Governor Hauser reminded the audience that services inflation was in fact declining, and that ‘it would be a bad mistake to set policy on the basis of one number’. As well as highlighting the quarterly CPI, Deputy Governor Hauser pointed to retail sales and the labour market as key pieces of information yet to come.
Last night’s speech is part of a sequence of public events introducing the new Deputy Governor to the Australian audience. A previous milestone in that sequence, an interview in the Australian Financial Review earlier this month, also ruled out a potential policy risk in a way that has perhaps not been fully appreciated.
Recall that both the Deputy Governor and chief economist are new to the Bank and (compared with their predecessors) relatively new to Australia and Australian economic data. In addition, both the Heads of Economic Analysis and Economic Research will be vacating their posts shortly, for different reasons. Less well known (but evident from LinkedIn) is that the deputy heads of department in that group have also or are about to move to other roles in the RBA or BIS secondments. Given this decline in collective experience in reading the Australian economy, and particularly the country-specific nuances of the data (which all economies have), there was always a risk that the new leadership would take a different direction and adopt a different strategy and/or approach to reading the economy, for better or worse.
In our view, the Deputy Governor’s interview shows that this risk has not eventuated. The RBA continues to hold onto the priorities forged from earlier experience. The loss of experience has not translated into a loss of insight. In that interview, Deputy Governor Hauser spoke of importance of full employment, that the unemployment rate consistent with full employment could change, and that you needed to ‘test’ where it was. In other words, the RBA is continuing with the strategy articulated by the previous Governor to ‘protect the employment gains’ (Deputy Governor Hauser’s words) that were achieved in the aftermath of the pandemic. The refreshed Statement on the Conduct of Monetary Policy has solidified that strategy.
These insights are longstanding views of the Bank, first articulated before the pandemic in a pair of speeches in 2019 by the then Governor and the then chief economist. In the latter speech, I emphasised that ‘the level of the NAIRU [the sustainable unemployment rate around which inflation is stable] is an emergent property of the system. It is not baked in.’
While the nod to complexity theory in that reference to emergent properties might not be front of mind for the current leadership, the underlying analysis still seems to be. Further evidence of this recognition can be seen in the Bulletin article articulating the RBA’s approach to assessing full employment.
Related to this, this week’s speech by the Assistant Governor for Financial Markets highlighted that the RBA does still think that policy is currently tight. This speech was used as a vehicle to present updated estimates of the neutral nominal cash rate, noting that it, too, can and has changed. Again, we see a recognition at the RBA that these ‘star’ variables can shift.
A similar view of the likely neutral level of the interest rate structure informs our own view of the medium-term outlook. As we noted back in March:
In this context, one can interpret the Westpac Economics forecast for the cash rate at the end of 2025 of 3.1% as either neutral, with a neutral real rate a bit below 1%, or slightly below neutral with a higher neutral real rate. Given the uncertainties around both the outlook and the level of the neutral rate in any one period, we are agnostic about which interpretation turns out to be the right one. It might be that one will never be able to tell the difference.
The difficulty, though, is that the full-employment rate of unemployment seems to have fallen over recent years, while the estimates of the neutral interest rate point to it being higher than before the pandemic. The RBA’s recent commentary suggests that the former is more salient in the near term – consistent with wages growth already rolling over but contrary to some market commentary. But the latter limits the scope for rate cuts, when they do eventually come. A particularly bad scenario would be if both invisible benchmarks end up being overestimated. In that case, the ‘stars’ would collide to produce a period of overly high rates and slow growth.
USD/JPY Bulls Reign Supreme: Insights Into The Bullish Trend
Key Highlights
- USD/JPY rallied and tested the 160.80 zone.
- A major bullish trend line is forming with support at 159.80 on the 4-hour chart.
- EUR/USD is consolidating above the 1.0670 support zone.
- GBP/USD spiked lower toward 1.2600 before it recovered some losses.
USD/JPY Technical Analysis
The US Dollar remained in a strong uptrend above the 157.50 level against the Japanese Yen. USD/JPY cleared the 160.00 resistance to move further into a positive zone.
Looking at the 4-hour chart, the pair settled above the 160.00 level, the 100 simple moving average (red, 4-hour), and the 200 simple moving average (green, 4-hour). The bulls remained in control and even pumped the pair toward the 160.80 zone.
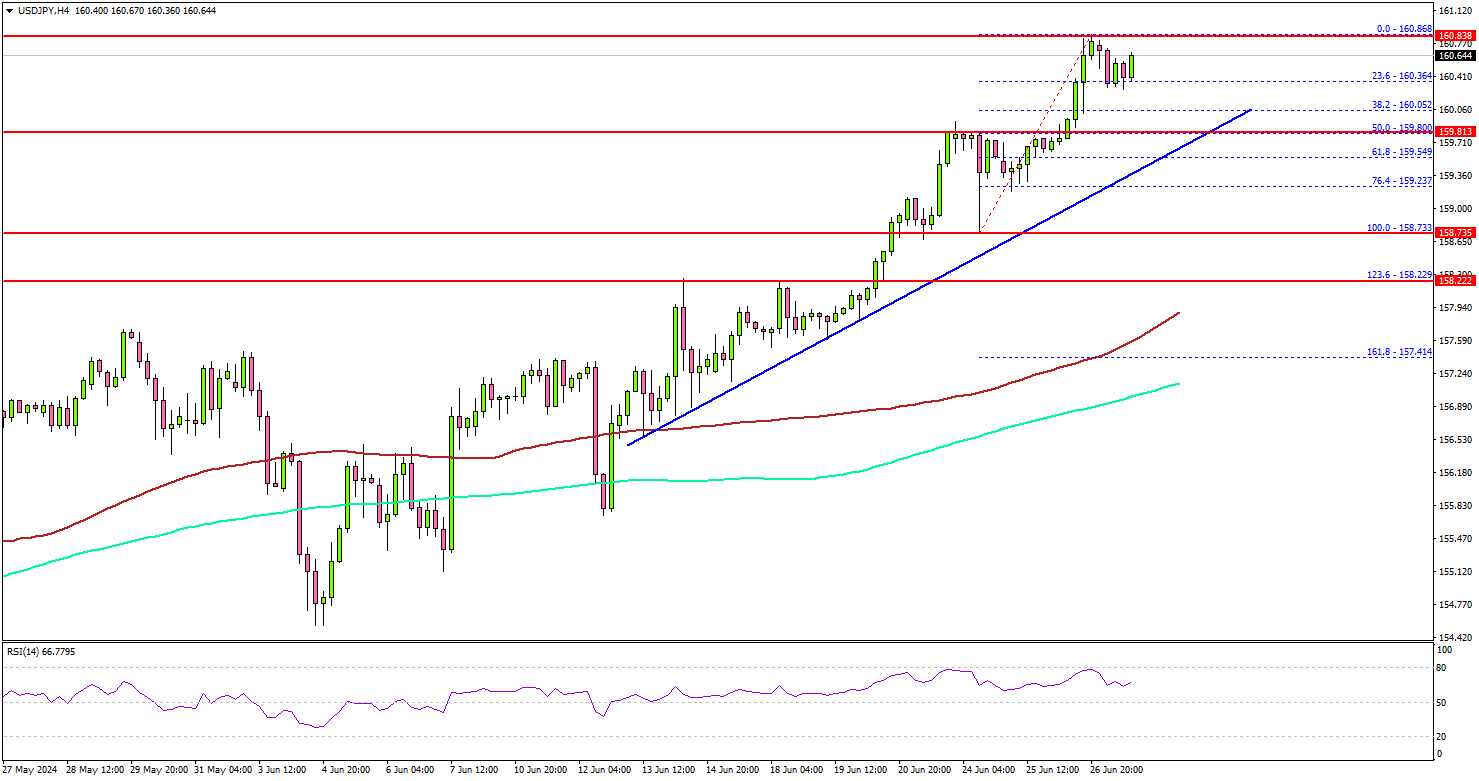
On the upside, the pair is facing resistance near the 160.85 level. The next resistance sits at 161.20. The first major resistance is near the 162.00 level.
A clear move above the 162.00 resistance might send it toward the 162.50 level. Any more gains might open the doors for a test of the 165.00 zone and a new all-time high in the coming days.
Immediate support is near the 160.00 level or the 38.2% Fib retracement level of the upward move from the 158.73 swing low to the 160.86 high. The next major support is near the 159.80 level. There is also a crucial bullish trend line forming with support at 159.80 on the same chart.
The trend line coincides with the 50% Fib retracement level of the upward move from the 158.73 swing low to the 160.86 high. A downside break and close below the 159.80 support zone could open the doors for a larger decline. In the stated case, the pair could decline toward the 159.20 level.
Looking at EUR/USD, the pair remained stable above the 1.0670 support zone and is now attempting a short-term recovery wave.
Economic Releases
- US Personal Income for May 2024 (MoM) - Forecast +0.4%, versus +0.3% previous.
- US Core Personal Consumption Expenditure for May 2024 (MoM) - Forecast +0.1%, versus +0.2% previous.
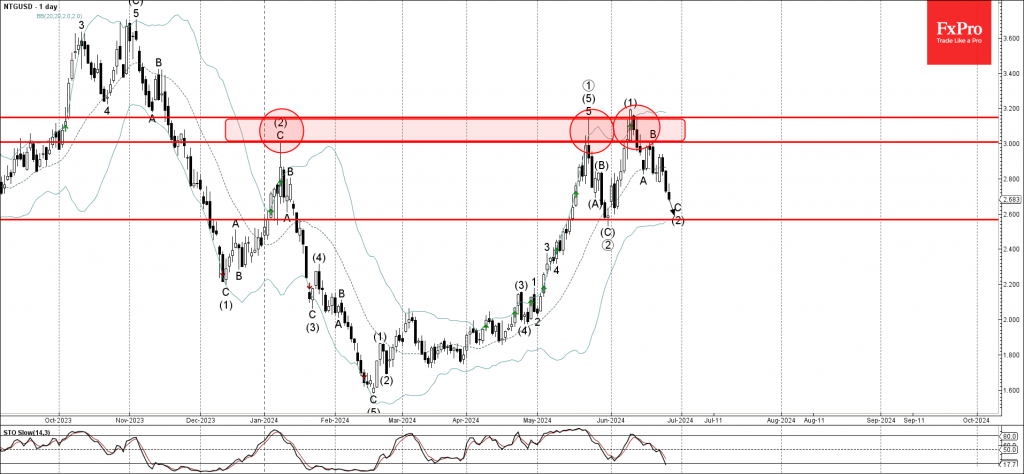
Natural Gas Wave Analysis
- Natural gas reversed from resistance zone
- Likely to fall to support level 2.6000
Natural gas recently reversed down from the resistance zone located between the resistance levels 3.200 and 3.0000, which have been reversing the price from the start this year, as can be seen below.
The aforementioned resistance zone was further strengthened by the upper daily Bollinger Band.
Natural gas can be expected to fall further to the next pivotal support 2.6000, target price for the completion of the active impulse wave C of the higher order ABC correction (2) from the start of June.