
Sample Category Title
USD/JPY Bulls Reign Supreme: Insights Into The Bullish Trend
Key Highlights
- USD/JPY rallied and tested the 160.80 zone.
- A major bullish trend line is forming with support at 159.80 on the 4-hour chart.
- EUR/USD is consolidating above the 1.0670 support zone.
- GBP/USD spiked lower toward 1.2600 before it recovered some losses.
USD/JPY Technical Analysis
The US Dollar remained in a strong uptrend above the 157.50 level against the Japanese Yen. USD/JPY cleared the 160.00 resistance to move further into a positive zone.
Looking at the 4-hour chart, the pair settled above the 160.00 level, the 100 simple moving average (red, 4-hour), and the 200 simple moving average (green, 4-hour). The bulls remained in control and even pumped the pair toward the 160.80 zone.
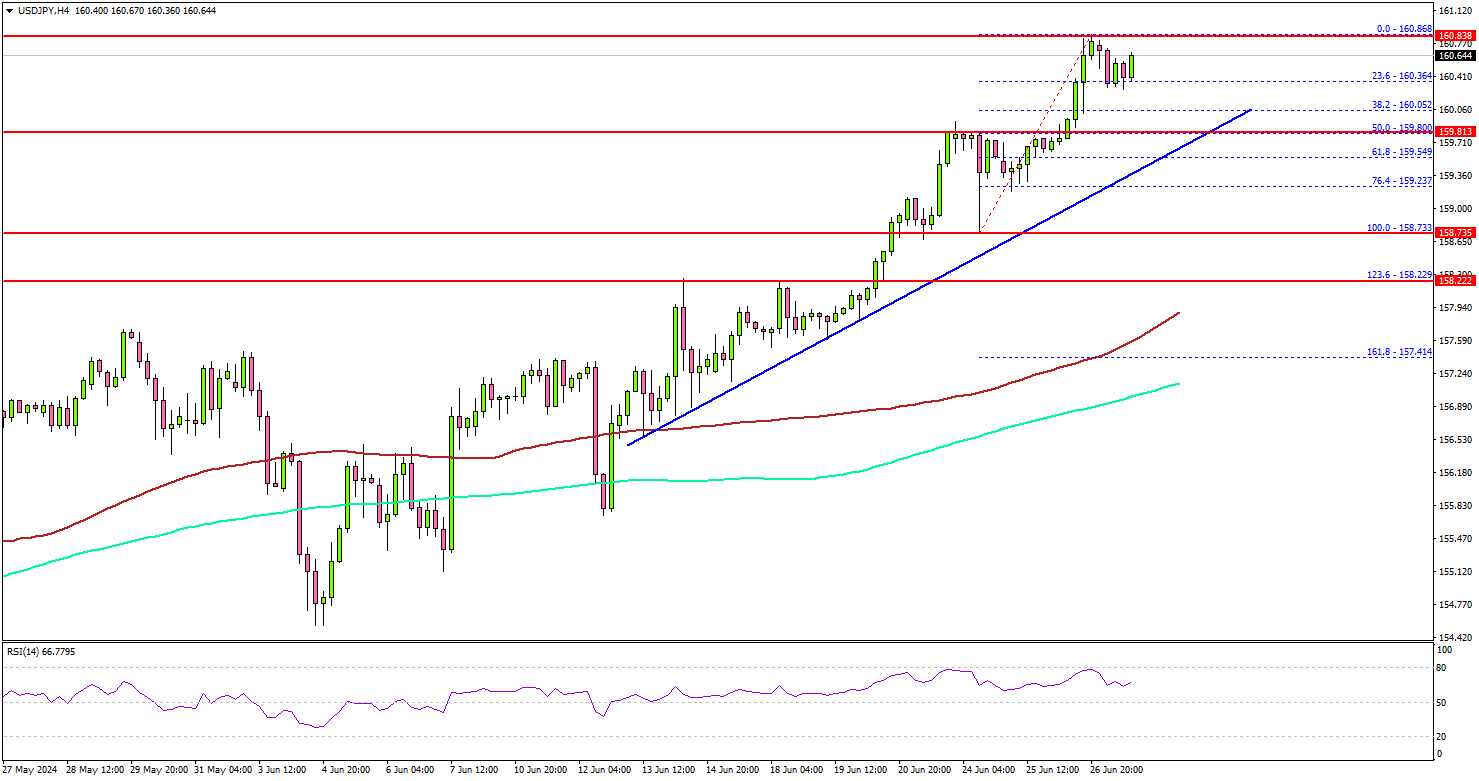
On the upside, the pair is facing resistance near the 160.85 level. The next resistance sits at 161.20. The first major resistance is near the 162.00 level.
A clear move above the 162.00 resistance might send it toward the 162.50 level. Any more gains might open the doors for a test of the 165.00 zone and a new all-time high in the coming days.
Immediate support is near the 160.00 level or the 38.2% Fib retracement level of the upward move from the 158.73 swing low to the 160.86 high. The next major support is near the 159.80 level. There is also a crucial bullish trend line forming with support at 159.80 on the same chart.
The trend line coincides with the 50% Fib retracement level of the upward move from the 158.73 swing low to the 160.86 high. A downside break and close below the 159.80 support zone could open the doors for a larger decline. In the stated case, the pair could decline toward the 159.20 level.
Looking at EUR/USD, the pair remained stable above the 1.0670 support zone and is now attempting a short-term recovery wave.
Economic Releases
- US Personal Income for May 2024 (MoM) - Forecast +0.4%, versus +0.3% previous.
- US Core Personal Consumption Expenditure for May 2024 (MoM) - Forecast +0.1%, versus +0.2% previous.
Natural Gas Wave Analysis
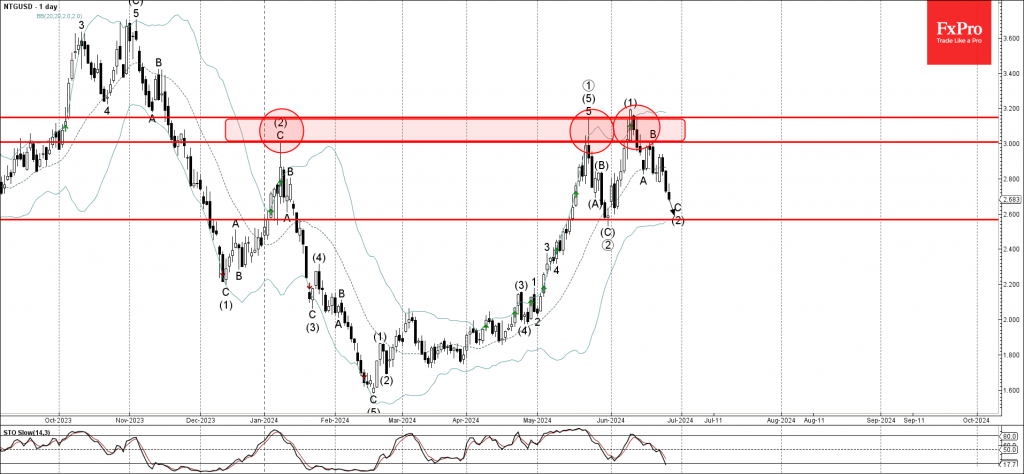
- Natural gas reversed from resistance zone
- Likely to fall to support level 2.6000
Natural gas recently reversed down from the resistance zone located between the resistance levels 3.200 and 3.0000, which have been reversing the price from the start this year, as can be seen below.
The aforementioned resistance zone was further strengthened by the upper daily Bollinger Band.
Natural gas can be expected to fall further to the next pivotal support 2.6000, target price for the completion of the active impulse wave C of the higher order ABC correction (2) from the start of June.
Gold Wave Analysis
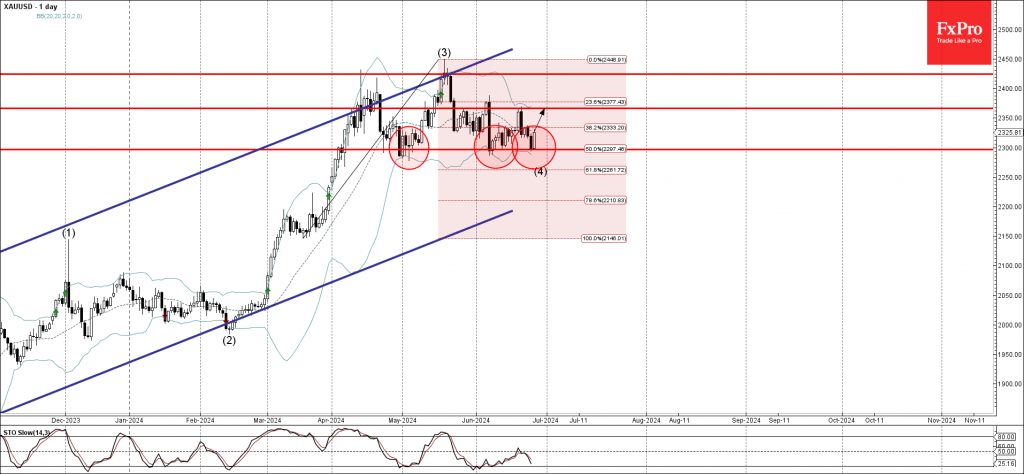
- Gold reversed from support level 2300.00
- Likely to rise to resistance level 2365.00
Gold recently reversed up from the pivotal support level 2300.00, which has been steadily reversing the price from the end of April, as can be seen below.
The support level 2300.00 was strengthened by the lower daily Bollinger Band and by the 38.2% Fibonacci correction level of the previous sharp upward impulse from March.
Given the clear daily uptrend and the strength of the support level 2300.00, Gold can be expected to rise further toward the next resistance level 2365.00 (which has been reversing the price from the start of June).
Yen: A Managing Decline
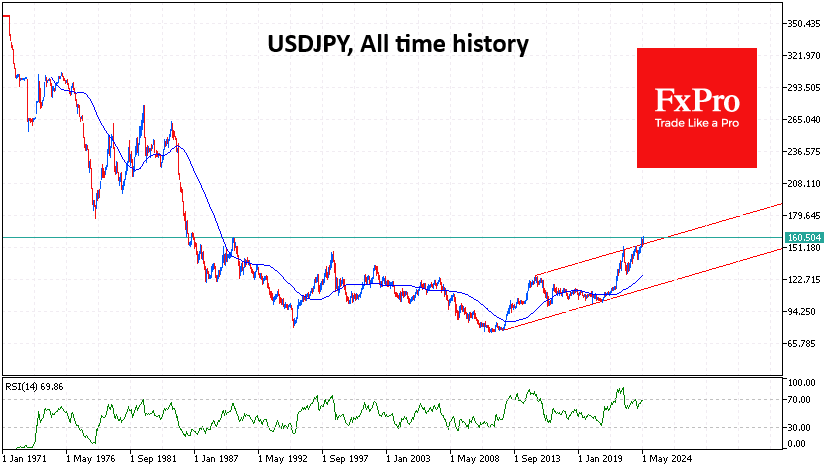
The Japanese yen has fallen to its lowest since 1986 against the dollar and a historic low against the euro. Its YTD loss is 12.5%, the third-worst performance after the Nigerian naira and the Egyptian pound among the 36 most liquid global currencies.
This performance of the currency has the monetary and financial authorities in the Land of the Rising Sun publicly displeased. However, their anger is not as strong as it was in October 2022 and November 2023, when powerful currency interventions reversed the trend from decline to growth for months. It was not even as strong as in late April when the USDJPY pair was pushed back more than 4% in five trading days.
The persistent pressure on the yen is the result of fundamental forces. Japan’s monetary policy remains ultrasoft, with the key rate at 0.1% versus the Fed’s 5.25-5.50%, justifying a long-term carry trade. The negativity on this topic is complemented by the disappointment of the portion of medium-term speculators who expected a more aggressive rate hike and winding down of the QE programme instead of one hike and discussion of reduced purchases.
Meanwhile, inflation is again showing signs of acceleration, although it is already near the target of 2% y/y, eating away at the value of yen savings.
We believe that the Japanese authorities’ hands are virtually tied, and they will continue to say more than they do for several reasons. The low key rate is holding down the cost of servicing the largest government debt relative to GDP. The abundant QE programme makes the Bank of Japan the largest buyer of bonds and also indirectly funds the government.
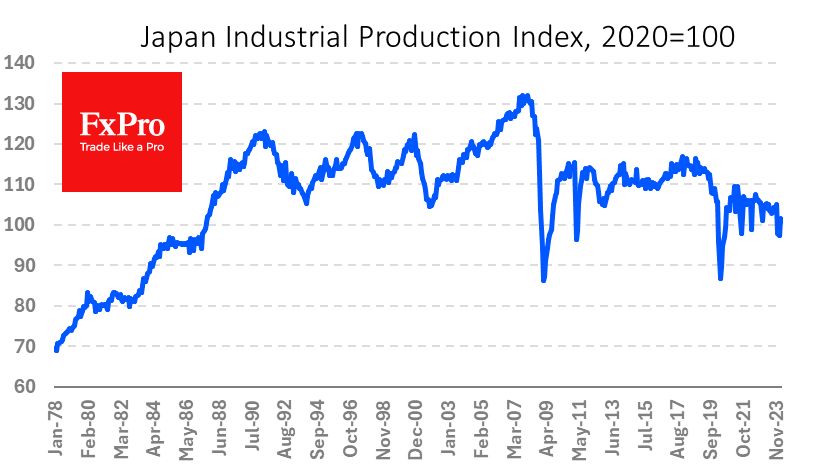
A sharp change in these parameters would be a blow to public finances. Accelerating economic growth and rising tax revenues should offset this negative. However, macroeconomic indicators are weakly improving: the balance of payments is back in surplus by a large margin, but the industrial production index is roughly where it was in the late 1980s, failing to feed into the 55% rise in USDJPY since early 2021.
In addition, currency intervention in support of the yen is burning up foreign exchange reserves, undermining the economy’s long-term sustainability.
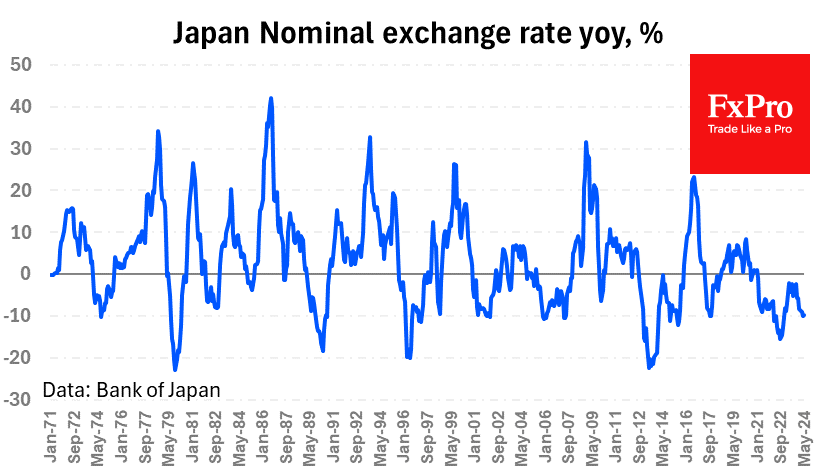
Without economic recovery, Japan is not interested in a yen reversal but only in easing volatility so as not to create currency shocks for businesses. At the end of May, the yen’s nominal effective exchange rate was 9.8% lower, which is within the norm, although not a reason for calm.
In our view, the Ministry of Finance and the Bank of Japan will continue to do the bare minimum necessary to contain the yen’s decline unless it suddenly experiences an economic boom that will force the economy to keep from overheating. In this regard, it should not be surprising that USDJPY will continue to move upwards, hitting 38-year highs, erasing the merits of the Plaza Accord.
Is a China-Taiwan Conflict Likely? Watch the Region’s Stock Market Indexes
The U.S. government in early May sanctioned 300 Chinese entities for supplying machine tools and parts to Russia for its war against Ukraine, while in mid-May Russian president Vladimir Putin made a two-day visit to China. In turn I found myself thinking about how tensions between China and the United States could lead to open conflict, specifically over Taiwan.
The likelihood of conflict depends in part on the region's social mood, as reflected in Asia's stock market indexes. When social mood is negative, countries are more likely to behave aggressively.
Tensions in the region have been high. On May 23, China conducted a military drill that sent 111 warplanes plus several navy destroyers and frigates close to Taiwan and its outer islands. China said the drill meant to punish Taiwan for an offense committed by its new head of state, Lai Ching-te, who used his May 20 inauguration speech to suggest that Taiwan is not part of China.
Yet China appeared to end the provocative move after just two days, much like Iran quickly ended its reprisal drone attack on Israel in April. Both examples reflect the desire to limit the scope of new conflicts, consistent with the improving social mood and burgeoning rally in emerging markets.

As our "Bull versus Bear" chart shows, the mood in Taiwan remains positive amid the global tech boom: The Taiwan Index rose right through the military drill. In contrast, the mood in China remains severely negative, as reflected in the Shanghai Composite's long-term pattern. That does raise the risk of Chinese aggression -- or at the least increases the risk of accidents and miscalculations. As Singapore's deputy prime minister Gan Kim Yong recently said at the Nikkei Forum in Tokyo, bad outcomes tend to follow during periods "when each side views the other as an adversary."
Some geopolitical observers frame the Russia-Ukraine conflict as a proxy battle in a new cold war between the United States and its democratic allies, versus the China-dominated axis of autocratic states that includes Russia, North Korea and Iran.

Long-term charts offer perspective.
In 2020, the MSCI Asia-Pacific Ex-Japan Index ended a 26-year sideways pattern, while the MSCI World Ex-U.S. Index ended its own, similar 20-year-long sideways trend. This two-decade period is comparable to the 1929-1949 corrective period in the U.S. stock market. The Covid pandemic erupted toward the end of the triangles much like the 1948-1955 polio epidemic spread across the globe and killed half a million people a year at its peak.
The first proxy battle in the current cold war -- Russia-Ukraine -- erupted two years post-Covid during the correction in the index, much like the first proxy battle -- the Korean War -- in the earlier Cold War erupted in 1950 and lasted until 1953. The Russia-Ukraine war could follow that precedent by ending in a stalemate sooner than most observers imagine, even as the developing bull market in world ex-U.S. stocks contributes to years of relative peace. Then, once China becomes much stronger militarily, the next proxy battle in the cold war rivalry -- perhaps over Taiwan -- would be analogous to the Vietnam War when the U.S. dramatically escalated the fighting in 1965 and pulled out eight years later, as the communist government of North Vietnam in turn took over South Vietnam to reunite the country.
We're watching the region's stock market indexes closely.
If you'd like to learn more about Elliott wave price patterns, including the triangles mentioned above, EWI has made available the entire online version of the book Elliott Wave Principle: Key to Market Behavior.
By Mark Galasiewski | Elliott Wave International
Fed’s Bostic sees potential for rate cut in Q4
In an essay, Atlanta Fed President Raphael Bostic anticipates that gradual slowdown in the labor market and overall economic activity will lead to inflation decreasing to the target level of 2% by 2025, or slightly later.
Bostic mentioned that instead of maintaining the federal funds rate until the inflation target is achieved, he would prefer to start reducing the policy rate once there is clear evidence that inflation is on a definitive path towards the 2% objective.
Taking all factors into account, Bostic stated, "I continue to believe conditions will likely call for a cut in the federal funds rate in the fourth quarter of this year."
However, he emphasized flexibility, indicating that he is "not locked into any particular policy path" and that adjustments will be based on evolving data and economic conditions.
Bostic acknowledged the possibility of varying scenarios, including more cuts, no cuts, or even a rate increase, depending on how the situation develops. "I will let the data and conditions on the ground be my guide," highlighting the importance of data-driven decision-making in monetary policy.
Gold Rebounds from Near the Lower End of its Range
- Gold bulls step in from near key support zone
- RSI and MACD suggest momentum is turning positive
- Advances within the current sideways range may be possible
- A dip below 2,290 could invite the bears back into the game
Gold is trading higher today, after hitting support slightly above 2,290 on Wednesday. That zone has been acting as a strong support barrier since April, and it can also be seen as the lower boundary of a sideways range that’s been containing most of the price action since then. This paints a neutral medium-term outlook but in the shorter picture, the metal may continue drifting north within the aforementioned range.
Taking a look at the short-term oscillators, the RSI has just poked its nose above its 50 line, while the MACD, although negative, has bottomed and crossed above its trigger line. Both indicators are suggesting that the momentum may have started shifting positive.
If the bulls are willing to stay in the driver’s seat and push the action above 2,340, then they could aim for the 2,370 zone, or the 2,388 barrier, which is the upper bound of the aforementioned sideways range. For the outlook to turn bullish though, a break higher may be needed. This could set the stage for extensions towards the record high of 2,450, hit on May 20.
On the downside, a dip below 2,290 could carry large bearish implications, perhaps paving the way towards the 2,195 zone, marked by the inside swing high of March 27. However, that could still not constitute a trend reversal in bigger timeframes. For that to start being examined, a dip below 2,145 may be needed.
To recap, gold has been trading within a sideways range since April, and lately it has rebounded from near the lower bound, which means that some further short-term advances may be in the works.

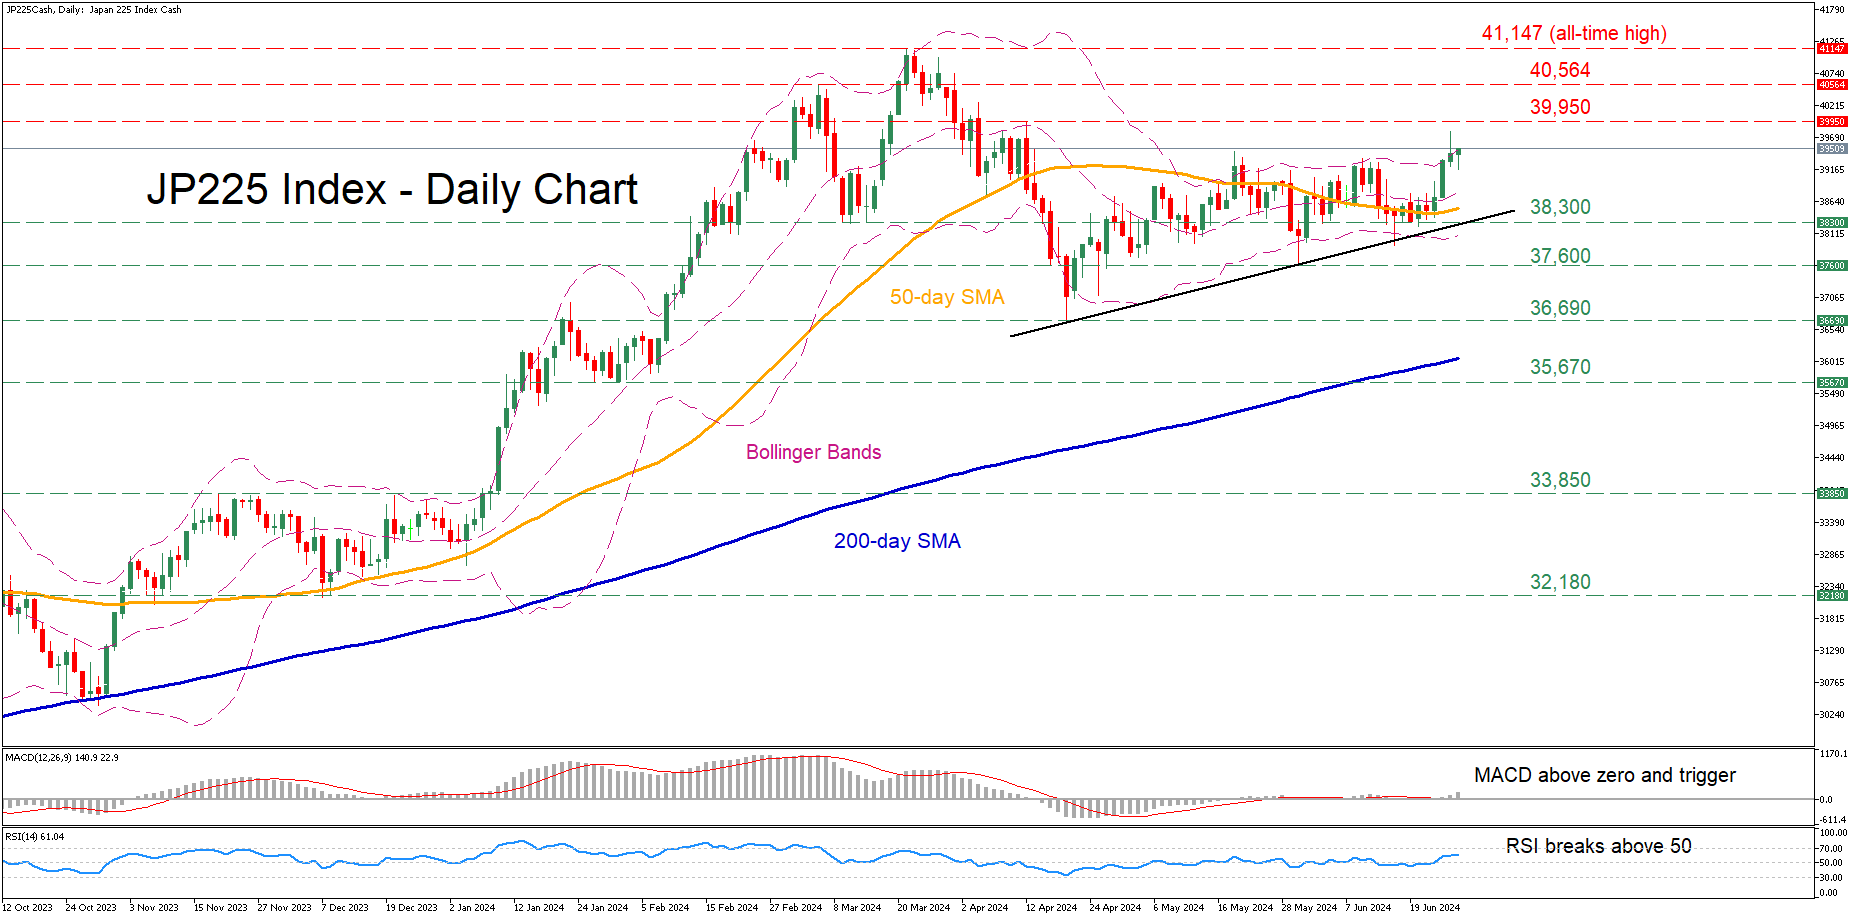
JP 225 Extends Rally to 2-Month High
- JP 225 index has been steadily advancing in the short term
- On Wednesday, price jumped to its highest since April 12
- Momentum indicators are heavily skewed to the upside
The JP 225 index (cash) had been trading without clear direction since early May, fluctuating around its 50-day simple moving average (SMA). In the near term, the price broke above that crucial barrier and edged higher to a fresh two-month high.
If the price extends its recent gains, the April resistance of 39,950 could curb initial upside attempts. Surpassing that zone, the price could ascend towards the March resistance of 40,564. Should that barricade also fail, a test of the all-time high of 41,147 might be on the agenda.
On the flipside, a break below the 50-day SMA could send the price to test the March support zone of 38,300, which also held strong earlier this month. A violation of that territory could open the door for the May low of 37,600. Failing to halt there, the index could descend towards the April bottom of 36,690.
In brief, the JP 225 index’s latest break above the 50-day SMA coupled with improving momentum indicators could signal the beginning of an uptrend.
US Dollar on Edge: How PCE Data Could Shake Uup the Markets
- What is the US PCE data and why is it important?
- Uncertainty regarding the Federal Reserve and US Dollar remains high due to conflicting US data and global inflation concerns.
- The upcoming PCE data release is highly anticipated as it may influence the Fed’s stance on rate cuts.
- The US Dollar Index (DXY) is rangebound ahead of the PCE release. Will 107 finally be revisited?
Market participants continue to wrestle with uncertainty regarding the Federal Reserve and the US Dollar. The recent rise in inflation in Australia and Canada serves as a stark reminder that the fight against inflation may not be over. Over the past month, US data has been both divisive and inconclusive, splitting opinions into two camps: those advocating for immediate rate cuts and those who support the Fed’s cautious stance.
A recent lull in high impact US data has only seen anticipation grow ahead of this week’s PCE data release. This is after all considered by many the Fed’s preferred inflation gauge with the hope that it will deliver enough for the Fed to switch to a more decisive tone. It is important to note that US inflation numbers do appear to be on the right path but as policymakers have reiterated, the homestretch is always the toughest.
There is no doubting the importance of the PCE data for the US economy and Fed policymakers in particular. The question is why and I hope this sheds some light on the topic.
US PCE Data and Its Importance
The Personal Consumption Expenditures (PCE) Price Index serves as a measure of the average increase in prices for all domestic personal consumption. Unlike the Consumer Price Index (CPI), which only considers out-of-pocket expenditures, the PCE Price Index includes all expenditures, regardless of who pays for them. This encompasses spending by consumers, employers, and government programs like Medicare and Medicaid. This broader scope provides a more comprehensive view of inflationary pressures in the economy.
The reason many consider it the Fed’s preferred inflation gauge is complex. Unlike the CPI it is a much less volatile index. There are many other reasons such as the flexible weighting and comprehensive coverage while not forgetting healthcare costs which are a big part of the US economy as well. Thus it is the Core PCE number that is frequently highlighted in economic analyses to understand long-term inflation trends without the noise from the more volatile food and energy sectors. As with most things markets (whether right or wrong) related, a longer term view is always perceived as more reliable.
Looking at the relationship between the US Dollar and the PCE data is definitely a worthwhile exercise. The PCE index is seen as a good predictor as to the path of both monetary policy and the US Dollar. Look at the chart below which compares the USD Index (blue line), Core PCE number (red line) and the US Interest rate (green line).
2021 serves as a perfect example. Core PCE or the red line begins to rise at the back end of 2020 and accelerates into 2021. This sees the likelihood of interest rate hikes increase and thus the US Dollar index begins to strengthen and rises as well.
Comparison Chart- US Dollar Index (DXY) vs US Interest Rate vs US PCE Index, June 27, 2024
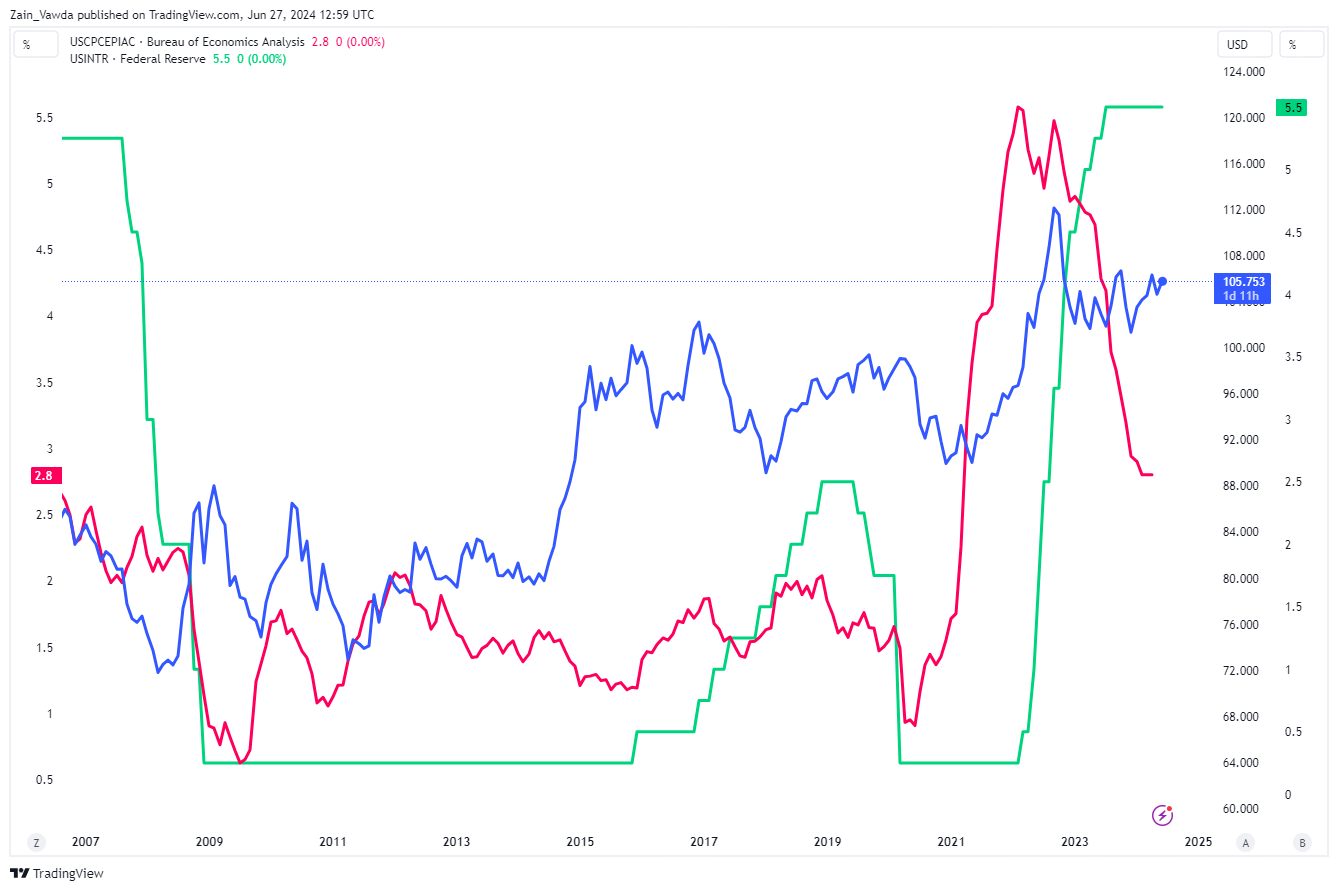
Source: TradingView.com (click to enlarge)
Impact on the US Dollar and Fed Policy
Looking at the chart above and the current climate, it is obvious why market participants are expecting rate cuts to materialize soon. The PCE number has been on a sharp decline since early 2023 but does seem to have plateaued of late which is likely the reason for growing uncertainty from market participants as it remains above the Feds targeted 2% mark.
If US PCE data continues to decline, market participants are likely to adjust their expectations for rate cuts. This could theoretically weaken the US Dollar. Conversely, an increase in the PCE number is likely to strengthen the Dollar. Market consensus for tomorrows release sees both the CORE and headline number at 2.6%.
Of course there is another big event happening this evening and that is the debate between US President Joe Biden and former President Donald Trump. This may be the first glimpse of what market participants can expect from the US Dollar when the US elections come around later in the year. A victory in the debate for Trump should strengthen the US Dollar as Trump is seen as more favorable to the US Dollar at this stage. The question is with uncertainty around monetary policy, will markets respond as expected?
Lastly, we are at the end of Q2 and that means market participants and fund alike will be repositioning and updating their allocations ahead of a new quarter. This could lead to some unexpected volatility and is worth keeping in mind as the week draws to a close.
Technical Analysis on the US Dollar Index (DXY)
The US Dollar index has been topsy turvy for the longest time as policy uncertainty remains prevalent. The lack of clarity has meant that any breakout attempts or long term directional moves have remained absent in 2024.
Looking at the daily chart below and having broken the interior ascending trendline and the exterior one, the DXY failed to fall further. Instead the DXY printed a strong reversal pushing back up to the 106.00 handle.
The key multi-month resistance level at the 107,00 area continues to hold firm and does not look likely to give way anytime soon. It would require a substantial miss to the downside from tomorrow’s PCE data for the possibility of a sustained break of 107.00 to materialize.
US Dollar Index (DXY) Daily Chart, June 27, 2024
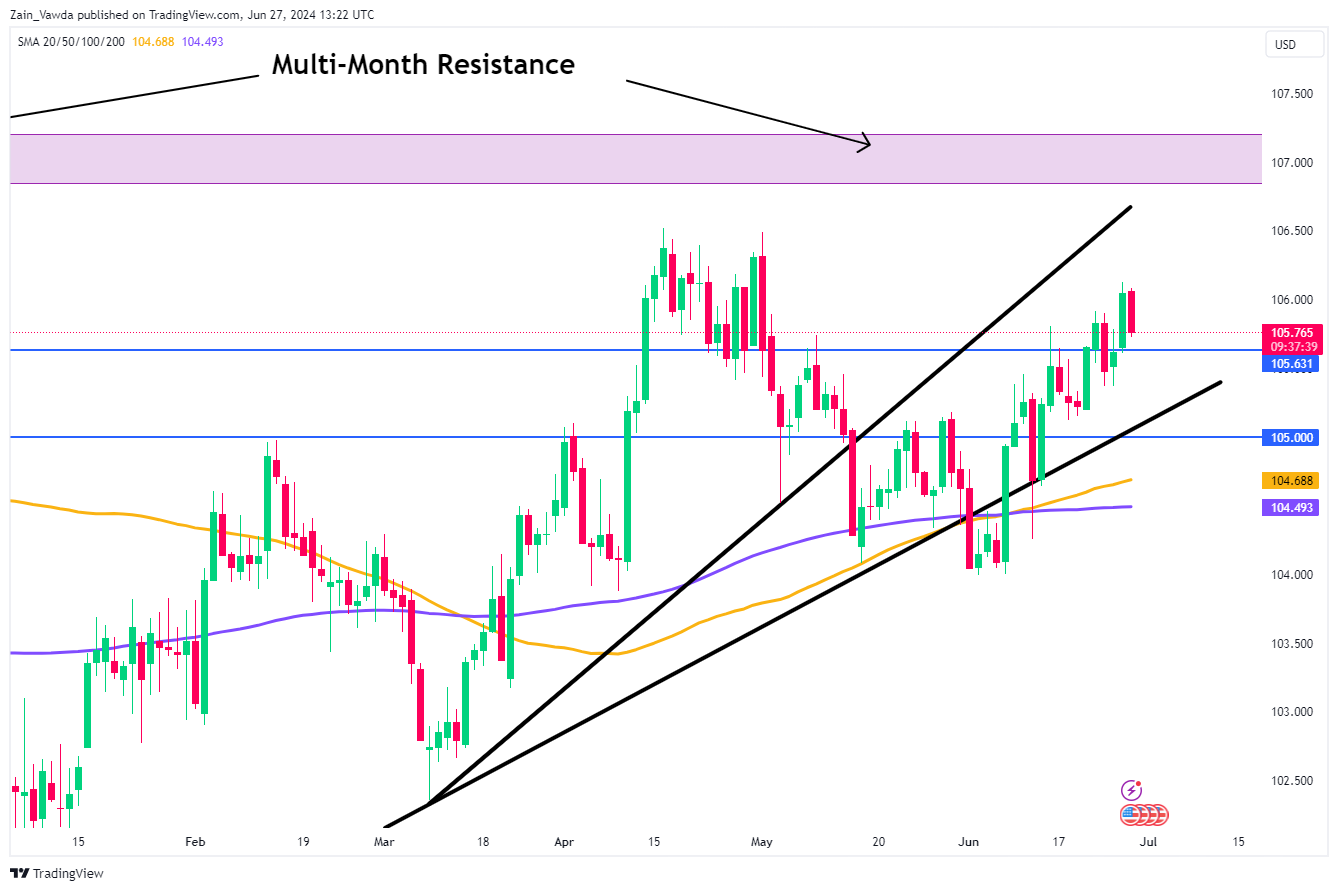
Source: TradingView.com (click to enlarge)
Key Levels to Keep an Eye on;
Support
- 105.63
- 105.00
- 104.50
Resistance
- 106.50
- 107.00
- 108.50