Sample Category Title
Aussie Calm as Inflation Expectations Jump
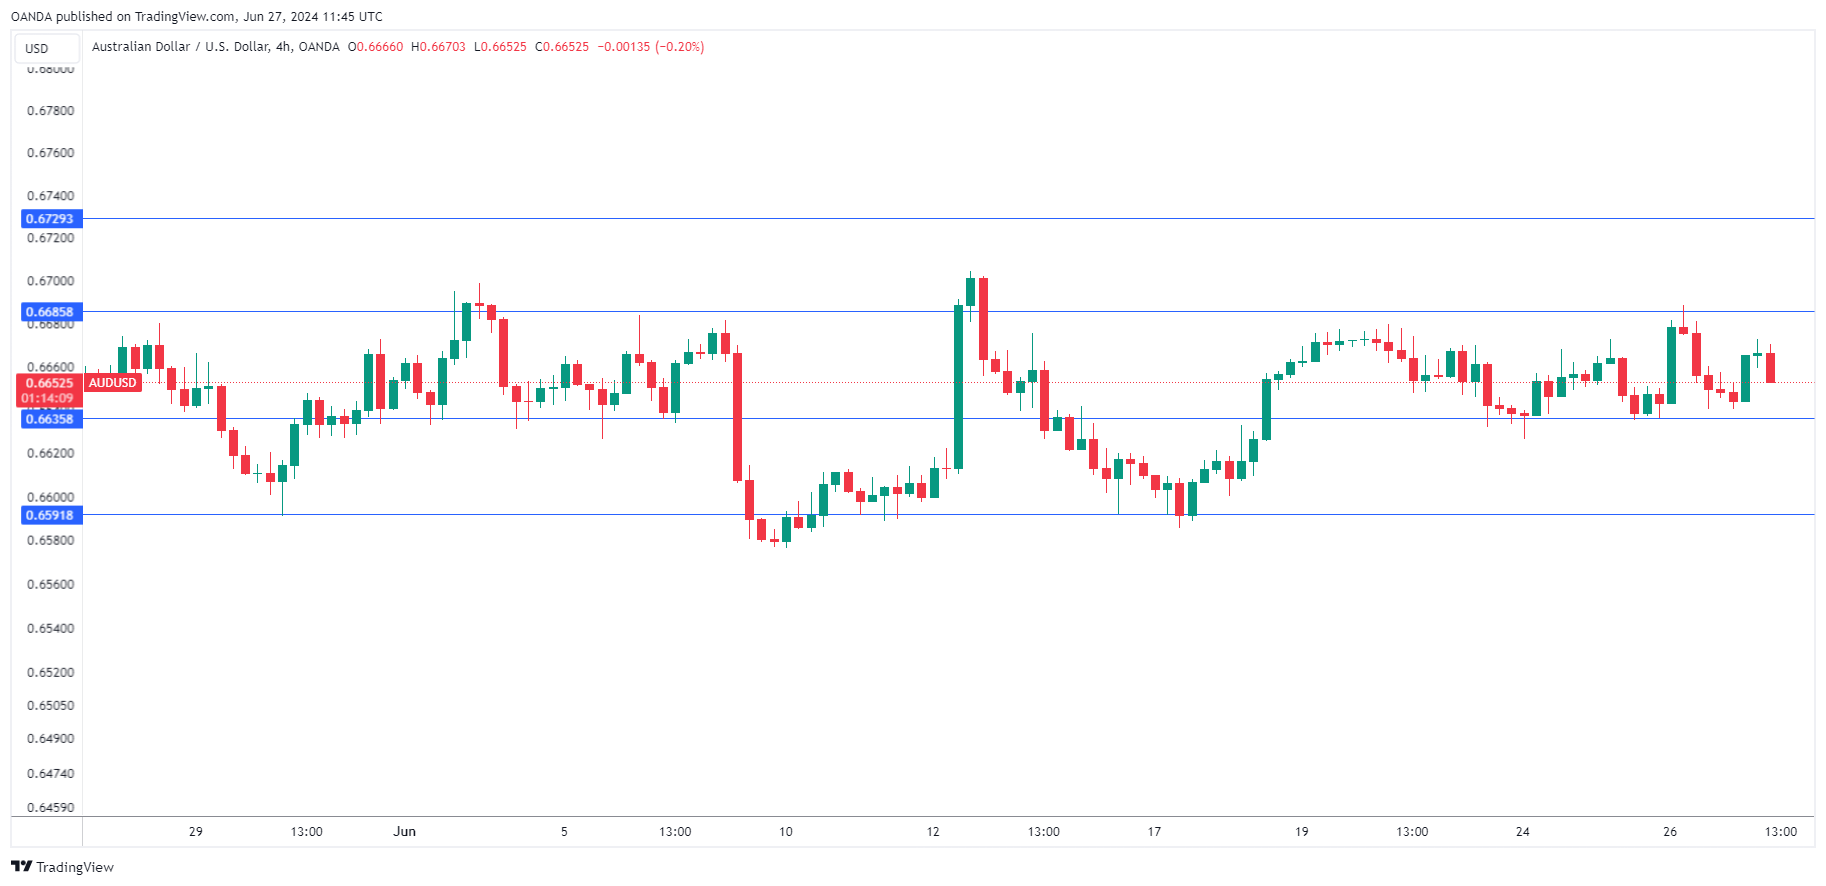
The Australian dollar has posted small gains on Thursday. AUD/USD is trading at 0.6654 in the European session, up 0.10% on the day.
Australian inflation expectations rises to 4.4%
This week’s inflation indicators have risen more than expected, an indication that inflation remains sticky and that the road to the Reserve Bank of Australia’s inflation target band of 2% to 3% will be bumpy.
On Wednesday, the Melbourne Institute Inflation Expectations rose to 4.4% in June, up from May’s 4.1% gain, which was a 2.5-year low. The reading comes a day after CPI accelerated to 4.0% in May, up from 3.6% in April and higher than the market estimate of 3.8%.
This was the highest inflation level since November 2023 and marked the third straight acceleration in headline inflation, a trend that has the RBA worried. With the battle against inflation stalling badly, the RBA could be forced to delay a rate cut until 2025.
With inflation not only failing to fall but moving higher, the specter of a rate hike is real. The RBA has stressed that a rate hike is on the table and discussed this possibility at the past two rate meetings. Ultimately, policy makers decided to hold the cash rate at 4.35%. Australia releases the first-quarter inflation report on July 31, just a week before the next RBA meeting. If Q1 inflation remains doesn’t decline, it could set up a rate hike from the central bank at the August meeting.
In the US, we’ll get a look at Final GDP (third estimate) later in the day. The market estimate stands at 1.4%, compared to 1.3% for the second estimate. The US economy has slowed down significantly in the first quarter, after a strong 3.4% gain in Q4 2023.
AUD/USD Technical
- AUD/USD tested resistance at 0.6685 earlier. Above, there is resistance at 0.6729
0.6635 and 0.6591 are the next support levels
Yen Under Pressure as USD/JPY Hits New Highs Since 1986
The USD/JPY pair soared to 160.34 on Thursday, reaching levels not seen since 1986, as market participants increasingly anticipate potential interventions from Japanese authorities. Despite repeated verbal assurances, the Japanese government has not taken concrete financial measures, leaving the yen vulnerable.
Finance Minister Shunichi Suzuki reiterated that the government stands ready to counteract sudden and undesirable fluctuations in the yen's value, highlighting its preparedness to engage in market operations if necessary. However, when and how these interventions might occur remains uncertain, adding to the yen's woes.
A significant factor in the yen's ongoing decline is the stark contrast in interest rates between the Bank of Japan, which maintains a rate close to zero, and the Federal Reserve. This disparity has been a primary driver of the yen's weakness, with the currency losing approximately 2% against the dollar in June alone, culminating in a 14% decline over the year.
USD/JPY technical analysis
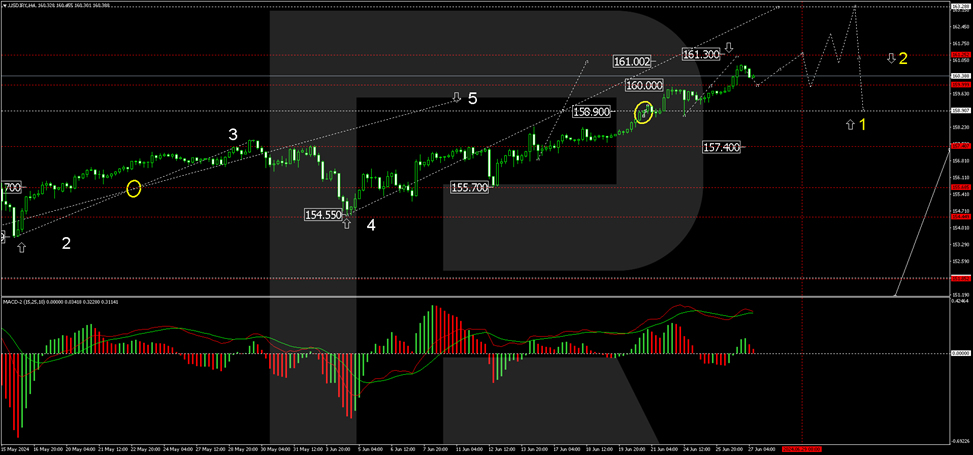
The USD/JPY has broken through the critical 160.00 level, reaching up to 160.85. The market is currently retracing to test the 160.00 level from above. Should this level hold, we anticipate further growth towards 161.30, potentially extending the bullish trend to 163.30. This bullish scenario is supported by the MACD indicator, which shows the signal line well above zero, indicating strong upward momentum.
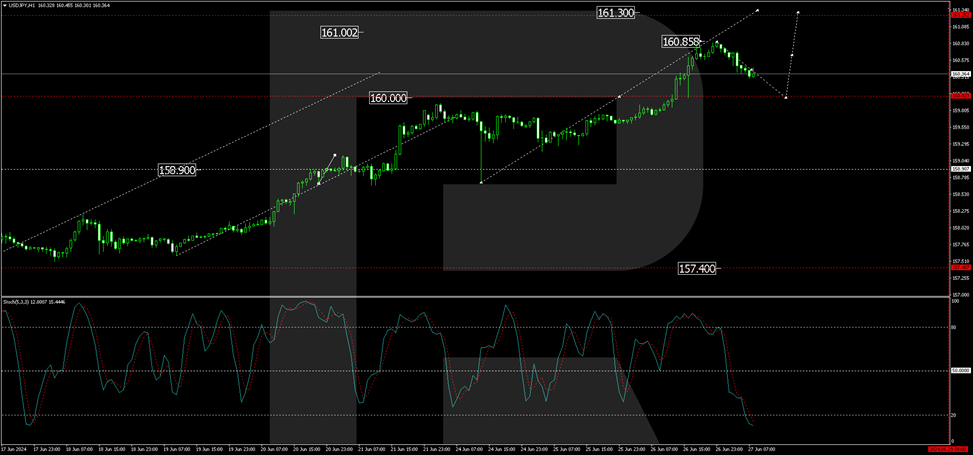
On the H1 chart, after reaching 160.85, the pair is undergoing a correction towards 160.00. Completion of this correction could pave the way for another ascent to 161.30. This view is technically reinforced by the Stochastic oscillator, which is currently below 20 and poised for a rebound towards 80, suggesting a potential resurgence in buying pressure.
Market outlook
As the discrepancy between US and Japanese monetary policies continues to influence the USD/JPY, traders should remain alert to any signs of actual intervention by Japanese authorities. Such intervention could significantly impact market dynamics, potentially stalling or reversing the yen's current depreciation trend.
RBA’s Hauser cautions against policy decisions based on single data point
In an event today, RBA Deputy Governor Andrew Hauser emphasized the need for comprehensive analysis before making policy decisions, stating, "it would be a bad mistake to set policy on the basis of one number and we don't intend to do that."
This comment comes in the wake of Australia's May CPI release earlier this week, which showed an unexpected acceleration to 4%, leading money markets to price in a 50-50 chance of another 25bps rate hike in August.
Hauser highlighted the importance of considering the broader economic context, noting that the monthly consumer price indicator provides only partial information.
He stressed, "there's a whole series of data coming out between now and when we meet in August."
ECB’s Kazimir anticipates single additional rate cut in 2024
ECB Governing Council member Peter Kazimir suggested today that "we could expect one more interest-rate cut this year." He underscored his continued concern over the "significant risk of rising inflation," driven primarily by wage growth.
Kazimir reiterated his opposition to an interest-rate adjustment at upcoming July meeting. Instead, he advocated for policymakers to wait until the next round of quarterly economic projections before making any decisions.
"It's appropriate to wait for the September forecast," Kazimir stated. "Those are the right moments to make the correct decisions."
BTCUSD Bounces Off 1-Month Low
- BTCUSD drops to its lowest level since May 2
- Despite initial rebound, price remains under selling pressure
- Momentum indicators hover near oversold territory
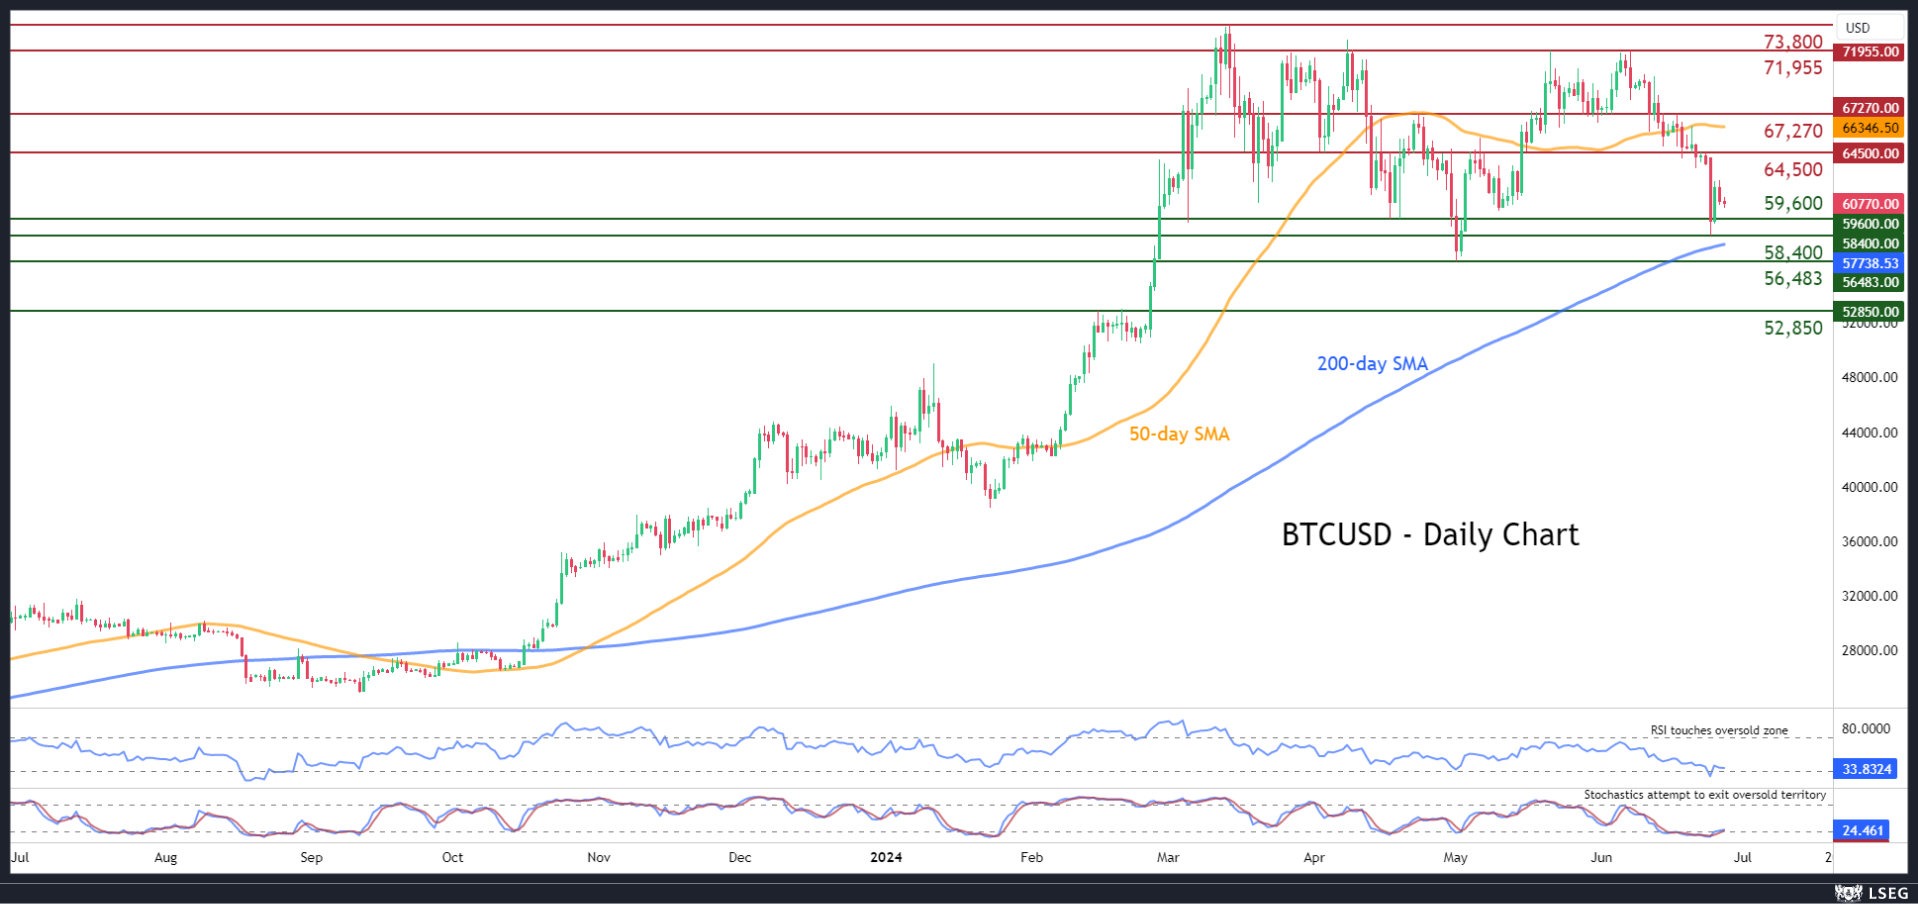
BTCUSD (Bitcoin) has been experiencing a vast selloff since the beginning of June, temporarily breaking below the 60,000 psychological mark. Although the price managed to halt its retreat just shy of the 200-day simple moving average (SMA), the bears continue to hold the upper hand.
Should Bitcoin fall back below the 60,000 psychological level, immediate support could be found at the March-April support of 59,600. Sliding beneath that floor, the price could challenge the June low of 58,400. A violation of that zone may set the stage for the April bottom of 56,483.
On the flipside, if buying pressures re-emerge, the price could advance towards 64,500, a region that has acted both as resistance and support in 2024. Conquering that zone, the bulls could attack the April resistance of 67,270. Even higher, the double top region of 71,955 might prove to be a tough barrier for the price to overcome.
In brief, BTCUSD has come under severe selling pressure lately, falling below the 60,000 mark for the first time since May 3. Despite the latest bounce, the retreat is likely to extend towards the 200-day SMA given that the short-term oscillators remain heavily tilted to the downside.
WTI Crude Oil Moves Sideways in Near Term
- WTI crude oil fails to rally above 81.90
- RSI and MACD remain above mid-levels
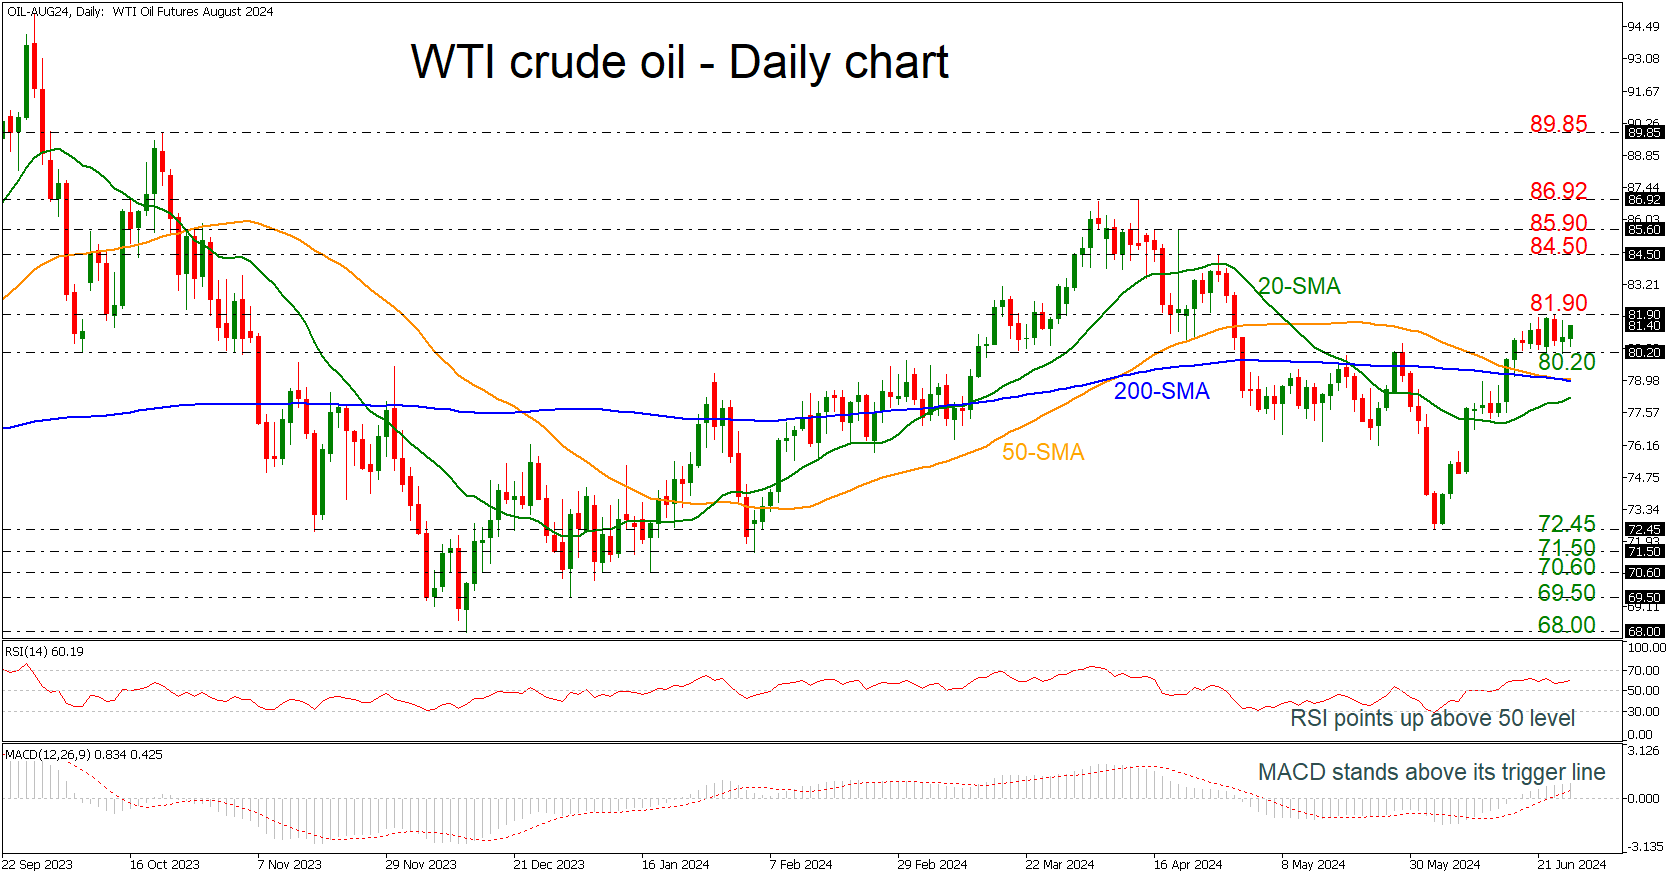
WTI crude oil has been on the sidelines for the most part of the week as the 81.90 level seems to be a real struggle for the bulls. Technically, the price could gain some ground in the short-term as the RSI is changing direction to the upside and holds above the 50 neutral mark, while the MACD is standing above its trigger and zero lines.
A move above the 81.90 resistance could keep the price on the uptrend in the short term started from the rebound off 72.45. Should the price overcome this level, the price could run up to the 84.50 barrier. Higher, the 85.90 and 86.92 lines could next come in focus.
Alternatively, a decline under 80.20 could meet a strong bar near the 50- and the 200-day simple moving averages (SMAs) at 79.00 ahead of the 20-day SMA at 78.30. Even lower, the 72.45 support could take control again.
In the short-term picture, oil prices have gently pointed up over the past three weeks, framing a positive profile. A strong rally above 86.92 would extend the upward pattern, making the outlook even more bullish, while a decisive close below 72.45 would confirm the start of a downtrend.
Nikkei 225: Bullish Breakout With Improved Market Breadth
- Nikkei 225 broke above a 4-week range configuration
- Market breadth on the TOPIX has improved steadily as more of its component stocks have traded above their respective 200-day moving averages in the past three weeks.
- Citigroup Economic Surprise Index for Japan has inched higher since the end of May which suggests an improvement in Japanese macro data.
- Watch the 39,230 key medium-term support on Nikkei 225
Since our last publication, the price actions of the Nikkei 225 have traded sideways. However, they found support at the 50-day moving average and finally broke above its recent four-week range configuration from 15 April.
Also, this current bout of positive price actions comes in line with the continuation of the steepening of the Japanese Government Bond (JGB) yield curve where the yield spread between the 30-year and 2-year JGB has widened to an 11-year high to 1.94% at this time of the writing.
Right now, two key positive elements have emerged to support a further potential positive price action follow-through on the Nikkei 225 from a multi-week medium-term time horizon.
More Japanese stocks are trading above their 200-day moving averages
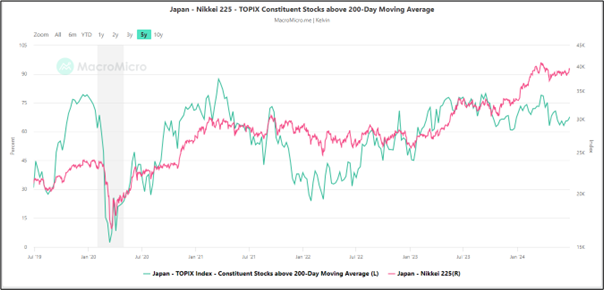
Fig 1: Percentage of TOPIX components stocks above 200-day MA as of 27 Jun 2024 (Source: MacroMicro, click to enlarge chart)
The market breadth of the Tokyo Stock Price Index (TOPIX) which has a wider coverage of Japanese component stocks over the Nikkei 225, with close to 2,000 constituents (a better gauge on the health of the Japanese stock market) has improved in the past three weeks (see Fig 1).
The percentage of component stocks in the TOPIX has increased to 68% as of today, 27 June from 63% on 7 June which suggests an increasing number of Japanese stocks are still evolving in their respective long-term bullish trends.
Improvement in Japanese macro data
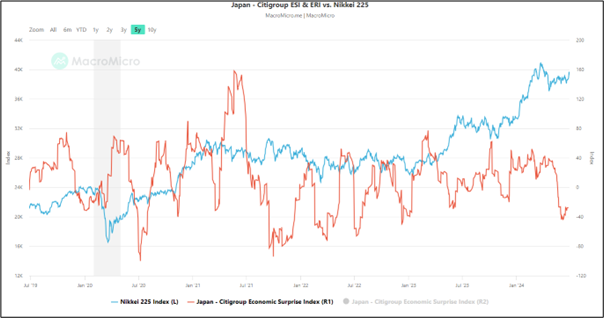
Fig 2: Japan Citigroup Economic Surprise Index as of 24 Jun 2024 (Source: MacroMicro, click to enlarge chart)
Since the end of May, the Citigroup Economic Surprise Index for Japan has been on a path of rebound from -43.80 printed on 31 May to hit -27.60 on 24 June which suggests there are lesser economic data in Japan that missed consensus expectations, in turn, supports a medium-term bullish trend on the Nikkei 225 (see Fig 2).
Watch the 39,230 key medium-term support on Nikkei 225
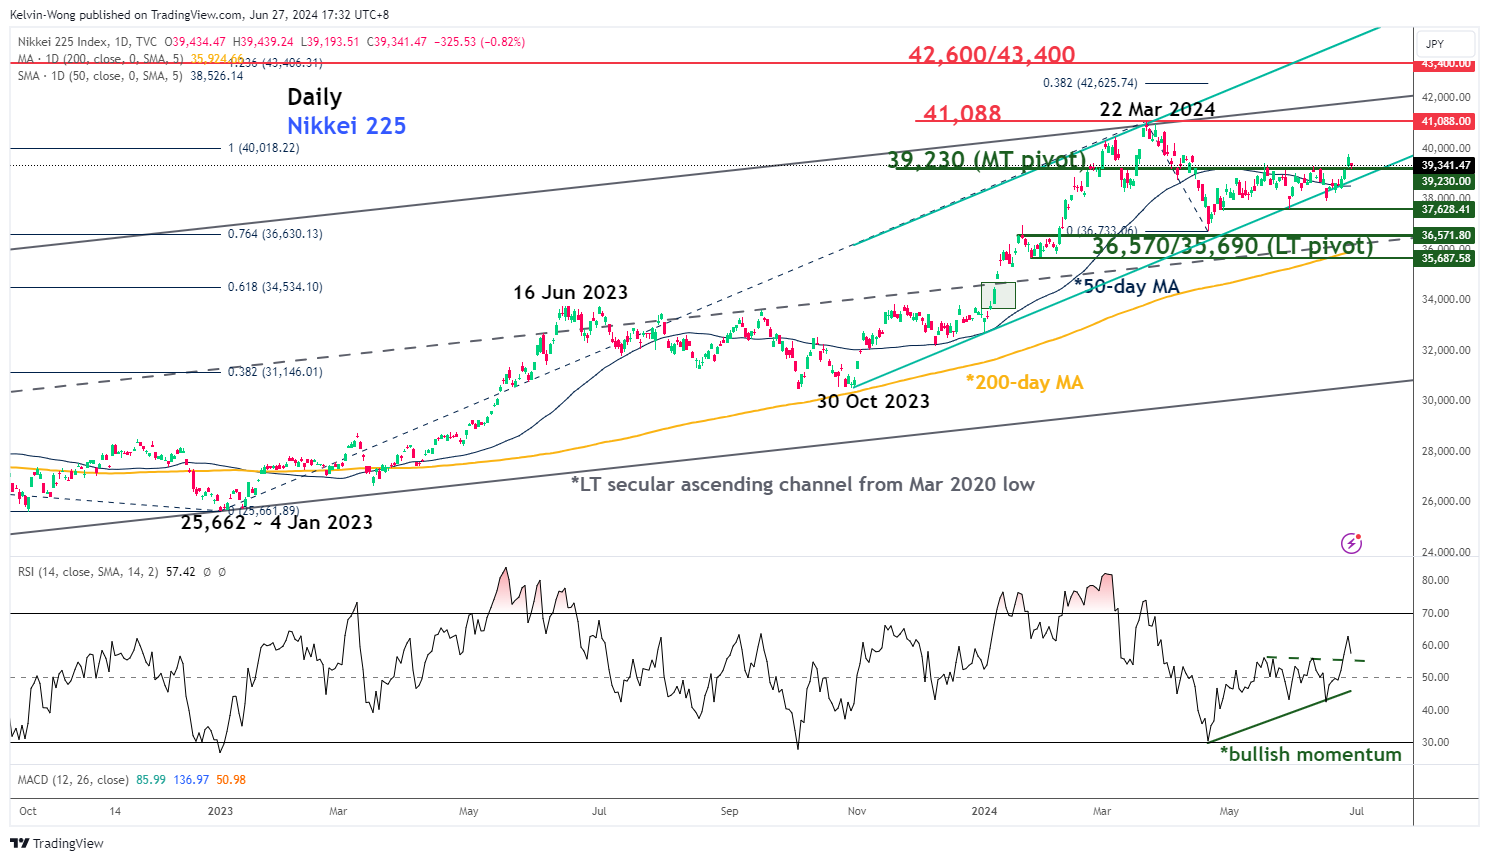
Fig 3: Nikkei 225 major & medium-term trends as of 27 Jun 2024 (Source: TradingView, click to enlarge chart)
The daily RSI momentum indicator has flashed out a bullish momentum condition that supports a potential positive follow-through in price actions after the bullish breakout seen on the Nikkei 225 on Wednesday, 26 June.
If the 39,230 medium-term pivotal support holds, the Nikkei 225 may kickstart another potential impulsive upmove sequence to retest the current all-time high level of 41,088 and clearance above it sees the next medium-term resistance zone to come in at 42,600/43,400.
However, a break below 39,230 invalidates the bullish breakout scenario for another round of choppy corrective decline movements to expose the next medium-term support at 37,630 in the first step.
XAG/USD: Silver Price May Fall More on Breach of Pivotal Supports
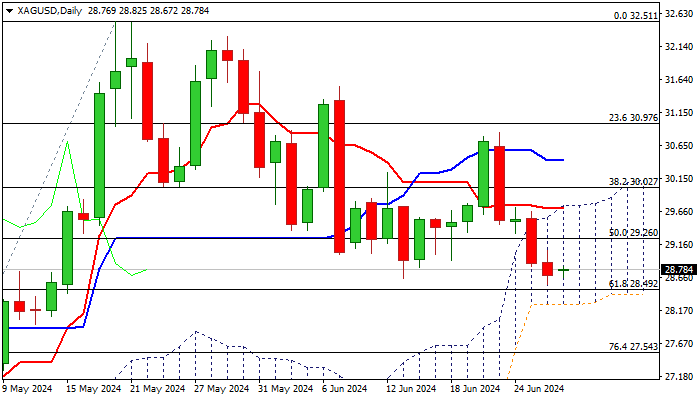
Near-term action remains in bearish mode and cracks first pivot at $28.65 (June 13 low), with pressure on nearby other key supports at $28.49 and $28.25 (Fibo 38.2% retracement of $26.00/$32.51/daily cloud base, respectively).
Sustained break below $28.65/49 triggers to generate bearish signal on completion of failure swing pattern on daily chart/breach of pivotal Fibo support), with extension below the base of thick daily Ichimoku cloud, to verify the signal.
This would open way for deeper drop and expose targets at $27.54 (Fibo 76.4%) and $26.98 (100DMA) in extension.
Technical picture is weakening on daily chart (10/20/55DMA’s in bearish setup / 14-d momentum in negative territory) however, deeply oversold stochastic warns that bears may face headwinds at key support zone.
Consolidation or limited correction likely to precede fresh push lower, with daily cloud top ($29.74), reinforced by daily Tenkan-sen, to cap upticks and keep bears in play.
Caution on lift above cloud top and psychological $30 barrier, which would sideline bears.
Res: 29.06; 29.26; 29.74; 30.00.
Sup: 28.49; 28.25; 28.00; 27.54.
XAUUSD: Head And Shoulders Pattern
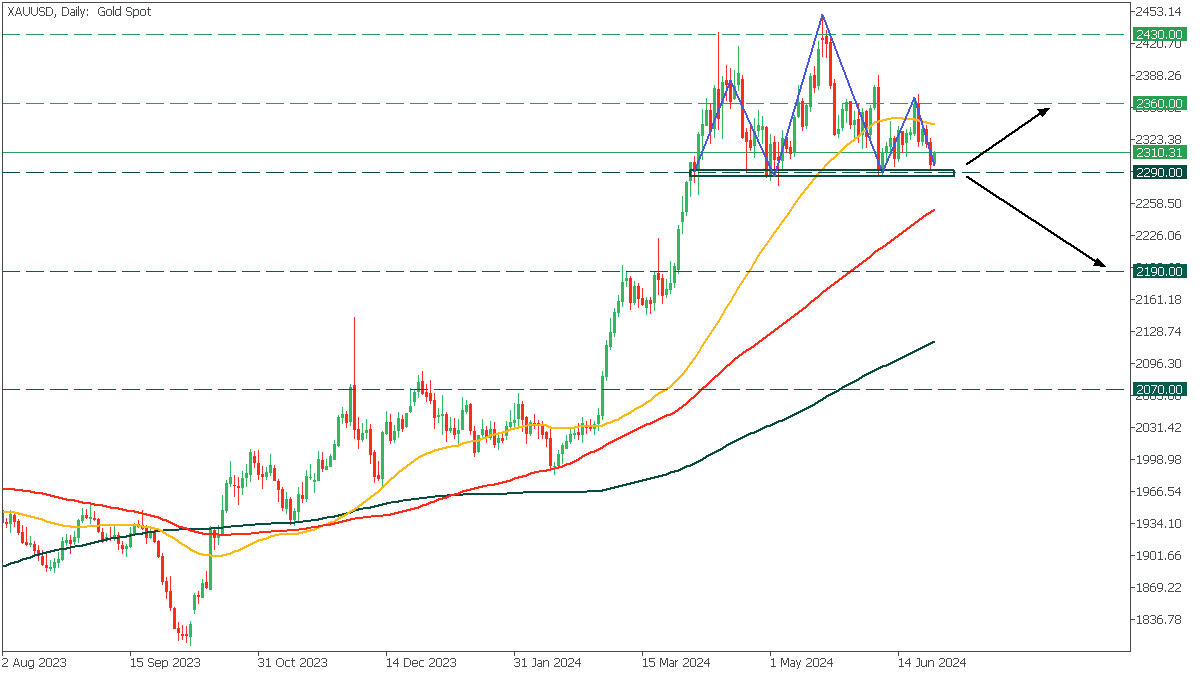
On the Daily chart, XAUUSD navigates within a head-and-shoulders pattern and rebounds from a crucial 2290 support zone. Further scenarios unfold:
- If the price fails to surpass the support zone, it will likely lead to a rise toward the 2360 level;
- However, breaching below the 2290 will indicate a decline to 2190 support.
Eurozone economic sentiment falls slightly to 95.9, EU ticks down to 96.4
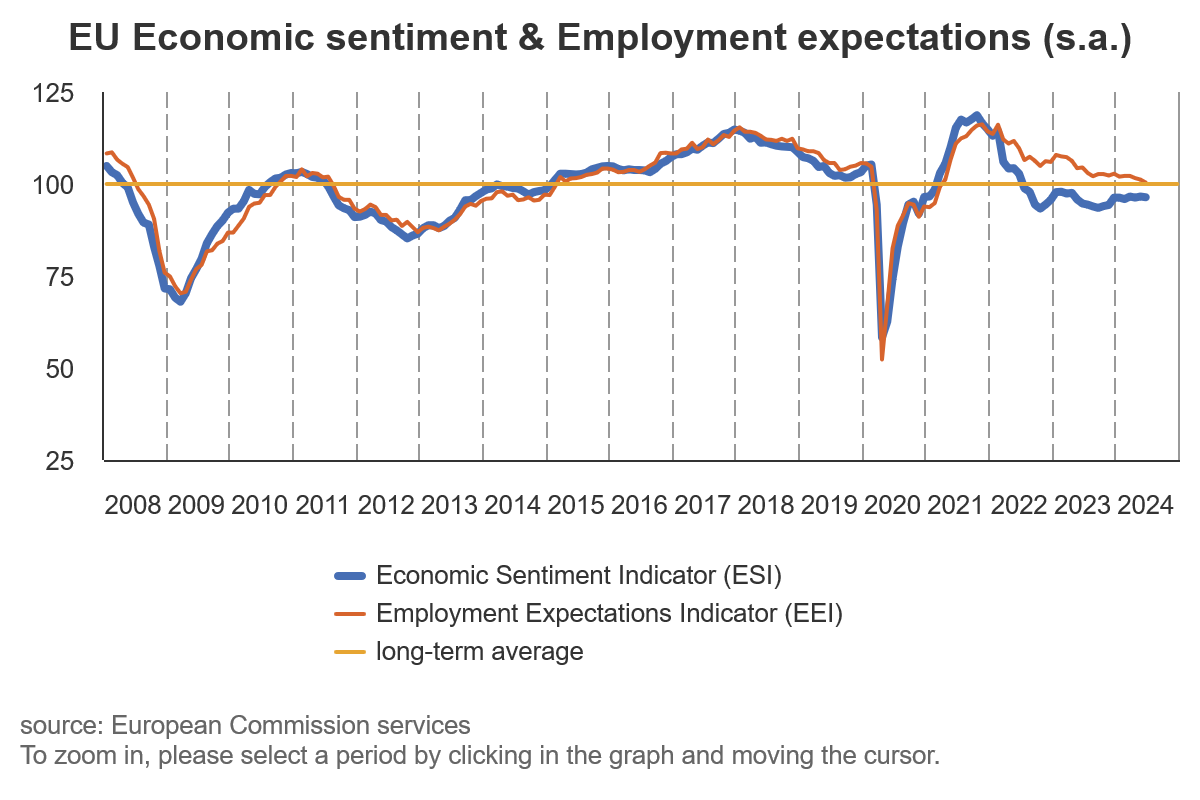
Eurozone Economic Sentiment Indicator ticked down from 96.1 to 95.9 in June. Employment Expectation Indicator fell from 101.3 to 99.7. Economic Uncertainty Indicator fell from 18.5 to 18.0.
Eurozone industry confidence fell from -9.9 to -10.1. Services confidence fell from 6.8 to 6.5. Consumer confidence improved slightly from -14.3 to -14.0. Retail trade confidence fell from -6.8 to -7.8. Construction confidence fell from -6.2 to -7.0.
EU ESI fell from 96.6 to 96.4. EEI fell from 101.2 to 100.4. EUI fell from 17.9 to 17.3. For the largest EU economies, the ESI improved markedly for Spain (+1.1) and more moderately for the Netherlands (+0.5), while it deteriorated for France (-0.7) and Italy (-0.7). The ESI remained broadly stable for Germany (-0.2) and Poland (-0.1).