
Sample Category Title
USD/JPY Steady as BOJ Watches With Sense of Urgency
Japanese yen remains below 160
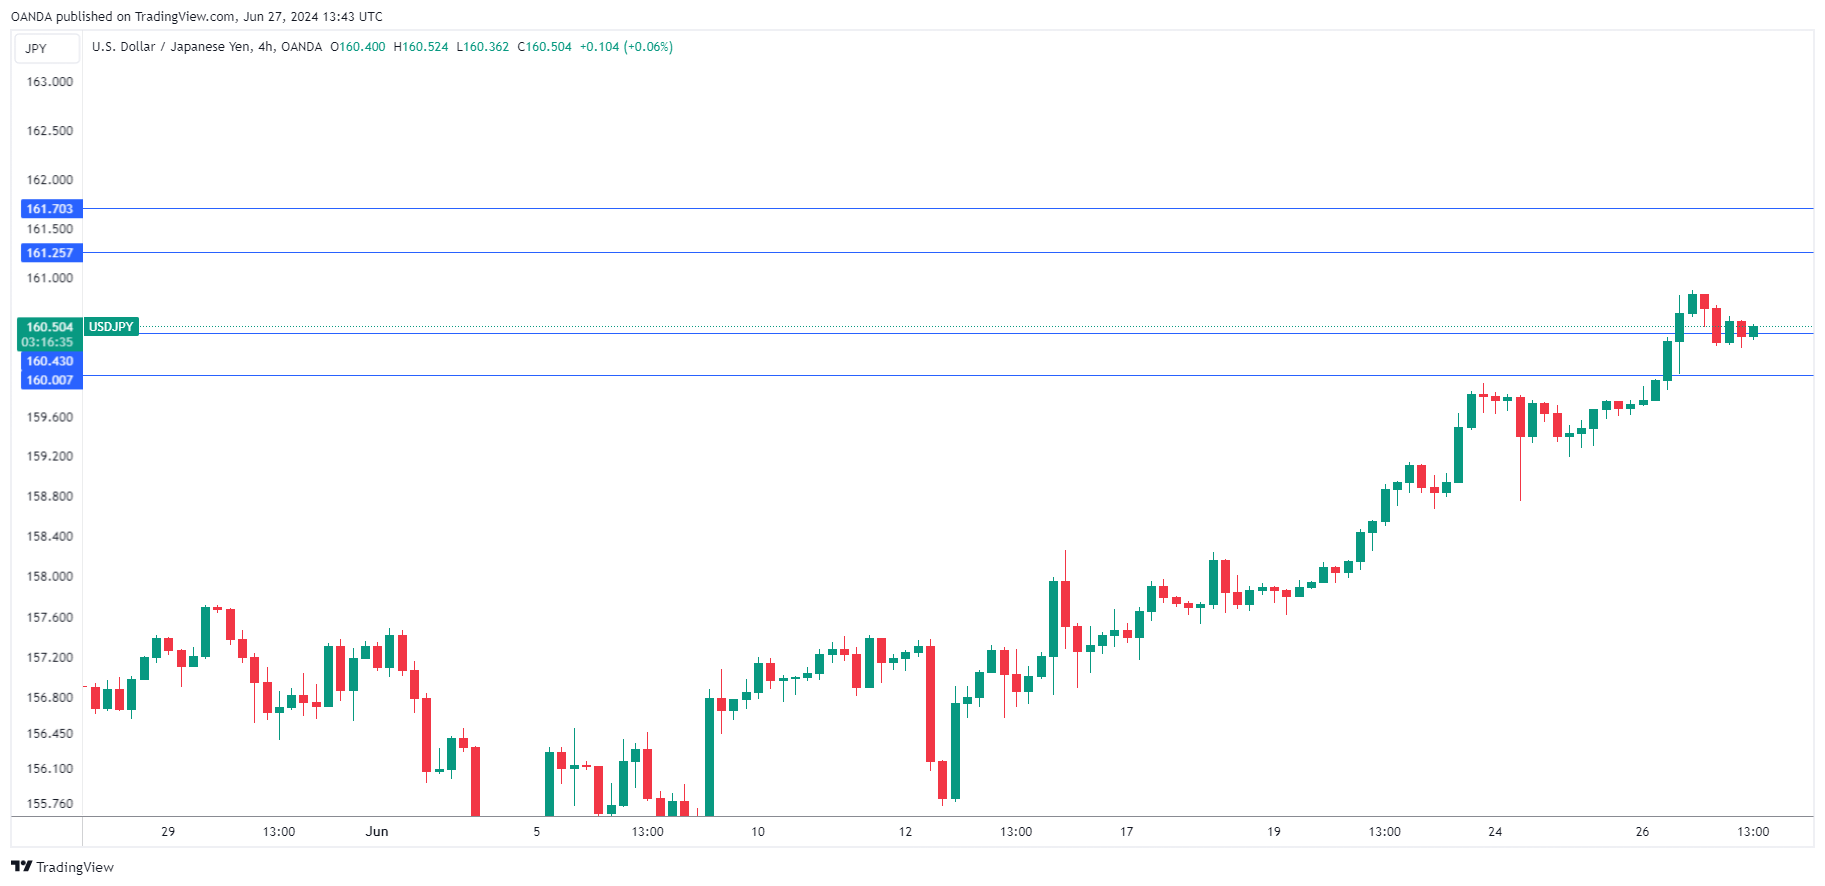
USD/JPY is trading at 160.38 early in the North American session, down 0.25% on the day. The Japanese yen has been trading below 160 on Thursday, after dropping as low as 160.87 on Wednesday, its lowest level since December 1986.
As the yen continues to hit new lows, there are concerns of another intervention from the Bank of Japan in order to stem the currency’s rapid depreciation. The BoJ is believed to have intervened on April 29, when the yen fell as low as 160.20 and again on May 1, selling some $61 billion and purchasing yen. The first intervention boosted the yen by 1.25% and the second by 2%. However, the moves haven’t had a lasting effect and all of the yen’s gains have been wiped out.
Predictably, Japanese officials have warned that they will take action and Japan’s top currency diplomat Masato Kanda said on Wednesday that the yen’s rapid deprecation was a “serious concern” and that he was monitoring events with a “heightened sense of urgency”.
The verbal intervention is unlikely to have much effect, given that actual intervention has failed to stem the yen’s rapid decline. Japan’s interest rates are around zero and with the Federal Reserve not lowering rates before September at the earliest, the US/Japan rate differential will remain wide. It could be a miserable summer for the Japanese yen.
There was some good news as Japan’s retail sales rose 3.0% y/y in May, up from a revised 2.4% gain in April and blowing past the market estimate of 2.0%. This marked a 26th straight month of expansion, as higher wages have fueled stronger consumer spending.
USD/JPY Technical
- USD/JPY is testing support at 160.43. Below, there is support at 160.00
- There is resistance at 161.26 and 161.69
Dollar Index: Eases from New Multi-Week Hhigh on US Data, Japan’s Intervention Warning
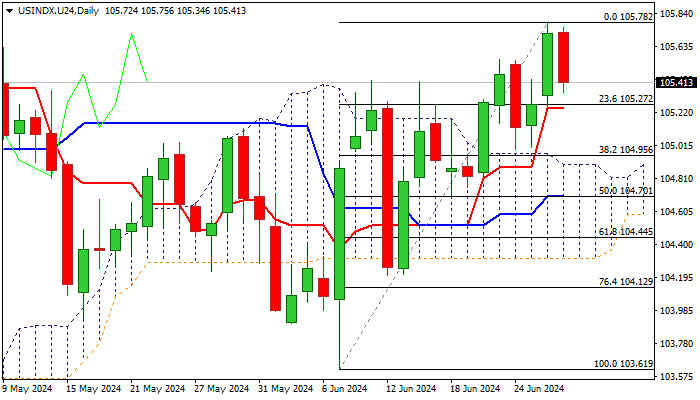
The dollar index fell on Thursday, following overall slightly better than US data and warning from Japan’s authorities about possible action against sharp fall of yen.
The US economy grew by 1.4% in Q1 vs expected 1.3% rise, weekly jobless claims fell below expectations and durable goods orders jumped well above forecast in May, while traders started to exit dollar longs on looming Japan’s intervention.
However, the pullback from the highest in nearly two months was so far mild and could be seen as a healthy correction, as dollar continues to benefit from growing political uncertainty in Europe and Fed’s narrative about holding the policy unchanged for extended period.
Fresh weakness faces initial support at 105.24 (daily Tenkan-sen) with deeper pullback likely to find firm ground above pivotal supports at 104.95/90 (Fibo 38.2% of 104.61/105.78 upleg / daily cloud top) to keep larger bulls in play.
Expect increased downside risk on loss of 104.90/70 pivots, which would open way for deeper correction.
Res: 105.78; 106.00; 106.22; 106.36.
Sup: 105.24; 104.90; 104.70; 104.31.
Sunset Market Commentary
Markets
No follow-through price action on yesterday’s rise in long-term yields for now. We at least partially attributed the move to investors’ pondering issues of long-term fiscal sustainability in Europe but also in the US. The Biden-Trump presidential debate later today might provide some additional insights on how much (or how little) priority both candidates are prepared to give to this key policy topic. In the meantime, US eco data today printed rather soft. May durable goods orders showed a lackluster picture (+0.1% M/M after +0.2% in April). Capital goods shipments nondefense ex aircraft, unexpectedly declined 0.6% M/M, indicating potential poor investment growth in Q2. US initial jobless claims declined slightly from 239k to 233k, but continuing claims (1839k) rose to their highest level since end 2021. Recently some Fed governors were on alert that the labour market might be heading for a turning point and that an unexpected softening in labour market conditions also might have consequences for monetary policy as the Fed targets both price stability and maximum employment. US yields currently decline 3 to 4.5 bps across the curve. EMU yields also felt some mild spill-over from the decline in the US, but German yields currently show changes of less than 1 bp across the curve. ECB speakers (Kazaks and Kazimir) both indicated the higher than expected wage growth as an important factor preventing faster ECB rates cuts. The focus on interest rate markets now mainly turns to tomorrow’s US May PCE deflators and the first June CPI estimates in some EMU members states. US equites open marginally higher despite some negative tech-related headlines yesterday. The Eurstoxx 50 is trading little changed. Brent oil ($ 86,2/b) continues to test the strongest levels since early May.
Softer US data cause the dollar to return most of yesterday’s gain. The DXY index fails to hold above the 106 big figure (105.75). EUR/USD rebounded from opening levels near 1.068 to currently 1.0725. The broader dollar correction only provides very limited relief for the yen. At 160.45, USD/JPY still trades within reach of multi-year peak levels. Sterling also underperforms the euro with EUR/GBP coming within reach of first minor resistance at 0.8475.
News & Views
The Swedish Riskbank kept its policy rate unchanged at 3.75% following an inaugural 25 bps rate cut in May as the Board considers that monetary policy should be adjusted gradually. If inflation prospects remain the same, two or three additional rate cuts can be expected in H2 2024. The Riksbank convenes 4 times over that time span with the next gathering being on August 20 (August or September; November and/or December based on current expected path). Swedish inflation is close to the 2% target and economic activity is weak. Updated CPIF forecasts plot average inflation below 2% in both 2025 (1.8% from 1.9%) and 2026 (1.9% from 2%). Together with a little stronger Swedish krone (though still undervalued according to governor Thedeen), this triggered a small downward adjustment to the policy rate path: 3.33% quarterly average in Q4 2024 (from 3.44%), 3.08% in Q1 2025 (from 3.2%) and 2.67% in Q2 2026 (from 2.7%). The Swedish krone underperformed following the central bank’s dovish hold. EUR/SEK rises from 11.30 towards 11.35.
The Turkish central bank went for a similar policy rate status quo, but obviously at a completely different level. Its key rate is stable at 50% for a third month straight. The MPC reiterates that the tight monetary policy stance will be maintained until a significant and sustained decline in the underlying trend of monthly inflation is observed, and inflation expectations converge to the projected forecast range (underlying inflation reaching 5% in the medium term). Upward inflation risks remain and warrant the hawkish tightening bias. It is prepared to use all the tools at its disposal (also liquidity measures). The TCMB is nevertheless hopeful that disinflationary forces will be established in H2 2024 as the lagged effects of monetary tightening kick in. Ever since reaching the 50% (peak) rate, EUR/TRY trades sideways near all-time highs, between 34.50 and 35.50.
Graphs
EUR/CZK: koruna declines (albeit modestly) as CNB maintains 50 bps rate cut pace rather than slowing to 25 bps step
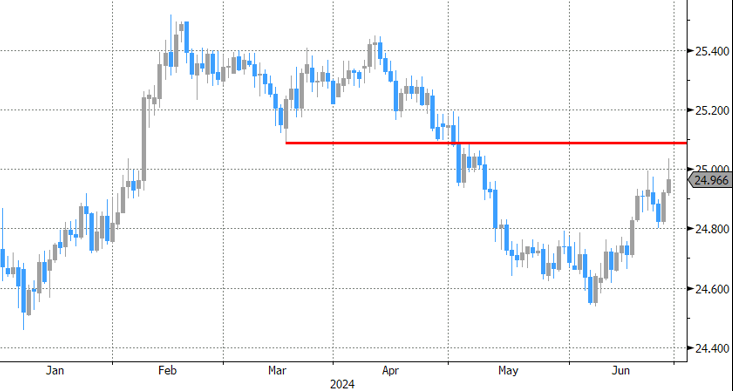
EUR/SEK :Swedish krona cedes ground as Riksbank sees room for two to three 25 bps rate cuts in H2
US 10-yr yield: Long-term yields, for now, fail to build on poor fiscal outlook
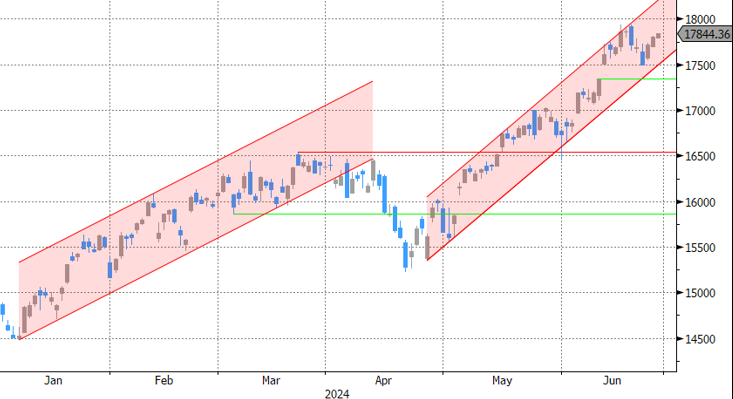
Nasdaq to try new test of all-time top after recent correction?.
USD/JPY Mid-Day Outlook
Daily Pivots: (S1) 160.00; (P) 160.43; (R1) 161.26; More...
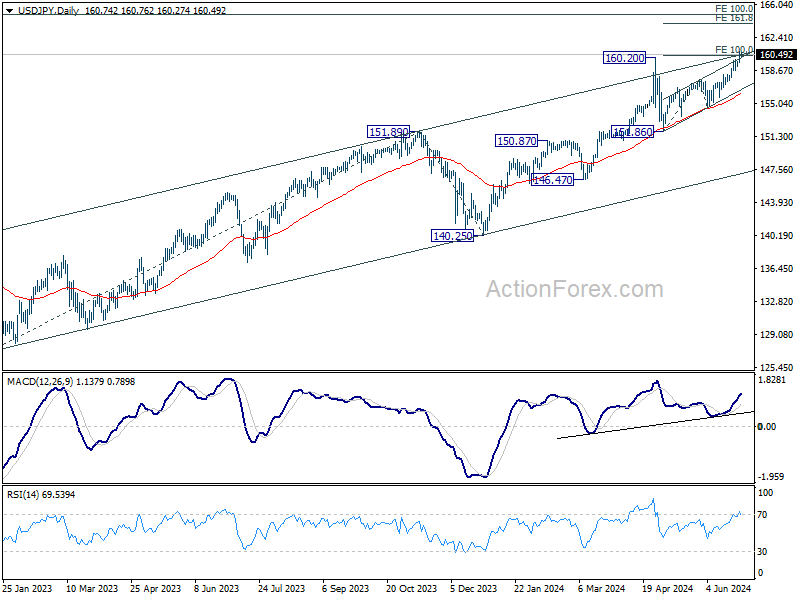
Intraday bias in USD/JPY stays on the upside. Sustained trading above 100% projection of 151.86 to 157.70 from 154.53 at 160.37 will pave the way to 161.8% projection at 163.97. On the downside, below 159.18 minor support will turn intraday bias neutral again first. But outlook will stay bullish as long as 157.70 resistance turned support holds.
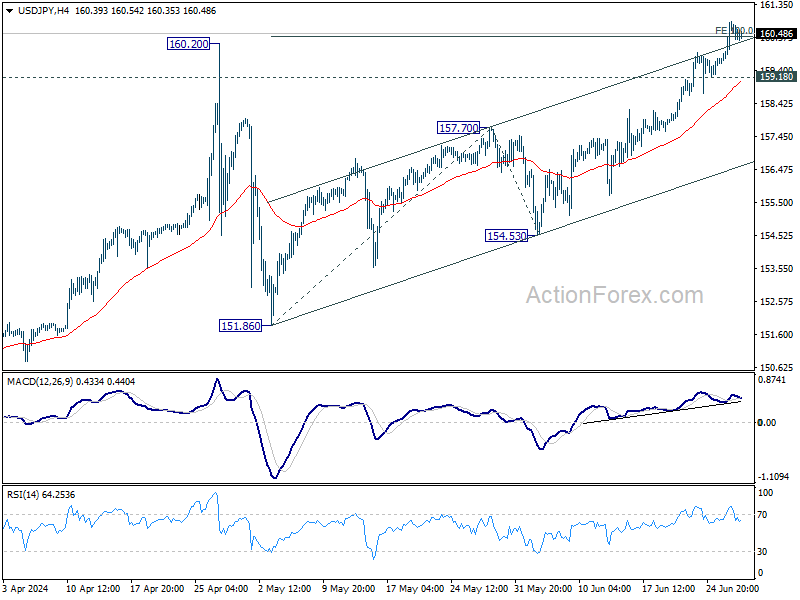
In the bigger picture, there is no sign of long term trend reversal yet. Further rally is expected as long as 151.86 support holds. Decisive break of 160.02 will target 100% projection of 127.20 to 151.89 from 140.25 at 164.94.
USD/CHF Mid-Day Outlook
Daily Pivots: (S1) 0.8950; (P) 0.8967; (R1) 0.8990; More…
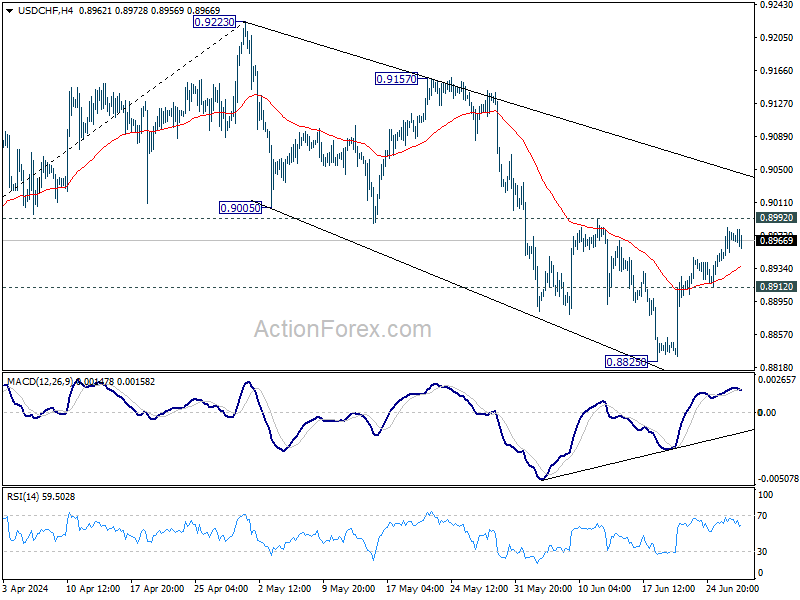
Intraday bias in USD/CHF stays neutral at this point. Further decline is still expected with 0.8992 resistance intact. Below 0.8912 minor support will bring retest of 0.8825 low. Firm break there will resume the fall from 0.9223 to 61.8% retracement of 0.8332 to 0.9223 at 0.8672. However, firm break of 0.8892 will argue that fall from 0.9223 has completed as a three-wave corrective move to 0.8825. In this case, intraday bias will be back on the upside for 0.9157 resistance.
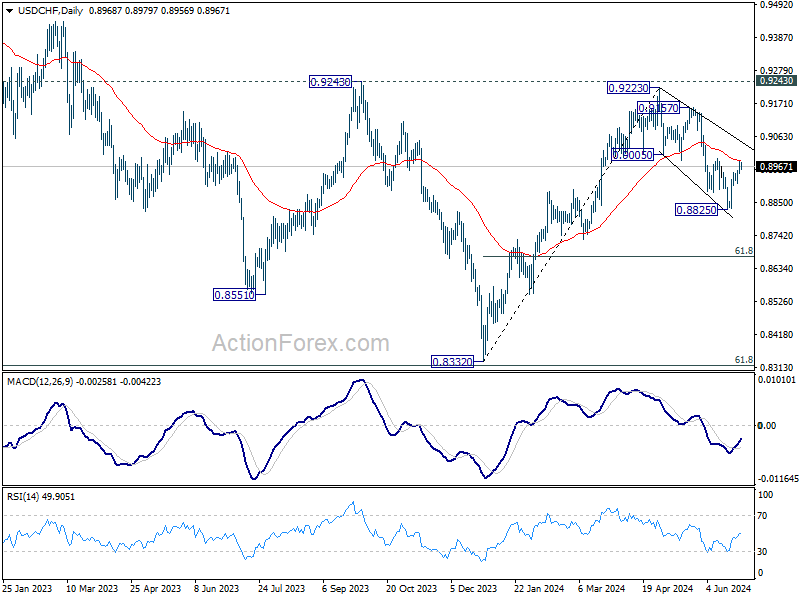
In the bigger picture, price actions from 0.8332 medium term bottom are seen as developing into a corrective pattern to the down trend from 1.0146 (2022 high). Rejection by 0.9243 resistance affirms this case, and maintains medium term bearishness. While more range trading could be seen between 0.8332/0.9243 first, downside break out is mildly in favor at a later stage.
GBP/USD Mid-Day Outlook
Daily Pivots: (S1) 1.2594; (P) 1.2644; (R1) 1.2672; More...
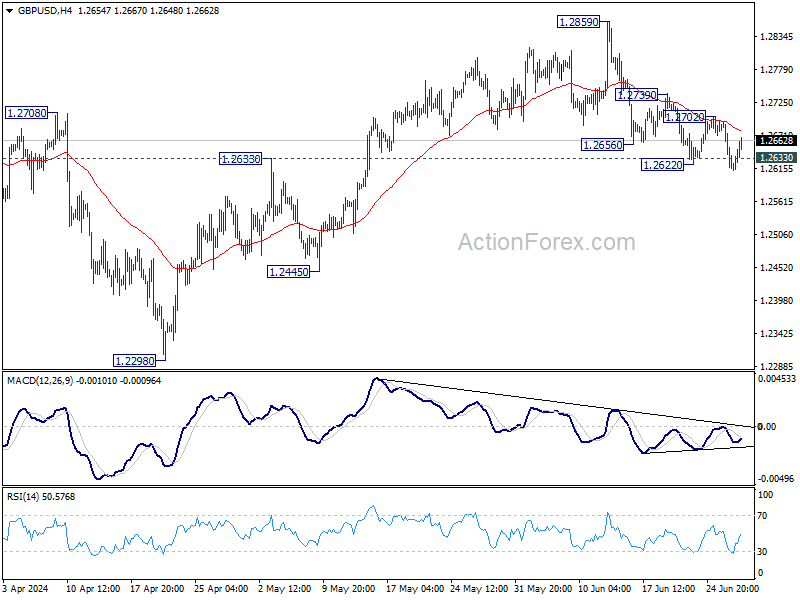
Further decline is expected in GBP/USD as long as 1.2702 resistance holds. Sustained trading below 1.2633 resistance turned support will argue that whole rise from 1.2298 has completed, and target 1.2445 and below. On the upside, however, firm break of 1.2702 resistance will argue that pull back from 1.2859 has completed, and bring retest of this high instead.
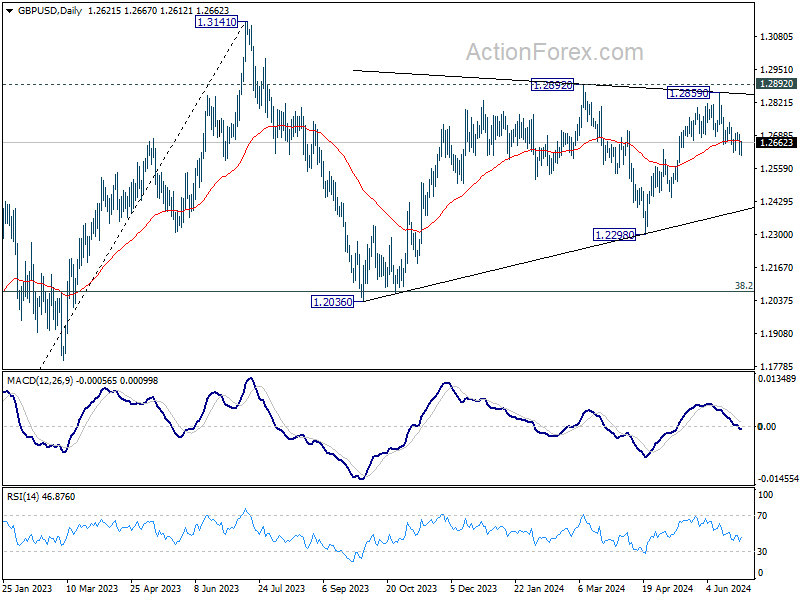
In the bigger picture, price actions from 1.3141 medium term top are seen as a corrective pattern that is still in progress. Break of 1.2445 support will confirm that another falling leg has started and target 1.2036 cluster support again (38.2% retracement of 1.0351 (2022 low) to 1.3141 at 1.2075. Nevertheless, break of 1.2892 resistance will argue that larger up trend from 1.0351is ready to resume through 1.3141.
EUR/USD Mid-Day Outlook
Daily Pivots: (S1) 1.0658; (P) 1.0688; (R1) 1.0710; More....
EUR/USD recovered after breaching 1.0667 briefly and intraday bias remains neutral. Outlook stays outlook stays bearish with 1.0760 resistance intact. Decline from 1.0915 is seen as another leg in the larger corrective pattern. Firm break of 1.0667 will target 1.0601 and below. However, decisive break of 1.0760 will turn intraday bias back to the upside for stronger rebound.
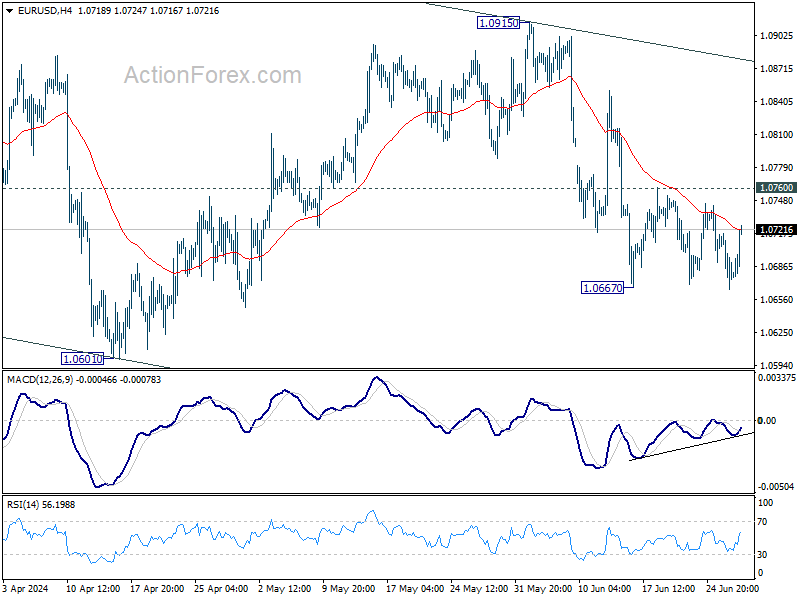
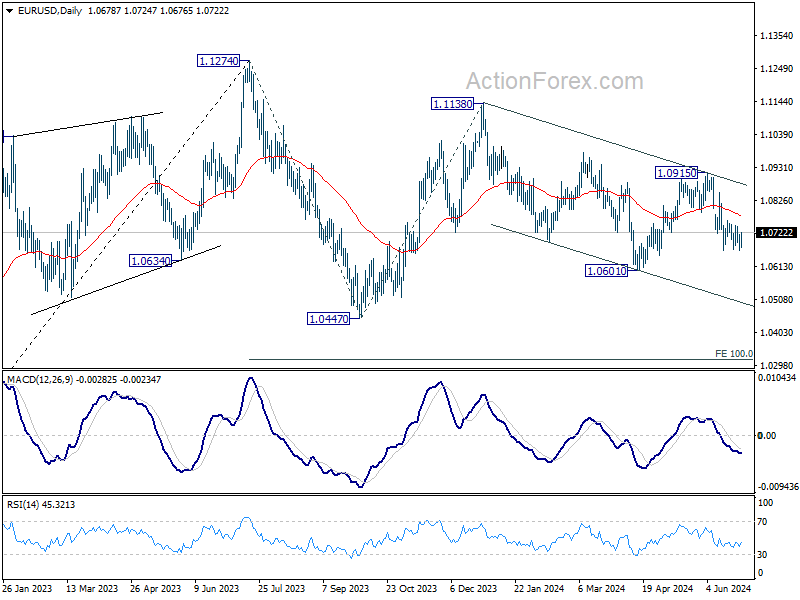
In the bigger picture, price actions from 1.1274 are viewed as a corrective pattern that's still in progress. Break of 1.0601 will target 1.0447 support and possibly further to 100% projection of 1.1274 to 1.0447 from 1.1138 at 1.0311. For now, this will remain the favored case as long as 1.0915 resistance holds, in case of rebound.
Dollar Weakens after Mixed Data, Traders Turn Cautious
Dollar weakens broadly weakening in the early US session following the release of a batch of economic data. Durable goods orders presented a mixed bag. Concurrently, continuing claims for unemployment benefits rose to their highest level in more than two-and-a-half years. Despite these indicators, there is no immediate cause for alarm.
Instead, traders, observing the Dollar's inability to extend its near-term rally against Euro, appear to be lightening up their positions ahead of the upcoming PCE inflation data tomorrow and the end of the first half. Adding to the cautious sentiment is the upcoming French parliamentary election on Sunday, which is contributing to market jitters. The potential political shake-up in France could have significant implications for the Eurozone, prompting traders to adopt a wait-and-see approach.
In the broader currency market, Swiss Franc and Canadian Dollar are following the greenback as the next weakest currencies for the day. New Zealand Dollar reversed its earlier losses to become the strongest currency. Euro and the Australian Dollar are also showing strength, while British Pound and Japanese Yen are mixed in performance. Despite heightened verbal intervention by Japanese officials, Yen remains hesitant to stage a meaningful rebound.
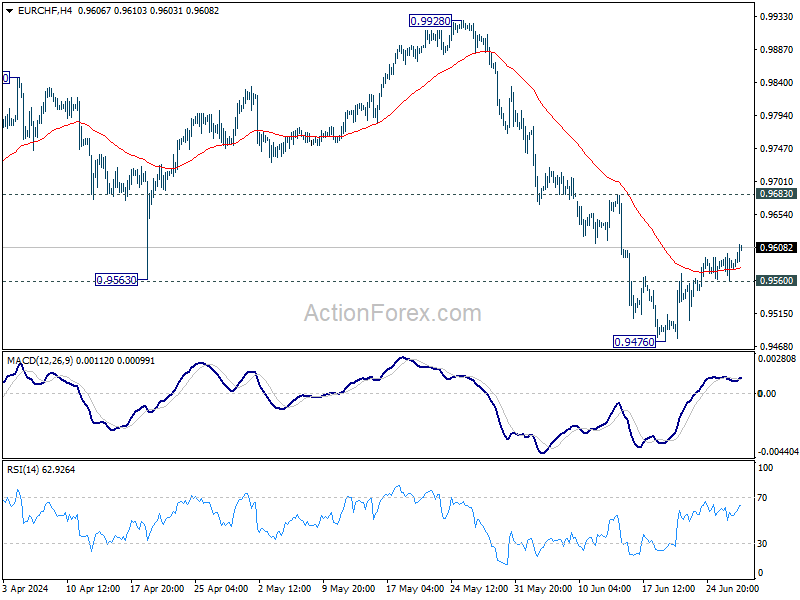
A key pair to monitor is EUR/CHF as the French election looms. While recovery from 0.9476 might extend, near term outlook will continue to stay bearish as long as 0.9683 resistance holds. Break of 0.9560 minor support will now argue that the recovery has already completed. Retest of 0.9476 should be seen next, and break there will resume the decline from 0.9928.
In Europe, at the time of writing, FTSE is down -0.09%. DAX is up 0.24%. CAC is down -0.60%. UK 10-year yield is down -0.0079 at 4.131. Germany 10-year yield is up 0.008 at 2.461. Earlier in Asia, Nikkei fell -0.82%. Hong Kong HSI fell -2.06%. China Shanghai SSE fell -0.90%. Singapore Strait Times rose 0.35%. Japan 10-year JGB yield rose 0.0491 to 1.074.
US durable goods orders rise 0.1% mom, ex-transport orders down -0.1% mom
US durable goods orders rose 0.1% mom to USD 283.1B in May, above expectation of -0.1% mom. Ex-transport orders fell -0.1% mom to 187.7B, below expectation of 0.1% mom. Ex-defense orders fell -0.2% mom to USD 266.1B. Transportation equipment rose 0.6% mom to USD 95.4B.
US initial jobless claims falls to 233k, vs exp 230k
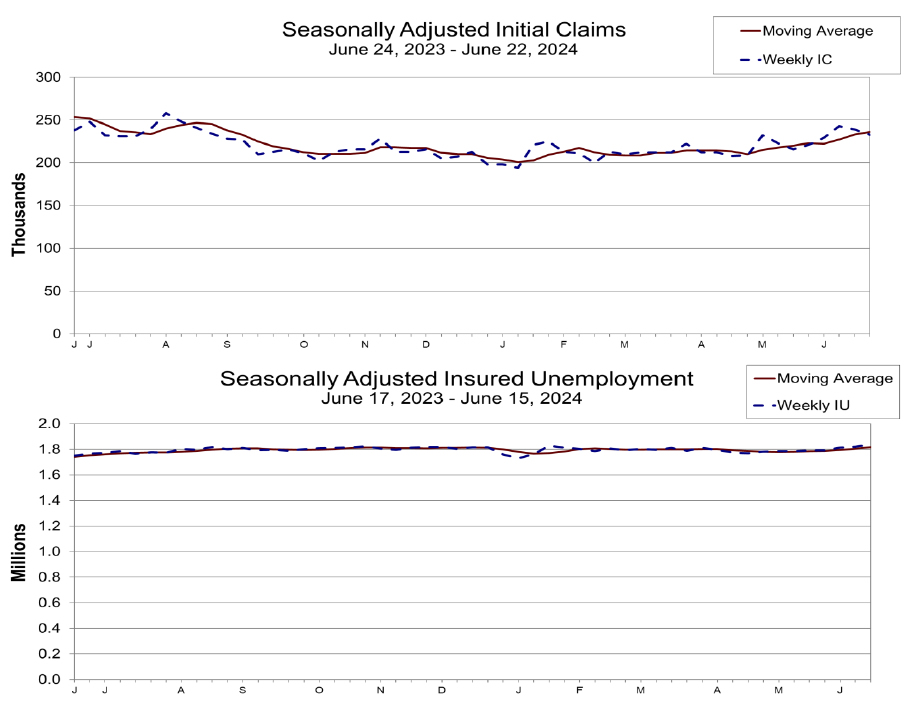
US initial jobless claims fell -6k to 233k in the week ending June 22, slightly above expectation of 230k. Four-week moving average of initial claims rose 3k to 236k.
Continuing claims rose 18k to 1839k in the week ending June 15, highest since November 27, 2021. Four-week moving average of continuing claims rose 12k to 1816k, highest since December 4, 2021.
ECB's Kazimir anticipates single additional rate cut in 2024
ECB Governing Council member Peter Kazimir suggested today that "we could expect one more interest-rate cut this year." He underscored his continued concern over the "significant risk of rising inflation," driven primarily by wage growth.
Kazimir reiterated his opposition to an interest-rate adjustment at upcoming July meeting. Instead, he advocated for policymakers to wait until the next round of quarterly economic projections before making any decisions.
"It's appropriate to wait for the September forecast," Kazimir stated. "Those are the right moments to make the correct decisions."
Eurozone economic sentiment falls slightly to 95.9, EU ticks down to 96.4
Eurozone Economic Sentiment Indicator ticked down from 96.1 to 95.9 in June. Employment Expectation Indicator fell from 101.3 to 99.7. Economic Uncertainty Indicator fell from 18.5 to 18.0.
Eurozone industry confidence fell from -9.9 to -10.1. Services confidence fell from 6.8 to 6.5. Consumer confidence improved slightly from -14.3 to -14.0. Retail trade confidence fell from -6.8 to -7.8. Construction confidence fell from -6.2 to -7.0.
EU ESI fell from 96.6 to 96.4. EEI fell from 101.2 to 100.4. EUI fell from 17.9 to 17.3. For the largest EU economies, the ESI improved markedly for Spain (+1.1) and more moderately for the Netherlands (+0.5), while it deteriorated for France (-0.7) and Italy (-0.7). The ESI remained broadly stable for Germany (-0.2) and Poland (-0.1).
RBA's Hauser cautions against policy decisions based on single data point
In an event today, RBA Deputy Governor Andrew Hauser emphasized the need for comprehensive analysis before making policy decisions, stating, "it would be a bad mistake to set policy on the basis of one number and we don't intend to do that."
This comment comes in the wake of Australia's May CPI release earlier this week, which showed an unexpected acceleration to 4%, leading money markets to price in a 50-50 chance of another 25bps rate hike in August.
Hauser highlighted the importance of considering the broader economic context, noting that the monthly consumer price indicator provides only partial information.
He stressed, "there's a whole series of data coming out between now and when we meet in August."
NZ ANZ business confidence falls to 6.1, inflation pressure eases further
New Zealand ANZ Business Confidence fell from 11.2 to 6.1 in June. Despite this decrease in overall confidence, there was a slight improvement in the own activity outlook, from 11.8 to 12.2.
Cost expectations decreased from 72.6 to 69.2, while pricing intentions dropped significantly from 41.6 to 35.3, signaling easing price pressure in the business environment. Furthermore, inflation expectations continued their steady descent, moving from 3.59% to 3.46%.
ANZ noted that "the economy is clearly weak, as the RBNZ intended." More importantly, there appears to be "renewed meaningful progress on bringing inflation pressures down." This fosters optimism that RBNZ might be able to lower the Official Cash Rate considerably earlier than the currently projected August next year.
EUR/USD Mid-Day Outlook
Daily Pivots: (S1) 1.0658; (P) 1.0688; (R1) 1.0710; More....
EUR/USD recovered after breaching 1.0667 briefly and intraday bias remains neutral. Outlook stays outlook stays bearish with 1.0760 resistance intact. Decline from 1.0915 is seen as another leg in the larger corrective pattern. Firm break of 1.0667 will target 1.0601 and below. However, decisive break of 1.0760 will turn intraday bias back to the upside for stronger rebound.
In the bigger picture, price actions from 1.1274 are viewed as a corrective pattern that's still in progress. Break of 1.0601 will target 1.0447 support and possibly further to 100% projection of 1.1274 to 1.0447 from 1.1138 at 1.0311. For now, this will remain the favored case as long as 1.0915 resistance holds, in case of rebound.
Economic Indicators Update
| GMT | Ccy | Events | Actual | Forecast | Previous | Revised |
|---|---|---|---|---|---|---|
| 23:50 | JPY | Retail Trade Y/Y May | 3.00% | 2.00% | 2.40% | 2.00% |
| 01:00 | AUD | Consumer Inflation Expectations Jun | 4.40% | 4.10% | ||
| 01:00 | NZD | ANZ Business Confidence Jun | 6.1 | 11.2 | ||
| 08:00 | EUR | Eurozone M3 Money Supply Y/Y May | 1.60% | 1.60% | 1.30% | |
| 09:00 | EUR | Eurozone Economic Sentiment Jun | 95.9 | 96.3 | 96 | |
| 09:00 | EUR | Eurozone Industrial Confidence Jun | -10.1 | -9.6 | -9.9 | |
| 09:00 | EUR | Eurozone Services Sentiment Jun | 6.5 | 6.4 | 6.5 | |
| 09:00 | EUR | Eurozone Consumer Confidence Jun F | -14 | -14 | -14 | |
| 12:30 | USD | Initial Jobless Claims (Jun 21) | 233K | 230K | 238K | |
| 12:30 | USD | Durable Goods Orders May | 0.10% | -0.10% | 0.60% | |
| 12:30 | USD | Durable Goods Orders ex Transport May | -0.10% | 0.10% | 0.40% | |
| 12:30 | USD | Goods Trade Balance (USD) May P | -100.6B | -96.0B | -99.4B | |
| 12:30 | USD | Wholesale Inventories May P | 0.60% | 0.20% | 0.10% | |
| 12:30 | USD | GDP Annualized Q1 F | 1.40% | 1.30% | 1.30% | |
| 12:30 | USD | GDP Price Index Q1 F | 3.10% | 3.00% | 3.00% | |
| 14:00 | USD | Pending Home Sales M/M May | 0.60% | -7.70% | ||
| 14:30 | USD | Natural Gas Storage | 53B | 71B |
US initial jobless claims falls to 233k, vs exp 230k
US initial jobless claims fell -6k to 233k in the week ending June 22, slightly above expectation of 230k. Four-week moving average of initial claims rose 3k to 236k.
Continuing claims rose 18k to 1839k in the week ending June 15, highest since November 27, 2021. Four-week moving average of continuing claims rose 12k to 1816k, highest since December 4, 2021.
US durable goods orders rise 0.1% mom, ex-transport orders down -0.1% mom
US durable goods orders rose 0.1% mom to USD 283.1B in May, above expectation of -0.1% mom. Ex-transport orders fell -0.1% mom to 187.7B, below expectation of 0.1% mom. Ex-defense orders fell -0.2% mom to USD 266.1B. Transportation equipment rose 0.6% mom to USD 95.4B.
