Sample Category Title
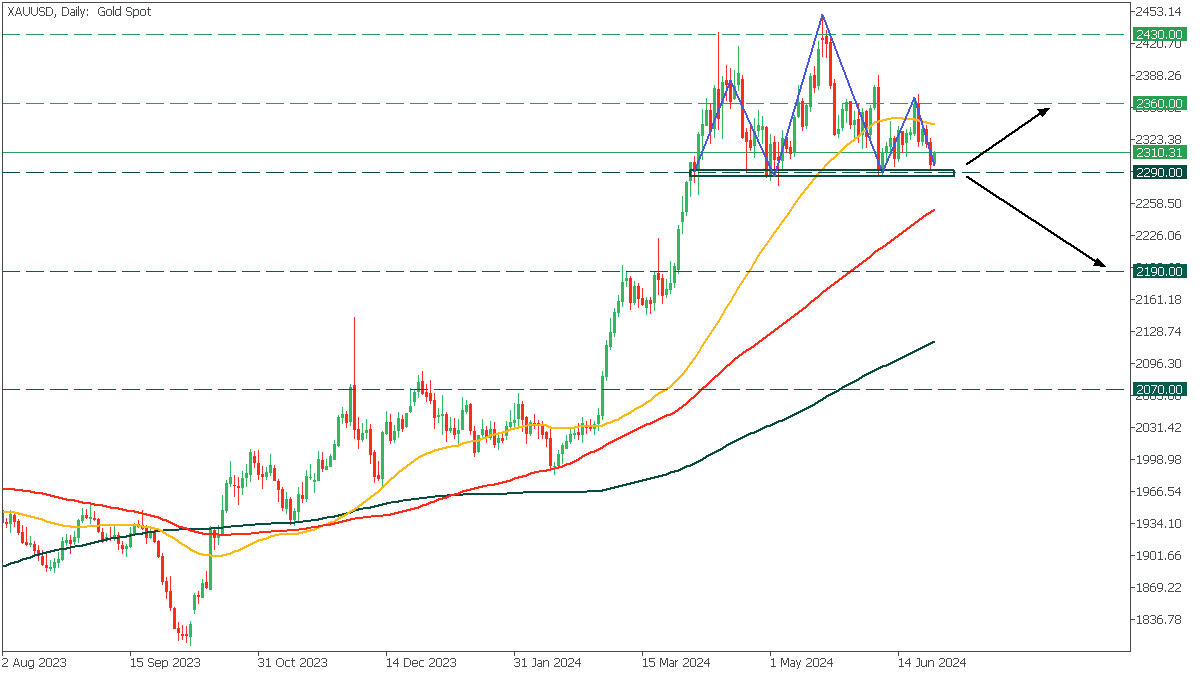
XAUUSD: Head And Shoulders Pattern
On the Daily chart, XAUUSD navigates within a head-and-shoulders pattern and rebounds from a crucial 2290 support zone. Further scenarios unfold:
- If the price fails to surpass the support zone, it will likely lead to a rise toward the 2360 level;
- However, breaching below the 2290 will indicate a decline to 2190 support.
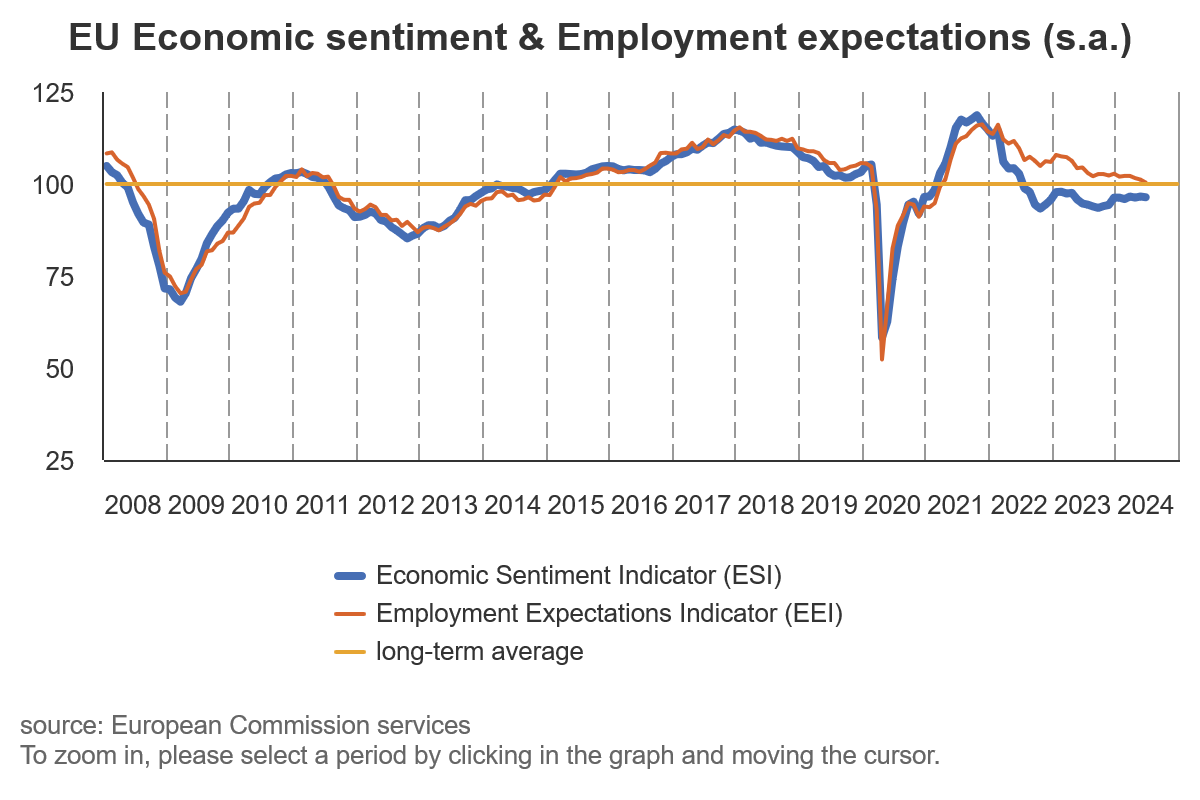
Eurozone economic sentiment falls slightly to 95.9, EU ticks down to 96.4
Eurozone Economic Sentiment Indicator ticked down from 96.1 to 95.9 in June. Employment Expectation Indicator fell from 101.3 to 99.7. Economic Uncertainty Indicator fell from 18.5 to 18.0.
Eurozone industry confidence fell from -9.9 to -10.1. Services confidence fell from 6.8 to 6.5. Consumer confidence improved slightly from -14.3 to -14.0. Retail trade confidence fell from -6.8 to -7.8. Construction confidence fell from -6.2 to -7.0.
EU ESI fell from 96.6 to 96.4. EEI fell from 101.2 to 100.4. EUI fell from 17.9 to 17.3. For the largest EU economies, the ESI improved markedly for Spain (+1.1) and more moderately for the Netherlands (+0.5), while it deteriorated for France (-0.7) and Italy (-0.7). The ESI remained broadly stable for Germany (-0.2) and Poland (-0.1).
Buyers Failed to Pick Up on the Crypto Market
Market Picture
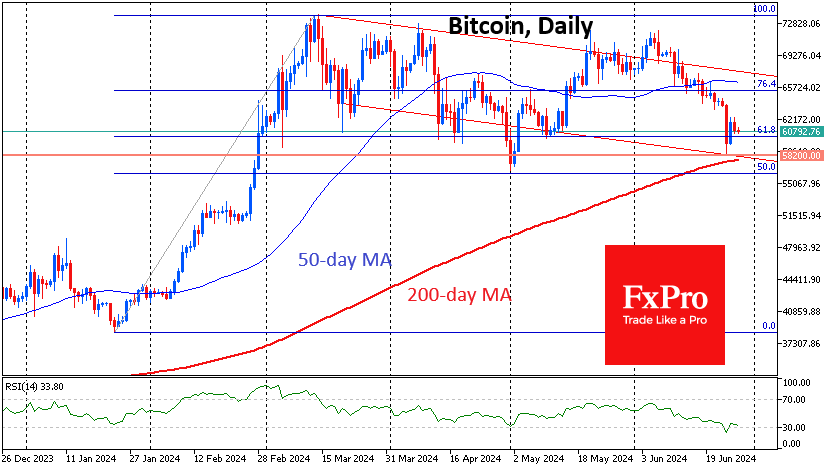
The crypto market has been under moderate but persistent pressure throughout Wednesday, losing 1.26% over the past 24 hours to $2.24 trillion. Prices of top coins are down, except for Toncoin, which adds 1.6% for the day and 19% for 30 days, and Tron (+0.4% for the day and +10% for 30 days).
Bitcoin is trading near $60.7K, having clawed back nearly half of the rebound from Monday’s lows. After the market met the long-overdue demand for spot ETFs, selling factors by miners and long-term holders began to have a noticeable impact on quotes. Also important for Bitcoin is the sentiment in global markets, where the neutral tone is replaced by neat pressure, which is also negative for the price of the first cryptocurrency.
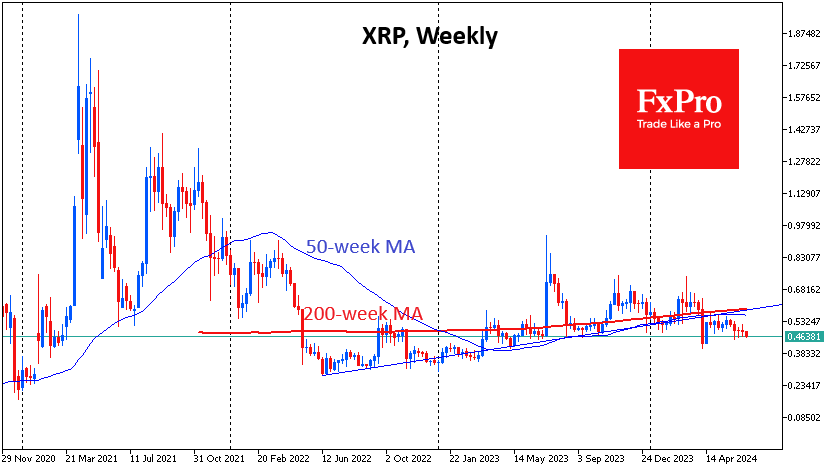
The XRP price went back to $0.4640, the area of this month’s lows and a support level for the last twelve months. Sellers have been pushing quotes for the past five weeks. Earlier this year, the price broke key long-term support levels in the form of a trendline through the 2022 and 2023 lows and the 200 and 50-week averages. Without overall positivity in the crypto market, it could be a matter of days before the sell-off accelerates sharply.
News background
In terms of on-chain analysis, quotes have crossed the realised price level of short-term holders at $62,000, which historically can act as support during corrections in bull markets.
According to Arkham data, German authorities sent another 595 BTC worth ~$36.6 million to crypto exchanges on 26 June. Authorities began actively moving the cryptocurrency on 19 June, when some of it first hit the Kraken and Bitstamp exchanges.
Bitwise forecasts net inflows into spot ETH-ETFs in the US of $15bn in the first 18 months. Bloomberg expects trading in the new product to start on 2 July.
Solana Foundation has launched tools that enable it to turn any website or app into a gateway for cryptocurrency payments and other blockchain transactions.
On 26 June, the Blast development team completed the first phase of an airdrop, distributing 17 billion BLAST tokens (17% of the total issuance). Blast is an Ethereum-based layer 2 (L2) network that was launched in November 2023 by Blur founder under the pseudonym Pacman. In terms of blockchain value locked (TVL), the Blast ecosystem is ranked sixth in the DeFi Llama ranking with a value of $1.58bn.
USD/JPY Rate Hits Highest Level Since 1986
As shown in the USD/JPY chart, today the rate is around 160.58 yen per US dollar.
Bloomberg reports the words of Japan’s Finance Minister Shunichi Suzuki:
→ Stable dynamics are important for currency rates.
→ Sharp unilateral movements are highly undesirable.
→ We will closely monitor the situation and take action if necessary.
Such rhetoric from officials seems not to have deterred the bulls, who are keeping the rate above the April high (when the Bank of Japan intervened in the market to support the weakened yen, resulting in a 4.75% decline over 5 days).
In our analysis from 24 June, we noted that:
→ the price is moving within a large upward channel (shown in blue),
→ and the local rise (framed by orange lines) could push the price to the boundaries of the blue channel.

Updated technical analysis of USD/JPY shows that:
→ the price continues to hold within the orange channel;
→ in the coming days, the April high of 160.20 yen per dollar may act as support after being broken, reinforced by the median line of the orange channel.
It seems the bulls are in control, highlighted by the RSI indicator, which has not dropped below the 50 level since mid-June.
However, everything could change suddenly with the release of US inflation data tomorrow at 15:30 GMT+3. It is possible that the data will indicate rising inflation (as it did in Australia this week), and the US dollar will strengthen further, pushing the USD/JPY rate even higher – potentially prompting another intervention by the Bank of Japan.
Be prepared for possible spikes in volatility.
Trade over 50 forex markets 24 hours a day with FXOpen. Take advantage of low commissions, deep liquidity, and spreads from 0.0 pips. Open your FXOpen account now or learn more about trading forex with FXOpen.
This article represents the opinion of the Companies operating under the FXOpen brand only. It is not to be construed as an offer, solicitation, or recommendation with respect to products and services provided by the Companies operating under the FXOpen brand, nor is it to be considered financial advice.
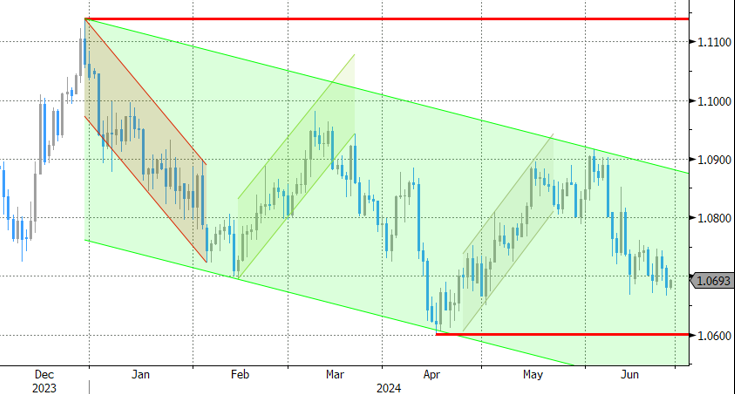
European Currencies Face a Crucial Test: What to Expect
The end of June and the beginning of July are packed with significant economic and political events for the pound and the euro. A few weeks ago, Emmanuel Macron dissolved the parliament and announced snap parliamentary elections. He took this step after the far-right National Rally led by Marine Le Pen secured first place in the European Parliament elections. Many experts believe that if the far-right gains a majority in the parliament, it could lead to a serious political crisis in the EU, consequently exerting bearish pressure on EUR/USD.
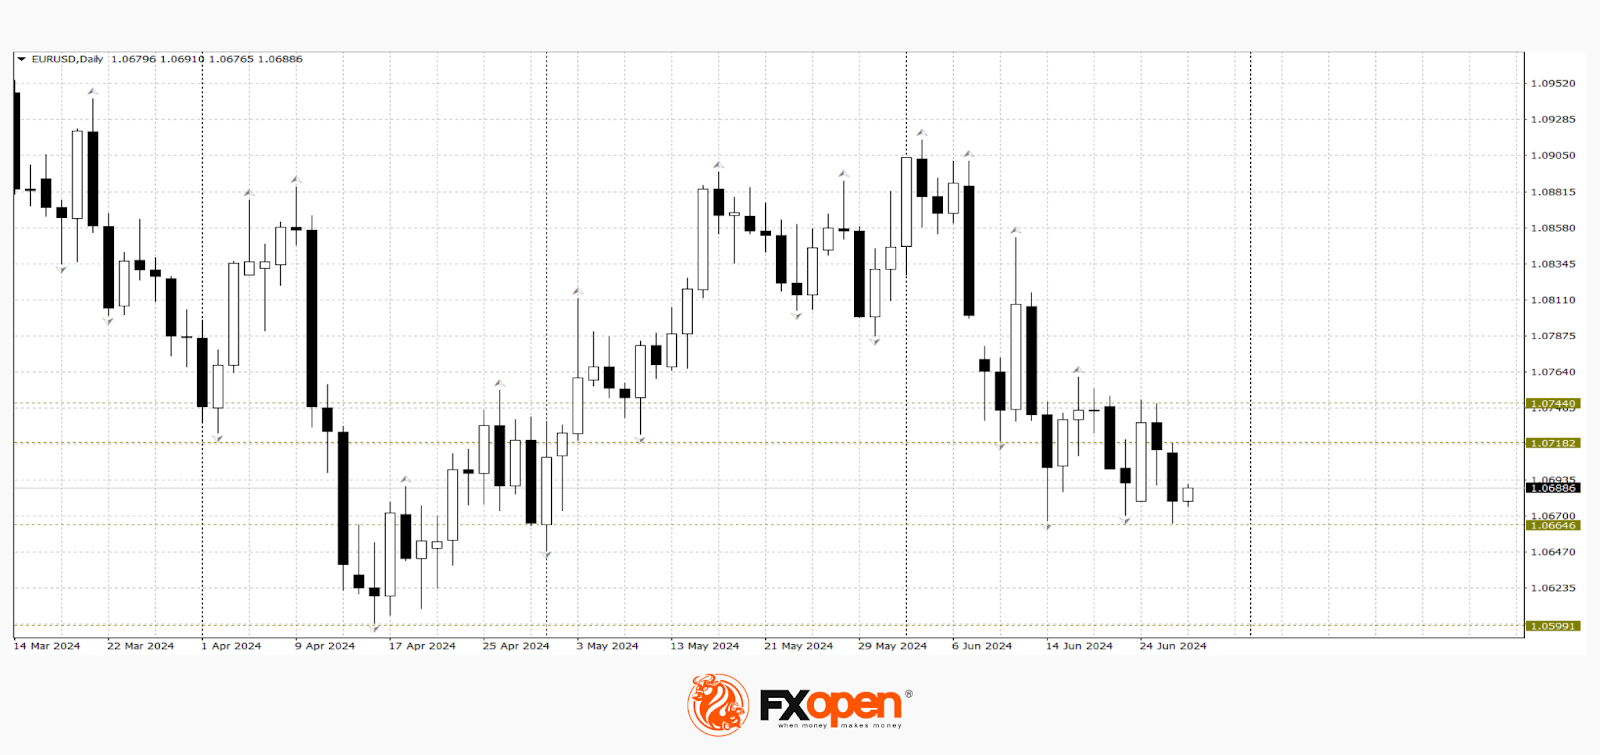
EUR/USD
According to the technical analysis of the EUR/USD pair, if the price falls below 1.0660, the pair may continue its downward trend towards 1.0600-1.0400. A resumption of the upward trend is possible with a confident consolidation above 1.0740-1.0700. In the upcoming trading sessions, the following events should be noted:
- Today at 12:00 (GMT +3:00) expected consumer inflation in the Eurozone;
- Today at 13:00 (GMT +3:00) special EU summit of heads of state;
- Today at 15:30 (GMT +3:00) US GDP.
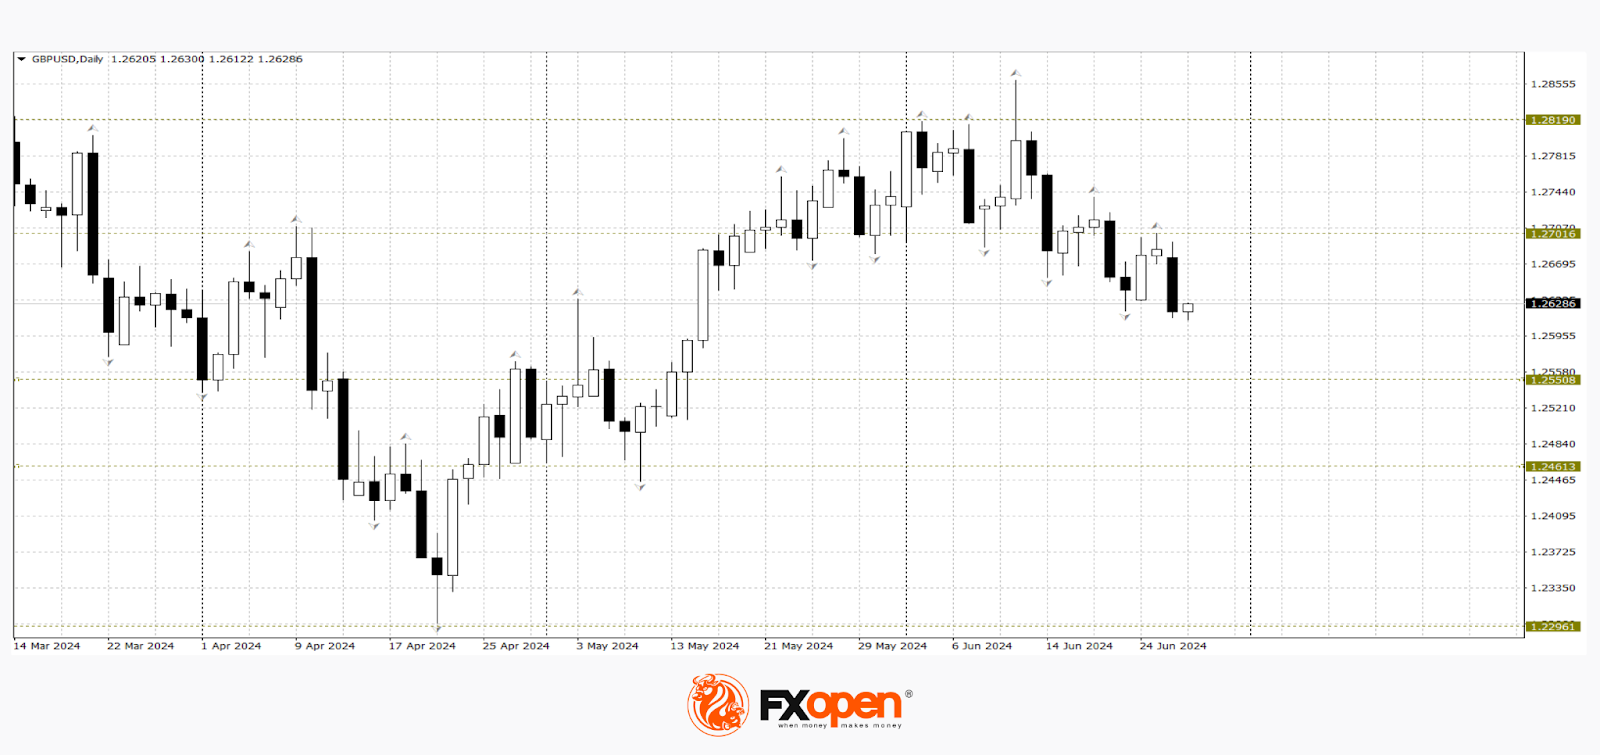
GBP/USD
Similar political uncertainty is observed in the United Kingdom. A month ago, Prime Minister Rishi Sunak announced that he had asked King Charles III to dissolve the parliament and scheduled general elections for 4 July. The upcoming political battle sees the GBP/USD pair near 1.2600. If sellers manage to break this level and consolidate below it, the downward trend may continue towards 1.2550-1.2460. A reversal of the bearish scenario is possible if the price moves above 1.2700. Important events for the pair's pricing today and tomorrow include:
- Today at 12:30 (GMT +3:00) speech by Bank of England Governor Bailey;
- Tomorrow at 09:00 (GMT +3:00) business investments in the UK;
- Tomorrow at 09:00 (GMT +3:00) UK GDP for the first quarter.
Trade over 50 forex markets 24 hours a day with FXOpen. Take advantage of low commissions, deep liquidity, and spreads from 0.0 pips. Open your FXOpen account now or learn more about trading forex with FXOpen.
This article represents the opinion of the Companies operating under the FXOpen brand only. It is not to be construed as an offer, solicitation, or recommendation with respect to products and services provided by the Companies operating under the FXOpen brand, nor is it to be considered financial advice.
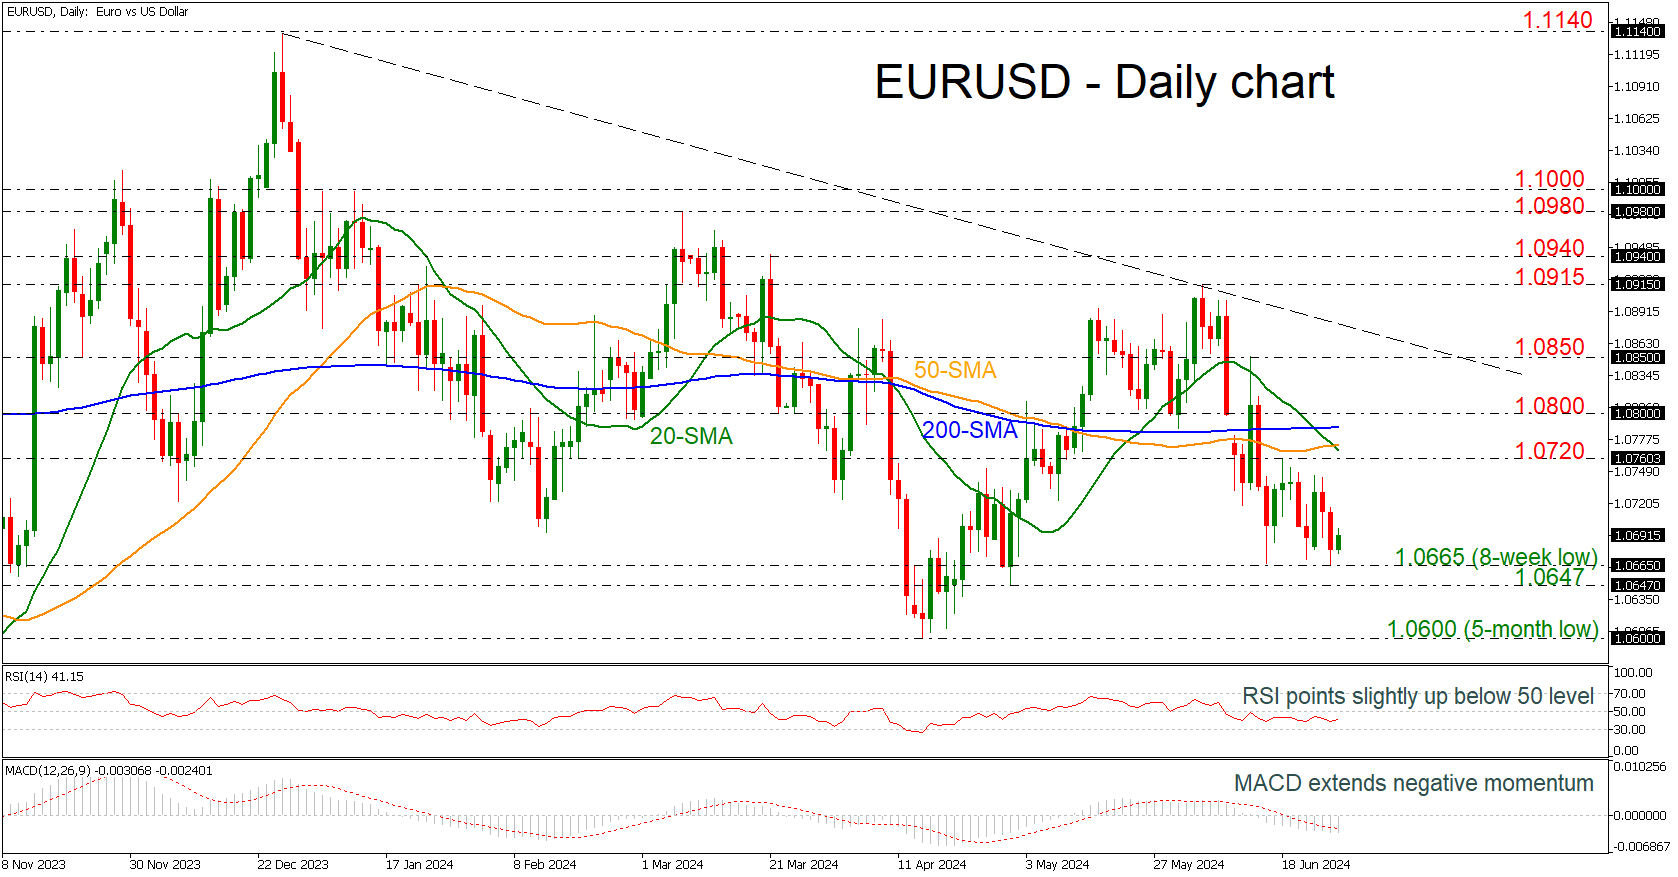
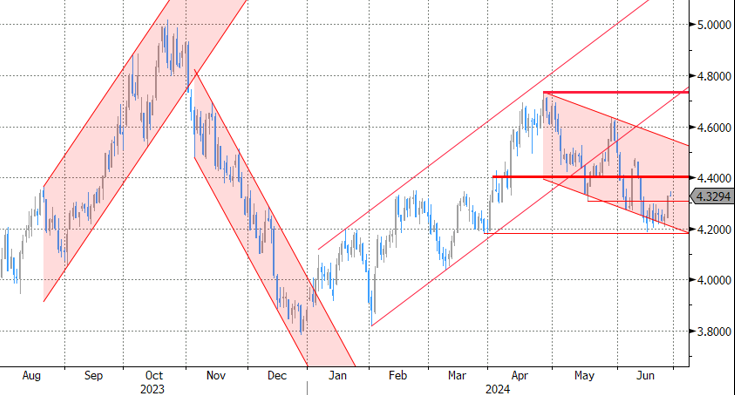
EURUSD Rises Slightly Up After Battle With 8-Week Low
- EURUSD holds in sideways move
- SMAs create bearish crossovers
- MACD continues to head south
EURUSD tested the previous low of 1.0665 on Wednesday, holding within a narrow range of 1.0665-1.0720. The 20- and 50-day simple moving averages (SMAs) posted a bearish crossover a few days after the death cross between the 20- and the 200-day SMAs, both hinting at more losses.
Technically, the momentum oscillators are showing some mixed signals confirming the lack of direction in the near term. The RSI is sloping marginally up below 50 level, while the MACD is strengthening its negative steam.
Further losses could drive traders to the next immediate support at 1.0647 before battling with the five-month low of 1.0600.
On the other hand, a rebound off the latest bottom could lift the market towards the previous peak of 1.0720 before challenging the SMAs around 1.0770 and 1.0790. Significant resistance is also coming from the 1.0800 round number, but the market would still be negative until a successful climb above 1.1000.
To conclude, EURUSD is looking neutral in the short-term view and bearish in the broader outlook as the long-term downtrend line is still in place.
Is France Headed for Political Stalemate and How Bad is this for Euro?
- Far-right National Rally party maintains lead ahead of June 30 first round of votes
- But can it secure an absolute majority as left-wing alliance makes progress?
- A hung parliament might be the worst outcome for the euro
France in political turmoil
President Macron’s decision to call a snap legislative vote hot on the heels of the European elections came as a complete shock not only in France but also across Europe, not to mention for financial markets. What is widely perceived as an attempt by Macron to reassert his authority in the French parliament after his party lost its majority at the previous election in 2022, the move appears to have backfired.
Macron was probably hoping that the mere threat of Marine Le Pen’s National Rally or Rassemblement National (RN) party coming into power after it won the most French seats in the European Parliament would have been a wake-up call for other parties, as well as the French public, to unite against the far right. But that didn’t happen.
With only a few days to go until the first round of voting on June 30, the Ensemble coalition that is led by Macron’s Renaissance party is a distant third in the opinion polls, overtaken by the newly formed alliance of left-wing parties called the New Popular Front (Nouveau Front Populaire - NFP). Meanwhile, RN has widened its lead, with most polls putting it ahead with at least 35% of the vote.
Doubts about a far-right majority
However, that may not necessarily translate to enough seats for RN to obtain an absolute majority in the 577-member National Assembly where 289 seats are required to control the legislative agenda in France’s lower house. This then raises a host of possibilities as to who could form a government.
Talks between RN and an even more hardline far-right party, Reconquete, which belongs to Le Pen’s rival, Eric Zemmour, broke down soon after the announcement of the snap elections. Since then, RN’s 28-year-old leader, Jordan Bardella, has signalled he is not interested in sharing power with other parties and has set the goal of winning an absolute majority.
Going mainstream
This can be seen as being both a positive and negative move. RN is clearly trying to appeal to mainstream voters to secure the majority it needs and in doing so, it has had to tone down some of its more controversial ideas. This is good news for the markets as it reduces the risk of a Liz Truss-style debt crisis and a confrontational relationship with the European Union.
RN’s likely candidate for the post of finance minister has said the party would abide by the EU’s fiscal rules, while Bardella appears to have rowed back on a pledge to undo Macron’s pension reforms, which raised the retirement age to 64. The party’s softened stance on many of its radical policies helped to calm investors’ fears, with the yield spread between French and German 10-year bonds declining somewhat from the post-European election spike.
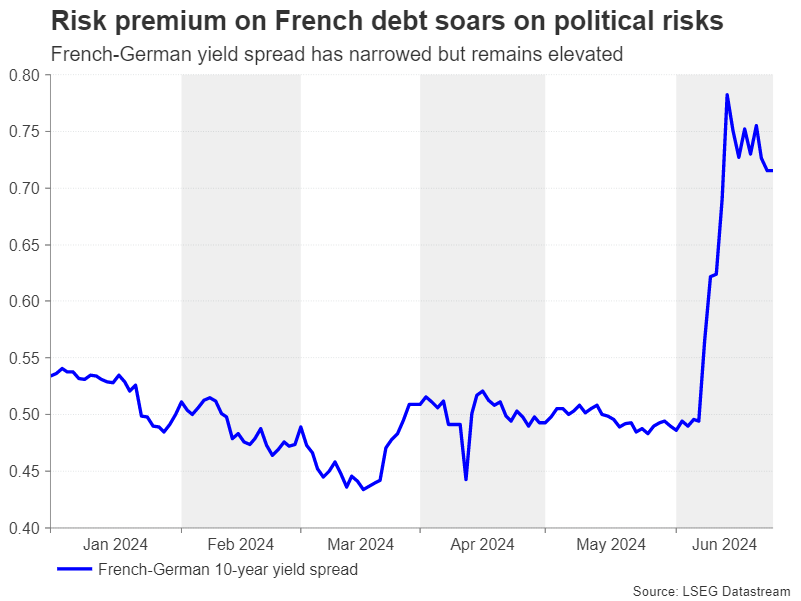
The euro has also been steadier but remains within its short-term downward trajectory amid the uncertainty about the outcome of the elections. If an RN majority was more certain, the euro might be under less pressure right now as Le Pen and Bardella seem to be taking the party in a similar direction as Italy’s Giorgia Meloni has done with her far-right Brothers of Italy party when she won the country’s election.
Is the left a bigger threat?
If RN wins the most seats but falls short of a majority, it’s still possible it would try to form some sort of a coalition with other parties, potentially with the right-wing Les Republicains, despite ruling it out for now.
The bigger fear is if the left-wing NFP comes a close second and manages to strike a deal with other smaller parties. Its policies include increasing public sector pay by 10%, lowering the retirement age to 62 and boosting healthcare and education. Although it plans to finance these by hiking taxes, it’s questionable if the amount raised would cover the planned 150 billion euros in spending.
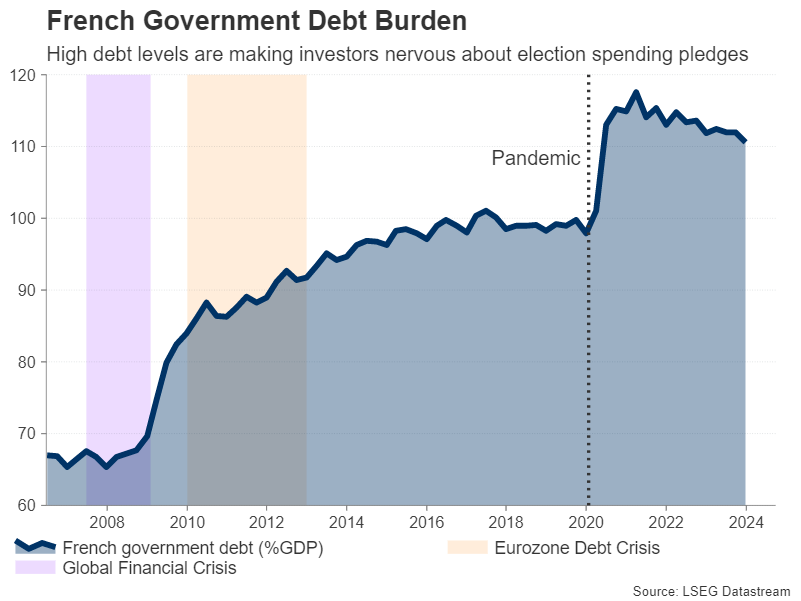
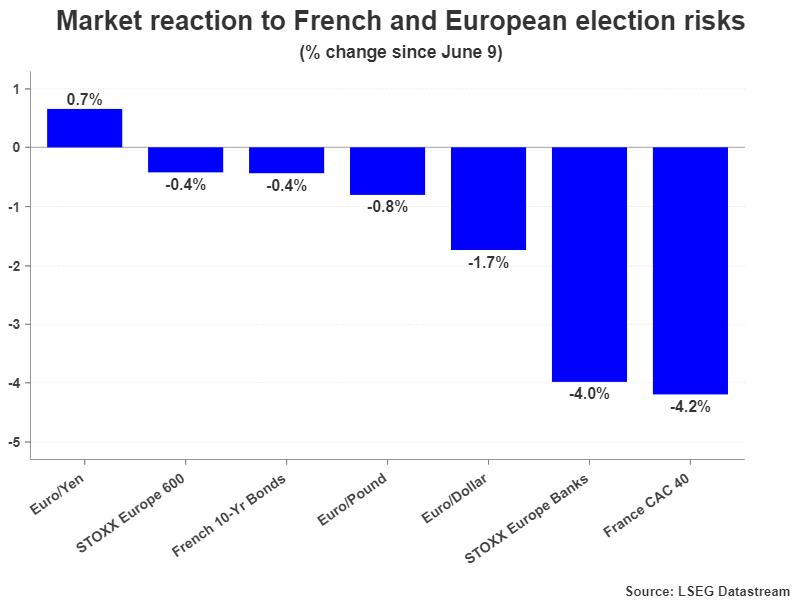
France already has a very high debt level of more than 100% of GDP and ran a budget deficit of 5.5% in 2023, in excess of the EU’s 3% limit. Any new government that triggers alarm bells about higher spending would likely spark another panic in the markets, sending French yields sharply higher and stocks lower. France’s leading stock index, the CAC 40, shed more than 7% as the political turmoil unfolded before rebounding somewhat.
Can Macron’s party hold onto power?
A less disastrous scenario for the markets is if Macron’s Ensemble coalition were to agree to a pact with the NFP simply to keep out the far right and since this would be its only option of being in government given Macron’s plummeting approval ratings. An alliance between the left and centrists parties would probably produce a more moderate government. But even if such a coalition can be agreed, it might not last long or struggle to pass legislation.
In the event of a hung parliament, the President can play a role in pushing parties to reach a deal. The President can also exercise his influence by picking the next prime minister, especially when there’s no clear winner and so the post does not necessarily go to someone from the largest party. However, with so many fractures across France’s political spectrum, it’s hard to see parties putting their differences aside for the sake of avoiding political instability.
Political paralysis
Under the French constitution, new parliamentary elections cannot take place for another year after the last one. So, if no parties are able to form a government, there would likely be political paralysis for at least a whole year or until Macron’s term expires in 2027. If push comes to shove, Macron may decide to stand down before then, even though he has said he would not do so.
For currencies and financial markets in general, there is nothing more dreaded than uncertainty, so the prospect of a prolonged period of uncertainty in the Eurozone’s second largest economy does not bode well for the euro. Making matters worse are concerns about the rise of far right parties in other European countries such as Germany where the ruling coalition is hanging by a thread.
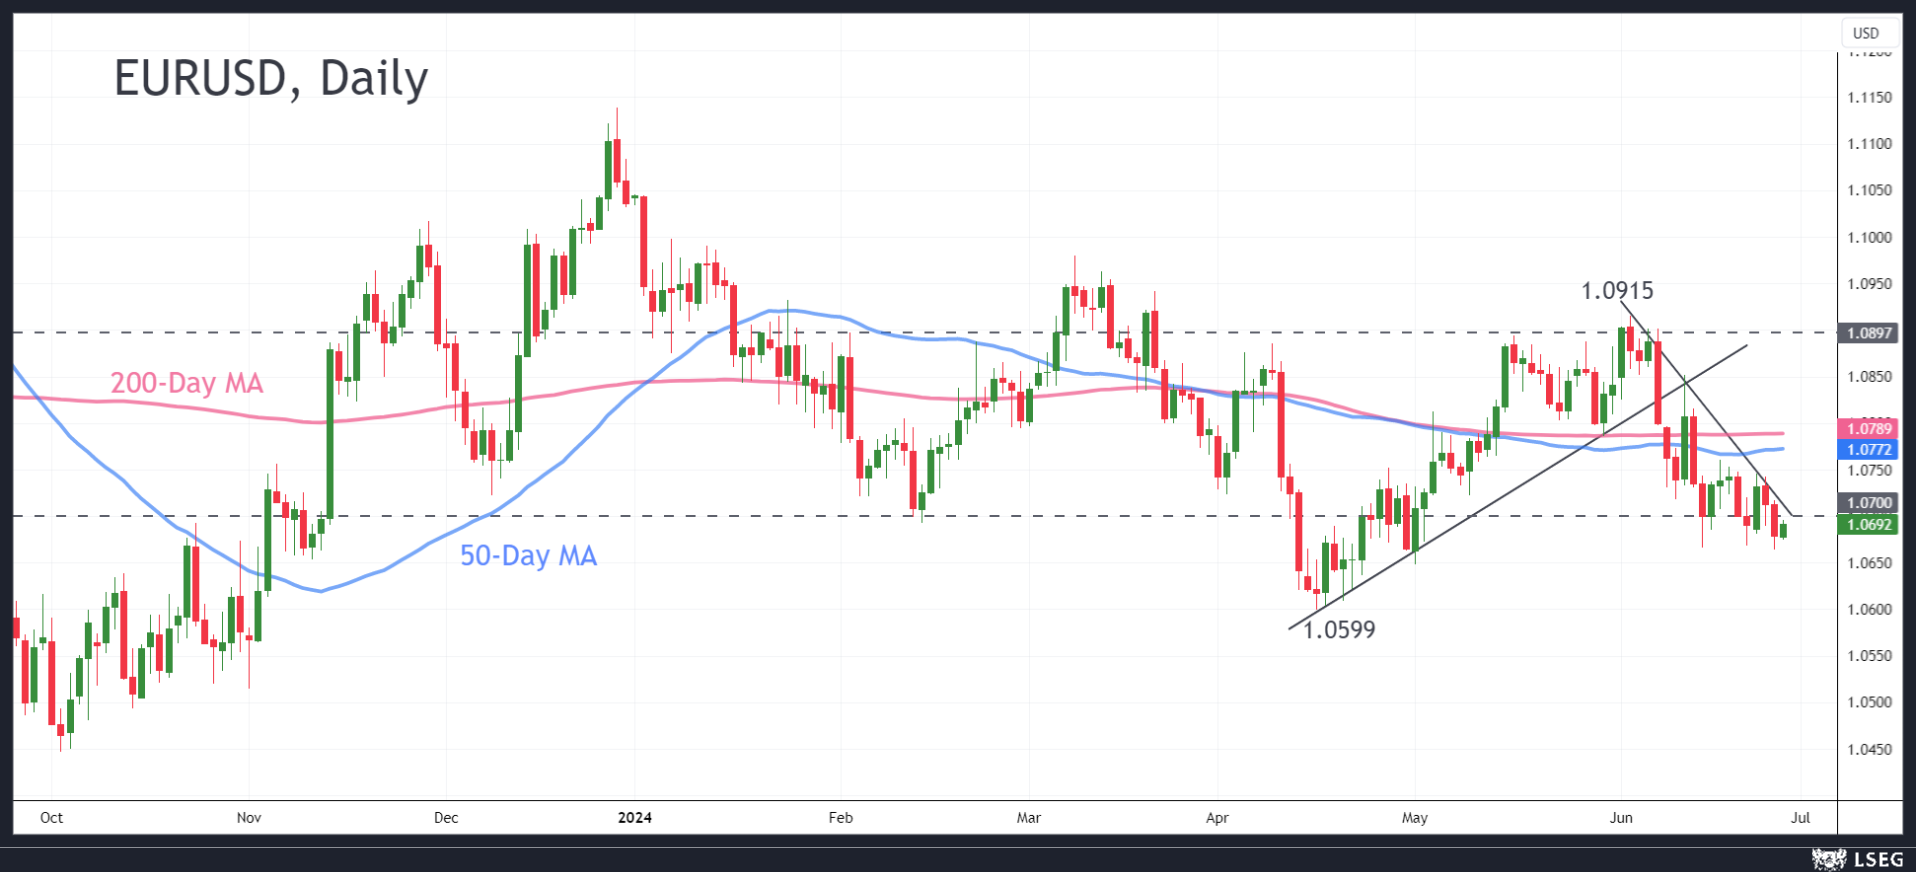
Euro bears eye dollar parity
Against the US dollar, the single currency has already taken quite a tumble, slipping from the $1.0900 level to lows of around $1.0670. With the final results of the election not due until after the second round on July 7, the euro could continue drifting downwards, possibly towards the April low of $1.0599.
The heightened political risks that have rekindled fears of a fresh debt crisis are already weighing on business sentiment, endangering the Eurozone’s feeble economic recovery. Any sustained deterioration in business confidence could add to the euro’s woes, as the European Central Bank might be more inclined to cut interest rates aggressively.
Whilst steeper rate cuts would be positive for risk assets, it would be bearish for the euro. In the worst case scenario where an extreme right or extreme left party takes power with an agenda of unfunded spending, or even a messy situation where the ruling coalition is unable to ‘cohabit’ with President Macron, the euro could face the prospect of parity again with the dollar.
More Verbal Intervention Warnings by Japanese Top Officials
Markets
The sell-off at the long end of the US Treasury curve was the odd one out yesterday. The US Note future slid from start to finish with tenors from 7- to 30-yr adding around 8 bps. From a technical point of view, this lifts the 10-yr yield away from the recent lows/support zone near 4.20%. The front end of the curve (2-yr) is still stuck near 4.70%. Yesterday’s move stood out given that it occurred in what was mostly a risk-off session with European stock markets throwing away opening losses, the dollar marching to new short-term highs and French assets underperforming. The move also occurred in the run-up to tomorrow’s May PCE deflators which should be a benign outcome after May CPI releases. On top, it coincides with the traditional build-up towards the end-of-quarter which often sees beneficial flows towards bonds. Our best guess for yesterday’s underperformance of US Treasuries has to do with tonight’s presidential debate between Biden and Trump. None of them seems to have reigning in ailing public finances as a top priority. On the contrary, fiscal policy could remain expansionary. Former NY Fed governor Dudley highlighted the matter again yesterday in an opinion piece. Markets tend to forget that the CBO last week upgraded the fiscal 2024 budget deficit forecast from $1.5tn to $1.9tn. To know that longer-term studies by that same Congressional Budget Office already point at budget deficits of more than 5% of GDP for the next 30 years. In this respect, Dudley warns that the more the government borrows, the greater the change it’ll end up in a vicious cycle in which government debt and interest rates drive one another inexorably upward. “It’s impossible to know when investors will decide that such risks are too much to bear, as the bond vigilantes famously did in the 1990s. When it happens, it tends to be sudden and brutal”.
News flow is thin this morning apart from more verbal intervention warnings by Japanese top officials as USD/JPY holds above 160. EUR/USD trades south of 1.07 and is likely to stay there ahead of and after the first round of French parliamentary elections (Sunday). We keep a close eye at the long end of core bond curves to see whether yesterday’s move was a one-off repositioning or whether more is at hand. Apart from the above-mentioned presidential debate, the eco calendar contains EC confidence data, US weekly jobless claims and durable goods orders. We don’t expect these figures to be of any importance. The US Treasury concludes its end-of-month refinancing operation with a $44bn 7-yr Note sale and there are policy meetings in Sweden, Turkey and the Czech Republic.
News & Views
In its yearly regular stress test of US largest banks, the Fed concluded that “while large banks would endure greater losses than last year's test, they are well positioned to weather a severe recession and stay above minimum capital requirements”. The greater loss compared to last year comes from substantial increases in banks’ credit card balances with higher delinquency rates, riskier corporate credit portfolios and higher expenses and lower fee income in recent years. The hypothetical scenario includes a severe global recession with a 40% decline in commercial real estate prices, a substantial increase in office vacancies, and a 36% decline in house prices. The unemployment rate rises nearly 6-1/2 percentage points to a peak of 10%, and economic output declines commensurately. The Board also conducted an exploratory analysis, including two funding stresses to all banks tested and two trading book stresses to only the largest and most complex banks. The two funding stresses include a rapid repricing of deposits, combined with a more severe and less severe recession. The trading book stresses included the failure of five large hedge funds under different market conditions.
Japanese retail sales beat consensus in May, rising by 1.7% M/M and 3% Y/Y, compared to 0.8% M/M and 2% Y/Y in April. Even as some of the gains might be due to price increases, the data are supportive for the BOJ’s aim to support domestic consumption via higher wages. The data also suggest that Japanese consumption might support Q2 economic growth after a contraction the first quarter. (Q1 GDP contracted 0.5% with consumption even declining 0.7% Q/Q).
Graphs
GE 10y yield
The ECB cut its key policy rates by 25 bps at the June policy meeting. A more bumpy inflation path in H2 2024, the EMU economy gradually regaining traction and the Fed’s higher for longer US strategy make follow-up moves difficult. Markets are coming to terms with that. For the time being, though, the political narrative (France) dominates. After hitting a new YtD top at 2.7%, the German 10-yr yield corrected lower on safe haven bids.

US 10y yield
The Fed is seeking more evidence than just one slower-than-expected (May) CPI is providing. Upgraded inflation forecasts and a higher neutral rate complicate the exact timing of a first cut further. June dots suggest one move in 2024 followed by four more next year. Markets are positioned more aggressively, turning the recent low in yields into a technical support zone. The US 10-y yield is testing the downside of the 4.2/4.7% trading range.
EUR/USD
EUR/USD is stuck in the 1.06-1.09 range. The desynchronized rate cut cycle with the ECB exceptionally taking the lead, strong US May payrolls and a swing to the right in European elections pulled the pair away from 1.09 resistance. The Fed meeting balanced the weaker than expected US CPI outcome. Euro fragility makes a return to the 1.06 downside more likely than not.
EUR/GBP
Debate at the BOE is focused at the timing of rate cuts. May headline inflation returned to 2%, but core measures weren’t in line with inflation sustainably returning to target any time soon. Still some BoE members at the June meeting appeared moving closer to a rate cut. This might cap further sterling gains. At the same time, the euro remains vulnerable to political event risk going into the French elections. EUR/GBP 0.84 is becoming solid support.

Yen Drops to 1986 Low
In focus today
Today focus will be on the Riksbank's policy rate announcement at 09.30 CEST followed by a press conference at 11.00 CEST. The Riksbank is widely expected to leave the policy rate unchanged at 3.75%. We stick to our call for the next rate cut coming in September, followed by quarterly cuts of 25bp, bringing the policy rate to 2.25% at the end of 2025. Market focus will instead be on the updated rate path projection and inflation forecast, however no major revisions to the March forecast seem warranted as May inflation surprised to the upside. For Sweden, NIER's Economic Tendency Survey is also published at 09.00 CEST.
In the US, President Biden faces former President Trump for the first time this election campaign in a 90-minute televised debate hosted by the CNN. The debate may shed more light on each of their ambitions for fiscal policy and regulation in the coming years. The debate begins at 21.00 ET (Friday 03.00 CEST).
In the euro area, we look out for the May monetary aggregates and lending data. Our focus is on the lending data as we have recently seen a rebound in the credit impulse.
The Central Bank of Turkey will announce their policy rate at 13.00 CEST. In line with consensus, we expect them to keep the policy rate unchanged at 50.0%.
Overnight we get some interesting Japanese data. These include Tokyo May inflation and industrial production. Price pressures have muted in Japan recently and Tokyo data will indicate whether this trend continued in June. Japan has been less affected by the global manufacturing recession than most due to support from the weak yen. With manufacturing PMIs close to 50 in June, we are looking for some comeback in industrial production.
Danske Morning Mail will take a summer break from 1 July to 12 August.
Economic and market news
What happened overnight
In Japan, authorities issued fresh warnings that they may soon intervene in FX markets, as the JPY continued to weaken and fell to its lowest level against the US dollar (USD/JPY) since 1986. Japanese Finance Minister Shunichi Suzuki said the government would take 'necessary steps', as one-sided rapid currency moves were undesirable, and a cause for concern in regard to the wider economy. When the yen hit a 34-year low against the US dollar at the end of April, Japanese authorities spent USD61bn intervening. The yen dropped to a low of 160.88 last night, and this morning the USD/JPY cross is trading not far from this level at around 160.4.
In China, growth in industrial profits slowed down in May, as they stood at 3.4% YTD y/y (prior: 4.3% YTD y/y). On a sector basis profits in mining had fallen the most at -16.2% YTD y/y, whereas manufacturing had increased the most at 6.3% YTD y/y.
What happened yesterday
In Europe, Italian central bank chief Fabio Panetta said that 'the current macroeconomic picture is consistent with a normalization of the monetary policy stance'. He argued that the stickiness seen in service prices was 'not abnormal in any way', saying the persistence in inflation was 'only apparent' as it merely reflected service prices rising, peaking, and falling later than goods prices.
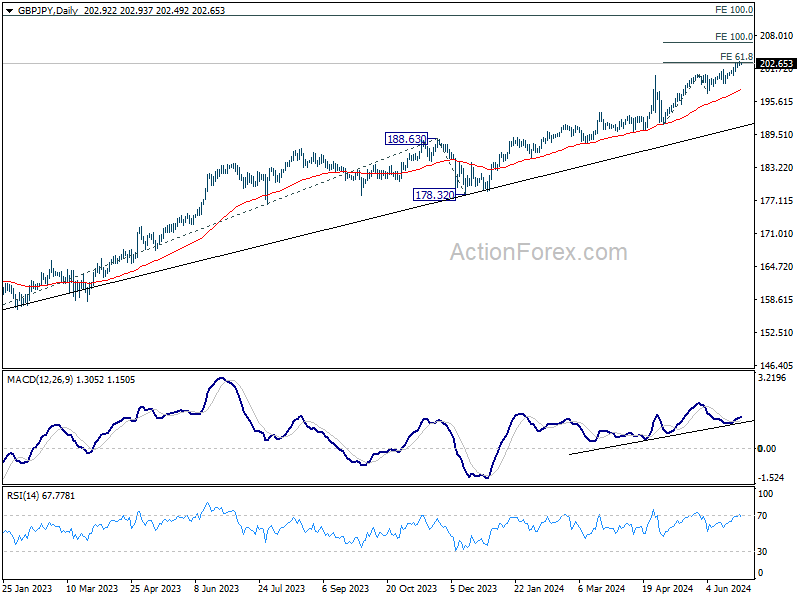
GBP/JPY Daily Outlook
Daily Pivots: (S1) 202.14; (P) 202.43; (R1)202.90; More...
Intraday bias in GBP/JPY remains on the upside for the moment. Firm break of 61.8% projection of 191.34 to 200.72 from 197.18 at 202.97. will pave the way to 100% projection at 206.56 next. On the downside, below 201.95 minor support will turn intraday bias neutral first. But outlook will remain bullish as long as 198.90 support holds, in case of retreat.
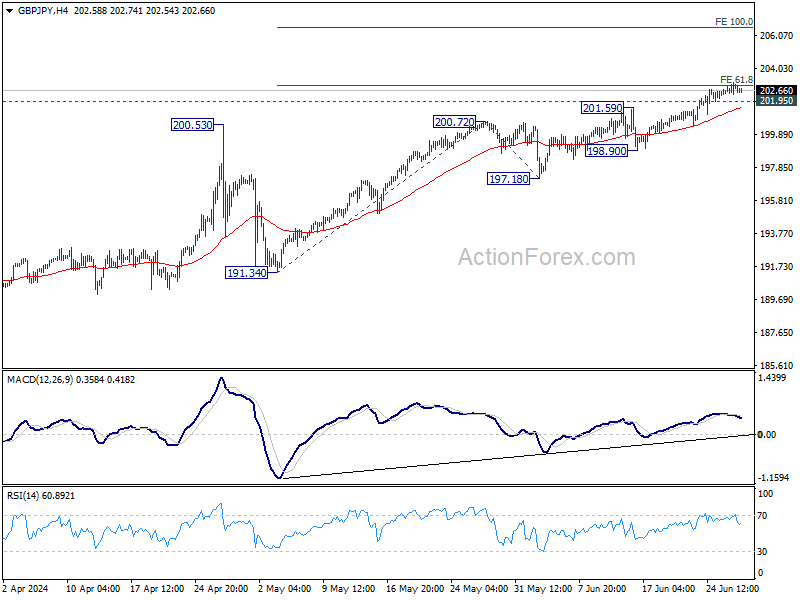
In the bigger picture, long term up trend is still in progress. Next target is 100% projection of 155.33 to 188.63 from 178.32 at 211.62. Outlook will stay bullish as long as 191.34 support holds, even in case of deep pullback.