
Sample Category Title
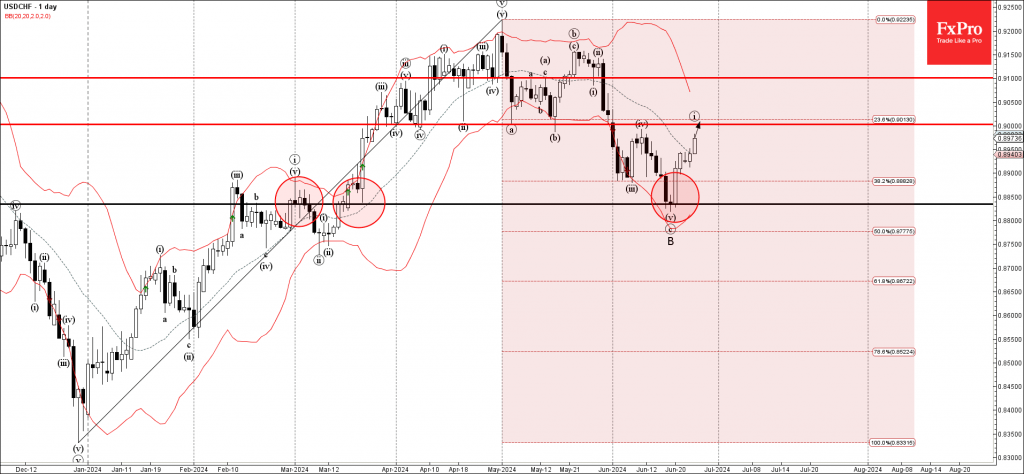
USDCHF Wave Analysis
- USDCHF rising inside impulse wave i
- Likely to reach resistance level 0.9000
USDCHF continues to rise inside the minor impulse wave i, which started earlier, when the pair reversed up from the key support level 0.8835, standing near the lower daily Bollinger Band and the 50% Fibonacci correction level of the previous upward impulse from December.
The upward reversal from the support level 0.8835 created the perfectly formed Japanese candlesticks reversal pattern Morning Star.
Given the continuation of the Swiss franc sales and USD bullish sentiment seen today, USDCHF can be expected to rise toward the next round resistance level 0.9000 (former strong support from April and May).
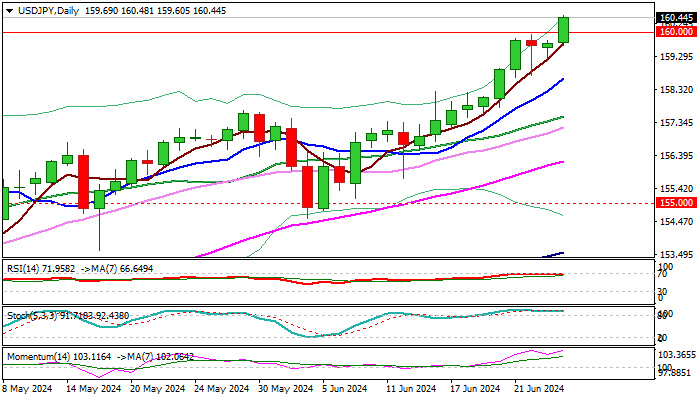
USD/JPY: Probes Again Through 160.00 Barrier and Hits New Multi-Decade Highs
USDJPY hit new multi-decade high above 160 on Wednesday, as bulls regained control after a two-day consolidation.
Fresh probe above psychological 160 barrier suggests that bids remain strong despite warning that Japan’s authorities may intervene to support weakening national currency, with 160 zone seen as a likely trigger.
Strong bids were also signaled by long tails of May / June monthly candles, while dollar remains underpinned by wide gap between monetary policies of Fed and BoJ.
Bulls also ignore overbought conditions on daily chart, with initial bullish signal expected on close above 160 level that would unmask targets at 162.16 /163.38 (Fibo projections) and 164.00 (Oct 1986 high).
Rumors that the Japanese authorities raised the red line for intervention towards 170 zone, may add to fresh bulls to sustain gains above 160.
Initial support lays at 160.00, followed by 159.60 (today’s low / 5DMA) and rising 10 DMA (158.64) which should keep the downside protected.
Res: 161.00; 162.16; 163.38; 164.00.
Sup: 160.00; 159.60; 158.64; 157.70.
Sunset Market Commentary
Markets
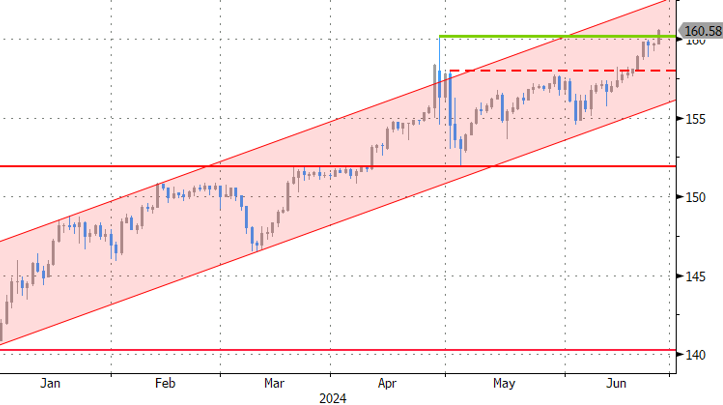
Markets are testing the resolve of Japanese officials. USD/JPY broke through the 160-level which triggered FX interventions at the end of April and early March. The pair set a new nearly 40-yr high above 160.50. Verbal warnings by the Japanese (vice-) finance minister earlier this week don’t result in effective action yet. Japan’s currency chief Kanda said that they are watching forex moves with a high level of urgency. He calls them one-sided and rapid, but didn’t mention “excessive”, which was a trigger point in the past. After his comments, the JPY sell-off just continued. USD/JPY 163 is rumoured to be the new 160. Something tells us that the journey won’t take that long. Japanese officials might be putting their eggs in the US eco update basket which starts this Friday with May PCE deflators and ends next Friday with payrolls. Overall dollar strength is at play as well today as risk sentiment soured during European dealings and going into the US start. The trade-weighted dollar changes hands above 106 for the first time since the end of April with resistance at 106.52 looming. EUR/USD tests the recent lows around 1.0670. From the euro side of the story, this morning’s comments by ECB Rehn might have contributed to some weakness. He aligned with the majority market thinking of 2 additional 25 bps rate cuts this year with the ECB eyeing a 2.25%-2.50% terminal rate. The new French underperformance (both bonds and stocks) going into Sunday’s first round of parliamentary elections could be at play as well.
Today’s core bond sell-off is somewhat at odds with the risk sell-off and USD strength. In the run-up to tomorrow’s first presidential debate between Biden and Trump, US public deficits are taking more and more center stage. The sell-off including underperformance of the long end of the curve could be related to the fact that none of them would really do something about them or on the contrary even engage on some additional fiscal spending. US yields currently add up to 5.5 bps at the very long end (30-yr). German yields add up to 2.5 bps for the longer tenors.
News & Views
The ECB published its biennial report on the progress made towards euro adoption in Bulgaria, the Czech Republic, Hungary, Poland, Romania and Sweden. As EU members they are obliged to adopt the single currency eventually. The ECB said limited progress was made since 2022 and none of them met the criteria to do so yet. Bulgaria came closest, fulfilling all but the price stability criterion. It was the only country for which the ECB also concluded “that its national legislation is consistent with the Treaty and the Statute.” Hungary’s road to the euro is the longest still, with the country meeting none of the rules, which include price stability, debt & deficit levels below 60% and 3% of GDP respectively and convergence of long-term borrowing costs. Its currency was highly volatile (not in in ERM II) and Hungary’s central bank did not comply with rules of independency and the prohibition on monetary financing. Poland and Romania performed marginally better by only fulfilling the debt condition. The Czech Republic met the interest rate and debt criteria. The ECB noted that the strength of public and economic institutions is an important factor in the sustainability of convergence over time but added that with the exception of Sweden, “the quality of institutions and governance in the countries under review remains weaker than elsewhere in the EU.”
Swiss National Bank vice-president Martin Schlegel will Thomas Jordan’s successor from October 1. Jordan unexpectedly announced to step down back in March after 12 years at the helmet. The number two’s promotion is no big surprise and follows tradition within the SNB. It is also a choice for continuity rather than spurring uncertainty by appointing an outsider. Jordan oversaw the SNB embarking on one of the most aggressive Swiss hiking cycles in the wake of the pandemic before reversing course in March. Pioneering the normalization cycle in the advanced world, Jordan’s SNB back then cut rates by 25 bps, followed by another cut last week to 1.25%. The Swiss franc trades stronger on the day though that move already happened before the announcement. EUR/CHF is trading around 0.956.
Graphs
USD/JPY: one-sided FX moves are not yet “excessive”, so JPY sell-off against strong USD continues
AUD 2y swap rate: sticky monthly inflation data suggest RBA will walk the rate hike talk
US 10-yr yield: long end underperforms. Motion of no confidence in fiscal policy ahead of presidential debate?
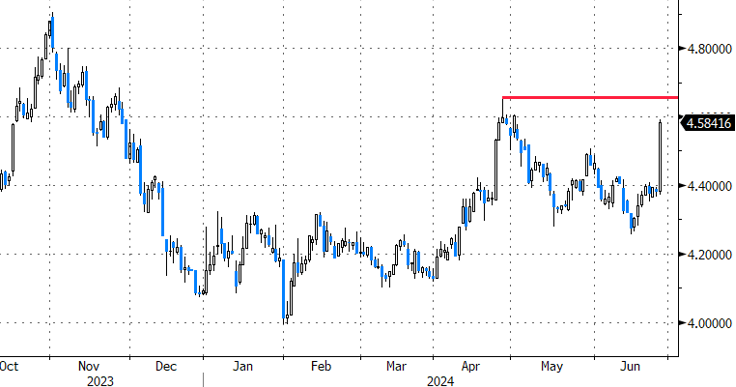
CAC40: French assets are back in underperforming modus going into Sunday’s first round of parliamentary elections
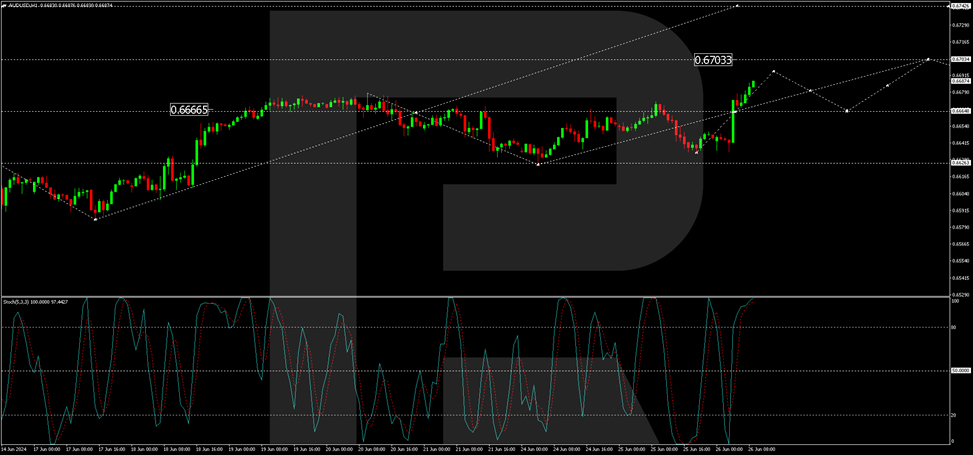
AUD/USD Surged, Buoyed by RBA Confidence and Inflation Ggrowth
The Australian dollar strengthened notably against the US dollar, with the AUD/USD pair reaching 0.6684. Australia’s May economic indicators from MI remained unchanged at zero compared to the previous value. Meanwhile, Australia’s weighted average consumer price index increased to 4.0% y/y from the last 3.6%, surpassing the less ambitious forecast of 3.8%.
Earlier statistics from Westpac also showed a rise in Australia’s consumer sentiment index in June, climbing by 1.7%, following a 0.3% decline in May.
At the Australian Banking Association conference, RBA Assistant Governor Chris Kent indicated that the Reserve Bank of Australia is not overly concerned about the growing interest in private loans among consumers. Kent highlighted the significant role that private credit plays in the market and underscored that the RBA is closely monitoring developments. However, the regulator is not overly concerned about growth in this area, as it is not particularly large in Australia.
Meanwhile, business investment is on the rise. Kent drew attention to a notable disparity between business confidence, business conditions, and consumer sentiment. The latter position appears to be below average levels.
AUDUSD technical analysis
On the H4 chart of AUD/USD, the market ended the correction at 0.6577. Today, we consider a consolidation range forming around the level of 0.6666. With an upside exit, we will consider the probability of another growth structure to the level of 0.6703 with the prospect of continued growth to 0.6744. A correction link to the level of 0.6666 (test from above) is possible, followed by potential growth towards 0.6750. Technically, the MACD indicator supports this scenario. Its signal line is above the zero mark and is directed strictly upwards.
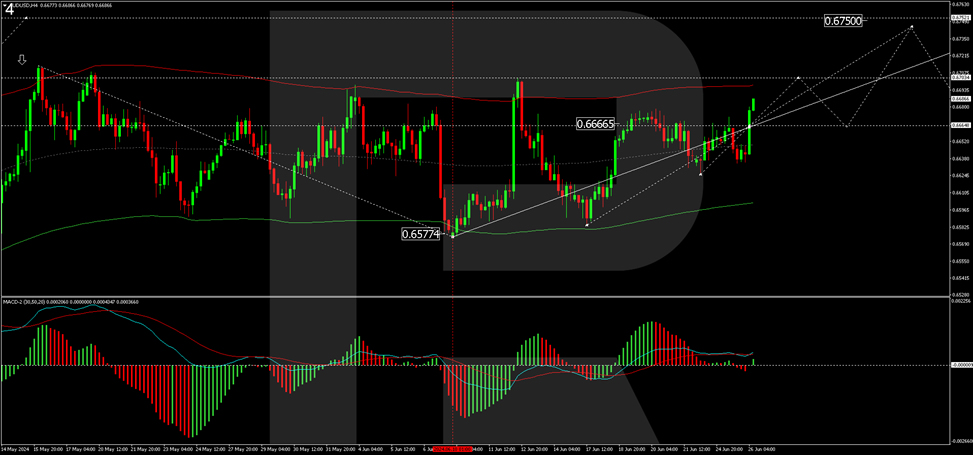
On the H1 chart of AUD/USD, a correction to 0.6626 is executed. Today, the market broke upwards to 0.6666 and continues growing towards 0.6694 with the prospect of continuing the development of the wave structure to 0.670, the local target. Technically, this scenario is confirmed by the Stochastic oscillator. Its signal line is above the level of 80. We expect the beginning of the decline to the level of 20.
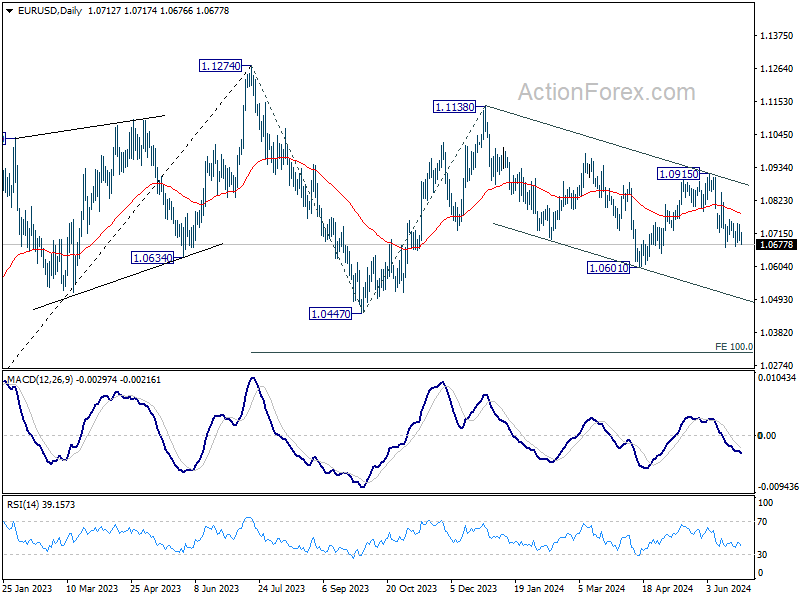
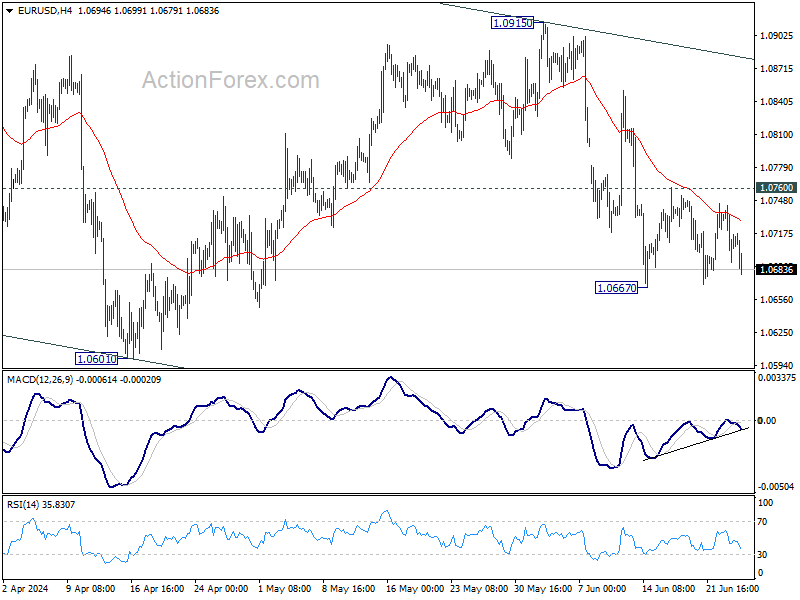
EUR/USD Mid-Day Outlook
Daily Pivots: (S1) 1.0689; (P) 1.0716; (R1) 1.0742; More....
EUR/USD is still bounded in consolidation from 1.0667 and intraday bias remains neutral. Outlook stays bearish with 1.0760 resistance intact. Decline from 1.0915 is seen as another leg in the larger corrective pattern. Break of 1.0667 will target 1.0601 and below. However, firm break of 1.0760 will turn intraday bias back to the upside for stronger rebound.
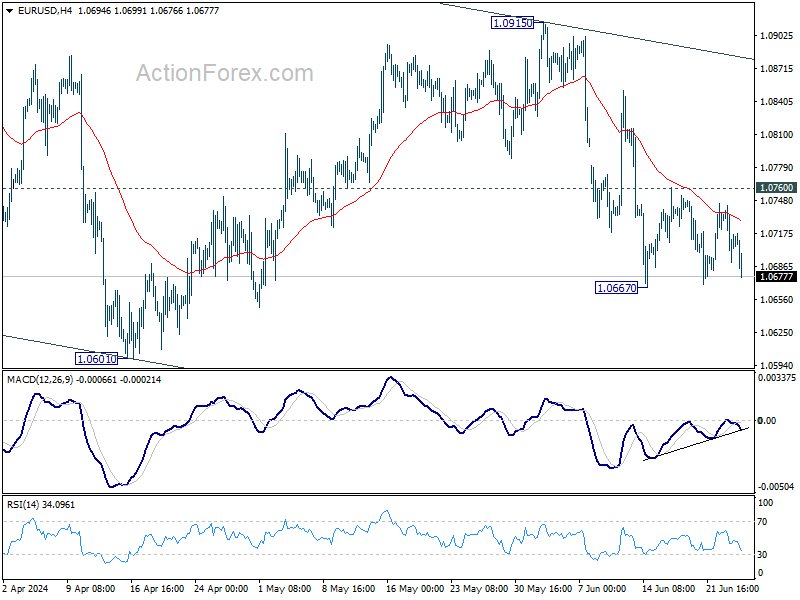
In the bigger picture, price actions from 1.1274 are viewed as a corrective pattern that's still in progress. Break of 1.0601 will target 1.0447 support and possibly further to 100% projection of 1.1274 to 1.0447 from 1.1138 at 1.0311. For now, this will remain the favored case as long as 1.0915 resistance holds, in case of rebound.
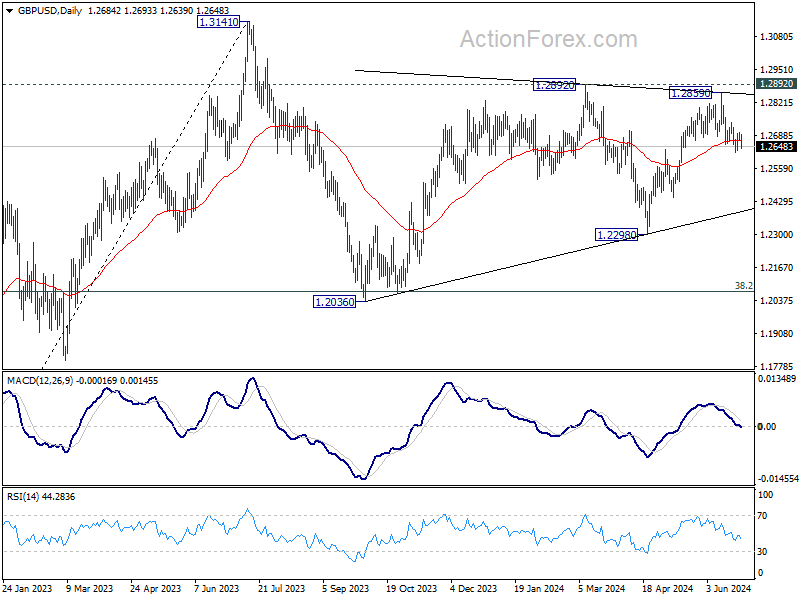
GBP/USD Mid-Day Outlook
Daily Pivots: (S1) 1.2666; (P) 1.2685; (R1) 1.2704; More...
GBP/USD is staying above 1.2622 temporary low despite today's decline. Intraday bias stays neutral first. Further fall is expected as long as 1.2739 resistance holds. Break of 1.2622, and sustained trading below 1.2633 resistance turned support will argue that whole rise from 1.2298 has completed, and target 1.2445 and below. However, firm break of 1.2739 will argue that pull back from 1.2859 has completed, and bring retest of this high instead.
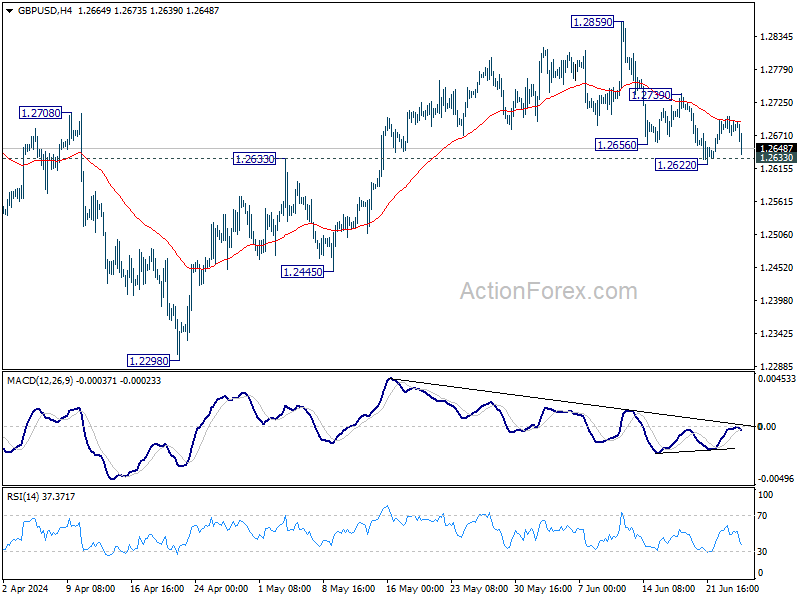
In the bigger picture, price actions from 1.3141 medium term top are seen as a corrective pattern that is still in progress. Break of 1.2445 support will confirm that another falling leg has started and target 1.2036 cluster support again (38.2% retracement of 1.0351 (2022 low) to 1.3141 at 1.2075. Nevertheless, break of 1.2892 resistance will argue that larger up trend from 1.0351is ready to resume through 1.3141.
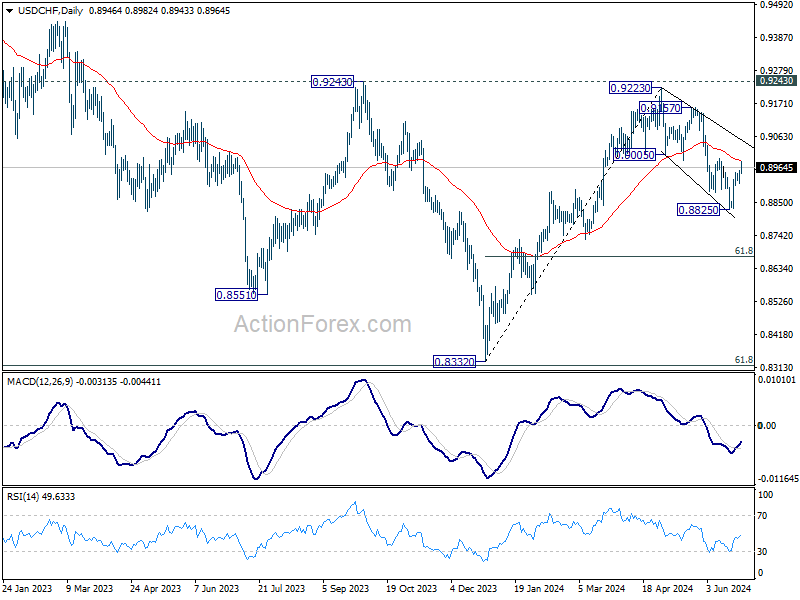
USD/CHF Mid-Day Outlook
Daily Pivots: (S1) 0.8923; (P) 0.8938; (R1) 0.8964; More…
Intraday bias in USD/CHF stays neutral at this point. Near term outlook will stay bearish with 0.8992 resistance intact. Below 0.8912 minor support will bring retest of 0.8825 low. Firm break there will resume the fall from 0.9223 to 61.8% retracement of 0.8332 to 0.9223 at 0.8672. However, firm break of 0.8892 will argue that fall from 0.9223 has completed as a three-wave corrective move to 0.8825. In this case, intraday bias will be back on the upside for 0.9157 resistance.
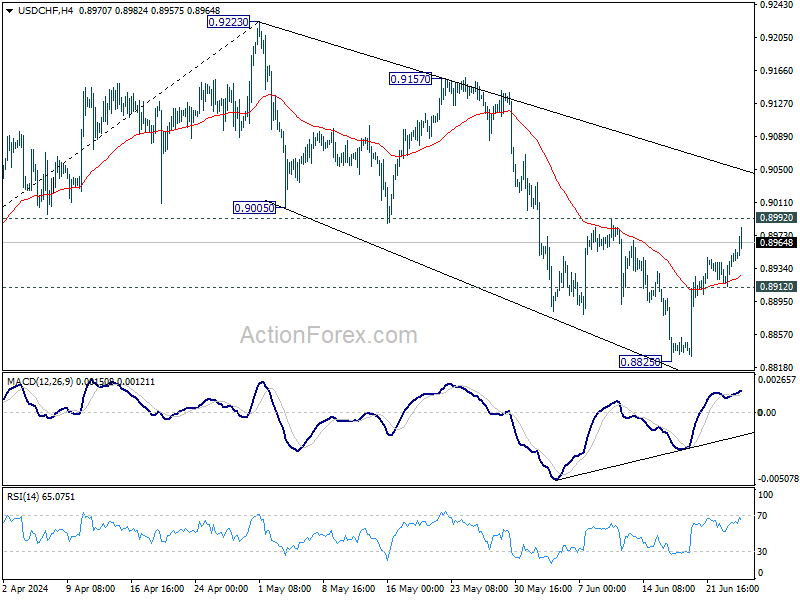
In the bigger picture, price actions from 0.8332 medium term bottom are seen as developing into a corrective pattern to the down trend from 1.0146 (2022 high). Rejection by 0.9243 resistance affirms this case, and maintains medium term bearishness. While more range trading could be seen between 0.8332/0.9243 first, downside break out is mildly in favor at a later stage.
USD/JPY Mid-Day Outlook
Daily Pivots: (S1) 159.33; (P) 159.55; (R1) 159.90; More...
Intraday bias in USD/JPY is back on the upside as recent rally resumed through 159.92 temporary top after brief consolidations. Decisive break of 100% projection of 151.86 to 157.70 from 154.53 at 160.37 will confirm long term up trend resumption, and pave the way to 161.8% projection at 163.97. On the downside, below 159.18 minor support will turn intraday bias neutral against first. But outlook will stay bullish as long as 157.70 resistance turned support holds.
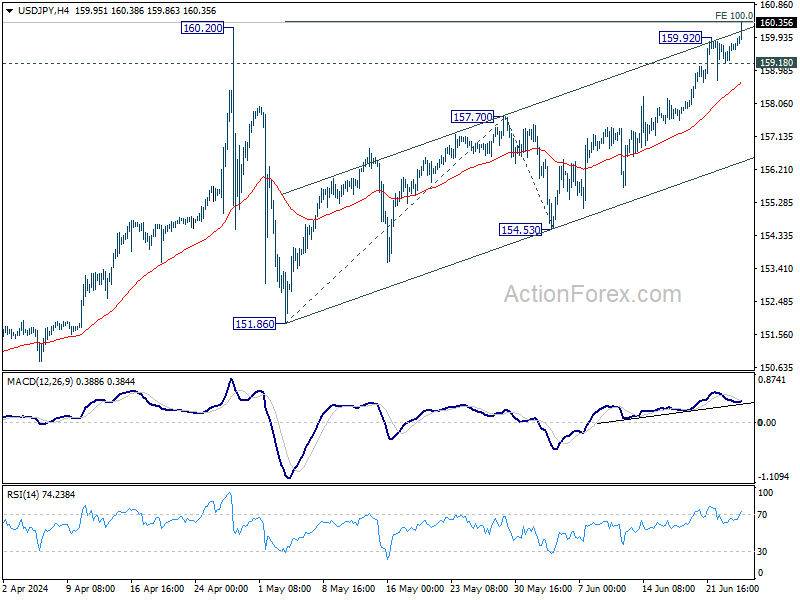
In the bigger picture, there is no sign of long term trend reversal yet. Further rally is expected as long as 150.87 resistance turned support holds. Decisive break of 160.02 will target 100% projection of 127.20 to 151.89 from 140.25 at 164.94.
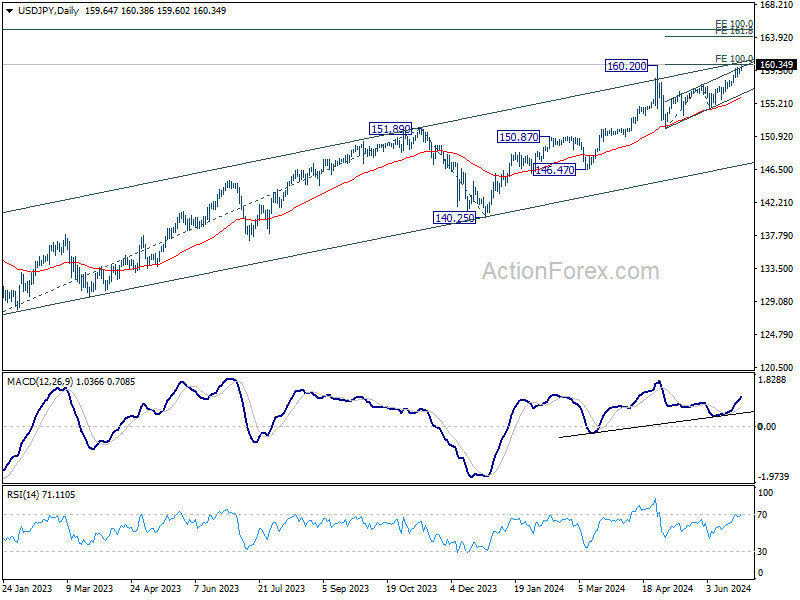
Yen Hits 37-Year Low Against Dollar, Japan to Intervene or Not?
Yen is drawing significant attention again today as it plummeted past the crucial 160 mark against Dollar, and hit its lowest level in over 37 years. Market participants are vigilantly watching for any signs of intervention from Japanese authorities, yet no action has been taken so far. It should be emphasized again that the tone from Japanese officials appears less urgent compared to the rhetoric when Yen last approached this level in April. The focus is now on whether Yen will continue to decline towards the next potential intervention point at 165.
Last week, the US Treasury added Japan to its foreign exchange monitoring list, alongside China, Vietnam, Taiwan, Malaysia, Singapore, and Germany. This inclusion has sparked speculation that it may complicate Japan's efforts to intervene in the currency market. However, it is essential to note that the US is generally less concerned about Japan propping up Yen's value compared to the cases of capping its appreciation or even pushing it down.
Overall in the currency markets, Australian Dollar remains the strongest performer of the day, buoyed by stronger-than-expected CPI data, which has heightened expectations of an August rate hike by RBA. Nevertheless, the second-placed Dollar is gaining some traction and could threaten Aussie's first place. Canadian Dollar is also performing well as the third strongest, maintaining its strength following robust CPI data.
Conversely, New Zealand Dollar is the second weakest currency today, largely due to its decline against Australian Dollar. Swiss Franc is also weak, trailing just behind Yen and Kiwi. Meanwhile, Euro and British Pound are positioned in the middle of the performance spectrum, but Euro appears more susceptible to further declines due to ongoing political risks in France.
Technically, it should be about time EUR/USD completes its near term consolidations. Break of 1.0667 support will resume the fall from 1.0915, as another leg in the larger pattern from 1.1138. Next target will be 1.0601 support and below.
 In Europe, at the time of writing, FTSE is down -0.37%. DAX is down -0.43%. CAC is down -1.01%. UK 10-year yield is up 0.0432 at 4.125. Germany 10-year yield is up 0.0284 at 2.440. Earlier in Asia, Nikkei rose 1.26%. Hong Kong HSI rose 0.09%. China Shanghai SSE rose 0.76%. Singapore Strait Times rose 0.16%. Japan 10-year JGB yield rose 0.0241 to 1.025.
ECB's Panetta: Must manage risks beyond baseline scenarios
Speaking today, ECB Governing Council member Fabio Panetta noted that the current macroeconomic conditions support "normalization of the monetary stance." He added that ECB initiated this process recently and, under the "baseline scenario," intends to continue it "gradually and smoothly."
However, Panetta cautioned that the inflation and growth projections represent only one of many possible outcomes. He stressed that monetary policy must also manage "risks and tail scenarios," not just baseline forecasts. The prevailing political and geopolitical risks, he said, necessitate "awareness, flexibility, and state-contingent action plans."
Panetta's comments come just days before French voters head to the polls for the first round of parliamentary elections. He highlighted the potential economic implications of political turnover, explaining that it inherently brings policy uncertainty. This uncertainty affects households and investors as they try to predict how new governments will handle critical economic and political decisions.
ECB's Rehn considers two more rate cuts this year as reasonable
In an interview today, ECB Governing Council member Olli Rehn indicated that market data suggests the likelihood of two additional rate cuts, bringing the rate to 3.25% by the end of the year. He also noted that the terminal rate for this easing cycle is expected to fall between 2.25% and 2.50%. Rehn described these projections as "reasonable expectations."
Despite recent economic data overshooting expectations, Rehn affirmed that "disinflationary process is going on," although it may be bumpy. He added that ECB would maintain its course and "continue rate cuts" to ensure this process remains on track.
Rehn further elaborated that current interest rates are still in "restrictive territory," underscoring ECB's work to ensuring that the "disinflationary process will continue." He stressed that the central bank's primary goal is to control inflation, but also highlighted its broader responsibilities.
"Without compromising our primary objective," Rehn said, "we also have a responsibility to support full employment, sustainable development, and balanced growth."
German Gfk consumer sentiment fells to -21.8, interruption of uptrend
Germany's Gfk Consumer Sentiment for July fell from -21.0 to -21.8, below expectation of -20.0. In June, economic expectations fell from 9.8 to 2.5. Income expectations fell from 12.5 to 8.2. Willingness to buy fell from -12.3 to -13.0. Willingness to save jumped again from 5.0 to 8.2.
"The interruption of the recent upward trend in consumer sentiment shows that the road out of the sluggish consumption will be difficult and there can always be setbacks," explains Rolf Buerkl, consumer expert at NIM.
Australia CPI jumps to 4%, trimmed mean rises to 4.4%
Australia's monthly CPI accelerated from 3.6% yoy to 4.0% yoy in May, well above expectation of a fall to 3.5% yoy. The last time it was higher was last November, when it was sitting at 4.3%.
CPI excluding volatile items and holiday travel ticked down from 4.1% yoy to 4.0% yoy. Annual Trimmed Mean CPI, on the other hand, surged from 4.1% yoy to 4.4% yoy.
The most significant contributors to the annual rise to May were Housing (+5.2%), Food and non-alcoholic beverages (+3.3%), Transport (+4.9%), and Alcohol and tobacco (+6.7%).
RBA's Kent stresses vigilance amid mixed data and uncertainty over neutral rate
RBA Assistant Governor Christopher Kent, in a speech today, emphasized that recent economic data have been "mixed," reinforcing the need for RBA to "remain vigilant to upside risks to inflation." Kent reiterated that, regarding the path of interest rates, RBA is "not ruling anything in or out."
Kent noted that the recent median estimate among market economists suggested that the cash rate was around 1 percentage point above the nominal neutral rate. This indicates that current monetary policy is restrictive.
However, he acknowledged the significant uncertainty surrounding estimates of the neutral rate, making it unclear how restrictive monetary policy truly is.
Additionally, Kent mentioned that RBA's own models suggest that the neutral rate has increased since the pandemic, aligning with trends observed in other economies.
USD/JPY Mid-Day Outlook
Daily Pivots: (S1) 159.33; (P) 159.55; (R1) 159.90; More...
Intraday bias in USD/JPY is back on the upside as recent rally resumed through 159.92 temporary top after brief consolidations. Decisive break of 100% projection of 151.86 to 157.70 from 154.53 at 160.37 will confirm long term up trend resumption, and pave the way to 161.8% projection at 163.97. On the downside, below 159.18 minor support will turn intraday bias neutral against first. But outlook will stay bullish as long as 157.70 resistance turned support holds.
In the bigger picture, there is no sign of long term trend reversal yet. Further rally is expected as long as 150.87 resistance turned support holds. Decisive break of 160.02 will target 100% projection of 127.20 to 151.89 from 140.25 at 164.94.
Economic Indicators Update
| GMT | Ccy | Events | Actual | Forecast | Previous | Revised |
|---|---|---|---|---|---|---|
| 01:00 | AUD | Westpac Leading Index M/M May | 0.00% | 0.00% | ||
| 01:30 | AUD | Monthly CPI Y/Y May | 4.00% | 3.50% | 3.60% | |
| 06:00 | EUR | Germany GfK Consumer Confidence Jul | -21.8 | -20 | -20.9 | -21 |
| 08:00 | CHF | UBS Economic Expectations Jun | 17.5 | 18.2 | ||
| 14:00 | USD | New Home Sales M/M May | 650K | 634K | ||
| 14:30 | USD | Crude Oil Inventories | -2.6M | -2.5M |