

Sample Category Title
EUR/CHF Daily Outlook
Daily Pivots: (S1) 0.9569; (P) 0.9582; (R1) 0.9600; More....
EUR/CHF is staying in consolidation from 0.9476 and intraday bias stays neutral. Outlook will remain bearish as long as 0.9683 resistance holds. On the downside, break of 0.9476, and sustained trading below 61.8% retracement of 0.9252 to 0.9928 at 0.9510 will bring retest of 0.9252 low next.
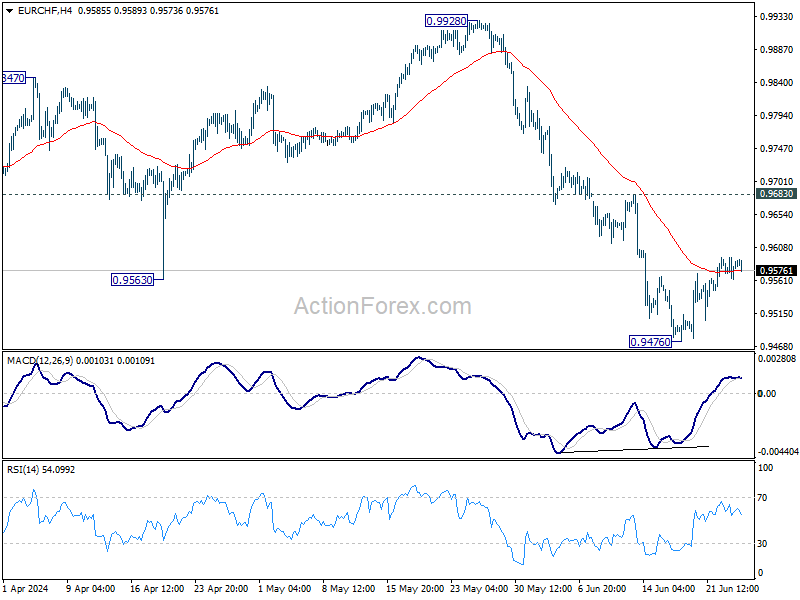
In the bigger picture, rebound from 0.9252 should have completed at 0.9228. Medium term outlook remains bearish with 1.0095 resistance intact. Firm break of 0.9252 will resume the down trend from 1.2004 (2018 high).
GBP/JPY Daily Outlook
Daily Pivots: (S1) 202.14; (P) 202.43; (R1)202.90; More...
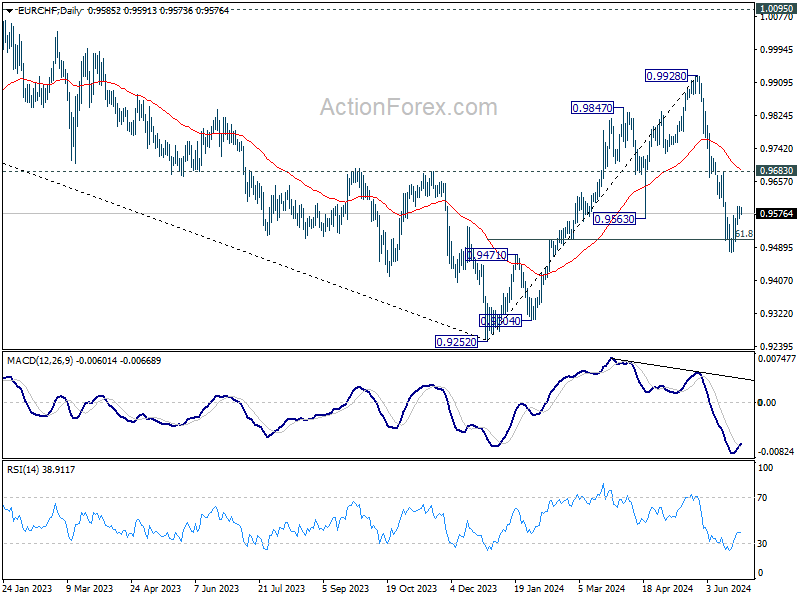
Intraday bias in GBP/JPY stays on the upside. Firm break of 61.8% projection of 191.34 to 200.72 from 197.18 at 202.97. will pave the way to 100% projection at 206.56 next. On the downside, below 201.95 minor support will turn intraday bias neutral first. But outlook will remain bullish as long as 198.90 support holds, in case of retreat.
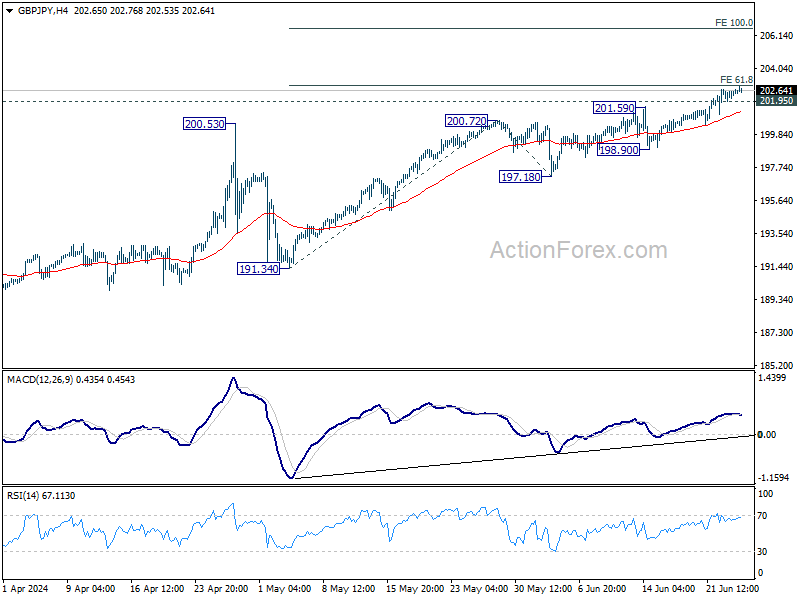
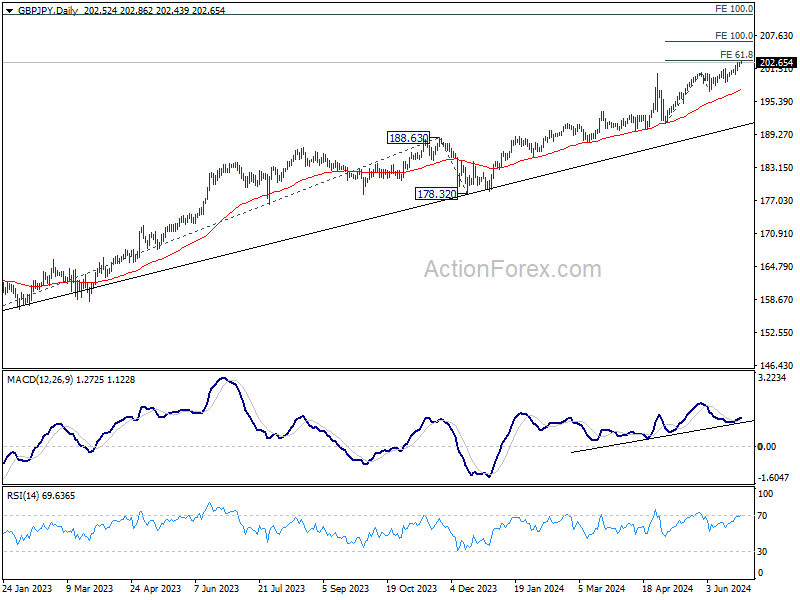
In the bigger picture, long term up trend is still in progress. Next target is 100% projection of 155.33 to 188.63 from 178.32 at 211.62. Outlook will stay bullish as long as 191.34 support holds, even in case of deep pullback.
EUR/JPY Daily Outlook
Daily Pivots: (S1) 170.74; (P) 171.07; (R1) 171.43; More...
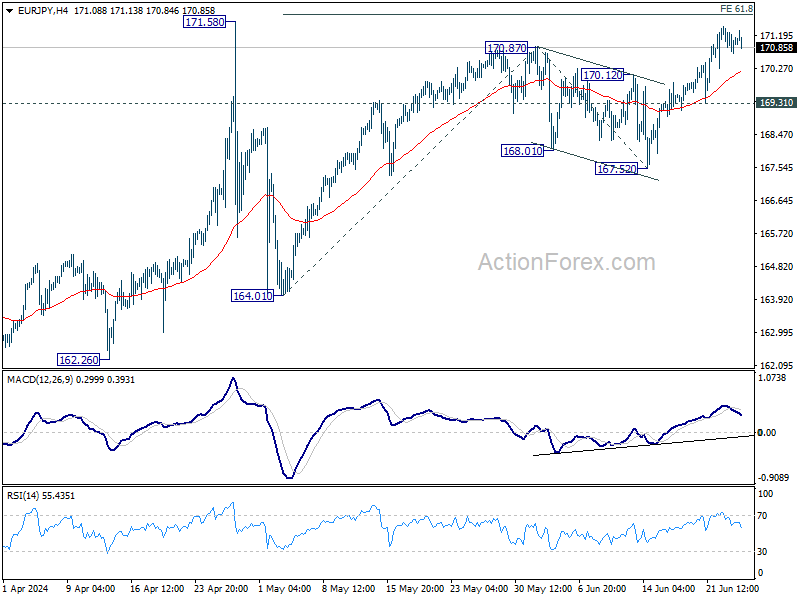
Intraday bias in EUR/JPY remains neutral at this point. Some consolidations could be seen first but further rally will remain in favor as long as 169.31 support hold, for 61.8% projection of 164.01 to 170.87 from 167.52 at 171.75. However, firm break of 169.31 will turn bias back to the downside for 167.52 support instead.
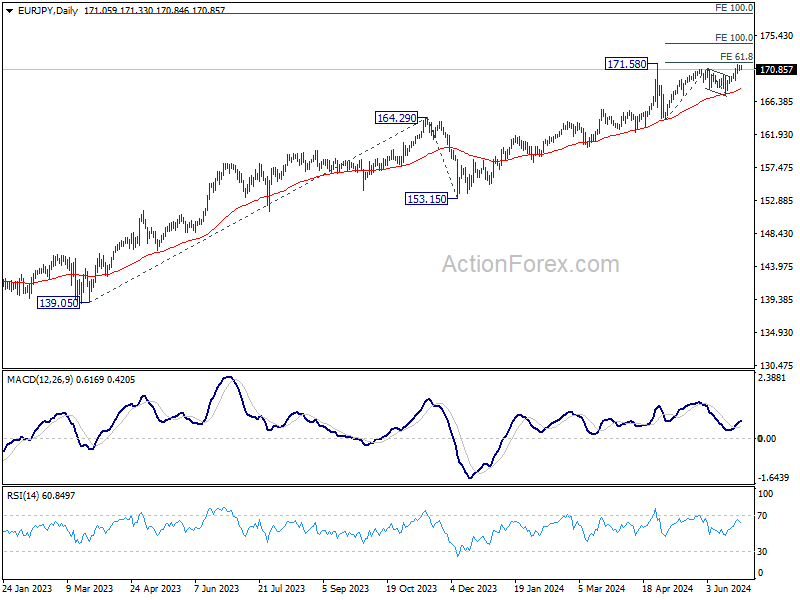
In the bigger picture, strong support from 55 D EMA indicates that the long term up trend is still in progress. Decisive break of 171.58 will confirm resumption and target 100% projection of 139.05 to 164.29 from 153.15 at 178.38. For now outlook will stay bullish as long as 164.01 support holds, even in case of deep pullback.
EUR/GBP Daily Outlook
Daily Pivots: (S1) 0.8430; (P) 0.8447; (R1) 0.8464; More...
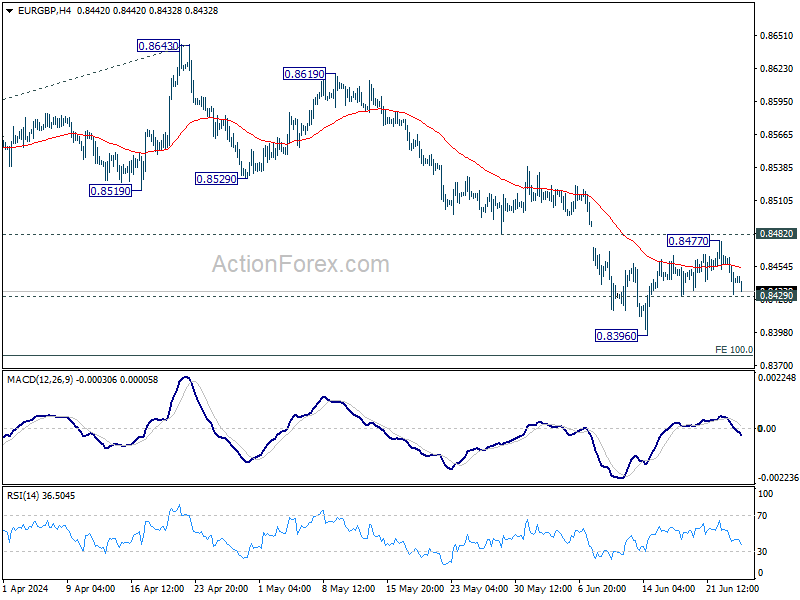
Intraday bias in EUR/GBP stays neutral first and outlook remains bearish with 0.8482 support turned resistance intact. On the downside, below 0.8429 minor support will bring retest of 0.8396 low first. Further break there will resume larger down trend to 0.8376 projection level next.
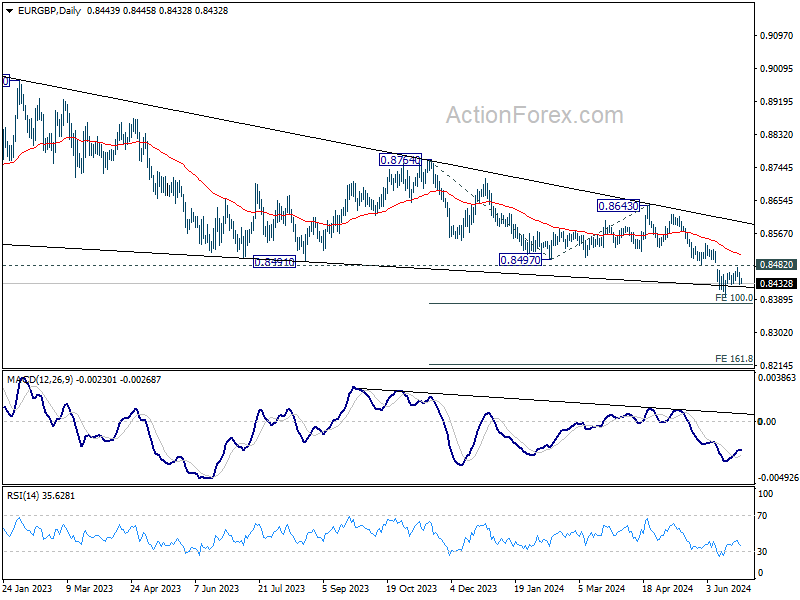
In the bigger picture, down trend from 0.9267 (2022 high) is in progress. Next target is 100% projection of 0.8764 to 0.8497 from 0.8643 at 0.8376. Sustained break there will target 161.8% projection at 0.8211 next. For now, outlook will remain bearish as long as 0.8643 resistance holds, even in case of stronger rebound.
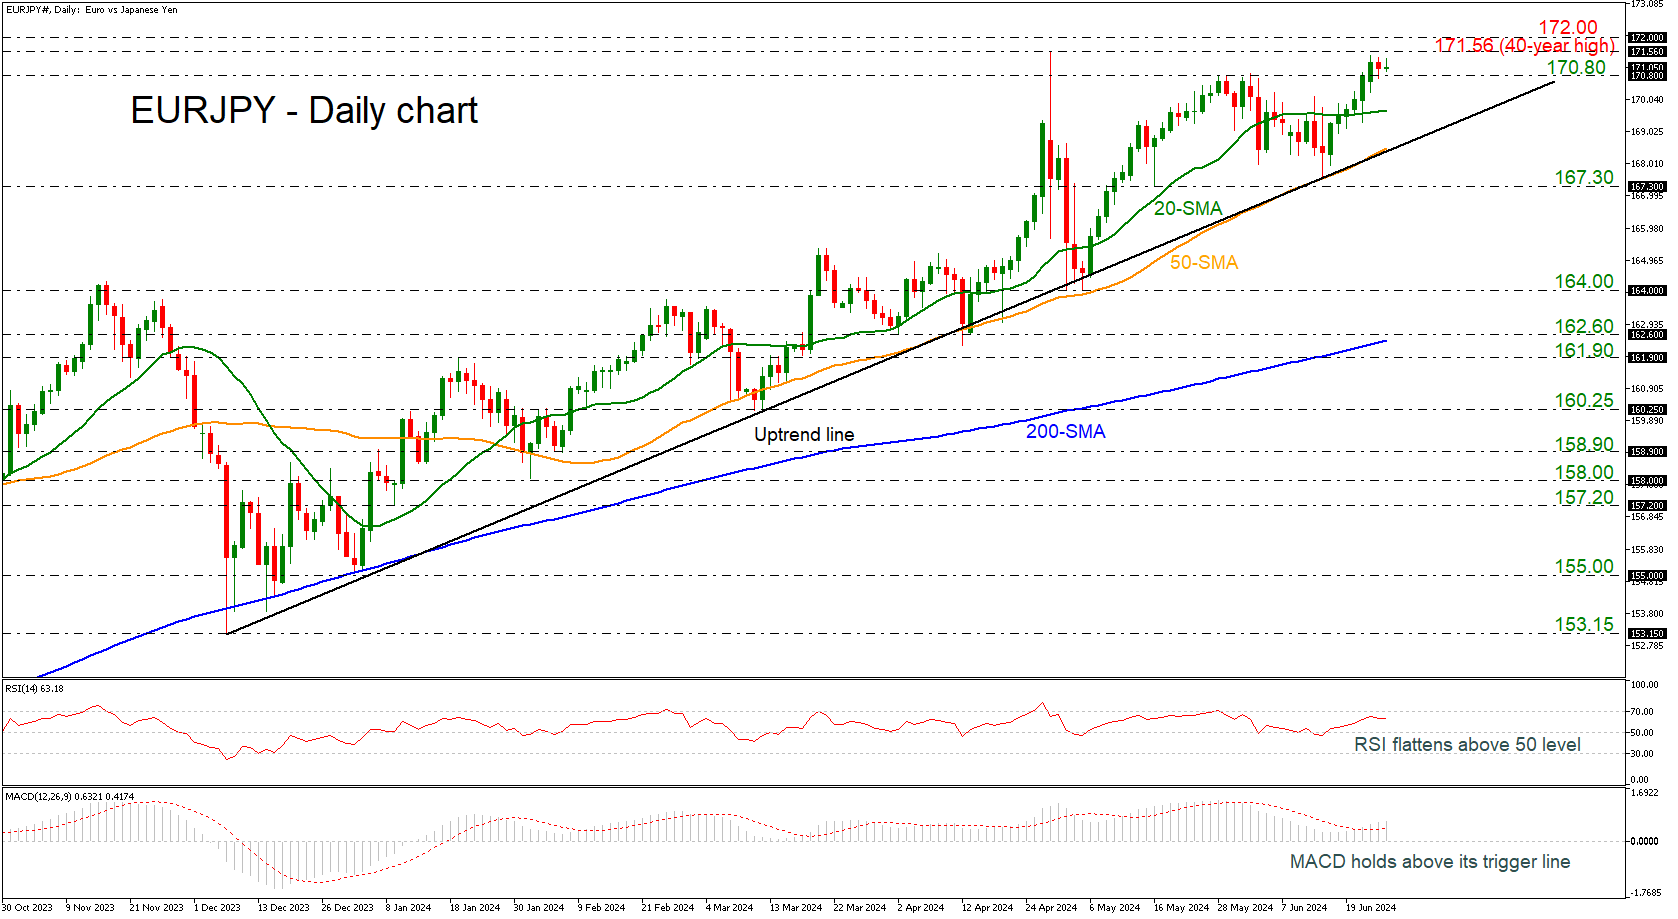
EURJPY Builds Base Slightly Near 40-year High
- EURJPY stands well above uptrend line
- RSI flattens but MACD strengthens its momentum
EURJPY has rebounded off the long-term ascending trend line near 167.70, sending the market above the previous peak of 170.80. A successful jump above the 40-year high of 171.56 could help the pair to surge towards the next round numbers such as 172.00 and 173.00.
According to the technical oscillators, the RSI is flattening above the neutral threshold of 50, while the MACD is extending its positive momentum above its trigger and zero lines.
In the negative scenario, a slide beneath the 170.80 support and more importantly beneath the 20-day simple moving average (SMA) at 169.70, would take the market towards the 50-day SMA at 168.50. Falling below this area would help shift the focus to the downside towards 167.30, switching the outlook to neutral.
Overall, EURJPY has been bullish since December 2023. Near-term weakness is expected to remain until there is a rally above the multi-year high of 171.56.
Elliott Wave Expects USDJPY to Extend Higher in Impulsive Sequence
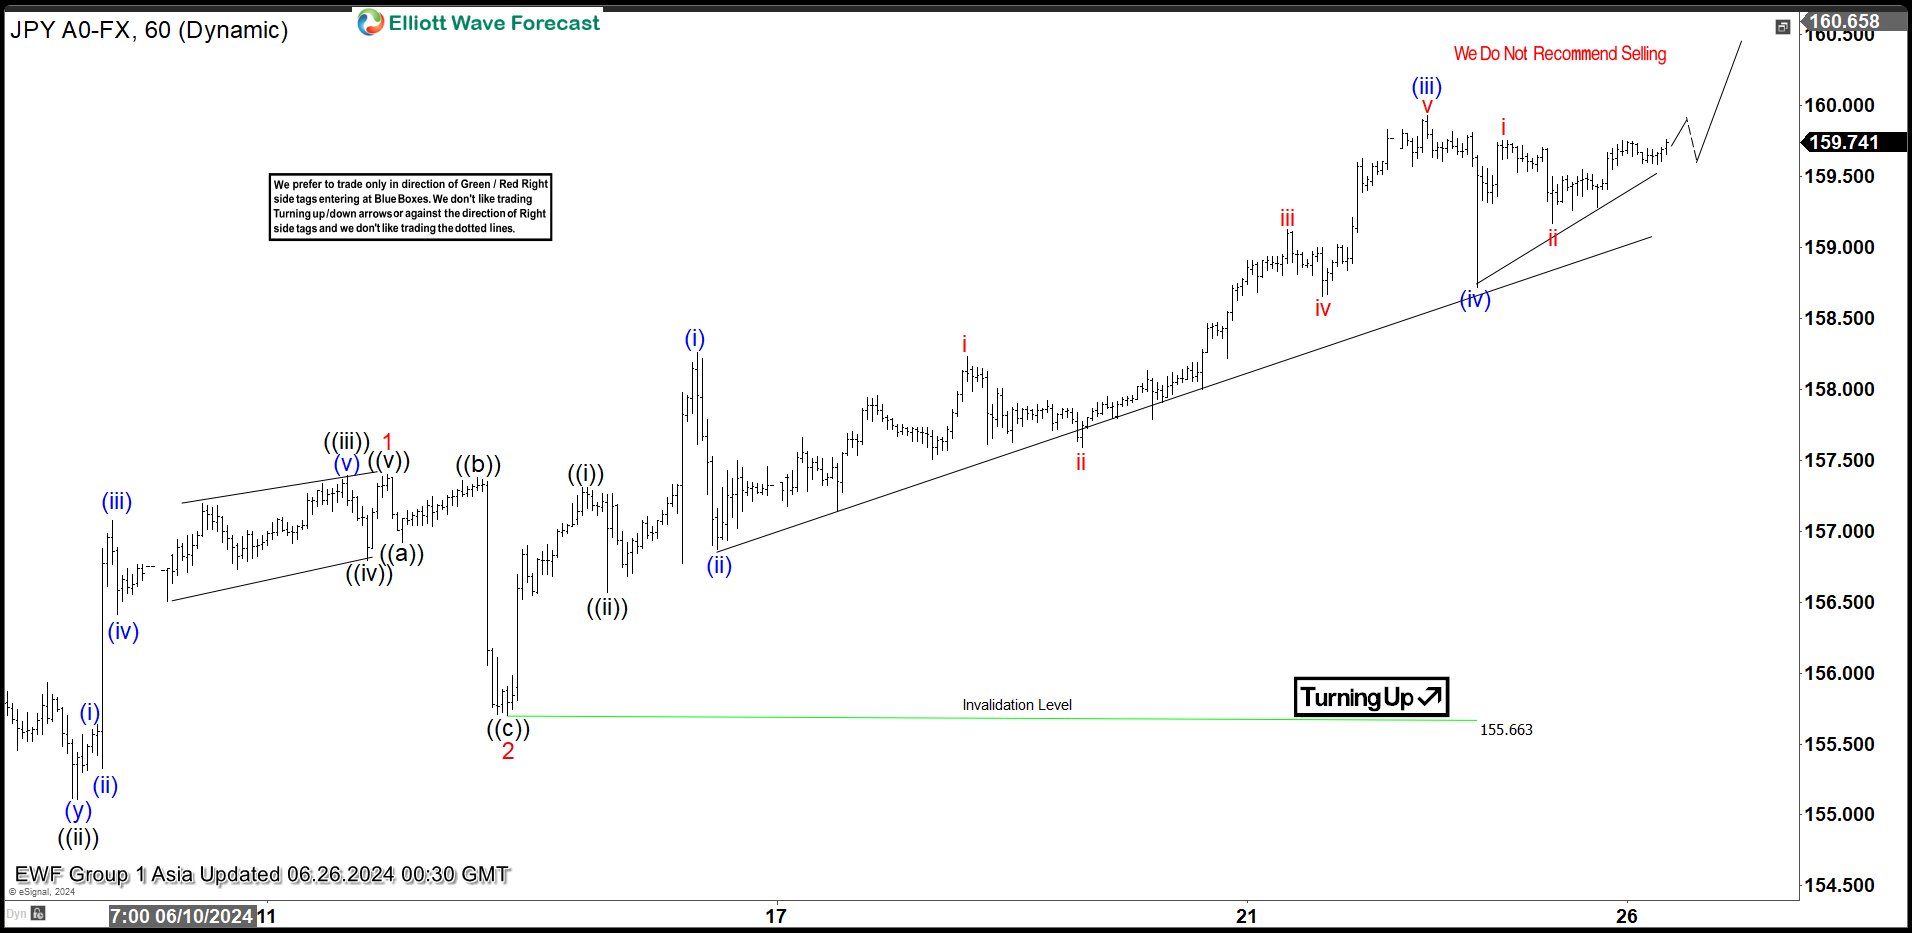
Short Term Elliott Wave in USDJPY shows incomplete bullish sequence from 6.4.2024 low favoring more upside. Up from 6.4.2024 low, wave 1 ended at 157.4 as the 1 hour chart below shows. Pullback in wave 2 unfolded as a zigzag structure. Down from wave 1, wave ((a)) ended at 156.92 and wave ((b)) ended at 157.38. Wave ((c)) lower ended at 155.7 which completed wave 2 in higher degree. The pair extended higher again in wave 3 with internal subdivision as an impulse Elliott Wave structure. Up from wave 2, wave ((i)) ended at 157.3 and pullback in wave ((ii)) ended at 156.57. Pair then extended higher in wave (i) of ((iii)) towards 158.26 and pullback in wave (ii) ended at 156.87.
Up from wave (ii), wave i ended at 158.23 and pullback in wave ii ended at 157.59. Pair then extended higher in wave iii towards 159.12 and dips in wave iv ended at 158.65. Wave v higher ended at 159.93 which completed wave (iii). Pullback in wave (iv) ended at 158.71. Expect pair to extend higher a few more highs before ending wave (v) of ((iii)). Near term, as far as pivot at 155.66 low stays intact, dips should find buyers in 3, 7, or 11 swing for further upside.
UDSJPY 60 Minutes Elliott Wave Chart
USDJPY Elliott Wave Video
https://www.youtube.com/watch?v=z3JBo0wahjk
EUR: More Rate Cuts “Reasonable” – ECB
European Central Bank (ECB) policymaker Olli Rehn stated on Wednesday that market expectations of the ECB reducing interest rates twice more this year, reaching 2.25% by 2025, are "reasonable," according to Bloomberg. The Finnish central bank chief emphasized the need to bring inflation back to 2% without significantly hindering economic activity. Following Rehn's comments, the EURUSD pair continued to face bearish pressure, nearing intraday lows of around 1.0710. His remarks have reinforced market sentiment that the ECB may adopt a more accommodative monetary policy stance. This has impacted the Euro, pushing it lower against the US Dollar – but for how long?
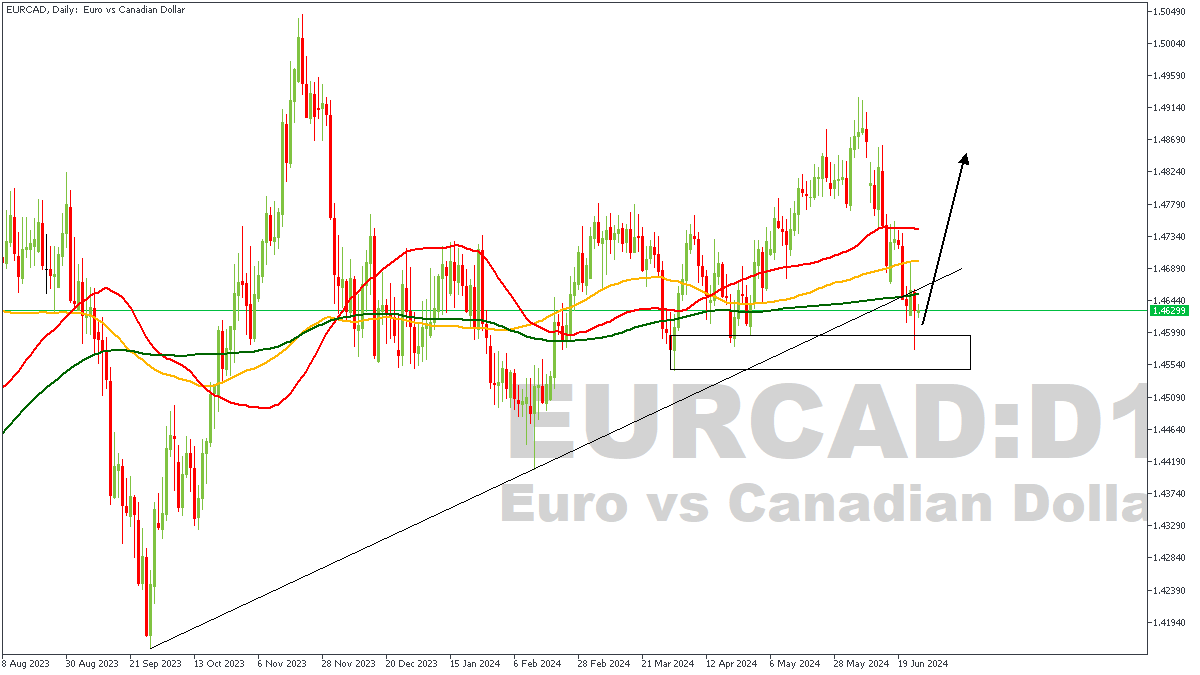
EURCAD – D1 Timeframe
The first thing that stands out evidently on the attached EURCAD daily timeframe chart is the trendline support, which at this time seems to be mounting ample pressure on the downward price movement. Secondly, we also spot a drop-base-rally demand zone, as highlighted by the rectangle, and the bullish array of the moving averages sends the message home. Worth noting is the fact that the demand zone lies snug within the target regions of our Fibonacci retracement tool.
Analyst’s Expectations:
- Direction: Bullish
- Target: 1.47152
- Invalidation: 1.45441
EURNZD – H4 Timeframe
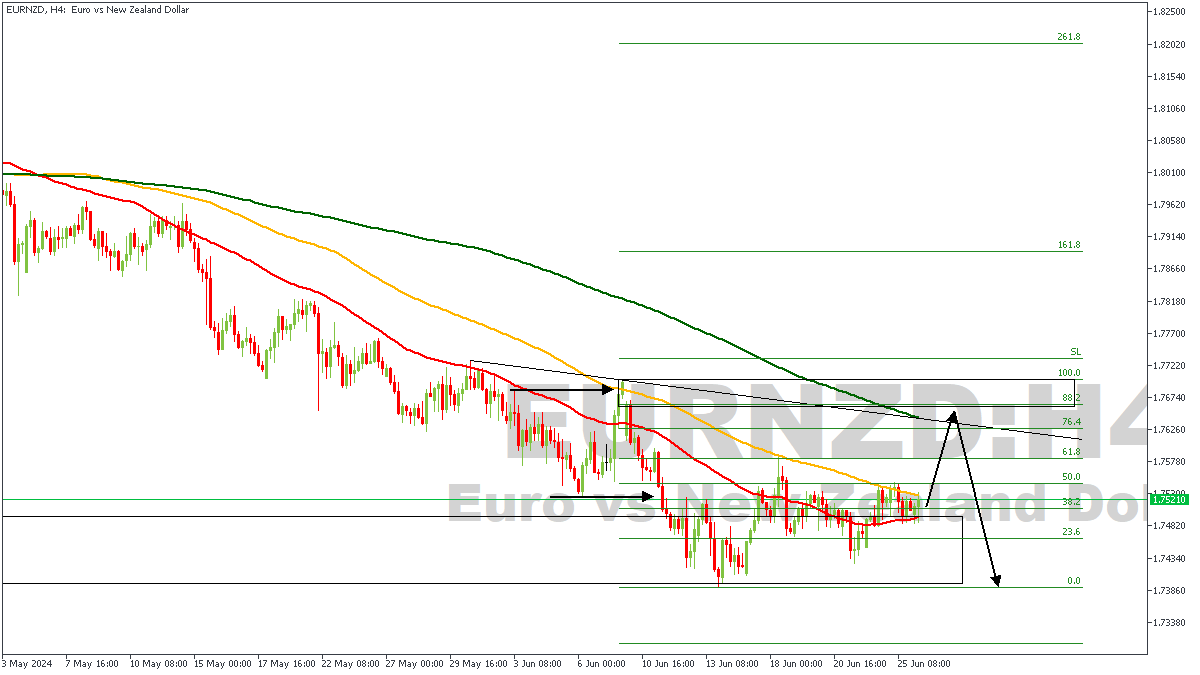
Whilst the moving averages on the 4-hour timeframe of EURNZD seem to be in a bearish array, there also now is a trendline resistance that aligns almost perfectly with the slope of the 200-period moving average. There is also a QMR pattern on this chart, as seen from the sweep of the previous high, bearish break of structure, and now what seems to be a return to the order-block. The supply zone within the 88% region of the Fibonacci retracement zone is the final piece of the puzzle here. In the meantime, however, I will be looking to ride the bullish pressure of the return to the order-block move.
Analyst’s Expectations:
- Direction: Bullish
- Target: 1.76253
- Invalidation: 1.74182
EURUSD – D1 Timeframe (RECAP)
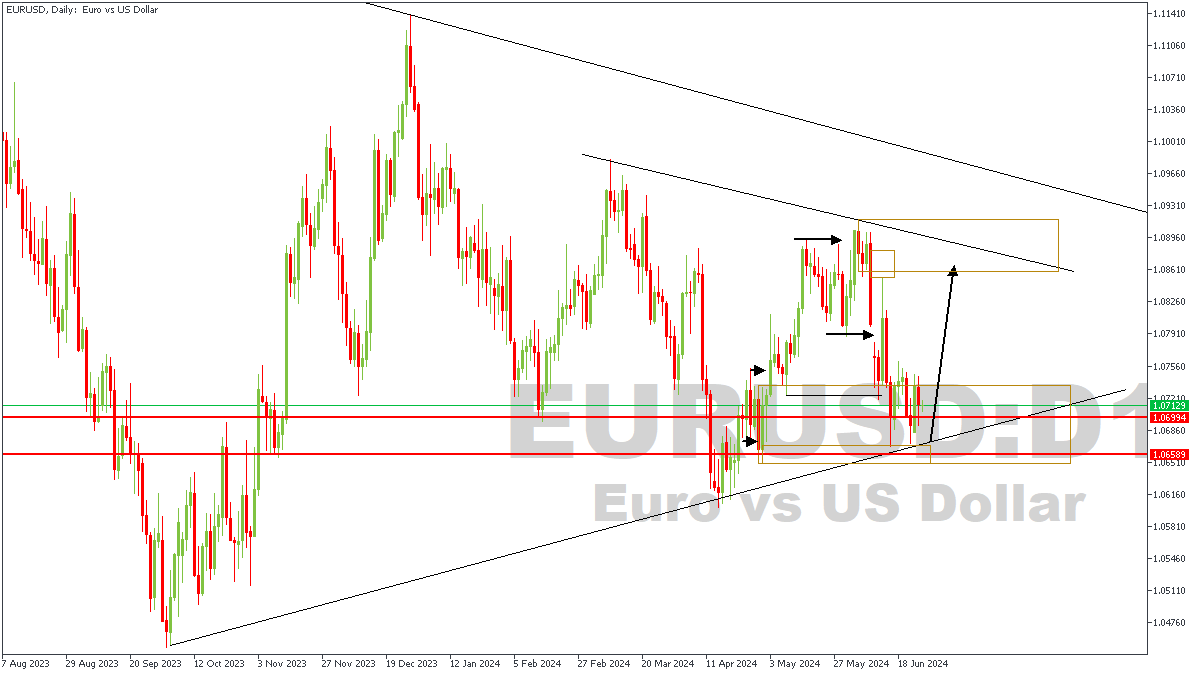
Since my last article on USD Majors, the price action on the daily timeframe of EURUSD seems to have been stalling ever since. The invalidation region remains intact, we’re also yet to see any sweep of liquidity that might warrant the need to revise the trade idea – so, we remain committed to the bullish sentiment unless the lower timeframes fail to present a worthy entry criterion.
Analyst’s Expectations:
- Direction: Bullish
- Target: 1.07812
- Invalidation: 1.06463
AUDJPY: Will Price Break Above 107.8 Region?
The Australian dollar (AUD) rallied after surprising inflation data for May came in higher than expected. Australia's annual inflation accelerated to 4.0% in May, up from 3.6% in April, surpassing the forecast of 3.8%. Core inflation also surged to 4.4%, marking its highest level in six months. The Reserve Bank of Australia (RBA) had already expressed concerns about inflation, and this spike increases the likelihood of another interest rate hike. Market expectations for an August rate hike jumped from 12% to 39%, and the futures market adjusted, eliminating the chance of a rate cut in 2024 and reducing the anticipated easing by the end of 2025.
AUDJPY – W1 Timeframe
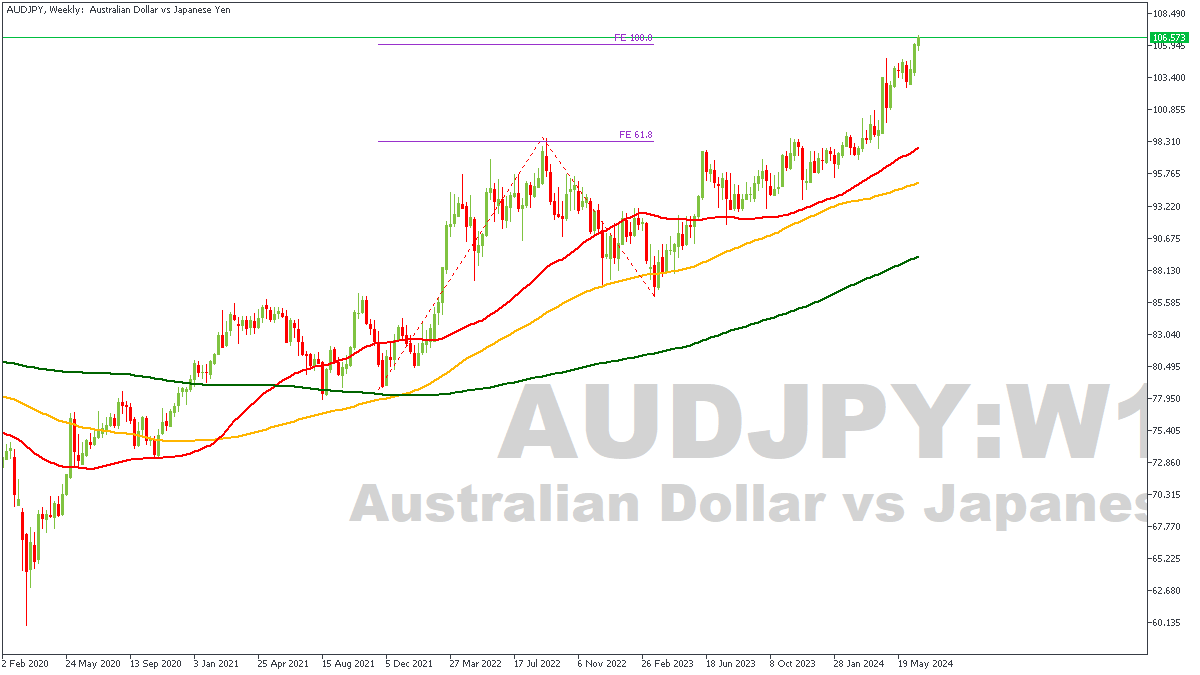
On the weekly timeframe chart of AUDJPY, we can see that price has just reached the 100% Fibonacci expansion level of the previous swing. The measure of the Fibonacci expansion tool is shown clearly on the chart as the red dotted lines, while the purple horizontal lines mark the levels. Based on this, it is quite likely we get to see a reversal in the bullish price action on AUDJPY soon.
AUDJPY – H1 Timeframe
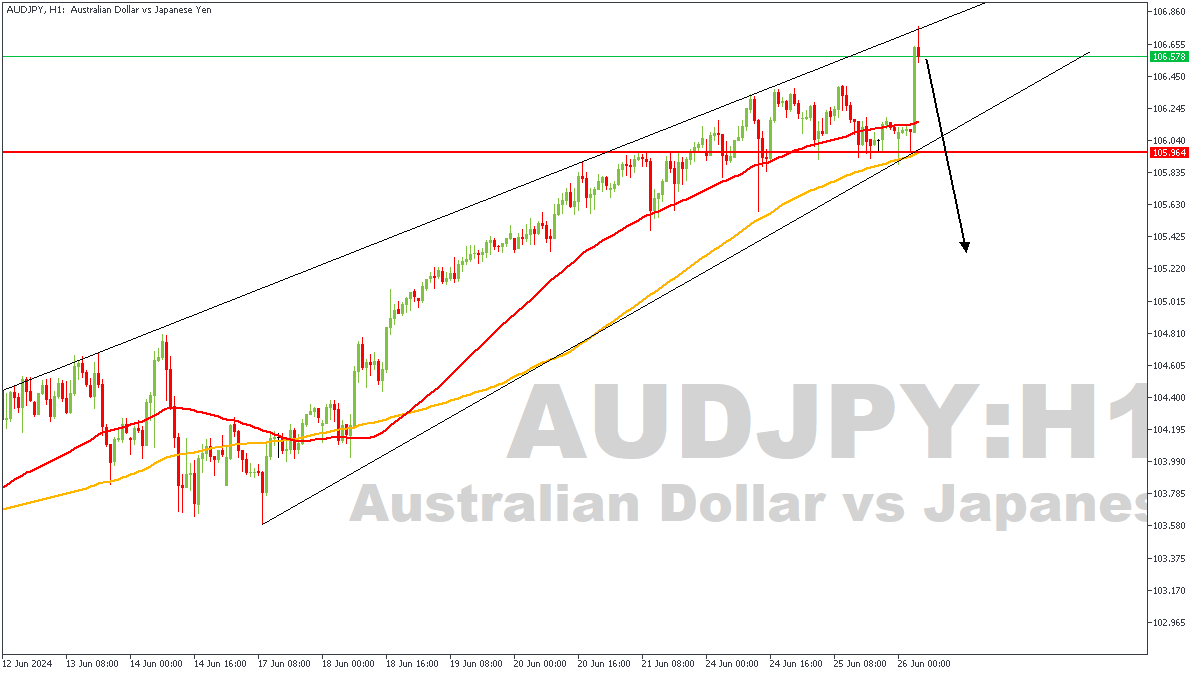
Based on the 100% expansion level on the weekly timeframe chart I have scaled down to the 1-hour timeframe in order to properly position for an entry. Since we already have a sentiment from the higher timeframe, we simply need to find an entry criteria on the lower timeframe. In this case, my entry criteria would be a breakout, and possible retest, of the wedge pattern as shown on the 1-hour chart here – you’d do well to wait for that as well.
Analyst’s Expectations:
- Direction: Bearish
- Target: 105.497
- Invalidation: 106.820
Market Analysis: EUR/USD Struggles To Recover While USD/CHF Rallies
EUR/USD is attempting a recovery wave from the 1.0675 zone. USD/CHF climbed higher above 0.8900 and might extend gains in the near term.
Important Takeaways for EUR/USD and USD/CHF Analysis Today
- The Euro declined toward 1.0675 before it started a recovery wave against the US Dollar.
- There is a key bullish trend line forming with support at 1.0710 on the hourly chart of EUR/USD at FXOpen.
- USD/CHF climbed higher above the 0.8900 and 0.8935 resistance levels.
- There is a connecting bullish trend line forming with support at 0.8930 on the hourly chart at FXOpen.
EUR/USD Technical Analysis
On the hourly chart of EUR/USD at FXOpen, the pair extended the decline below the 1.0720 support zone. The Euro even declined below 1.0700 before the bulls appeared against the US Dollar, as mentioned in the previous analysis.
The pair tested the 1.0675 zone and recently started a recovery wave. There was a move above the 1.0710 resistance zone, but the bears were active near 1.0745. As a result, there was another pullback to 1.0690 and the pair is now consolidating below the 50-hour simple moving average.
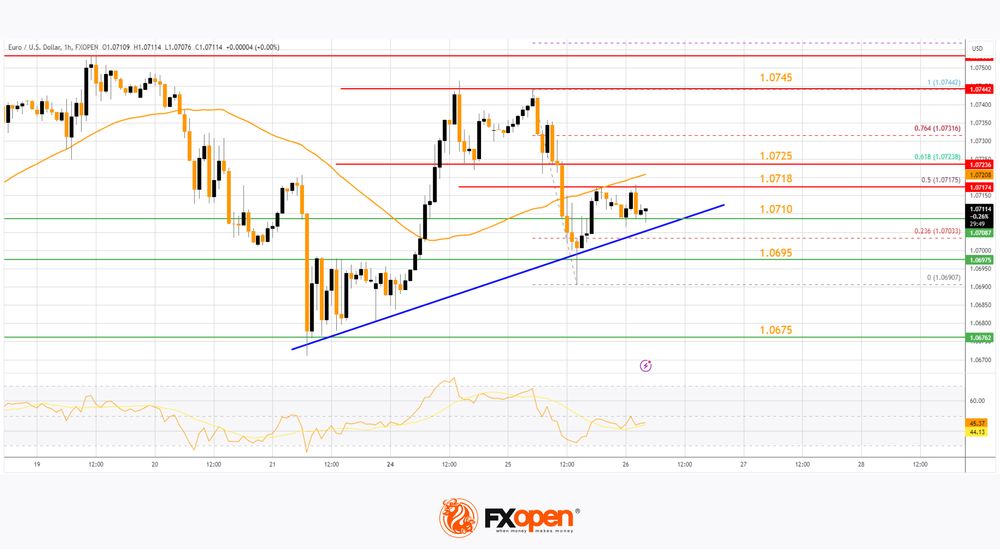
Immediate resistance on the EUR/USD chart is near the 1.0718 zone. It is close to the 50% Fib retracement level of the downward move from the 1.0744 swing high to the 1.0690 low.
The first major resistance is near the 1.0725 level or the 61.8% Fib retracement level of the downward move from the 1.0744 swing high to the 1.0690 low. An upside break above the 1.0725 level might send the pair toward the 1.0745 resistance.
The next major resistance is near the 1.0780 level. Any more gains might open the doors for a move toward the 1.0820 level. Immediate support on the downside sits at 1.0710.
There is also a key bullish trend line forming with support at 1.0710. The next major support is the 1.0695 zone. A downside break below the 1.0695 support could send the pair toward the 1.0675 level. Any more losses might send the pair to 1.0650.
USD/CHF Technical Analysis
On the hourly chart of USD/CHF at FXOpen, the pair started a decent increase from the 0.8830 support. The US Dollar climbed above the 0.8900 resistance zone against the Swiss Franc.
The bulls were able to pump the pair above the 50-hour simple moving average and 0.8935. Finally, the pair tested the 0.89550 zone. A high was formed near 0.8956 and the pair is now consolidating gains. The pair tested the 23.6% Fib retracement level of the upward move from the 0.8913 swing low to the 0.8956 high.
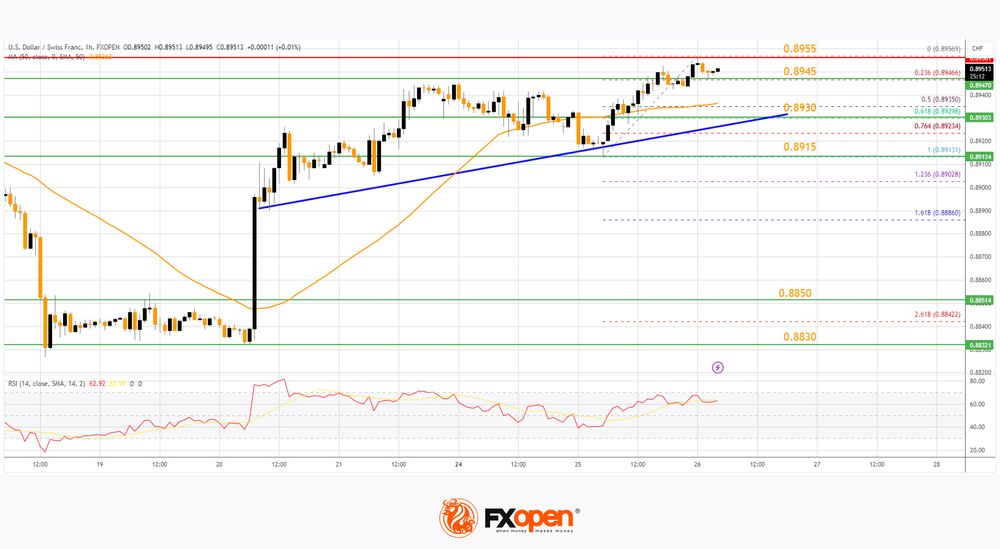
On the downside, immediate support on the USD/CHF chart is near the 0.8945 zone. The first major support is near the 61.8% Fib retracement level of the upward move from the 0.8913 swing low to the 0.8956 high at 0.8930.
There is also a connecting bullish trend line forming with support at 0.8930. A downside break below 0.8930 might spark bearish moves. The next major support is 0.8915.
Any more losses may possibly open the doors for a move toward the 0.8850 level in the near term. On the upside, the pair is now facing resistance near 0.8955. The next major resistance is at 0.8980. The main resistance is now near 0.9000. If there is a clear break above the 0.9000 resistance zone and the RSI climbs above 70, the pair could start another increase. In the stated case, it could test 0.9080.
Trade over 50 forex markets 24 hours a day with FXOpen. Take advantage of low commissions, deep liquidity, and spreads from 0.0 pips. Open your FXOpen account now or learn more about trading forex with FXOpen.
This article represents the opinion of the Companies operating under the FXOpen brand only. It is not to be construed as an offer, solicitation, or recommendation with respect to products and services provided by the Companies operating under the FXOpen brand, nor is it to be considered financial advice.
AUD/USD Surges on Inflation News in Australia
This morning, the Consumer Price Index (CPI) figures for Australia were released – according to ForexFactory, the annual CPI stood at 4.0% (expected = 3.8%, previous = 3.6%).
As Bloomberg reports:
→ Rent was the main driver of inflation due to a housing shortage.
→ The spike in inflation increases the risk of an RBA rate hike (a decision might be announced on 5th August).
→ Following the release of the high CPI figures, the AUD/USD exchange rate surged by 0.6%.
Moreover, the news from Australia could be a harbinger of a new wave of inflation that may manifest in other countries as well.
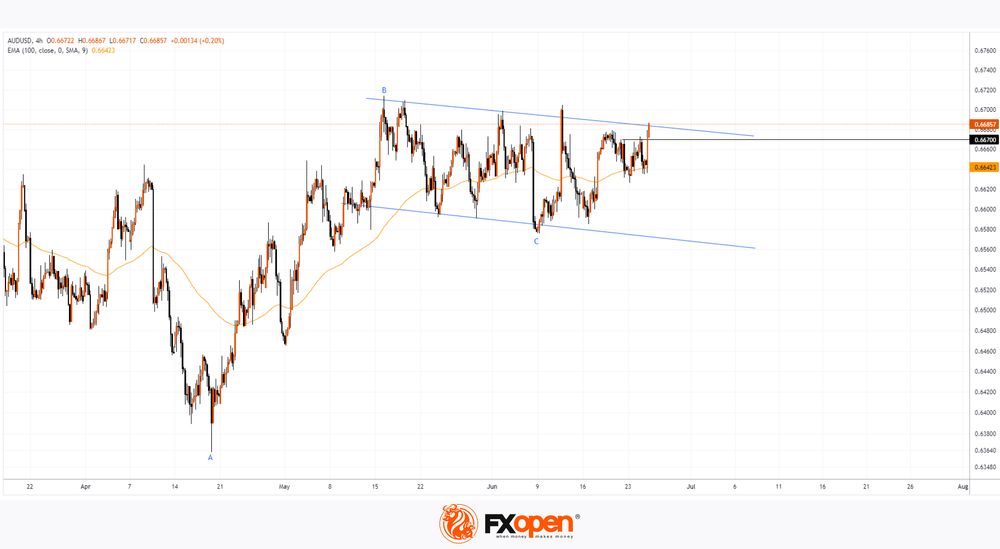
Technical analysis of the 4-hour AUD/USD chart shows that:
→ Since May, the price has formed a range (shown by blue lines) with a slight upward tilt.
→ If we assume that this range represents a bull flag pattern, we might soon see a breakout in an upward direction.
→ The bull flag hypothesis is supported by Fibonacci proportions: the B→C decline found support at the 0.618 level of the A→B rise.
The dominance of bulls in the AUD/USD market today is indicated by the following:
→ The price is above the upward-sloping EMA (100).
→ The price has broken through the local resistance at 0.667, which can now be expected to act as support.
However, the upper boundary of the blue range appears strong (as it slowed down the price increase after the CPI release), and it is possible that the bulls may need another fundamental driver to break through it.
Trade over 50 forex markets 24 hours a day with FXOpen. Take advantage of low commissions, deep liquidity, and spreads from 0.0 pips. Open your FXOpen account now or learn more about trading forex with FXOpen.
This article represents the opinion of the Companies operating under the FXOpen brand only. It is not to be construed as an offer, solicitation, or recommendation with respect to products and services provided by the Companies operating under the FXOpen brand, nor is it to be considered financial advice.