Sample Category Title
ECB’s Panetta: Must manage risks beyond baseline scenarios
Speaking today, ECB Governing Council member Fabio Panetta noted that the current macroeconomic conditions support "normalization of the monetary stance." He added that ECB initiated this process recently and, under the "baseline scenario," intends to continue it "gradually and smoothly."
However, Panetta cautioned that the inflation and growth projections represent only one of many possible outcomes. He stressed that monetary policy must also manage "risks and tail scenarios," not just baseline forecasts. The prevailing political and geopolitical risks, he said, necessitate "awareness, flexibility, and state-contingent action plans."
Panetta's comments come just days before French voters head to the polls for the first round of parliamentary elections. He highlighted the potential economic implications of political turnover, explaining that it inherently brings policy uncertainty. This uncertainty affects households and investors as they try to predict how new governments will handle critical economic and political decisions.
Gold Prices Under Pressure as Dollar Index (DXY), US Yields Rise
- Gold continues its decline with $2300/oz firmly back in sight.
- US Dollar index and US 10Y yield continue to rise, US 10Y now at 4.275%.
- PCE inflation data could be the catalyst needed for gold prices to find some direction.
Fundamental Overview
Gold prices remain under pressure this morning as rising US yields and a stronger US Dollar weigh on the precious metal. It appears as though the US inflation release (PCE Data) on Friday has market participants cautious as they await further clarity on rate cuts.
Geopolitical tensions have somewhat eased this week. Ongoing discussions between the US, Israel, and Hezbollah in Lebanon have neither led to a resolution nor escalated tensions. This could in part explain the lack of buying pressure and safe haven appeal at the start of this week.
The rise in US Treasuries and the US Dollar came about from comments by Federal Reserve policymakers. The rhetoric from policymakers was interpreted as hawkish with most of them agreeing that the Fed would remain cautious regarding any potential rate cuts this year. Fed policymakers Michelle Bowman and Lisa Cook refused to set a timeline on rate cuts with Bowman stating her readiness to raise rates if the inflation target remains out of reach.
US 2Y and 10Y Yield
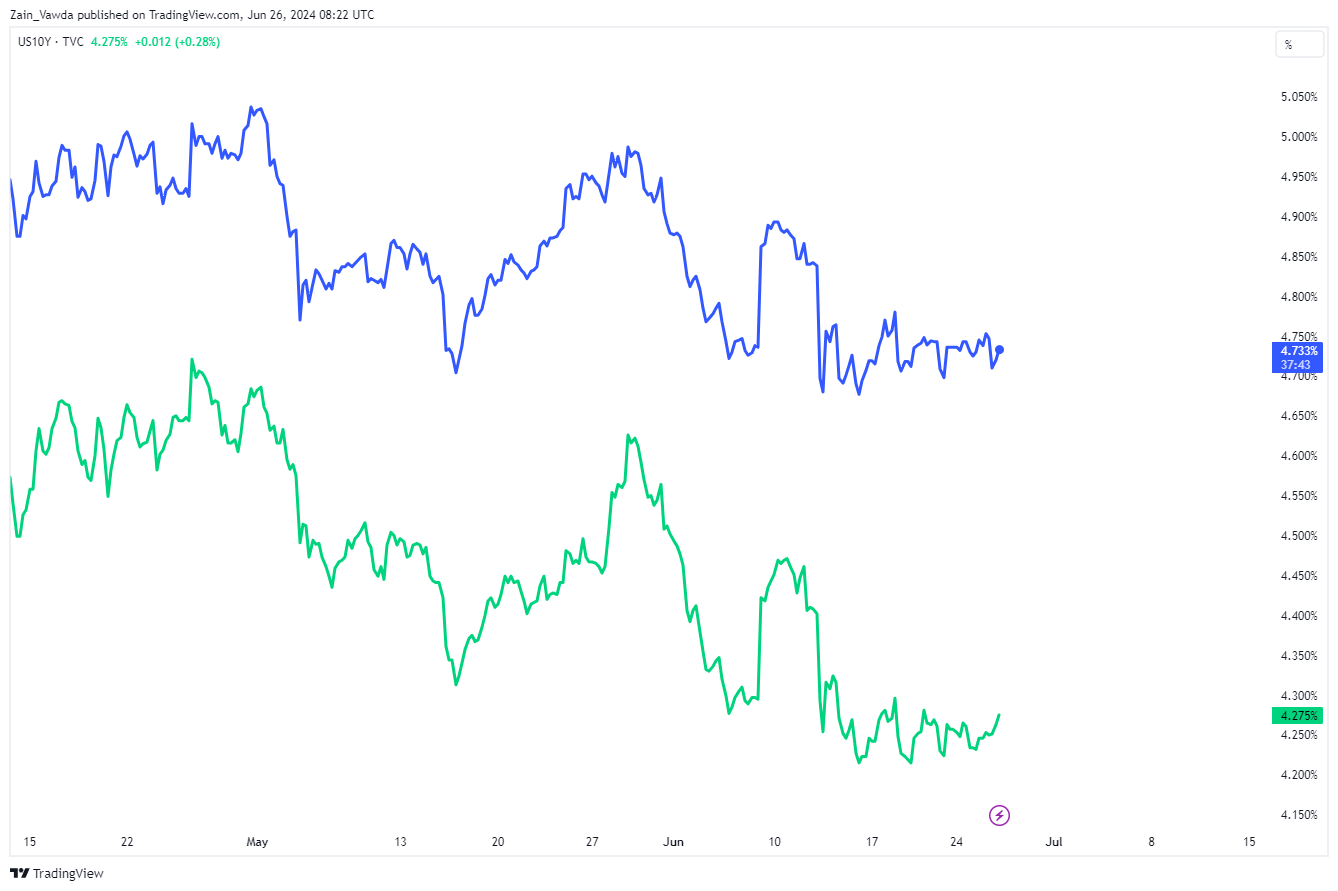
Source: TradingView.Com (click to enlarge)
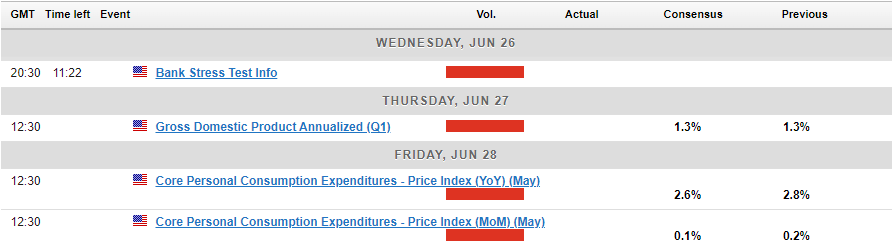
The Week Ahead: US GDP and PCE Data
Looking ahead to the rest of the week, today could well be the calm before the storm in many ways. Limited high impact data from the US is expected before market participants will hope for some clarity and volatility on Thursday and Friday with the release of the US Q1 GDP (est) and the personal consumption expenditure (PCE) price index.
The lack of clarity regarding rate cuts is certainly a stumbling block for the precious metal. A higher interest rate usually leads to outflows in gold as the opportunity cost of holding onto the precious metal increases. Add this to the fact that gold prices have enjoyed a significant rally over the past few months and the bearish pressure is likely to grow.
Looking at the PCE data and a soft print below consensus could be the catalyst needed for gold bulls to return with some conviction. Whereas a slight uptick in the PCE number could lead to further uncertainty regarding rate cuts and thus add further pressure on gold prices as market participants may choose to unwind more of their positions in the precious metal.
Gold Technical Outlook
The technical outlook for gold remains frustrating for market participants, with indecision prevailing in the market. This indecision is evident in the price action, characterized by higher lows followed by lower highs, indicating that range-bound trading may persist. A catalyst is urgently needed to drive gold prices back above the 2380 mark or to trigger a convincing and sustainable break below 2300
Looking at the H2 chart below and there is a trendline in focus which coincides with the 2320 resistance area. A break above this level could open up a retest of Mondays high at the 2334 resistance area. The next area of interest being 2350 which is also a psychological level and may prove tough to crack without an increase in volatility. Supporting an upside break is the golden cross pattern on the H2 chart, as the 100-day MA has now crossed above the 200-day MA which is usually a sign of bullish momentum and the potential for a rise in price.
Alternatively a break of 2310 is needed if the 2300 level is to be retested. The challenge for bears is a sustainable break of the 2300 handle which has proved rather elusive thus far. The brief dips below this support have been met with significant buying pressure, and this is likely to continue without any shift in the overall fundamental outlook of the precious metal.
Gold H2 (two-hour) Chart – June 26, 2024
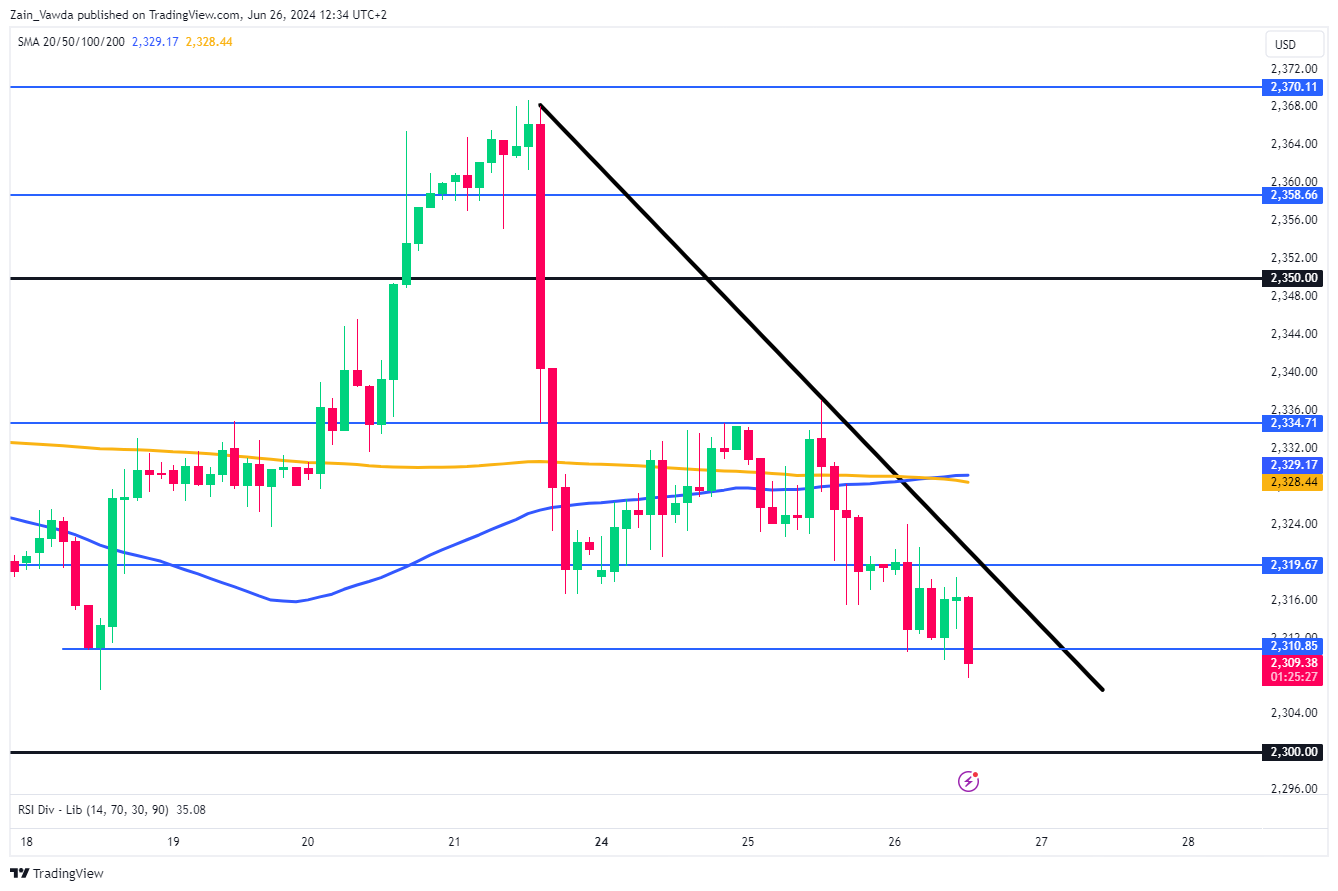
Source: TradingView.Com (click to enlarge)
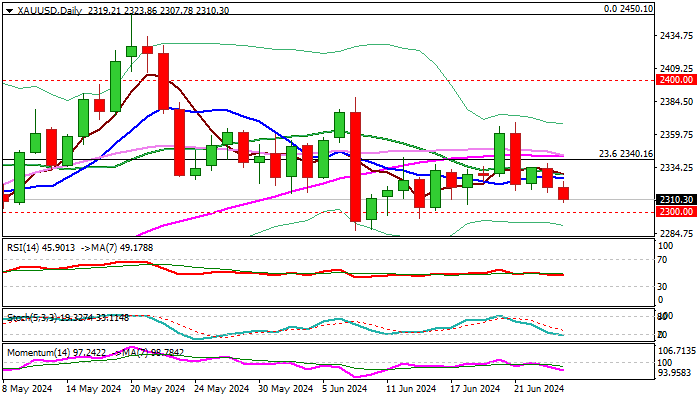
XAU/USD: Gold Stands at the Back Foot on Hawkish Comments from Fed
Gold price dipped to one-week low on Wednesday, deflated by the latest hawkish comments from Fed policymakers.
The US central bank expects to bring inflation under control by keeping policy rate unchanged for some time, but also reiterated their willingness to further, if necessary, tighten the policy.
The sentiment soured after such comments, though larger bullish bias is expected to remain intact while metal’s price holds above key supports at $2300/$2280 (psychological / the floor of consolidation range under new record high.
Daily studies are mixed, with 14-d momentum heading deeper into negative territory, conflicting MA’s and stochastic penetrating oversold territory, lacking clearer direction signal.
Markets focus on release of US inflation data (PCE) on Friday which would provide more details about the timing of Fed’s next steps, after the first rate cut schedule was postponed several times.
The price is likely to remain in extended consolidation before larger bulls regain full control, as high global economic and geopolitical uncertainty keeps safe-haven demand.
Res: 2325; 2342; 2368; 2387.
Sup: 2300; 2277; 2272; 2249.
Gold: Third Time Lucky for the Bears?
Gold has been under moderate pressure since last Friday, when the price reversed sharply from above $2360. This is an important signal from the bears that they retain control of the market, forming a trend of lower local highs.
On Wednesday morning, the price temporarily dipped below $2310, returning to the support area of the last two months near $2300. This brought the price close to an important level for the market, promising an imminent battle between bulls and bears.
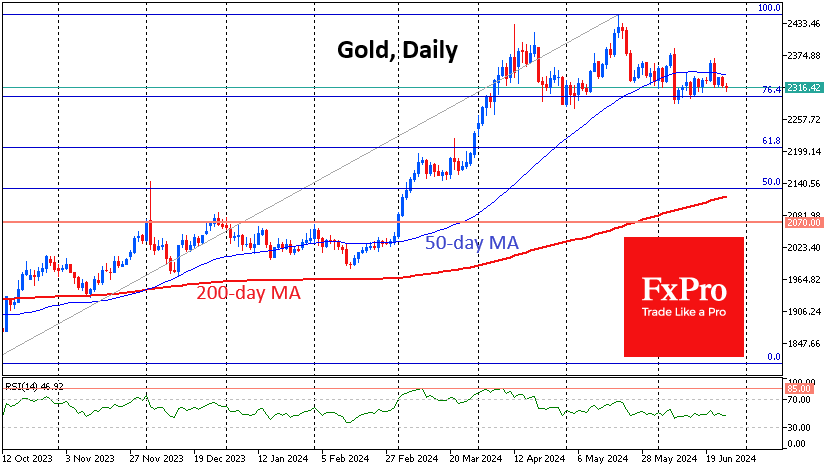
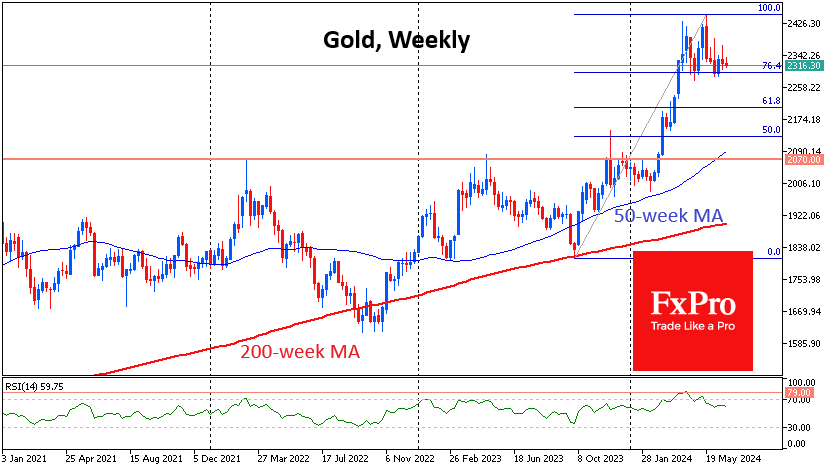
We see gold’s momentum from the October 2023 lows to the March 2024 highs. This was a principal reversal from the 200-week moving average.
Since then, the market balance has shifted to sell on the upside, indicating the prevalence of profit-taking. But so far, we are seeing a shallow correction, typical of strong bull markets, as the drawdown is being brought back on the decline to 76.4% of total momentum instead of the classic 61.8% (at $2200).
However, the downside momentum in gold is hard to ignore. There were strong selloffs on 22 April, 22-23 May, and 7 June. On 21 June, the decline was not so impressive but very instructive, as it prevented the price from returning above the 50-day moving average and absorbed the previous day’s bullish candle.
Clearly, the bears in this market are strongly forming a reversal pattern to the downside. A rising dollar, helped by a further hawkish shift by FOMC members, is additionally playing on the sellers’ side.
If the third attempt to go below $2300 is successful for the bears, the gold price could move into the $2200 area rather quickly, as the area between these levels does not contain any previous significant stops. The next destination could be the $2070 area, which has been working as resistance for a long time.
If we are talking about important milestones on the way up, they are $2340 (50-day average), $2360 (previous peak), and $2450 (global high).
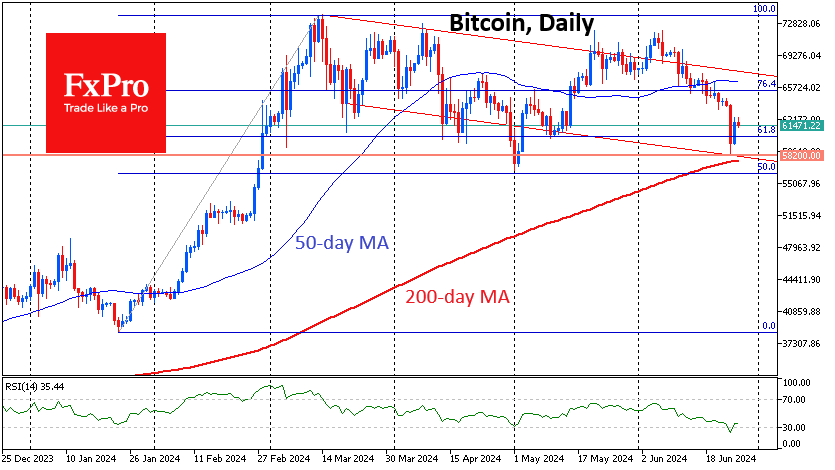
Will There Be Rebound Development in Bitcoin?
Market picture
Crypto market capitalisation added 1.2%, recovering to Monday’s levels of $2.28 trillion.
On 25 June, the Crypto Fear and Greed Index fell into “fear” territory at 30 points, the lowest since September 2023. On 26 June, the index recovered to 46. Both in September and now, the price and index’s sudden drop out of a range has attracted buyers, laying the groundwork for gains after a prolonged slide.
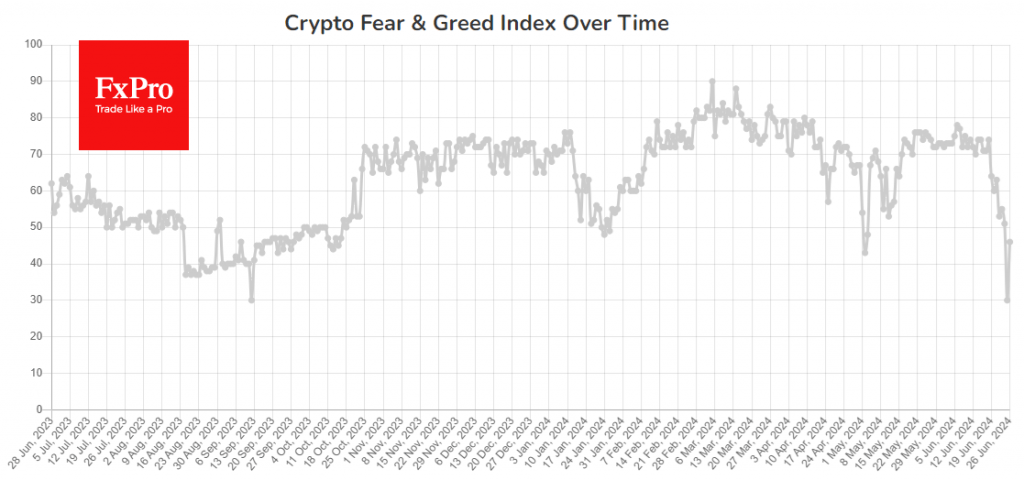
However, the recovery momentum paused Wednesday morning, raising the question of whether we’ll see a renewed selloff. Such a turn of events risks breaking the multi-month bullish view on Bitcoin and, with it, the entire cryptocurrency market.
However, the base case scenario now remains the development of a rebound and the preservation of the long-term bull trend.
News background
According to SoSoValue, outflows from the bitcoin-ETF continue for the seventh consecutive day. On 24 June, holders of BTC-ETF shares reduced their positions by $174.5 million. The trigger for the drop in quotations was the news about Mt.Gox’s preparation for compensation payments in early July.
Despite the correction, derivatives market indicators suggest a steady bullish sentiment towards bitcoin ahead of the expiration of weekly, monthly and quarterly positions on 28 June, The Block reported. According to analysts at QCP Capital, the options market is not expecting increased volatility in July following the announcement of a payout to Mt.Gox creditors on Monday.
German authorities transferred 400 BTC (~$24.34 million) to Coinbase and Kraken exchanges on 25 June and 500 BTC to a separate address. Arkham tracked the transactions. The German government currently holds 46,359 BTC (~$2.83bn).
Bitcoin mining revenue indicator, the Bitcoin Hash Price Index, has approached an all-time low. Mining profitability is falling due to the decline in the BTC exchange rate and the rising cost of mining the first cryptocurrency.
Commissions in the Ethereum network fell to the lowest values since April 2020. This was largely fuelled by so-called second-tier solutions and technical updates to the network.
ECB’s Rehn considers two more rate cuts this year as reasonable
In an interview today, ECB Governing Council member Olli Rehn indicated that market data suggests the likelihood of two additional rate cuts, bringing the rate to 3.25% by the end of the year. He also noted that the terminal rate for this easing cycle is expected to fall between 2.25% and 2.50%. Rehn described these projections as "reasonable expectations."
Despite recent economic data overshooting expectations, Rehn affirmed that "disinflationary process is going on," although it may be bumpy. He added that ECB would maintain its course and "continue rate cuts" to ensure this process remains on track.
Rehn further elaborated that current interest rates are still in "restrictive territory," underscoring ECB's work to ensuring that the "disinflationary process will continue." He stressed that the central bank's primary goal is to control inflation, but also highlighted its broader responsibilities.
"Without compromising our primary objective," Rehn said, "we also have a responsibility to support full employment, sustainable development, and balanced growth."
AUD/JPY: Aussie Outperformance With Hotter AU CPI
- Australia’s monthly CPI has increased to 4% from 3.7% in April, a sign of a sticky and elevated consumer inflationary trend.
- The odds of an RBA interest rate in the near-term horizon have reduced which increased the yield premium of 2-year Australian government bond over JGB.
- AUD/JPY is likely on a path of bullish acceleration within its medium-term & major uptrend phases.
The Aussie dollar has outperformed the other major currencies (EUR, GBP, CHF, CAD, JPY & NZD) as it recorded an intraday gain of 0.46% against the US dollar at this time of the writing.
AUD/JPY is the top performer among the G-10 yen crosses
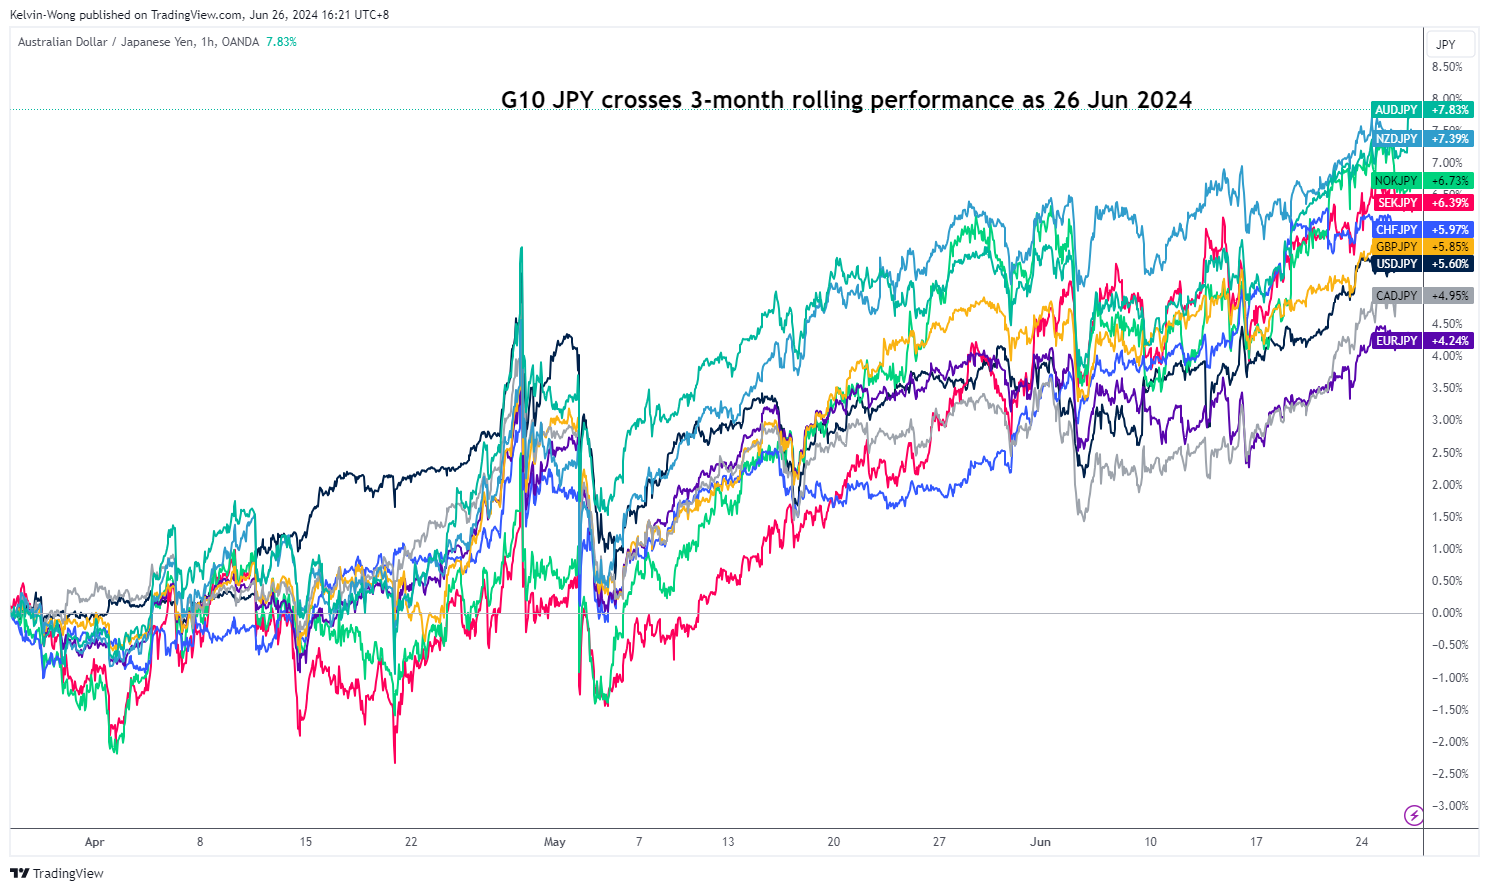
Fig 1: 3-month of rolling performances of G-10 JPY crosses as of 26 Jun 2024 (Source: TradingView, click to enlarge chart)
Notably against the Japanese yen, the AUD/JPY has risen to be the top-performing G-10 JPY cross pair with a gain of 7.8% on a rolling three-month basis (see Fig 1).
The main catalyst for today’s spike in the Aussie dollar strength has been the revival of sticky, and elevated consumer inflation in Australia. The monthly CPI indicator has increased to 4% in May, up from 3.8% in April, and above the consensus expectations of 3.8%.
The latest reading from the monthly CPI has shown that the consumer inflationary trend in Australia has increased to its highest level since November 2023, more or less reinforcing the cautious stance adopted by the Australian central bank, RBA in its last monetary policy meeting in June to stay vigilant to upside risks to inflation.
Divergence of Australia’s inflationary trend against the other major developed countries
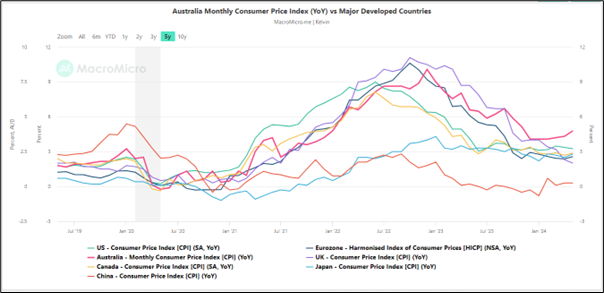
Fig 2: Monthly CPI (y/y) of Australia, US, UK, Eurozone, Canada, Japan & China as of May 2024 (Source:MacroMicro , click to enlarge chart)
Hence, the odds have been significantly reduced for an impending RBA interest rate cut in 2024 as the monthly CPI indicator has supported a reacceleration of consumer inflationary trend in Australia and also a significant divergence against the inflationary trends of other key major developed economies (US, UK, EU, Canda, Japan & China) (see Fig 2).
Bullish acceleration in AUD/JPY
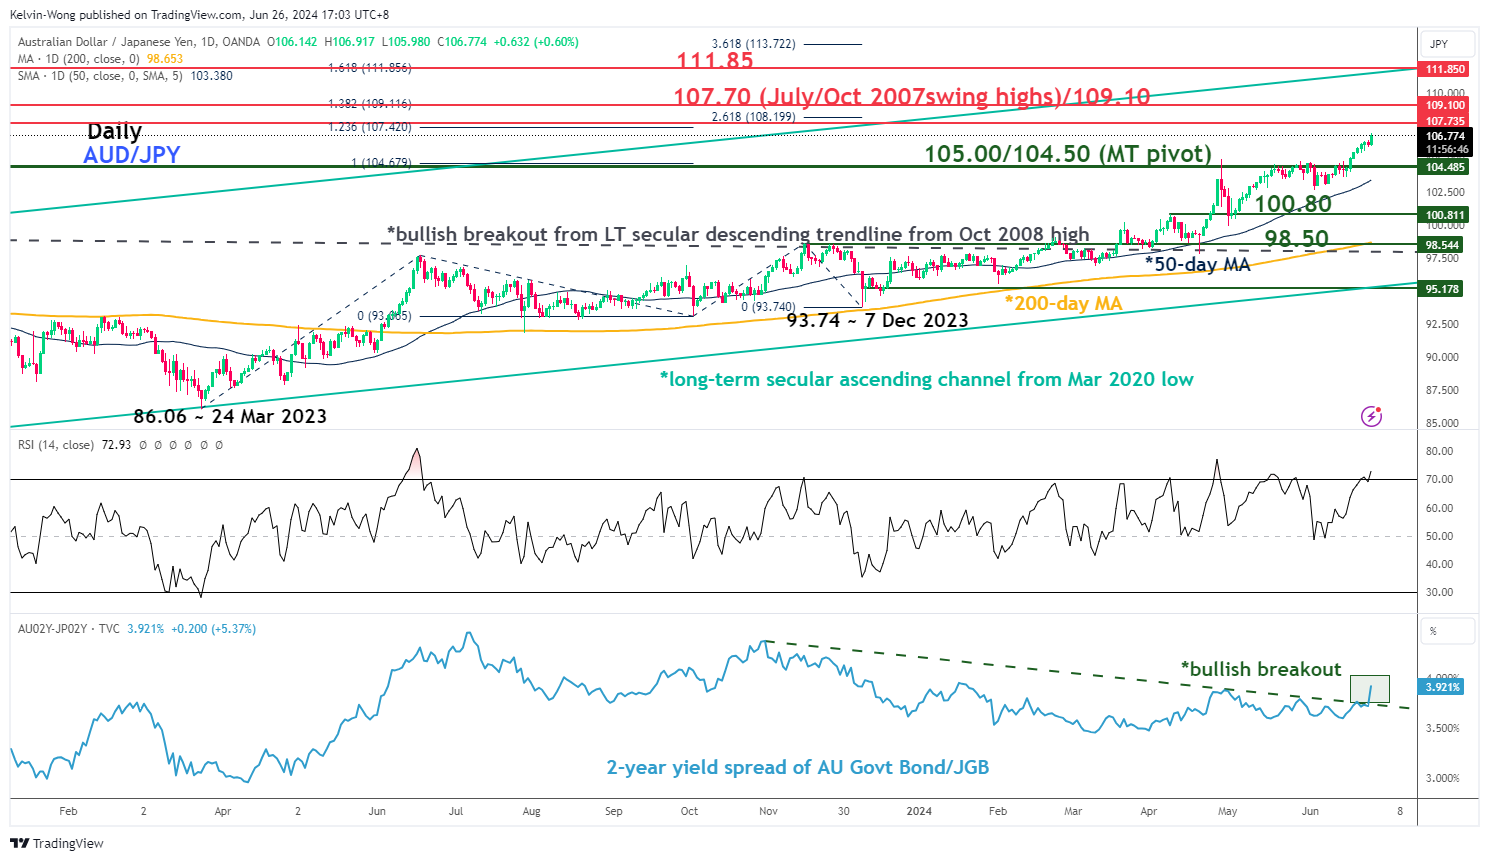
Fig 3: AUD/JPY major & medium-term trends as of 26 Jun 2024 (Source: TradingView, click to enlarge chart)
In the lens of technical analysis, the bullish breakout above its former four-week range configuration from 29 April 2024 has reinforced a bullish acceleration movement within its medium-term and major uptrend phases of the AUD/JPY (see Fig 3).
Intermarket analysis via the latest movements from the yield spread between the 2-year Australian government bond and the Japanese government bond (JGB) has reinforced the potential impulsive upmove sequence of the AUD/JPY as the 2-yield spread has just staged a medium-term bullish breakout which suggests an increasingly positive yield premium in the 2-year Australian government bond over the 2-year JGB.
Key medium-term pivotal support on the AUD/JPY is at 105.00/104.50 with the next medium-term resistances coming in at 107.70/109.10 and 111.85 (also the upper boundary of its long-term secular ascending channel from the March 2020 low) from a multi-week horizon.
On the other hand, failure to hold at 104.50 negates the bullish tone to kickstart a deeper corrective decline sequence to expose the next medium-term support at 100.80, and below it sees 98.50 next (key long-term pivotal support that also confluences with the 200-day moving average).
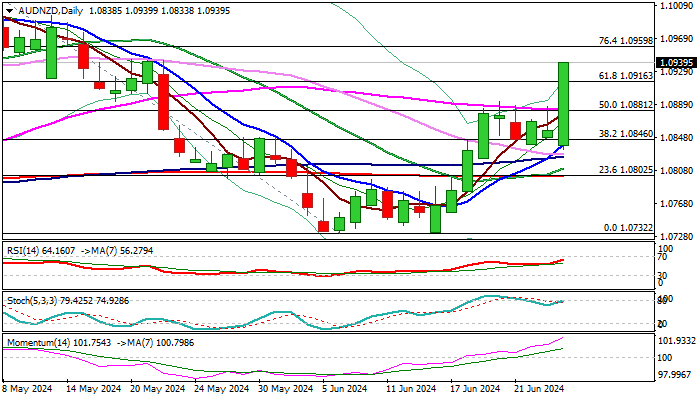
AUD/NZD: Aussie Surges Almost 1% vs Kiwi Dollar After Release of Australia’s Inflation Report
Australian dollar surged 0.9% vs Kiwi dollar in Wednesday’s morning, lifted by fresh hawkish signals that the RBA may opt for a rate hike next month, after Australia’s inflation rose above expectations and hit new multi-month high in May.
A full-figure rise broke through three Fibo barriers (38.2%; 50% and 61.8% retracement of 1.1030/1.0732 downtrend) and pressuring the top of daily cloud (1.0943).
Breach of narrowing cloud top to expose targets at 1.0959 (Fibo 76.4%) and 1.10 (psychological; Fibo 100% expansion of the current third wave of five-wave cycle from 1.0732 higher base).
Daily technical indicators are in full bullish setup but about to enter overbought territory, which may slow bulls for consolidation / limited correction.
Supports at 1.0916/1.0890 zone should contain dips and keep larger bulls intact.
Res: 1.0959; 1.1000; 1.1.1030; 1.1062.
Sup: 1.0916; 1.0890; 1.0846; 1.0825.
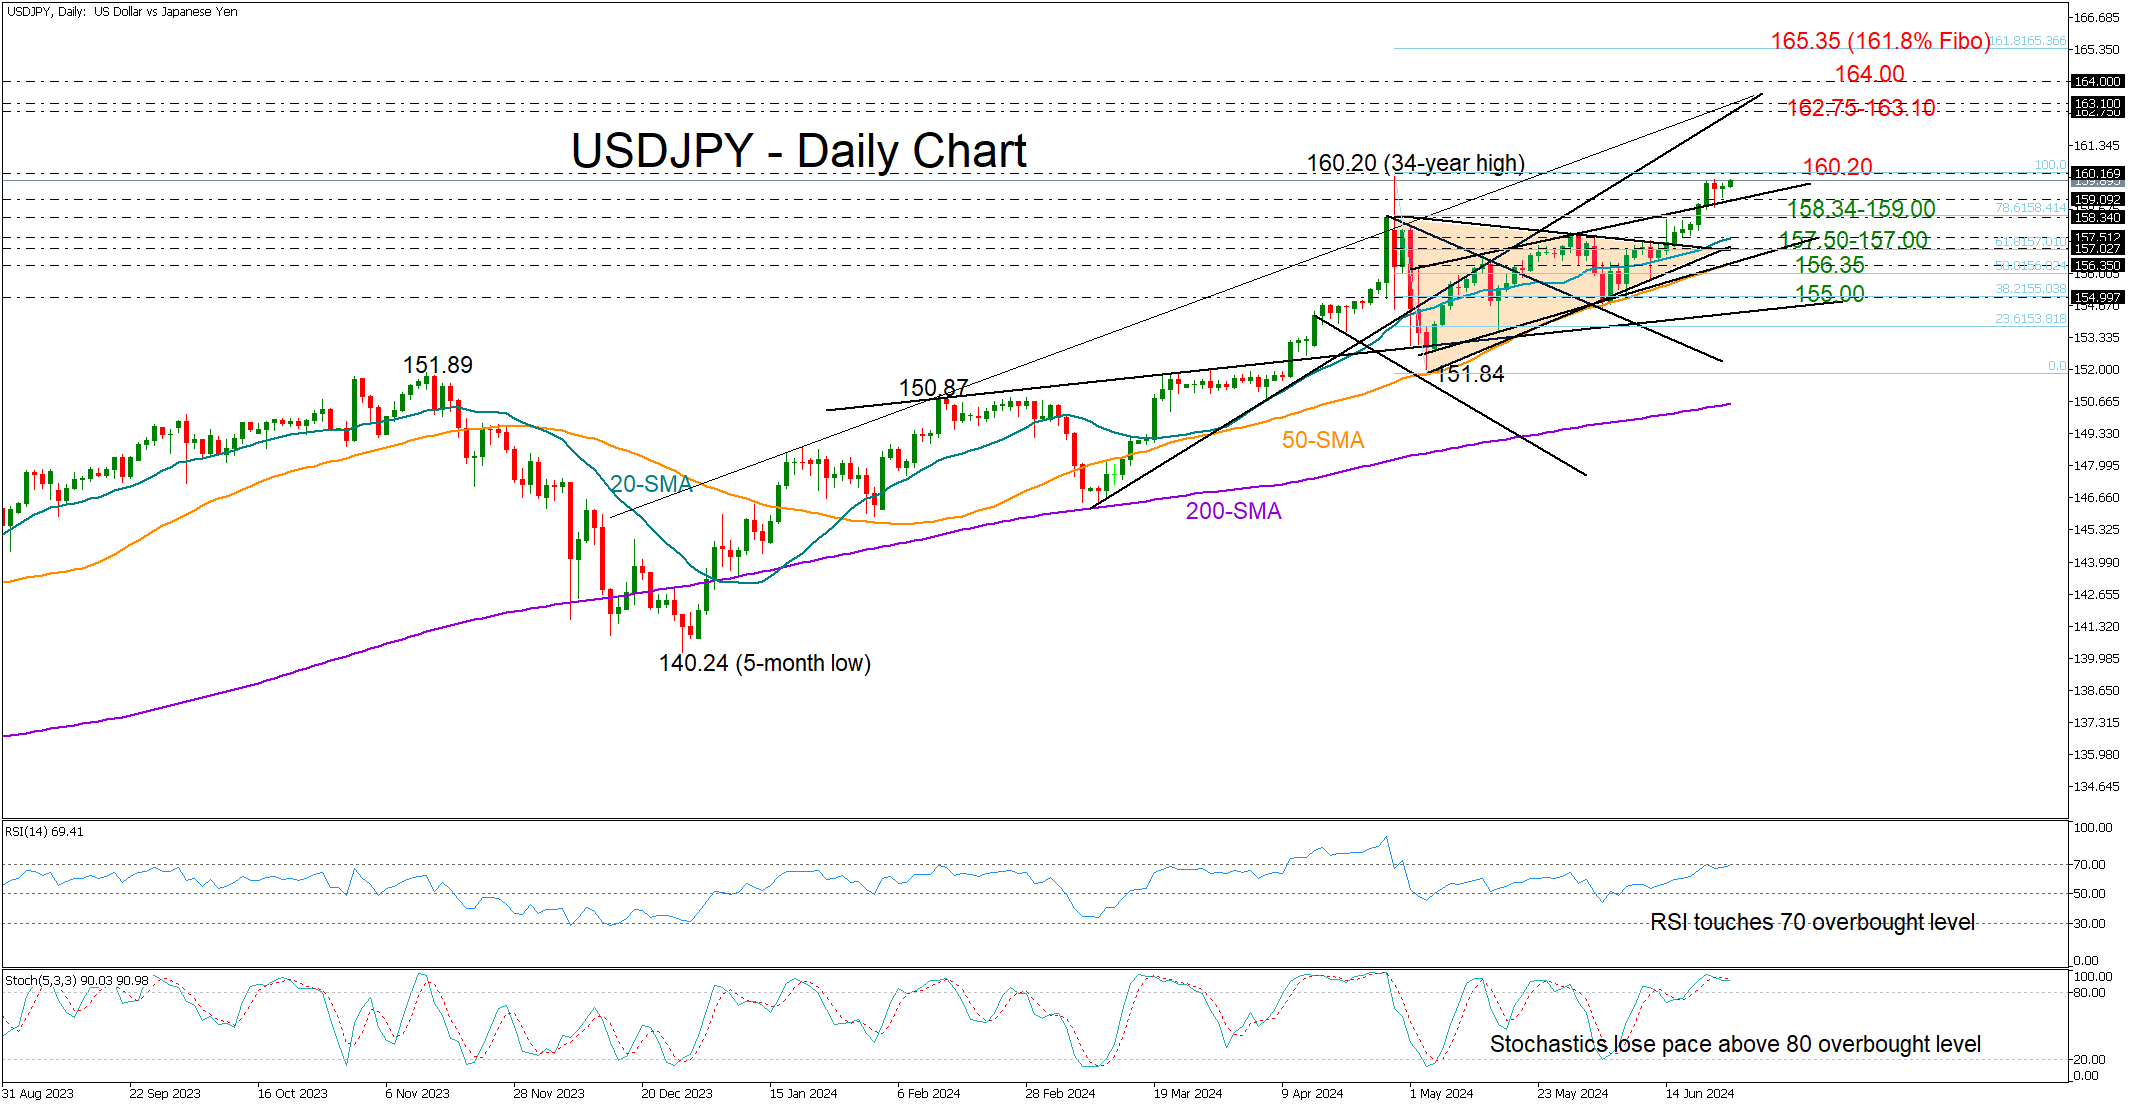
USDJPY Flirts With 160 Level Again
- USDJPY trades with weak momentum slightly below critical 160 level
- Overbought conditions detected; sellers wait below 158.35-159.00
- BoJ intervention is possible; US core PCE inflation due on Friday at 12:30 GMT
Following a constructive week, USDJPY is now hovering just below its 34-year high of 160.20, having surpassed April’s limit of 158.34 and a crucial resistance line.
The price has been facing resistance near 159.80 over the past couple of days and with the technical indicators sending overbought signals, the bulls might experience a tough session ahead. However, if the pair continues to defend itself around the 159.00 round level, hopes for another upturn may not completely fade.
A decisive move above the 160.20 peak could last till the 162.75-163.10 region, where the rising constraining lines from January and March are located. Then the door could open for the 164.00 psychological mark or the 161.8% Fibonacci extension of May’s downfall around 165.35.
Conversely, a drop below 159.00 could potentially lead to a retest of April’s limit at 158.34. A violation there would change the short-term outlook from bullish to neutral and likely force a decline towards the 20-day simple moving average (SMA) at 157.50. The 157.00 trendline zone could next challenge the bears, while lower, the 50-day SMA and the ascending trendline from May could prevent a sharp downfall to 156.35.
Overall, USDJPY has entered a caution zone, increasing the likelihood of a downside correction. Yet, the outlook would only be downgraded if the price falls below 158.34-159.00.
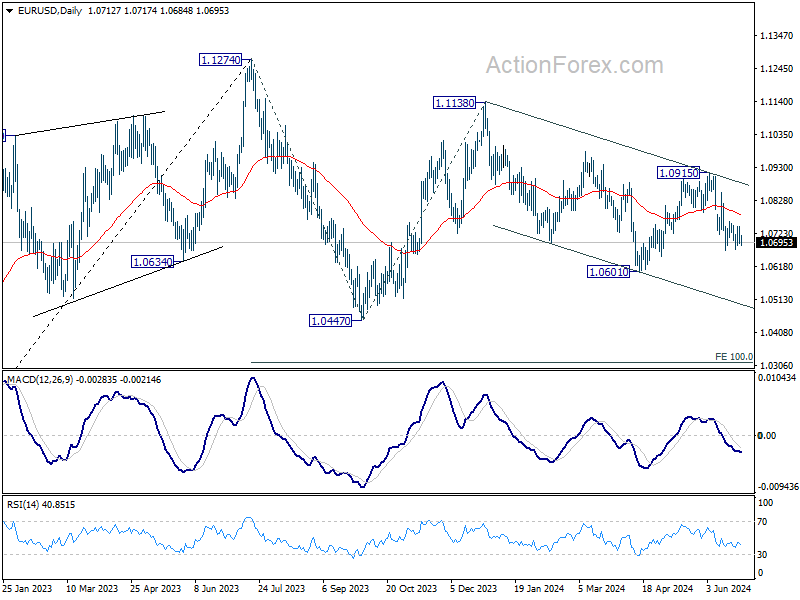
EUR/USD Daily Outlook
Daily Pivots: (S1) 1.0689; (P) 1.0716; (R1) 1.0742; More....
Intraday bias in EUR/USD remains neutral and outlook stays bearish with 1.0760 resistance intact. Decline from 1.0915 is seen as another leg in the larger corrective pattern. Break of 1.0667 will target 1.0601 and below. However, firm break of 1.0760 will turn intraday bias back to the upside for stronger rebound.
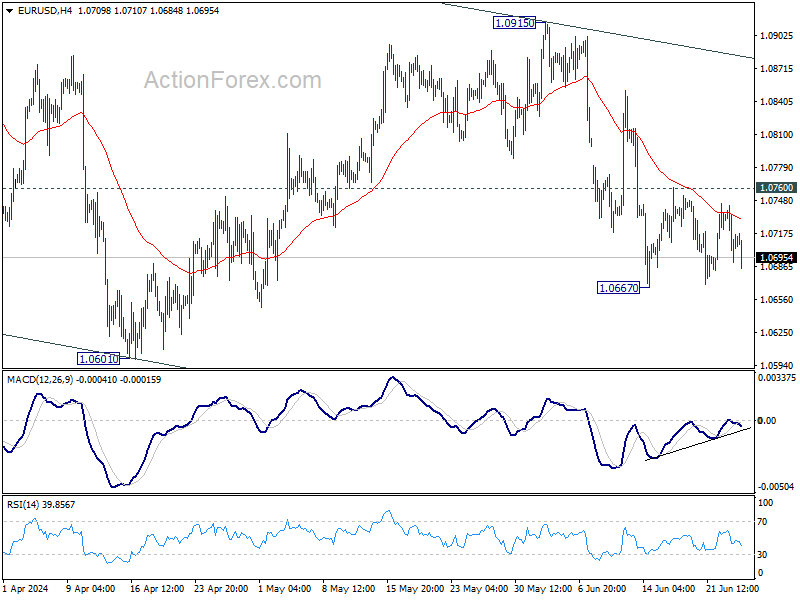
In the bigger picture, price actions from 1.1274 are viewed as a corrective pattern that's still in progress. Break of 1.0601 will target 1.0447 support and possibly further to 100% projection of 1.1274 to 1.0447 from 1.1138 at 1.0311. For now, this will remain the favored case as long as 1.0915 resistance holds, in case of rebound.