
Sample Category Title
USD/CHF Mid-Day Outlook
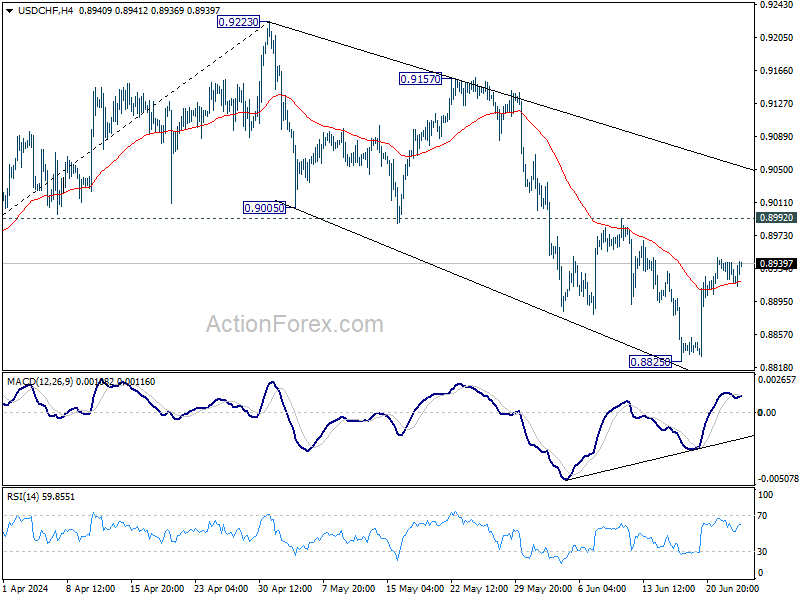
Daily Pivots: (S1) 0.8919; (P) 0.8932; (R1) 0.8943; More….
No change in USD/CHF's outlook as consolidation continues above 0.8825. Intraday bias stays neutral for the moment. Near term outlook remains bearish with 0.8992 resistance intact. Break of 0.8825 will resume the fall from 0.9223 to 61.8% retracement of 0.8332 to 0.9223 at 0.8672.
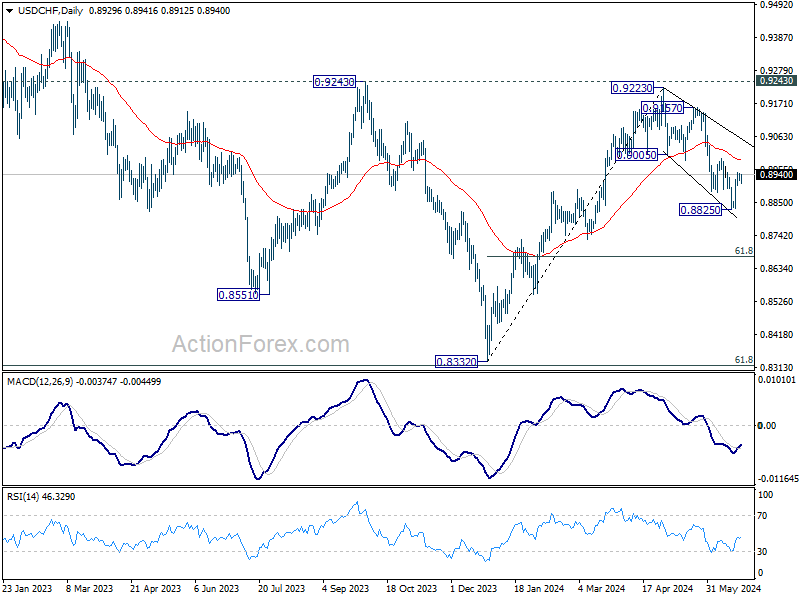
In the bigger picture, price actions from 0.8332 medium term bottom are seen as developing into a corrective pattern to the down trend from 1.0146 (2022 high). Rejection by 0.9243 resistance affirms this case, and maintains medium term bearishness. While more range trading could be seen between 0.8332/0.9243 first, downside break out is mildly in favor at a later stage.
GBP/USD Mid-Day Outlook
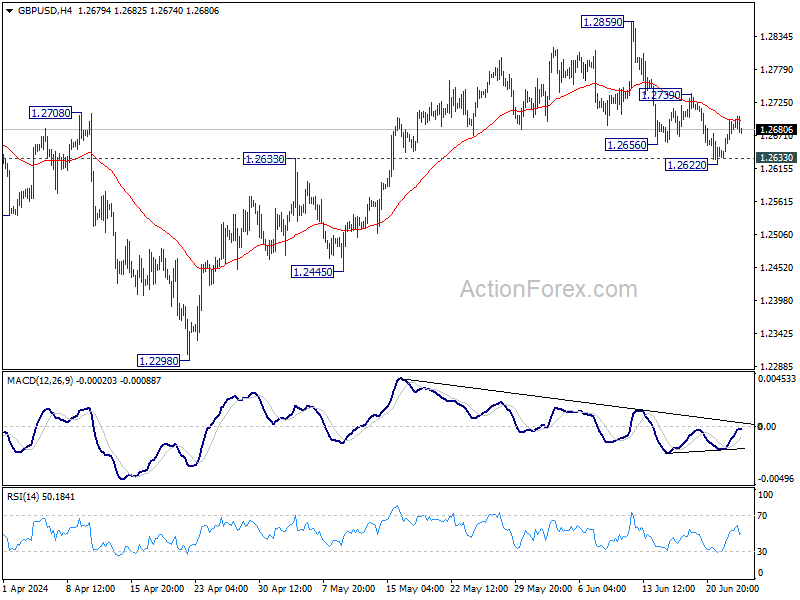
Daily Pivots: (S1) 1.2647; (P) 1.2672; (R1) 1.2712; More...
No change in GBP/USD's outlook and intraday bias stays neutral. Further decline is expected as long as 1.2739 resistance holds. Break of 1.2622, and sustained trading below 1.2633 resistance turned support will argue that whole rise from 1.2298 has completed, and target 1.2445 and below. However, firm break of 1.2739 will argue that pull back from 1.2859 has completed, and bring retest of this high instead.
In the bigger picture, price actions from 1.3141 medium term top are seen as a corrective pattern that is still in progress. Break of 1.2445 support will confirm that another falling leg has started and target 1.2036 cluster support again (38.2% retracement of 1.0351 (2022 low) to 1.3141 at 1.2075. Nevertheless, break of 1.2892 resistance will argue that larger up trend from 1.0351is ready to resume through 1.3141.

EUR/USD Mid-Day Outlook
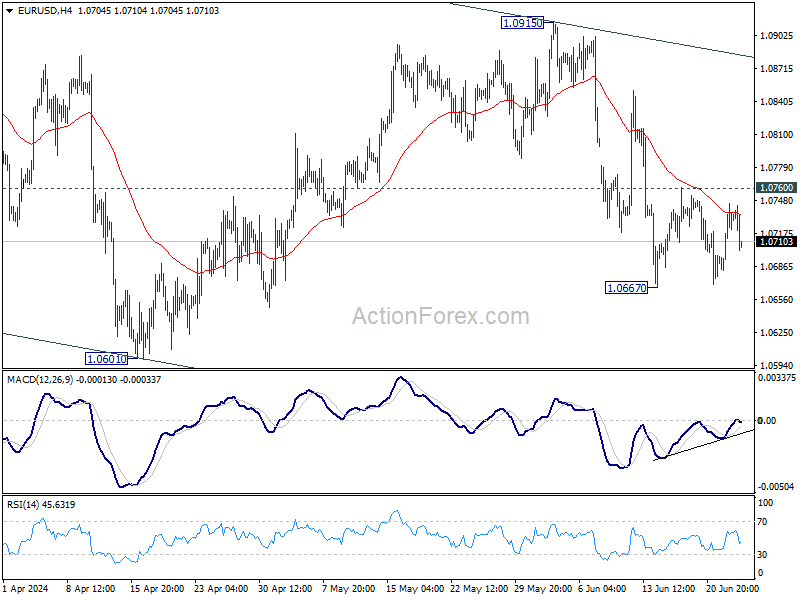
Daily Pivots: (S1) 1.0696; (P) 1.0721; (R1) 1.0760; More....
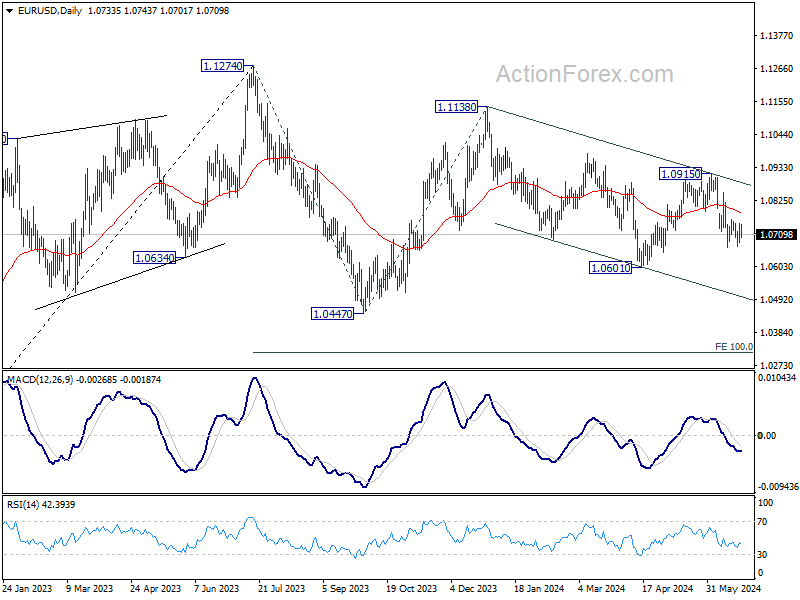
EUR/USD dips notably in early US session but stays in range above 1.0667. Intraday bias remains neutral at this point. Further fall is expected with 1.0760 resistance intact. Decline from 1.0915 is seen as another leg in the larger corrective pattern. Break of 1.0667 will target 1.0601 and below. However, firm break of 1.0760 will turn intraday bias back to the upside for stronger rebound.
In the bigger picture, price actions from 1.1274 are viewed as a corrective pattern that's still in progress. Break of 1.0601 will target 1.0447 support and possibly further to 100% projection of 1.1274 to 1.0447 from 1.1138 at 1.0311. For now, this will remain the favored case as long as 1.0915 resistance holds, in case of rebound.
Canadian Dollar Surges on Unexpected Inflation Rebound in May
Canadian Dollar jumps following after data showing that Canadian inflation unexpectedly accelerated in May. More importantly, the resurgence in price pressures was largely driven by significant increase in services inflation. The data aligns with BoC Governor Tiff Macklem's cautious stance that the central bank should not ease monetary policy "too quickly." Given this context, the likelihood of a back-to-back rate cut in July seems minimal. Attention will now shift to whether the Bank of Canada has room to cut interest rates at its September meeting, assuming no drastic economic surprises in the interim.
In broader currency markets, the Euro has turned broadly lower as its near term recovery momentum waned. The common currency remains overshadowed by uncertainties related to the French parliamentary elections, making a sustained bounce unlikely until the political situation clarifies. Australian and New Zealand Dollars, along with Swiss Franc, are among the weakest performers today too. In contrast, Dollar is showing strength, positioning as the second strongest currency after Canadian Dollar. Yen is also seeing some recovery, while British Pound is holding a middle ground.
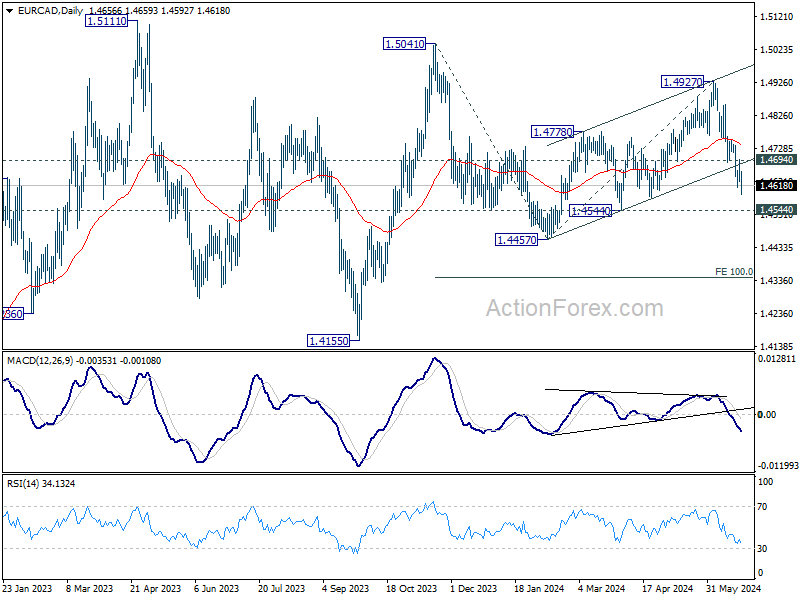
Technically, EUR/CAD's fall from 1.4927 resumed today after brief recovery. Corrective rise from 1.4457 should have completed with three waves up to 1.4927. Deeper decline is expected as long as 1.4694 resistance holds, to 1.4544 support. Decisive break there will argue that fall from 1.5041 is ready to resume through 1.4457 low.
In Europe, at the time of writing, FTSE is down -0.19%. DAX is down -0.99%. CAC is down -0.82%. UK 10-year yield is down -0.0129 at 4.071. Germany 10-year yield is down -0.017 at 2.405. Earlier in Asia, Nikkei rose 0.95%. Hong Kong HSI rose 0.25%. China Shanghai SSE fell -0.44%. Singapore Strait Times rose 0.37%. Japan 10-year JGB yield rose 0.0092 to 1.000.
Canada's CPI accelerates to 2.9% yoy, driven by service sector price hikes
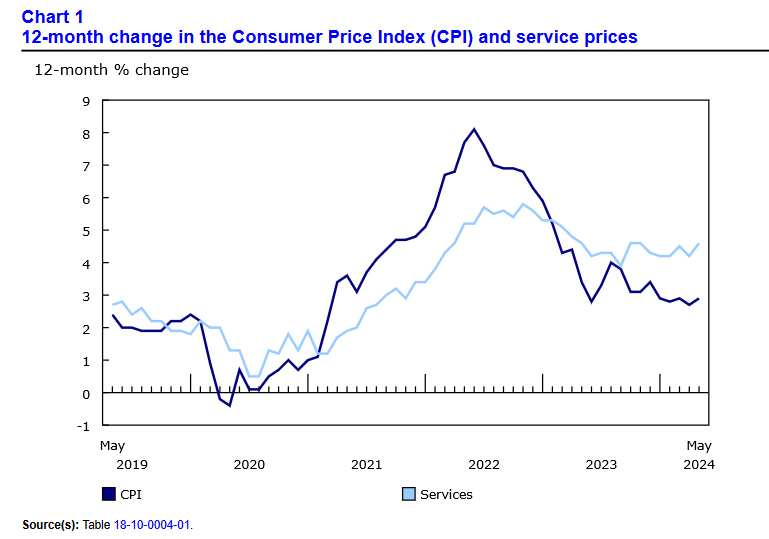
Canada's CPI recorded a notable increase in May, climbing to 2.9% yoy from 2.7% yoy the previous month, surpassing the anticipated rate of 2.6%. This acceleration in headline CPI was primarily fueled by a significant uptick in service prices, which rose by 4.6% yoy in May, following a 4.2% yoy increase in April.
Diving deeper into the components, CPI median—which represents the midpoint of price changes—escalated from 2.6% yoy to 2.8% yoy, again outstripping the forecast of 2.6%. CPI trimmed, another measure that excludes extreme price movements, held steady at 2.9% yoy, also exceeding expectations of 2.8%. In contrast, CPI common, which reflects the common price changes across categories, slowed slightly from 2.6% yoy to 2.4% yoy, falling below the anticipated 2.6%.
On a monthly basis, the CPI rose by 0.6% mom in May, doubling the expected 0.3% mom increase. Similarly, the core CPI also increased by 0.6% mom, well above the forecast of 0.2%. This indicates a broader upward pressure on prices beyond just volatile categories.
Fed's Bowman: Inflation to remain elevated, rate hold necessary
Fed Governor Michelle Bowman, in a speech today, said her baseline outlook that US inflation will return to the 2% target, provided federal funds rate remains at its current level of 5.25-5.50% "for some time." She emphasized that Fed is "still not yet at the point" where it would be appropriate to lower the policy rate.
Bowman stressed the need for Fed to "consider a range of possible scenarios" as monetary policy decisions evolve. She remains "willing" to raise interest rates "should progress on inflation stall or even reverse."
Regarding inflation outlook, Bowman noted that since the beginning of 2024, there has been only "modest" progress on inflation. Core CPI has been running at 3.8% through May, which is significantly above the average inflation rate in the second half of last year. She expects inflation to "remain elevated for some time."
Bowman also highlighted several upside risks to inflation. She mentioned that it is unlikely that further supply-side improvements will continue to reduce inflation. Geopolitical developments could also pose additional risks. Furthermore, increased immigration and continued labor market tightness could lead to persistently high core services inflation.
Australia's Westpac consumer sentiment ticks up but still deeply pessimistic
Australia's Westpac Consumer Sentiment rose 1.7% mom to 83.6 in June. However, the index remains deeply pessimistic, well below neutral level of 100. Although assessments of personal finances and buyer sentiment have become less negative, concerns about inflation, interest rates, and economic growth continue to weigh heavily on consumers.
The sub-index tracking the 'economic outlook for the next 12 months' fell -5.7% mom to 78.5, marking its lowest level since last October. In contrast, the 'economic outlook for the next 5 years' sub-index saw a slight improvement, rising 2.1% mom to 94.1.
Regarding RBA monetary policy, Westpac noted that the upcoming Q2 CPI data, due on July 31, will be crucial. Westpac expects the update to confirm that weak demand is still exerting disinflationary pressure. This should provide RBA with sufficient confidence that upside risks are not materializing, reducing the likelihood of a rate hike.
EUR/USD Mid-Day Outlook
Daily Pivots: (S1) 1.0696; (P) 1.0721; (R1) 1.0760; More....
EUR/USD dips notably in early US session but stays in range above 1.0667. Intraday bias remains neutral at this point. Further fall is expected with 1.0760 resistance intact. Decline from 1.0915 is seen as another leg in the larger corrective pattern. Break of 1.0667 will target 1.0601 and below. However, firm break of 1.0760 will turn intraday bias back to the upside for stronger rebound.
In the bigger picture, price actions from 1.1274 are viewed as a corrective pattern that's still in progress. Break of 1.0601 will target 1.0447 support and possibly further to 100% projection of 1.1274 to 1.0447 from 1.1138 at 1.0311. For now, this will remain the favored case as long as 1.0915 resistance holds, in case of rebound.
Economic Indicators Update
| GMT | Ccy | Events | Actual | Forecast | Previous | Revised |
|---|---|---|---|---|---|---|
| 23:50 | JPY | Corporate Service Price Index Y/Y May | 2.50% | 2.80% | 2.70% | |
| 00:30 | AUD | Westpac Consumer Confidence Jun | 1.70% | -0.30% | ||
| 12:30 | CAD | CPI M/M May | 0.60% | 0.30% | 0.50% | |
| 12:30 | CAD | CPI Y/Y May | 2.90% | 2.60% | 2.70% | |
| 12:30 | CAD | CPI Core M/M May | 0.60% | 0.20% | 0.20% | |
| 12:30 | CAD | CPI Median Y/Y May | 2.80% | 2.60% | 2.60% | |
| 12:30 | CAD | CPI Trimmed Y/Y May | 2.90% | 2.80% | 2.90% | |
| 12:30 | CAD | CPI Common Y/Y May | 2.40% | 2.60% | 2.60% | |
| 13:00 | USD | S&P/CS Composite-20 HPI Y/Y Apr | 7.00% | 7.40% | ||
| 13:00 | USD | Housing Price Index M/M Apr | 0.50% | 0.10% | ||
| 14:00 | USD | Consumer Confidence Jun | 100.2 | 102 |
Canada’s CPI accelerates to 2.9% yoy, driven by service sector price hikes
Canada's CPI recorded a notable increase in May, climbing to 2.9% yoy from 2.7% yoy the previous month, surpassing the anticipated rate of 2.6%. This acceleration in headline CPI was primarily fueled by a significant uptick in service prices, which rose by 4.6% yoy in May, following a 4.2% yoy increase in April.
Diving deeper into the components, CPI median—which represents the midpoint of price changes—escalated from 2.6% yoy to 2.8% yoy, again outstripping the forecast of 2.6%. CPI trimmed, another measure that excludes extreme price movements, held steady at 2.9% yoy, also exceeding expectations of 2.8%. In contrast, CPI common, which reflects the common price changes across categories, slowed slightly from 2.6% yoy to 2.4% yoy, falling below the anticipated 2.6%.
On a monthly basis, the CPI rose by 0.6% mom in May, doubling the expected 0.3% mom increase. Similarly, the core CPI also increased by 0.6% mom, well above the forecast of 0.2%. This indicates a broader upward pressure on prices beyond just volatile categories.
Canadian Dollar Eyes Inflation Release
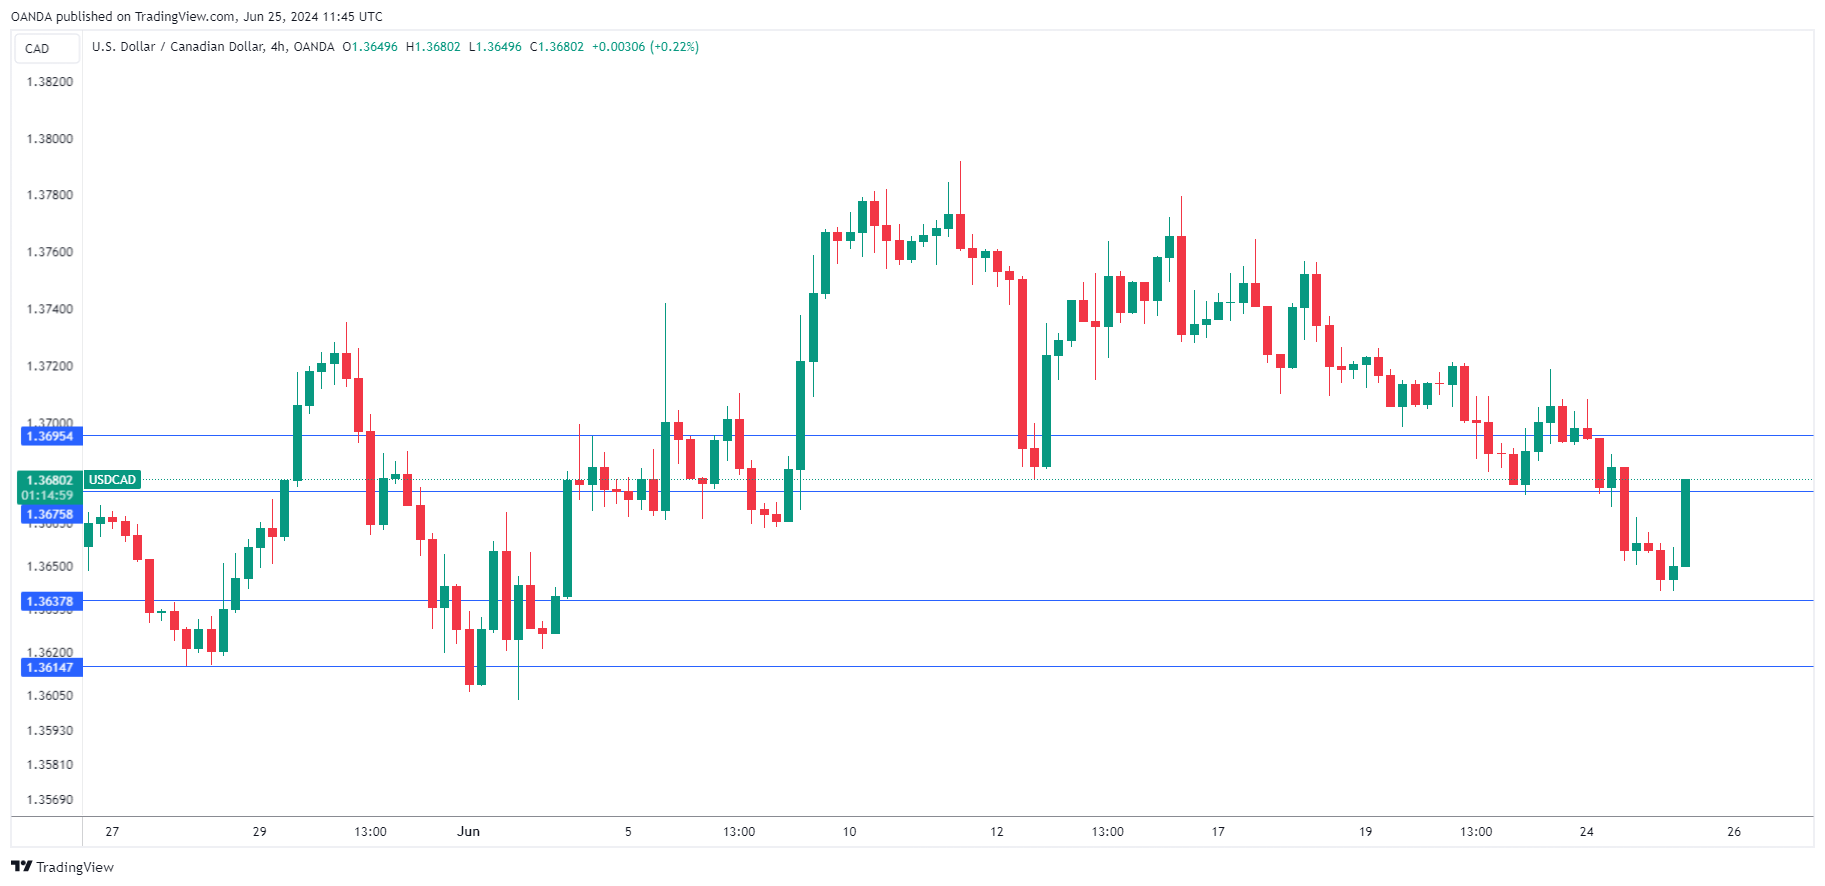
The Canadian dollar is showing limited movement on Tuesday. USD/CAD is trading at 1.3675 in the European session, up 0.12% on the day at the time of writing. We could see some volatility in the North American session, when Canada releases the May CPI report. In the US, today’s highlights are the CB Consumer Confidence index and the Richmond Manufacturing index.
Canada’s inflation rate expected to fall
Canada’s annual inflation rate is projected to dip to 2.6% in May, compared to 2.7% in April, which was the lowest rate since March 2021. Monthly, inflation is expected to ease to 0.3%, down from 0.5% in April.
With inflation on a downward path, the markets are keeping a close eye on the Bank of Canada, which lowered rates earlier in June for the first time since its rate-hike cycle began in March 2022. The cut showed that the central bank was willing to make a major shift in policy and deliver a rate cut even with inflation above the BoC’s 2% target.
The BoC won’t cut for a second time, however, until it is convinced that inflation is on the decline, which makes today’s CPI release a key factor in the BoC’s rate plans. A decline in today’s inflation report could set the stage for a back-to-back rate cut at the July 18th meeting.
The central bank is taking a cautious approach to further rate cuts and has stressed that each rate decision will be taken one at a time, based on the data. Governor Macklem said earlier this week that he doesn’t want to lower rates too quickly and jeopardize the success that the BoC has made in bringing inflation down.
USD/CAD Technical
- USD/CAD is testing resistance at 1.3675. Above, there is resistance at 1.3695
- 1.3637 and 1.3614 are the next support levels
Fed’s Bowman: Inflation to remain elevated, rate hold necessary
Fed Governor Michelle Bowman, in a speech today, said her baseline outlook that US inflation will return to the 2% target, provided federal funds rate remains at its current level of 5.25-5.50% "for some time." She emphasized that Fed is "still not yet at the point" where it would be appropriate to lower the policy rate.
Bowman stressed the need for Fed to "consider a range of possible scenarios" as monetary policy decisions evolve. She remains "willing" to raise interest rates "should progress on inflation stall or even reverse."
Regarding inflation outlook, Bowman noted that since the beginning of 2024, there has been only "modest" progress on inflation. Core CPI has been running at 3.8% through May, which is significantly above the average inflation rate in the second half of last year. She expects inflation to "remain elevated for some time."
Bowman also highlighted several upside risks to inflation. She mentioned that it is unlikely that further supply-side improvements will continue to reduce inflation. Geopolitical developments could also pose additional risks. Furthermore, increased immigration and continued labor market tightness could lead to persistently high core services inflation.
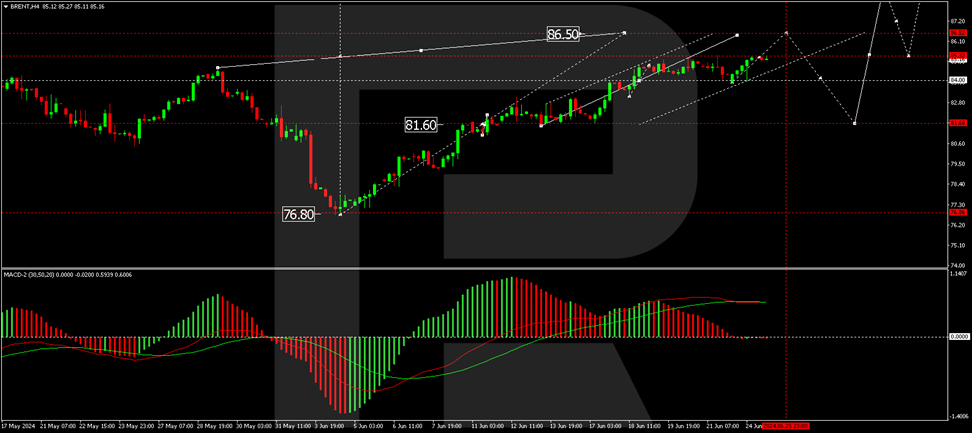
Brent Crude Oil Hits Two-Month High Amid Geopolitical Tensions
Brent crude oil prices surged to $86 per barrel on Tuesday, marking the highest level in two months. This rise was driven by escalating geopolitical risks in Eastern Europe and the Middle East, particularly the ongoing confrontation between Israel and Hamas, which shows no sign of abating despite the involvement of international mediators backed by the US.
On the demand side, uncertainties persist. China, the world's largest oil importer, continues to face significant economic challenges, contributing to the volatile market sentiment. The retail sector in China is under pressure following disappointing results from the mid-year online sales, with Chinese consumers showing reluctance to spend amidst concerns about personal wealth, the ongoing property market crisis, delayed wages, and high youth unemployment. These factors are critical as they jeopardise China’s GDP growth target of around 5% for the year.
Brent technical analysis
On the H4 chart, Brent is currently advancing towards the $86.50 level, which is identified as the immediate target. Once this level is reached, a potential correction to $81.60 may occur, testing from above. Subsequently, the market might initiate a new growth wave aiming for $89.00, with potential to extend up to $94.00. This bullish outlook is supported by the MACD indicator, whose signal line is above zero and climbing steeply.
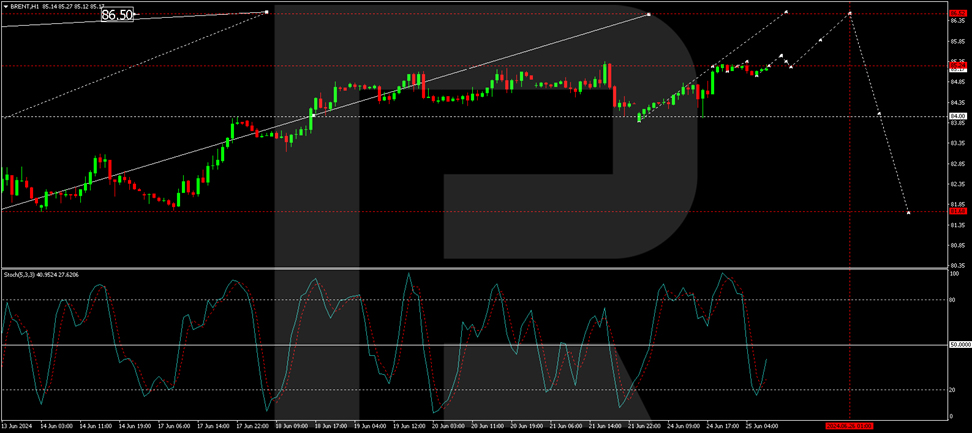
On the H1 chart, Brent found support at $84.00 and is now progressing through the latter stages of the current growth wave. The market has already achieved the $85.24 mark. We anticipate the formation of a narrow consolidation range around this level, with a breakout above potentially leading to further growth towards $86.50. This scenario is technically reinforced by the Stochastic oscillator, with its signal line poised above 20 and gearing up for an ascent to 80.
Market outlook
Investors should closely monitor developments in geopolitical hotspots and economic indicators from major economies like China and the US, as these could significantly sway oil prices. The current trajectory suggests bullish momentum for Brent crude, but the volatile nature of geopolitical events and economic data releases warrants cautious optimism.
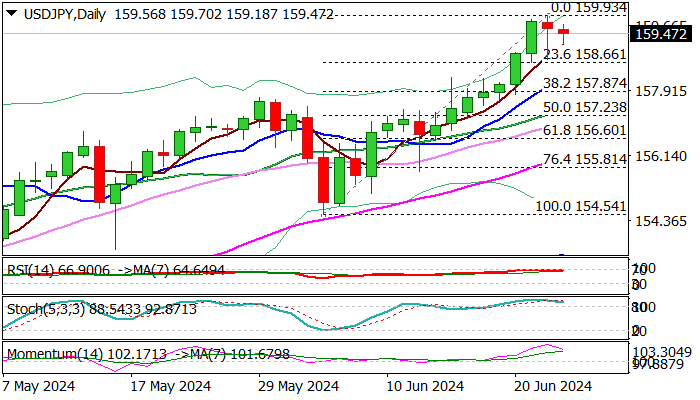
USD/JPY: Bulls Gesitate on Approach to 160.00 Barrier, Potential Intervention Trigger
USDJPY edges lower after hitting levels just ticks away from 160 barrier, which many see as a trigger for intervention, as Japan’s authorities intervened at the end of April when the pair cracked 160 barrier.
Monday’s trading was closed in red for the first time in eight days, although long tail of daily candle suggests that bids are still very strong and markets may attack 160 level again, despite intervention threats.
Dips were so far shallow and contained by rising 5 DMA, keeping lower triggers at 158.25/157.87 (rising 10DMA / Fibo 38.2% of 154.54/159.93 upleg) out of reach for now.
Fading bullish momentum and overbought conditions on daily chart add to correction signals.
Any pullback above these supports should be considered as a healthy correction and keep larger bulls intact.
On the other hand, firm break here would point to deeper correction.
Res: 159.70; 160.00; 160.19; 160.87.
Sup: 158.66; 158.25; 157.87; 157.38.
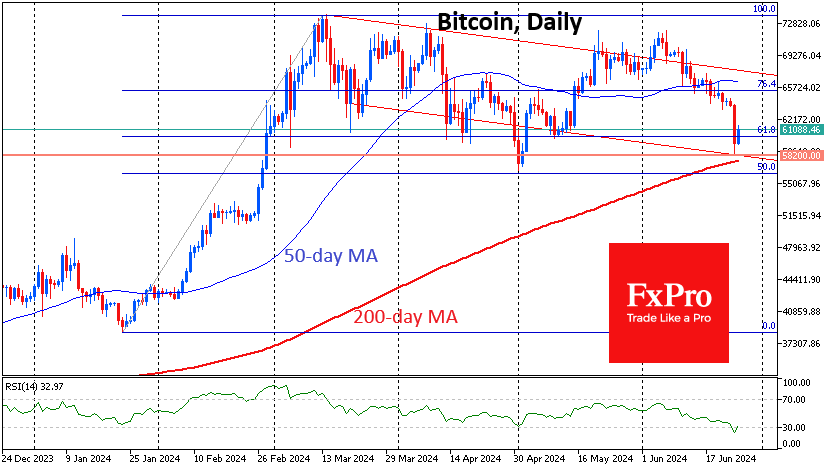
Bitcoin’s Attractive Drop
Market Picture
The cryptocurrency market was falling to a total capitalisation of $2.2 trillion at the end of the day on Monday but managed to add over 2% to the lows, recovering to $2.25 trillion, down 0.5% from the day before.
The technical picture in Bitcoin is almost perfect. The low price of $58.2K coincided with the lower boundary of the descending range, was as close to the 200-day moving average as possible, and almost duplicated the impulsive lows of early May. On the daily charts on Monday, BTC closed in the oversold RSI area, and today, it is already trying to get out of it. All this looks like a tempting signal to buy this dip. However, it may well turn out to be a bull trap, although we give less priority to such a scenario.
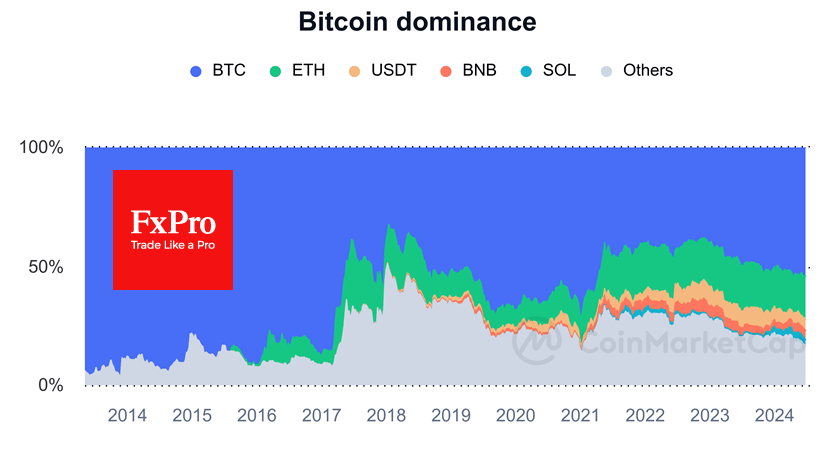
Bitcoin’s share of the total crypto market capitalisation is near 54%. Since March, there has been an acceleration in the decline of the share of “other” coins, as buyers’ interest has focused on the leading coins. Such dynamics are typical signs of the first half of the 4-year cycle in Bitcoin, and sustained interest in altcoins may not come until next year.
News background
Bitcoin fell below $60,000 amid news of the Mt.Gox payout. The trustee of the bankrupt 2014 exchange, Mt.Gox, announced plans to begin paying out compensation in Bitcoin, Bitcoin Cash and cash in early July. Mt.Gox is expected to distribute more than $9 billion in assets by 31 October 2024.
According to CoinShares, investments in crypto funds fell by $584 million last week after an outflow of $600 million a week earlier; the two-week decline came after five weeks of inflows. Bitcoin investments were down $630 million; Ethereum was down $58 million.
According to Deribit, the options market has been betting on Ethereum, which will rise to $4,000 by September.
Block CEO Jack Dorsey said he sees Bitcoin not just as a currency but as the dominant global reserve asset that could topple the U.S. dollar.
Cryptocurrency and NFT holders in The Open Network (TON) ecosystem have faced massive phishing attacks to steal assets. Malicious links and malicious bots are being spread in Telegram groups, particularly under the guise of airdrop announcements.