

Sample Category Title
Australia’s Westpac consumer sentiment ticks up but still deeply pessimistic
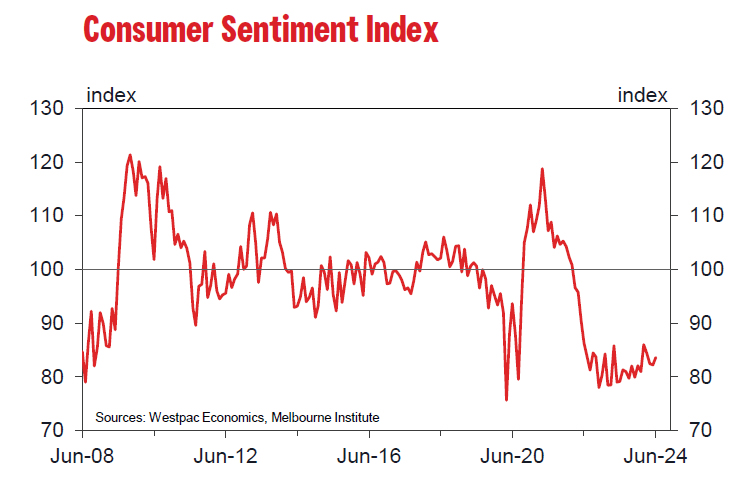
Australia's Westpac Consumer Sentiment rose 1.7% mom to 83.6 in June. However, the index remains deeply pessimistic, well below neutral level of 100. Although assessments of personal finances and buyer sentiment have become less negative, concerns about inflation, interest rates, and economic growth continue to weigh heavily on consumers.
The sub-index tracking the 'economic outlook for the next 12 months' fell -5.7% mom to 78.5, marking its lowest level since last October. In contrast, the 'economic outlook for the next 5 years' sub-index saw a slight improvement, rising 2.1% mom to 94.1.
Regarding RBA monetary policy, Westpac noted that the upcoming Q2 CPI data, due on July 31, will be crucial. Westpac expects the update to confirm that weak demand is still exerting disinflationary pressure. This should provide RBA with sufficient confidence that upside risks are not materializing, reducing the likelihood of a rate hike.
BoC’s Macklem monitoring wage growth for further moderation
BoC Governor Tiff Macklem emphasized overnight that the central bank doesn't want monetary to be "more restrictive than it has to be,". Yet he also cautioned against lowering borrowing costs "too quickly" as it could undermine progress on controlling inflation.
Macklem pointed out that although wage growth remains above pre-pandemic levels, there are signs that the labor market is rebalancing and inflation is moderating, which could reduce compensation pressures.
"Wages tend to lag adjustments in employment," he explained, adding, "Going forward, we will be looking for wage growth to moderate further."
Bitcoin Plummets Below $60K: Analyzing the Sudden Crash
Key Highlights
- Bitcoin price started another decline below the $60,000 support zone.
- BTC is trading below a major bearish trend line with resistance at $63,800 on the 4-hour chart.
- EUR/USD remained stable and attempted to recover above 1.0720.
- Oil prices are eyeing more upsides above the $82.50 resistance.
Bitcoin Price Technical Analysis
Bitcoin price failed to clear the $66,500 resistance zone and started a fresh decline. BTC/USD traded below many supports such as $65,500 and $65,000.
Looking at the 4-hour chart, the price settled well below the $65,000 zone, the 100 simple moving average (red, 4 hours), and the 200 simple moving average (green, 4 hours). The bears even dragged the price below the $62,000 support zone.
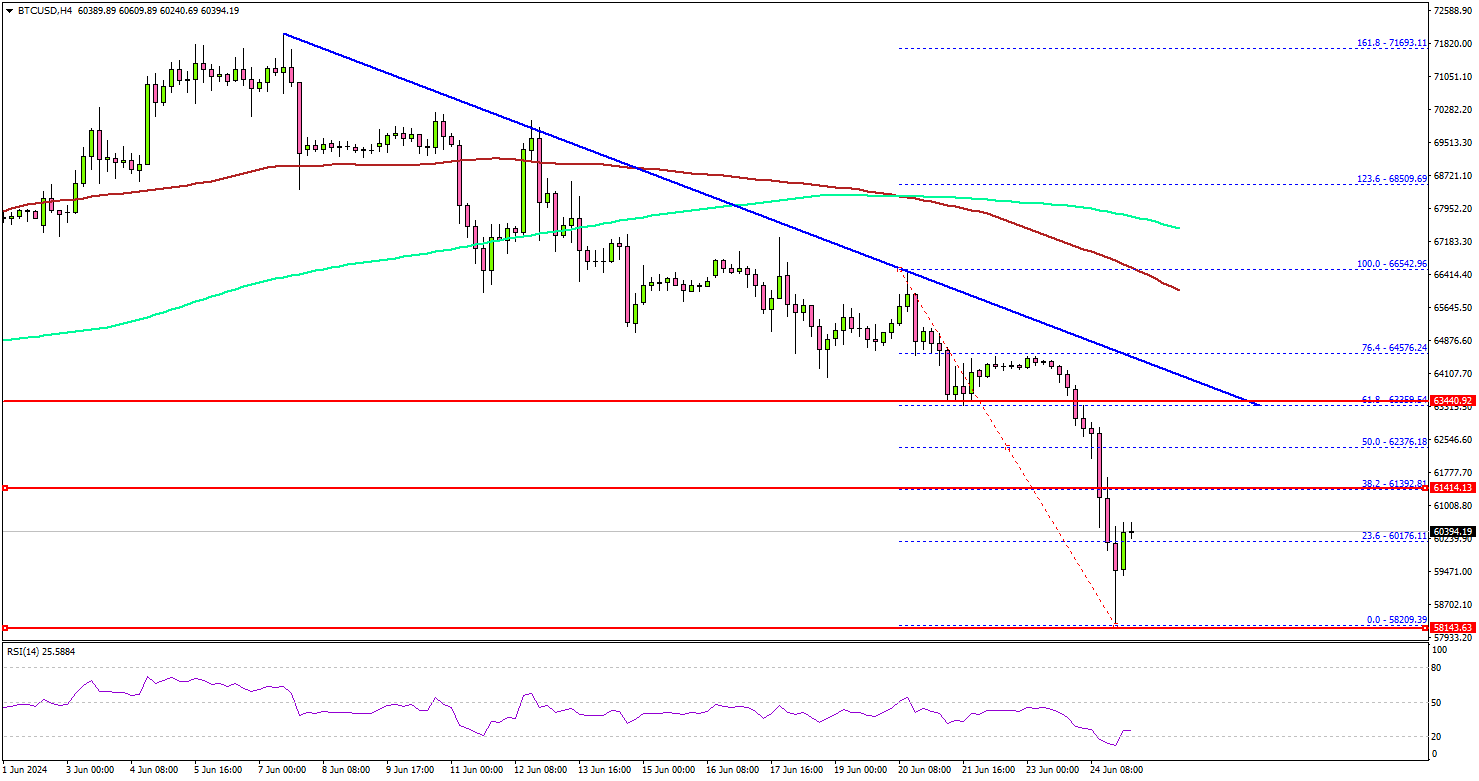
They seem to be aiming for a move toward the $57,500 support zone. If there is a recovery wave, the price could face resistance near the $61,400 level.
The first key resistance is near the $63,500 zone. There is also a major bearish trend line forming with resistance at $63,800 on the 4-hour chart. The trend line is close to the 61.8% Fib retracement level of the downward move from the $66,542 swing high to the $58,209 low.
The next resistance is near $66,500 and the 100 simple moving average (red, 4 hours). A successful close above $66,500 might start another steady increase. In the stated case, the price may perhaps rise toward the $68,000 level.
Conversely, Bitcoin might extend losses. Immediate support is near the $60,000 level. The main support sits at $59,200. Any more losses might send the price toward the $57,500 support zone.
Today’s Economic Releases
- Fed's Bowman speech.
Fed’s Daly: We have two goals, one tool, and a lot of uncertainty
San Francisco Fed President Mary Daly, in a speech last night, discussed the ongoing challenges with inflation and the labor market. Daly remarked that the inconsistent inflation data this year has not built confidence. While recent figures are promising, it remains uncertain if the path to sustainable price stability is secure.
While, the labor market has been slow to adjust, with only a slight increase in the unemployment rate, Daly warned that "we are getting nearer to a point where that benign outcome could be less likely. "
Emphasizing Fed's situation with "two goals, one tool, and a lot of uncertainty," and Daly stressed that "policy has to be conditional" and policymakers have to "think in scenarios."
Daly outlined the possible policy responses to different economic scenarios. "If inflation turns out to fall more slowly than projected, then holding the federal funds rate higher for longer would be appropriate."
Conversely, "If inflation falls rapidly, or the labor market softens more than expected, then lowering the policy rate would be necessary."
Daly also addressed a middle-ground scenario, saying, "If we continue to see gradual declines in inflation and a slow rebalancing in the labor market, then we can normalize policy over time, as many expect."
GBP: A Correction May Be Imminent
During Monday's session, the GBPJPY pair continued its uptrend, reaching a high of around 202.50, its highest level since 2007. Despite earlier attempts by sellers to push the pair down to 106.14, buyers regained control and drove the pair to new cycle highs. The Daily Relative Strength Index (RSI) at 68 suggests ongoing bullish momentum, though nearing overbought territory indicates a possible correction. The Daily Moving Average Convergence Divergence (MACD) shows continued bullish momentum with rising green bars, though it might be peaking. Traders should note that while the pair's performance is strong, supported by its position above key SMAs, indicators point to potential corrections, with support around 202.00 and resistance near 203.00.
GBPAUD – H4 Timeframe
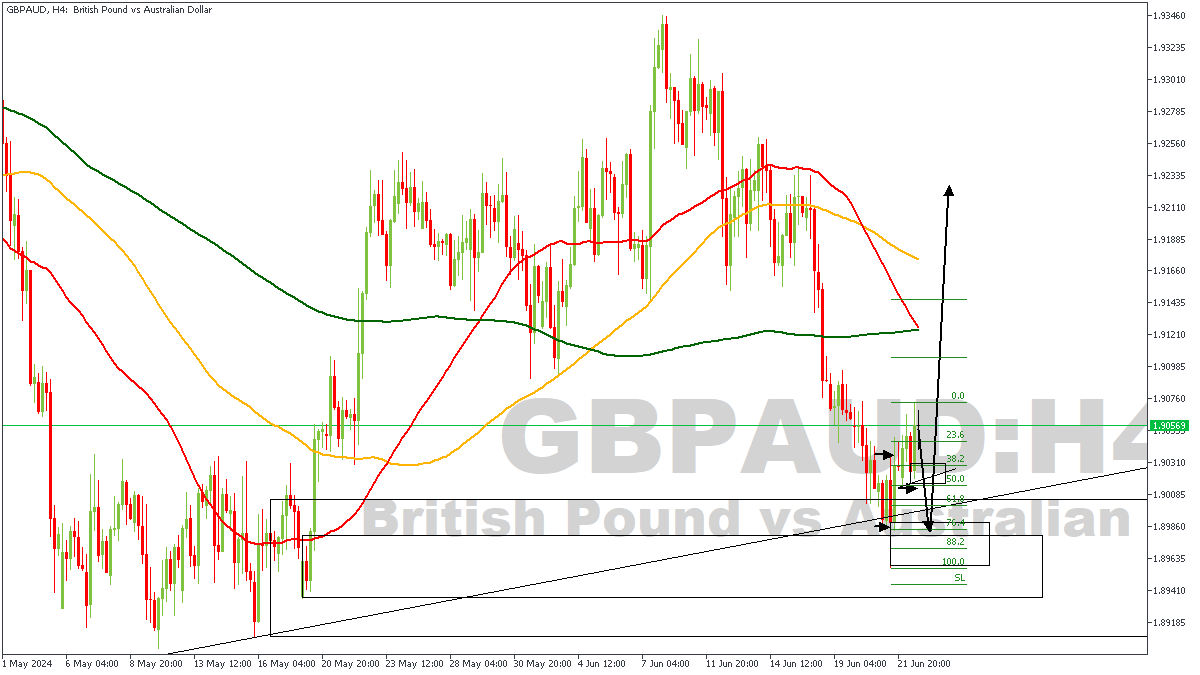
The far-left side of the attached chart shows evidently that a bullish break of structure occurred, pushing prices all the way to the high at 1.93440 before beginning a corrective move. However, at the moment, I expect price to bounce off the drop-base-rally demand zone I have highlighted on the chart, since the price action has even created a QMR pattern right in the middle of the demand zone. In the case of GBPAUD, my argument is bullish.
Analyst’s Expectations:
- Direction: Bullish
- Target: 1.91006
- Invalidation: 1.89556
EURGBP – H4 Timeframe
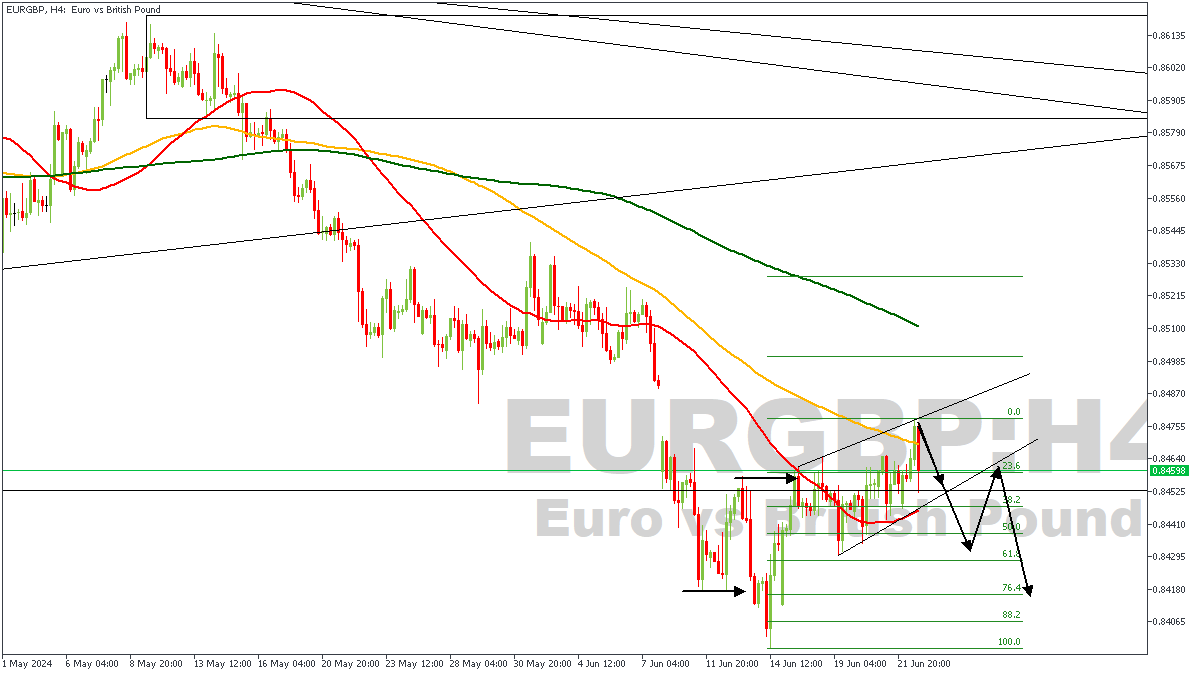
EURGBP on the 4-timeframe chart shows an initial sweep of the sell-side liquidity from the highlighted arrowed line, and the break of structure that followed was also highlighted. According to LIT techniques (Liquidity Inducement Theorem), we ought to see price retrace low enough to sweep liquidity once again from the induced low. So, once price breaks below the trendline support of the ascending channel, my sentiment for a short entry would be validated.
Analyst’s Expectations:
- Direction: Bearish
- Target: 0.84279
- Invalidation: 0.84800
GBPCAD – H4 Timeframe
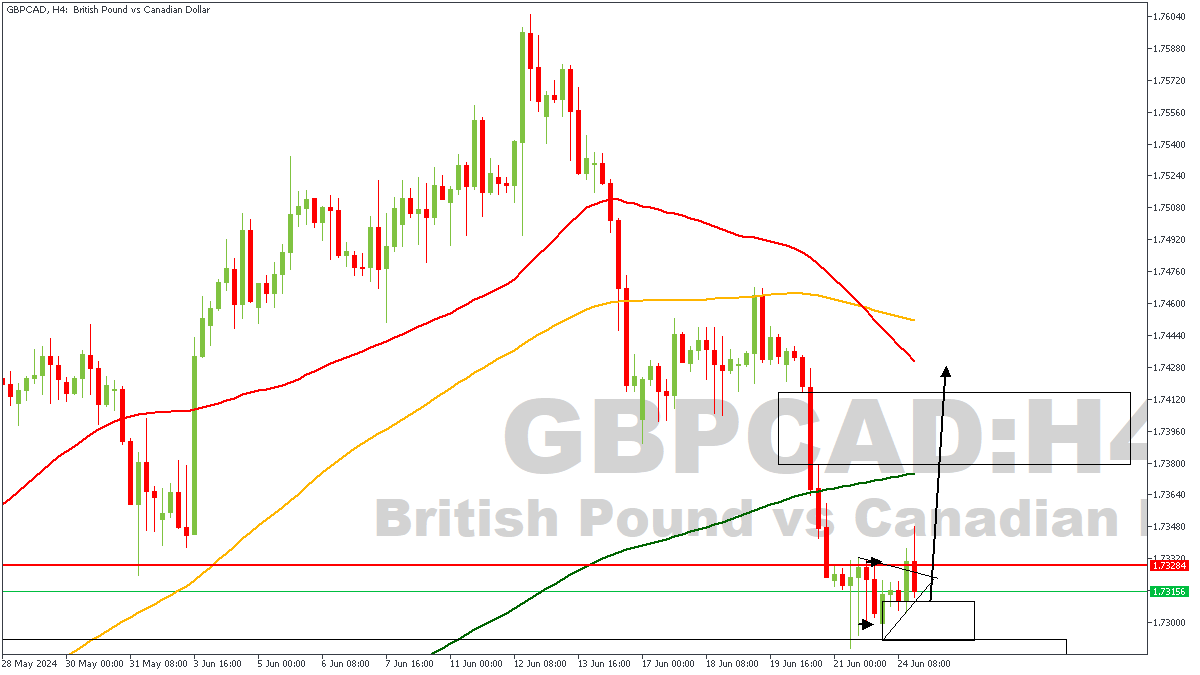
Within the GBPCAD daily timeframe pivot zone, we can see the attached chart showing a bullish breakout of a triangle pattern on the 4-hour timeframe, right within the demand zone. The implication of this is simply that we should begin to see increased bullish participation in the market since the bullish breakout often signifies that buyers are now in control of the markets.
Analyst’s Expectations:
- Direction: Bullish
- Target: 1.73685
- Invalidation: 1.72873
ICYMI: Monday Market Breakdown
The US Dollar (USD) declined during Monday's European session as political concerns in Europe receded, shifting focus to France's upcoming election. This reduced safe-haven demand for the USD. Meanwhile, the Japanese Yen (JPY) continued to weaken against the USD, nearing the critical 160.00 level, which previously triggered intervention by Japan's Ministry of Finance. Economically, lighter data is expected this week, including the Dallas Fed Manufacturing Business Index for June. In case you missed our weekly market review on the YouTube channel, here are a few trade ideas.
AUDUSD – H1 Timeframe
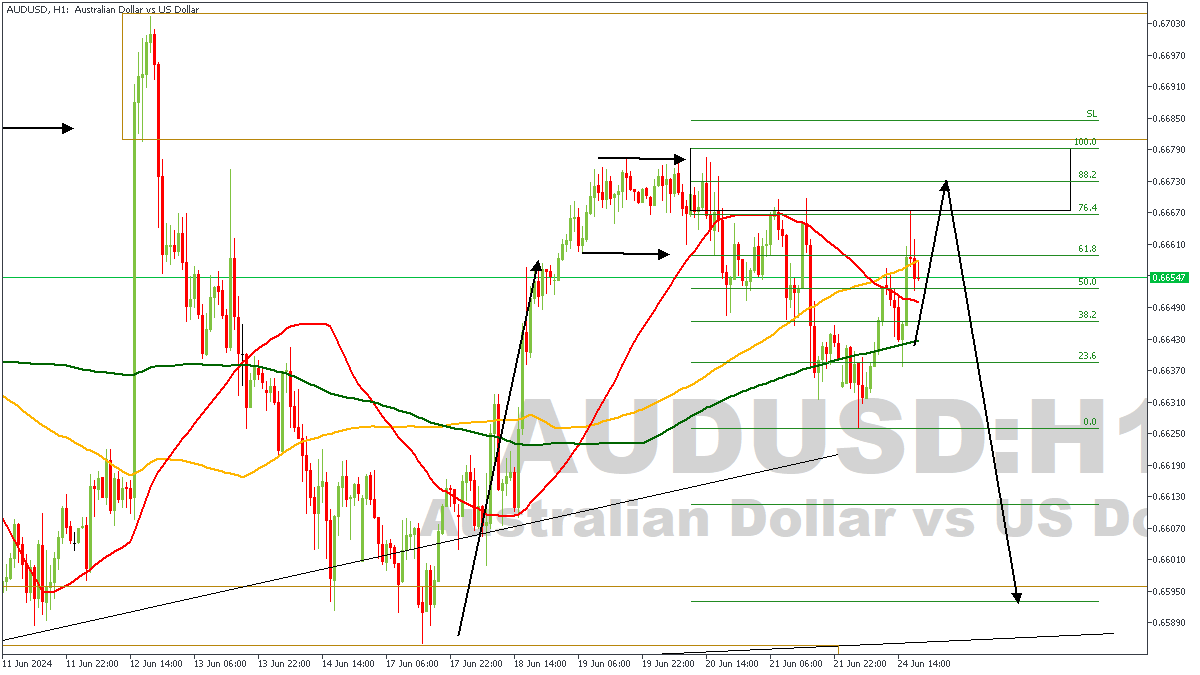
The 1-hour timeframe of AUDUSD as seen on the attached chart is currently under pressure from an area of supply, with increased confluence as a result of the sweep of the previous high, followed by the bearish break of structure. The supply zone and the 88% of the Fibonacci retracement tool helps solidify my sentiment as bearish, with an initial target at the 23% level.
Analyst’s Expectations:
- Direction: Bearish
- Target: 0.66390
- Invalidation: 0.66810
EURUSD – H4 Timeframe
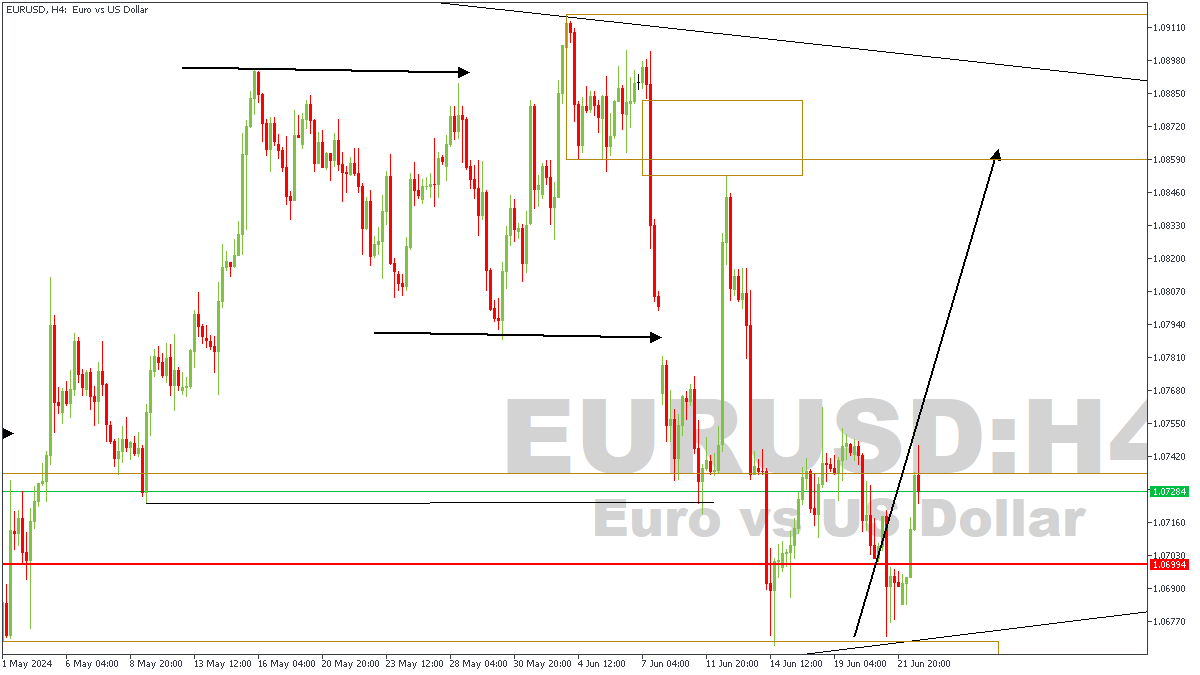
EURUSD as seen on the 4-hour chart recently had a massive reaction off the confluence of the trendline support, and the drop-base-rally demand zone. As indicated by the slanted arrowed line, I am expecting price to keep pushing higher because of the Fair Value Gap price left behind as a result of the very volatile break below the previous low, and the fact that price swept liquidity from an induced low right before tapping into the area of demand.
Analyst’s Expectations:
- Direction: Bullish
- Target: 1.08182
- Invalidation: 1.06481
GBPUSD – H4 Timeframe
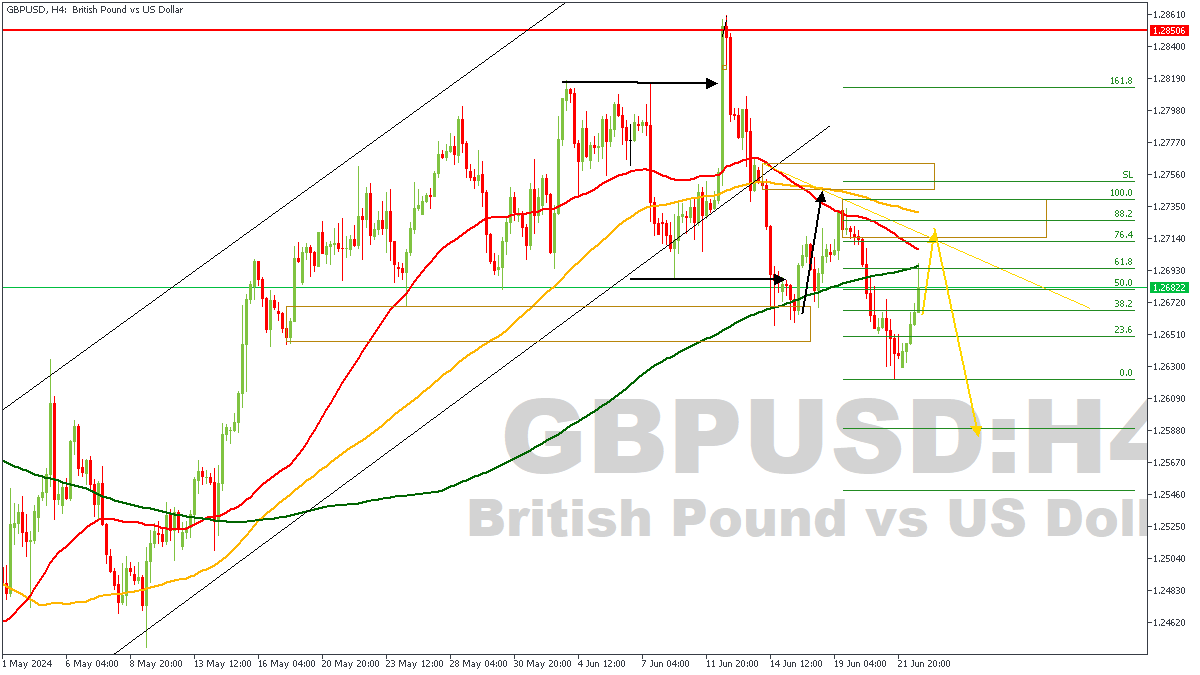
The price action on the 4-hour timeframe of GBPUSD recently broke below the support trendline of an ascending channel, implying the onset of a bearish trend. On that basis, I have plotted a resistance trendline that overlaps a supply zone and is supported by the 50 and 100 moving averages as confluence for the bearish sentiment. The 88% of the Fibonacci is another factor worth considering in favor of the bearish sentiment.
Analyst’s Expectations:
- Direction: Bearish
- Target: 1.26489
- Invalidation: 1.27439
EURJPY Wave Analysis
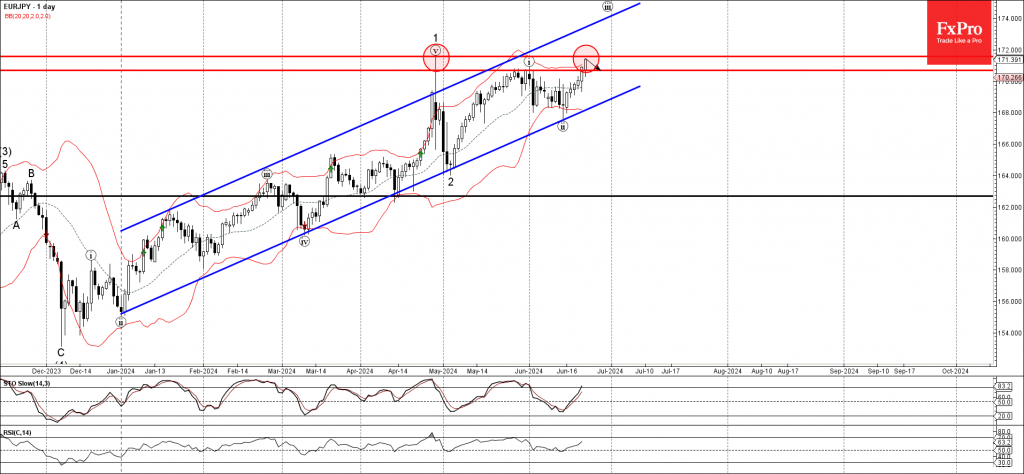
- EURJPY approaching strong resistance level 171.55
- Likely to correct down from 171.55
EURJPY currency pair approaching the strong resistance level 171.55 (which stopped the previous sharp upward impulse wave 1 at the end of April, as you can see below).
The resistance level 171.55 is further strengthened by the upper daily Bollinger Band.
Given the strength of the resistance level 171.55 and the overbought reading on the daily Stochastic indicator, EURJPY currency pair can be expected to reverse down from the resistance level 171.55 – when it reaches it.
USD Weekly Analysis: USDX and EURUSD
Fundamental Analysis
This week we will have a few high-impact data releases from the economic calendar. Still, the focus will be on several speeches by Fed officials, with five out of eight appearances scheduled featuring hawkish members. This will drive a strong pushback against market expectations of two rate cuts this year. This hawkish stance is expected to bolster the strength of the dollar, adding momentum to its already strong performance in the first half of the year.
Additionally, the dollar could benefit from European political risks ahead of the French elections; Le Pen's advantage over Macron and weak June PMI data in Europe increase investor anxiety.
This week we will have the following USD-related releases from the economic calendar:
- CB Consumer Confidence (June). Tuesday 25
- New Home Sales (May). Wednesday 26
- Durable Goods Orders (monthly) (May). Thursday 27
- Final Q1 GDP. Thursday 27
- Unemployment Claims. Thursday 27
- PCE Price Index (May). Friday 28.
PCE data is expected to be lower than last month, so to cause a more aggressive downward reaction, a significantly lower PCE is needed to shift the market trend of speculating on two rate cuts this year and signalling an imminent cut for September.
Technical Analysis
Dollar Index (DXY), H4
- Supply Zones (Sells): 105.85 and 106.21
- Demand Zones (Buys): 105.96, 105.42, 104.88
The dollar's bearish correction came to an end after reaching a new higher high last week at 105.52. The opening correction towards the last uncovered point of control (POC) at 105.06, which is a demand zone for buying, will likely be defended by buyers. This defense could trigger a rally towards the opening at 105.44 and the Asian supply zone. We will then evaluate the strength of the ascent and price behaviour in that zone, as the next price action depends on it.
With a stronger rally breaking the Asian supply zone indicated at the opening, we will see an impulse seeking to break the May 9 resistance, the uncovered POC at 106.04, and only after its breakout consider the weekly target at the May resistance of 106.33.
On the other hand, a decisive break of the POC at 105.06 may encourage a retracement towards the area near the 104.69 support, observing a possible bullish rebound towards the opening sell zone at 105.43, and after its breakout extend buys towards 106.04.
EURUSD, H3
- Supply Zones (Sells): 1.0745 / 1.0806
- Demand Zones (Buys): 1.0691
After reaching the average daily range high (ADR High) and a weekly supply zone, a retracement towards the Asian POC at 1.0691 is expected, from where new buys will be considered. The extension of the bullish correction will be observed with quotes decisively breaking the supply zone between 1.0750 and 1.0633, confirming the intraday bullish reversal with a weekly target at 1.08.
However, failure to break above 1.0750 and a quick descent below 1.0691 will indicate renewed bearish strength of the pair towards May support at 1.0649 and 1.0624 more extended.
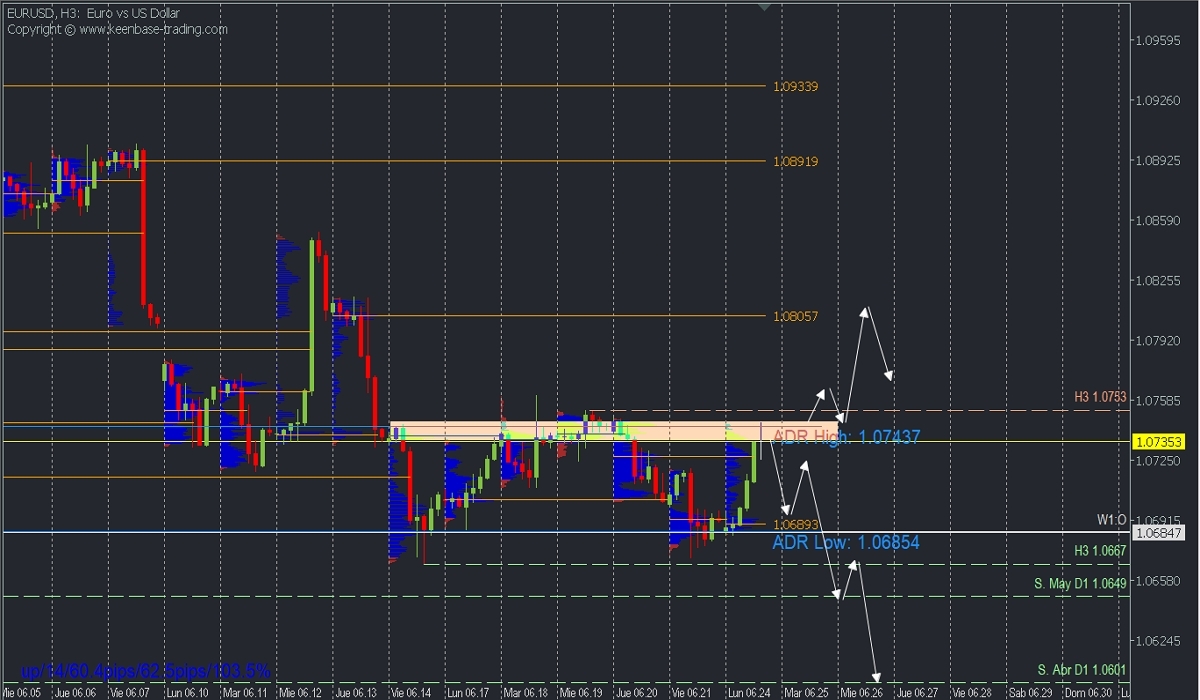
*Uncovered POC: POC = Point of Control: It is the level or zone where the highest concentration of volume occurred. If previously, a bearish movement originated from it, it is considered a sell zone and forms a resistance zone. Conversely, if previously, an upward impulse originated from it, it is considered a buy zone, usually located at lows, forming support zones.
Fed’s Goolsbee optimistic on inflation improvement
In a CNBC interview today, Chicago Fed President Austan Goolsbee expressed cautious optimism about inflation in the US, describing himself as "closet optimistic" that there will be improvement on the inflation front.
Goolsbee refrained from commenting on the timing of rate cuts but emphasized the need for policymakers to consider whether the current high level of interest rates is appropriate for an economy showing signs of cooling beyond just inflation metrics.
He noted that factors such as rising unemployment claims, slightly increasing unemployment rate, and other indicators returning to pre-pandemic levels should prompt Fed to think more about balancing its dual mandates of controlling inflation and maintaining employment.