
Sample Category Title
Instrument of the Week (June 24—28): GBPAUD Outlook
The GBPAUD pair represents the exchange rate between the British Pound and the Australian Dollar, serving as a crucial metric of economic interaction between the United Kingdom and Australia. Monetary policy changes, economic reports, and political developments heavily influence the GBP. In particular, it’s sensitive to European changes, given the UK’s significant economic ties to the region. On the other hand, the AUD is impacted by Australia’s commodity-based economy, with prices of natural resources like iron ore and coal playing a critical role and shifts in economic stability within the Asia-Pacific region. This makes the GBPAUD pair extremely reactive to changes in economic indicators and policy adjustments from both countries.
Reserve Bank of Australia Assistant Governor Kent Speaks, June 26, 1:35 (GMT+2)
If Assistant Governor Kent delivers a more optimistic economic outlook than anticipated, suggesting robust growth and potential tightening monetary policy, the Australian Dollar will likely strengthen. This appreciation of the AUD would generally lead to a decrease in the GBPAUD exchange rate. Conversely, if Kent’s speech delivers a less favorable view of the economy, possibly hinting at prolonged monetary easing due to slower recovery or economic setbacks, it would likely weaken the AUD.
UK Gross Domestic Product (GDP) QoQ, June 28, 08:00 (GMT+2)
Should the upcoming UK GDP data reveal growth exceeding the forecast of 0.6%, it indicates a more robust economic recovery than analysts predicted. Such an outcome would bolster the GBP by demonstrating the resilience and strength of the UK economy, leading to a potential increase in the GBPAUD exchange rate as investor confidence in the GBP grows. Alternatively, if the GDP figures are disappointing and show weaker growth than forecasted, it would raise concerns about the pace of economic recovery in the UK.
In the Daily timeframe, GBPAUD has formed a symmetrical triangle pattern, and the price has reached the lower trend line. The moving averages indicate bearish sentiment, but the %R shows extremely oversold, which creates two possible scenarios.
- If the bears push the price below 1.9000, breaking the lower trend line, GBPAUD will fly down to 1.8650;
- A rebound from the support will send the price to the upper trend resistance at 1.9340.

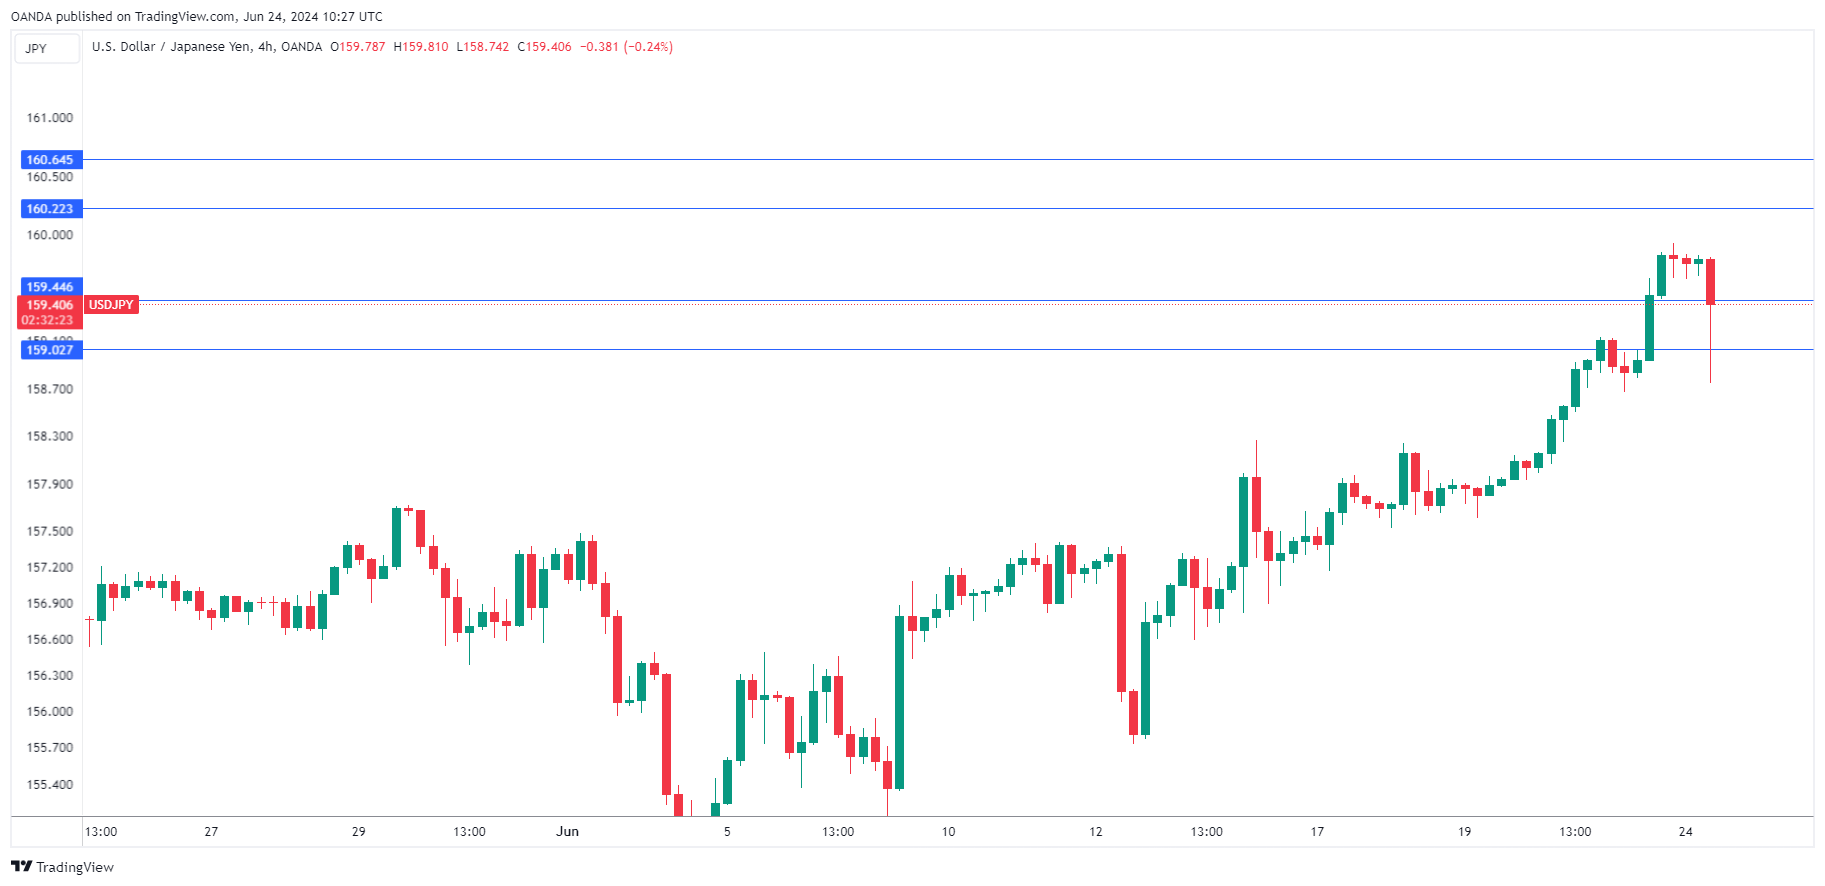
USD/JPY: Verbal Intervention Intensified But Real Intervention May Have to Wait
- The USD/JPY has traded higher in the past 7 sessions and printed an intraday high of 159.85 last Friday, 21 June which coincided with its 34-year high of 160.23 printed on 26 April.
- Last week’s persistent JPY weakness prompted Japan’s Ministry of Finance Vice Minister-in-charge of the FX market to issue a “firmer” verbal intervention.
- The current upmove of USD/JPY is more orderly rather than excessive which may not trigger an actual FX intervention from MoF.
- Watch the key medium-term support of 156.50 on the USD/JPY.
- The key first medium-term resistance zone of USD/JPY is at 161.10/162.40 also coincides with the potential “excessive threshold” levels of 161.85/95.
The USD/JPY and other G-10 Japanese yen crosses have staged only a minor decline and managed to hold above their respective 50-day moving averages as support zones on in early June before being propelled higher.
G-10 yen crosses traded higher since mid-June

Fig 1: 1-month of rolling performances of G-10 JPY crosses as of 24 Jun 2024 (Source: TradingView, click to enlarge chart)
Since 13 June, the USD/JPY has had seven consecutive sessions of higher daily closes, and it continued its march northwards to print an intraday high of 159.85 last Friday, 21 June just a whisker away from its 34-year high of 160.23 hit on 29 April that triggered a record amount of US$62.2 billion in FX intervention by Bank of Japan (BoJ) to prop up the yen for the period between 26 April to 29 May.
Last week, the drop in the JPY was accompanied by a backdrop of lackluster key Japan economic data; a continuation of demand-driven core-core inflation (excluding fresh food and energy) deceleration to 2.1% y/y in May, its lowest pace of increase since September 2022 from 2.4% y/y in April. Also, services activities, one of the key sources of growth engine in Japan for the past two years have contracted for the first time since August 2022 where the preliminary Jibun Bank Japan Services PMI slipped to 49.8 in June from 53.8 in May.
These softer prints of Japanese economic data may prompt BoJ to delay its next interest rate hike to September coupled with the near-term uptick in geopolitical risk premium coming out from the Eurozone due to the looming first round of French legislative elections scheduled this Sunday, 30 June that support potential bids on the US dollar due to safe-haven demand.
“Firmer” verbal intervention from the Ministry of Finance
Last week’s persistent weakness inflicted on the JPY ahead of two related risk events this week; the first round of the French legislative elections outcome over the weekend as well as this Friday, 28 June release of US PCE inflation data for May has prompted, Japan top currency official, MoF Vice Finance Minister Kanda to issue a firmly worded verbal intervention in today’s early Asian session that stated Japan can intervene in the FX market, 24 hours a day if needed in the event of excessive moves based on speculations.
So far, there are no significant movements in the USD/JPY as it continued to trade in a tight intraday range of 30 pips, closer to last Friday, 21 June high of 159.85; quoted at 159.70 at this time of the writing.
The recent movements of the USD/JPY weakness seem more “orderly” than “excessive”
Earlier this year, a public speech made by MoF Vice Finance Minister Kanda implied an excessive movement in the USD/JPY was either a 10-yen big figure drop over a month or a 4% drop in about two weeks.
Hence, the potential “excessive” threshold levels to watch are likely at 161.85 (using the month of May’s USD/JPY intraday low of 151.85), and 161.95 (based on a 2-week rolling +4% measurement on the USD/JPY from its intra-week low of 155.72 for the week of 10 June).
Daily RSI momentum has not reached an extreme overbought level

Fig 2: USD/JPY medium-term & major trends as of 24 Jun 2024 (Source: TradingView, click to enlarge chart)
In the lens of technical analysis, the current upmove of the USD/JPYUY from its 4 June low of 154.55 has not led it to an extreme overbought level as highlighted by the daily RSI momentum indicator.
The daily RSI is now hovering at around the 68 level which is still below the key extreme overbought zone of 80.50/88.10 hit previously where it coincided with the prior FX Interventions to strengthen the yen on 21 October 2022 and most recently, the suspected one on 26 April.
Overall, the major and medium-term uptrend phases remain intact with key medium-term pivotal support at 156.50 (also the rising 50-day moving average). A clearance above 160.30 sees the next medium-term resistance zone to come in at 161.10/162.40 also coincides with the potential “excessive threshold” levels of 161.85/95.
On the other hand, a break below 156.50 damages the medium-term uptrend for a potentially steeper corrective decline move within its major uptrend phase to expose the next support at 154.30, and below it may see the major support zone of 151.95/150.70 (also the 200-day moving average).
Yen Steadies After Dreadful Week
The Japanese yen has posted gains on Monday. In the European session, USD/JPY is trading at 159.26, down 0.10%. The yen hasn’t had a winning daily session since June 19th and declined 1.5% last week. On the data front, Japan releases the Services Producer Price Index. There are no economic releases in the US but FOMC members Waller and Daly will make public statements.
BoJ hesitant to raise rates
The Bank of Japan released its summary of opinion from the June meeting on Monday. The market responded with a shrug, as the yen showed little reaction. One member called for a rate hike “without too much delay” but other members were more cautious about raising rates. The BoJ stated at its meeting earlier this month that it would provide details of tapering its massive stimulus at the July meeting and is yet to commit to higher rates.
With the Federal Reserve grappling with sticky inflation and signaling only one rate cut this year, the US/Japan rate differential is unlikely to narrow. That will make it an uphill battle for the yen to gain some ground on the US dollar.
The yen is trading close to the psychological 160 level and is close to 34-year lows. On Monday, Japan’s top currency official, Masota Kanda, delivered some verbal intervention, stating that he would take “appropriate action” in the event of “excessive moves based on speculation”. The threat of intervention by Tokyo could be preventing that yen from breaking out above 160, a level which has held since late April.
If the BoJ fails to deliver some major changes in monetary policy, it appears that the yen will continue to weaken, which will raise the possibility of currency intervention.
USD/JPY Technical
- USD/JPY pushed below support levels at 159.44 and 159.02 earlier. Below, there is support at 158.24
- There is resistance at 160.22 and 160.64
American Apathy Supports Oil
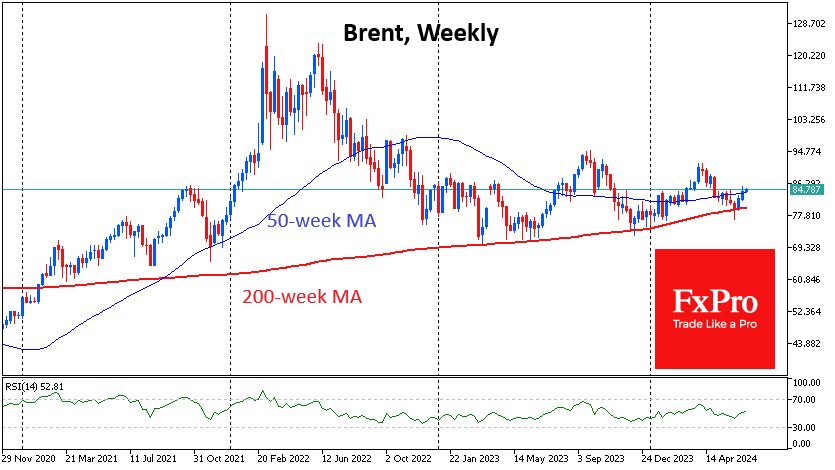
The price of crude Oil rose steadily in the previous fortnight and is starting the new week with a positive trend. This rise emphasises the importance of the 200-week moving average, below which the price has not fallen for a long time for more than three years.
The OPEC+ meeting in early June rattled the bulls’ nerves, briefly pushing the price below this line, but this once again attracted buyers. The 200-week average acts as a long-term trend indicator, marking the average price level over nearly four years—about half of the traditional business cycle. Regular touches of this line raise the question that the world economy is walking on the edge of recession but avoiding it for now.
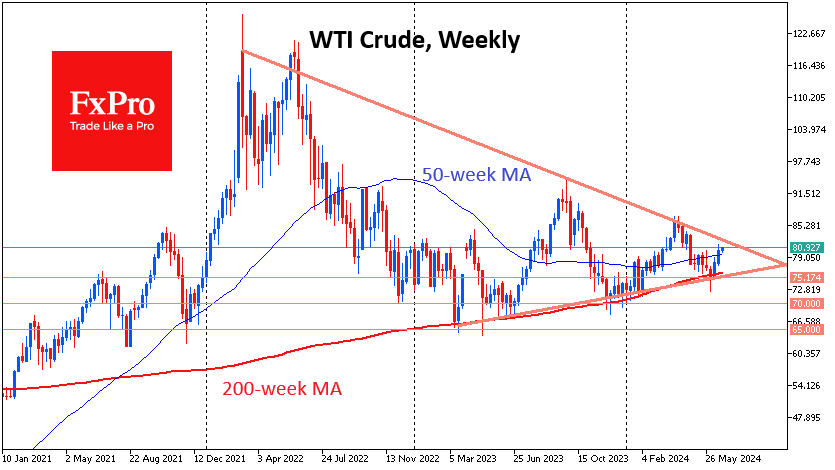
However, this curve is pointing upwards, having risen 17% since the start of 2023 to $76.2 in WTI and $80 in Brent. These are the highest values since 2016, but far from the $100s that were in Oil’s previous bull cycle, which ended in 2014.
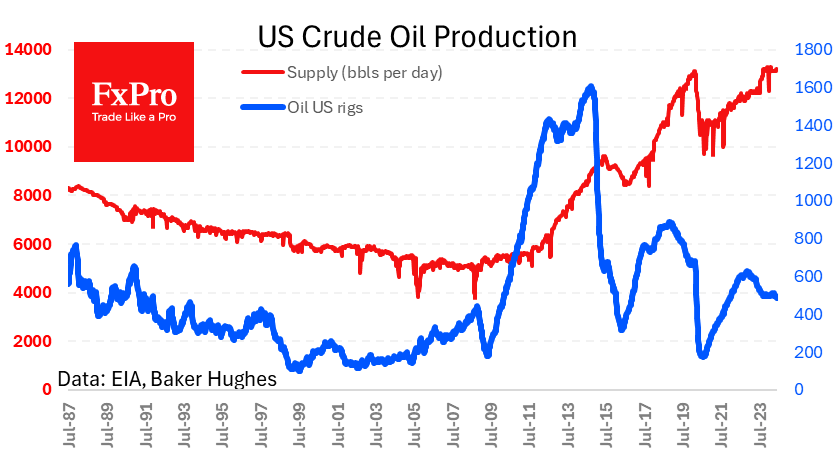
The apathy of US oil producers has characterised this bull cycle. We continue to get data on falling drilling activity from Baker Hughes and stagnant production. According to the latest data, 485 oil rigs were active last week and 588 total (minus 3 and 2 for the week, respectively). These are the lowest values in two and a half years.
A separate report from the Department of Energy shows continued smooth replenishment of the strategic fuel reserve (the highest in 14 months). Commercial stocks are almost in line with last year’s levels after rising since the start of the year.
Production levels have returned to 13.2 million BPD in the previous two weeks after 13 weeks of declines to 13.1 million.
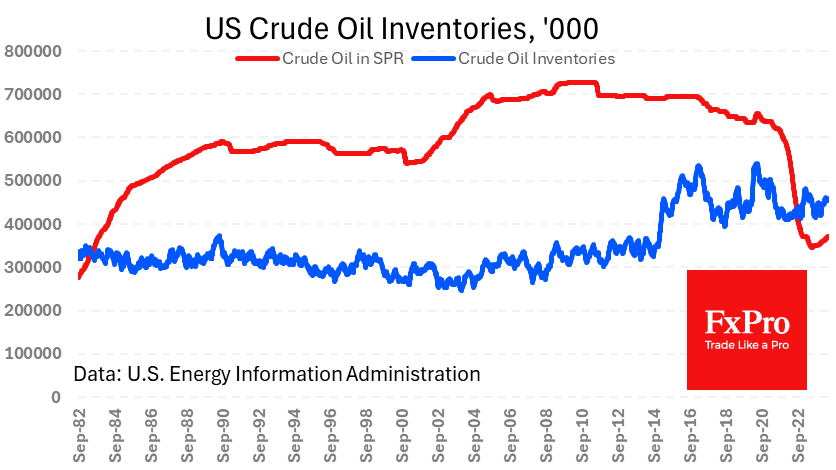
Simply put, US oil producers are satisfied with the status quo and seek to balance production at current prices. This neutral American stance is complemented by the actively bullish stance of OPEC+ countries, which are keen to keep a net deficit in the market, at least in words. At the same time, a downturn in demand in Europe and weakness in China are balancing the situation.
Perhaps only tech analysis will help to wade through the geopolitical twists and turns in Oil. For more than two years, the price has been forming a global triangle with local highs of $120, $94, and $86, and lows of $65, $70, and $75. Now, the price is closer to the previous high, but only its overcoming can signal the final choice of direction. Until then, Oil is within a declining volatility trend with a preferred mean reversion tactic.
USD/JPY Analysis: Rate Rises Above 159.9 Yen per Dollar
The yen was last this weak against the US dollar in late April, leading to currency interventions as the Bank of Japan deemed a rate above the psychological mark of 160 yen per USD unacceptable.
The current weakness of the yen has triggered the usual warnings from Japanese officials against "excessive" volatility, which can be interpreted as a sign of a new wave of interventions.
It is noteworthy that following the intervention in late April (when the yen strengthened by 4.5% by the first days of May), it took the market less than two months to negate almost the entire effect of the Bank of Japan's actions. This indicates a strong upward trend (shown in blue), driven by the interest rate differential between Japan and the US.
According to Reuters:
→ The 160.00 level is seen as a red line for the Japanese, considering that yen weakness increases imported inflation and pressures the Bank of Japan (BoJ) to further unwind its ultra-loose policy.
→ The minutes from the latest central bank meeting confirmed extensive discussions about reducing bond purchases and raising rates.
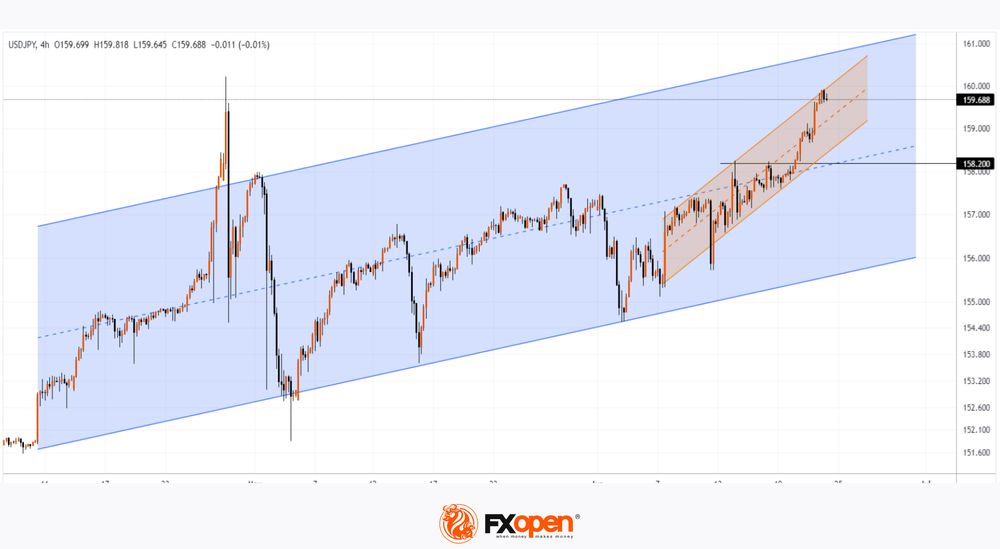
Technical analysis of the USD/JPY chart shows that:
→ In June, the rate is in an upward trend (shown in orange), which has lifted the dollar from the lower to the upper half of the blue channel;
→ The 158.20 level may serve as support (as it is former resistance, reinforced by the median of the blue channel).
It is possible that within the orange channel, the USD/JPY rate could reach the upper boundary of the blue channel and even surpass the multi-month peak of April, making a reaction from the Bank of Japan almost inevitable.
Trade over 50 forex markets 24 hours a day with FXOpen. Take advantage of low commissions, deep liquidity, and spreads from 0.0 pips. Open your FXOpen account now or learn more about trading forex with FXOpen.
This article represents the opinion of the Companies operating under the FXOpen brand only. It is not to be construed as an offer, solicitation, or recommendation with respect to products and services provided by the Companies operating under the FXOpen brand, nor is it to be considered financial advice.
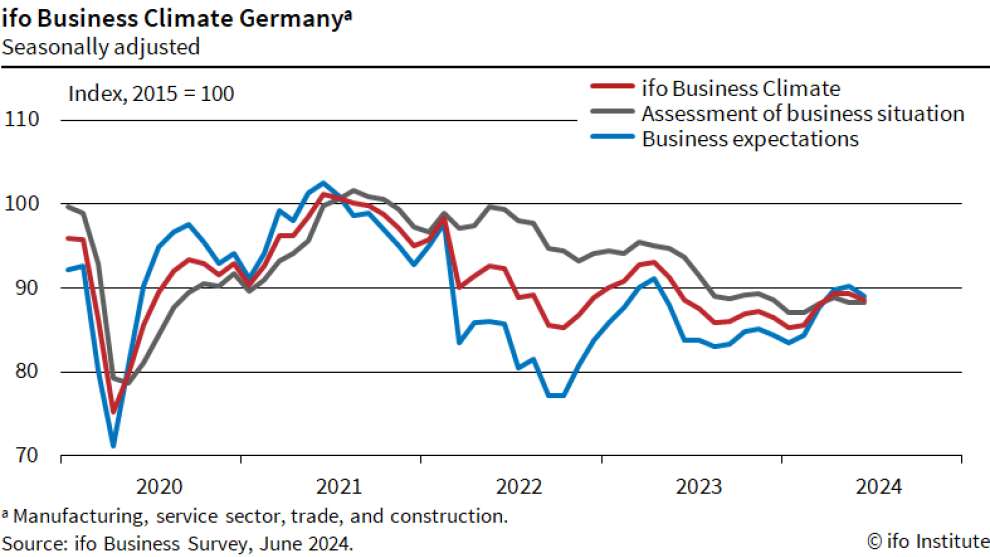
German Ifo falls to 88.6, struggling to overcome stagnation
German Ifo Business Climate fell from 89.3 to 88.6 in June, below expectation of 89.7. Current Assessment index was unchanged at 88.3, below expectation of 88.4. Expectations Index fell from 90.3 to 89.0, below expectation of 91.0.
Ifo said that the German economy is "having difficulty overcoming stagnation".
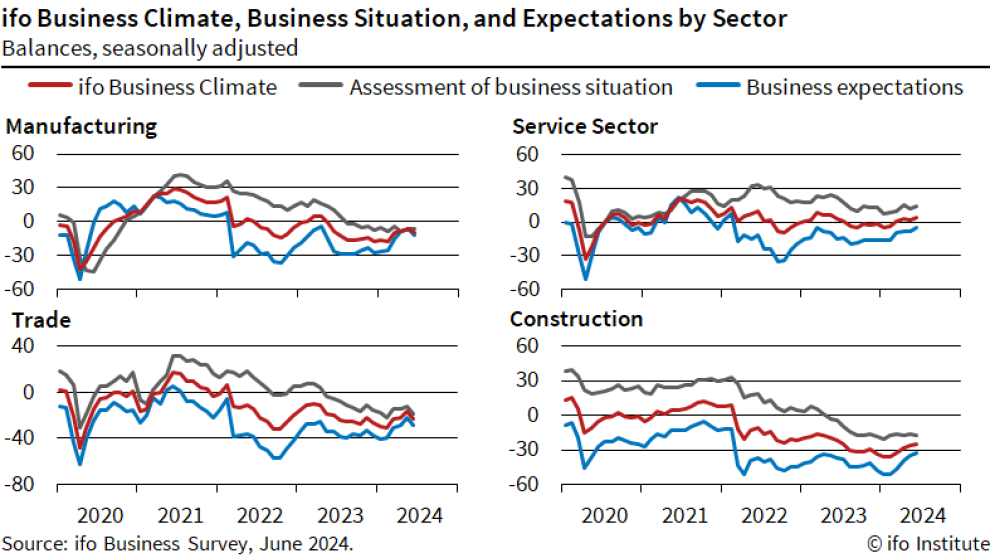
By sector, manufacturing fell from -6.5 to -9.2. Services rose from 1.8 to 4.2. Trade fell from -17. to -23.5. Construction ticked up from -25.6 to -25.0.
S&P 500 Falls from Record High in Anticipation of Key News
On Friday, at 15:30 GMT+3, the Core PCE Price Index values will be released – an economic indicator to which the Federal Reserve pays special attention when assessing inflation levels in the US. This event is likely to cause a surge of news in the financial markets, and its anticipation will influence sentiments throughout the week.
On Monday morning, the S&P 500 Index (US SPX 500 mini on FXOpen) fell to 5465 points after a historical record above 5500 points was set on June 20th. The decline was contributed by Friday’s report from the National Association of Realtors, which showed a drop in existing home sales in May compared to the previous month.
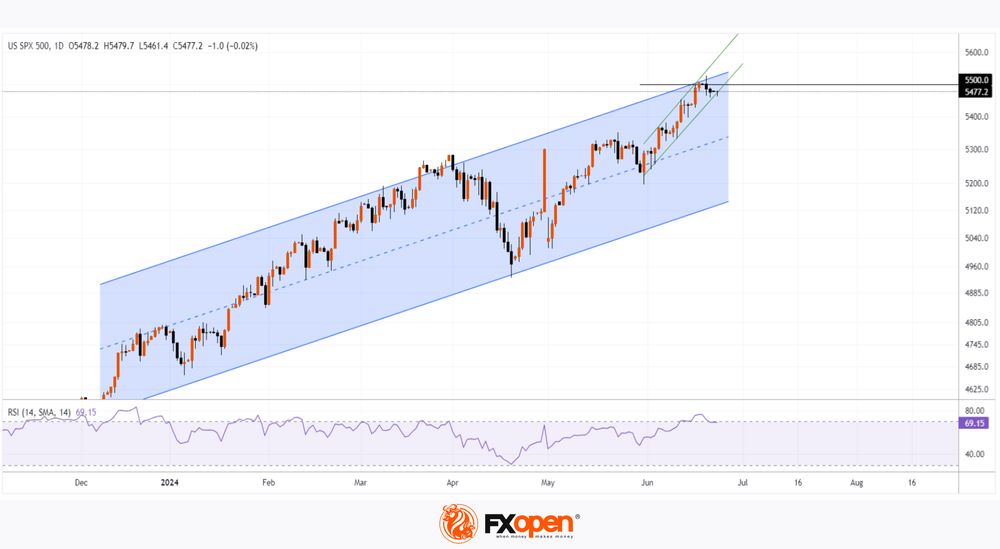
Technical analysis of the daily chart of the S&P 500 Index (US SPX 500 mini on FXOpen) shows that:
→ the price is in a large upward trend that began last year;
→ the price is near the upper boundary of this channel;
→ the price has fallen below the psychological level of 5500;
→ the price is still in the June upward trend (shown in green);
→ the RSI indicator points to some market overbought conditions.
Given these facts, it is reasonable to assume that the S&P 500 Index (US SPX 500 mini on FXOpen) is in a vulnerable position for a pullback from the resistance block formed by the psychological level of 5500 and the upper boundary of the channel. The June upward trend may be broken.
Moreover, a possible correction might take on a threatening character if Friday’s news shows that US inflation is not slowing down – which would strengthen market participants’ belief that the period of high rates will last longer than expected.
Trade global index CFDs with zero commission and tight spreads. Open your FXOpen account now or learn more about trading index CFDs with FXOpen.
This article represents the opinion of the Companies operating under the FXOpen brand only. It is not to be construed as an offer, solicitation, or recommendation with respect to products and services provided by the Companies operating under the FXOpen brand, nor is it to be considered financial advice.
Crypto Dive
Market picture
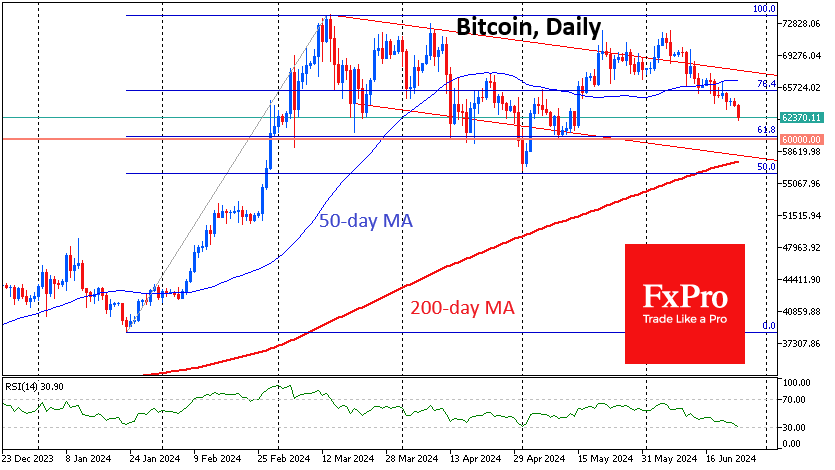
Along with the rest of the cryptocurrency market, Bitcoin is pulling back further into the area of last month’s lows. The sell-off intensified with the start of the new week, pushing total capitalisation back 3.6% in 24 hours to $2.26 trillion, which we last saw on May 13.
Particularly worrying is the rather organised nature of the retreat on all fronts, which reflects the global decline in traction in risk assets.
Bitcoin looks better than many major coins, losing 3.3% on the day to $62.2K. We still don’t see technically important support levels up to the $60K area, but beyond that, it may not be so easy for the bears. In addition to the psychologically significant round level, the 61.8% Fibonacci retracement level is centred in this area. The next sensitive area is near $58K; the 200-day moving average is pulled up here, and there is the lower boundary of the downward range, which has been in force since March.
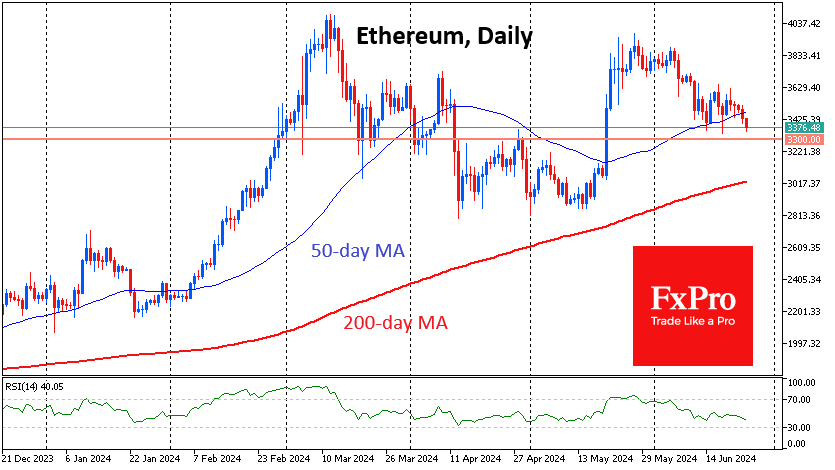
Ethereum is holding up better than many altcoins, and it is just starting to test the $3300 pivot area. That said, Solana and Litecoin have been at lows since late February, and Cardano has pulled back into the prolonged consolidation area of November. Surprisingly, the Cryptocurrency Fear and Greed Indexes rate the situation as “Neutral.” This makes one think that the bottom is just yet to be reached.
News background
According to Google Trends, retail investors’ interest in bitcoin has been steadily declining since March. Santiment records “extremely negative” investor sentiment towards BTC over the past four weeks, but this could signal a reversal for experienced traders who prefer to go against the tide.
BlackRock, VanEck, Franklin Templeton, Grayscale Investments, Invesco Galaxy, and 21Shares filed updated spot Ethereum-ETF filings with the SEC. The issuers also disclosed initial investments in the Ethereum-ETF.
Digital asset manager 3iQ has applied to register Canada’s first Solana-ETF with a staking fee option (6-8 per cent p.a.). It is planned to be listed on the Toronto Stock Exchange (TSE).
US bitcoin miner Marathon Digital Holdings has launched a pilot project in Finland to use the heat generated by cryptocurrency mining for home heating.
The launch of the ZRO token of the LayerZero omnichain protocol triggered an increase in commissions in Arbitrum’s L2 network, which led to a jump in the blockchain’s daily revenue to a record $3.43 million (+16,680%).
Japanese Yen Grabs Most Attention This Morning
Markets
The Japanese yen grabs most attention this morning. Dollar strength pushed USD/JPY last Friday above 159.50 following stronger-than-expected June PMI’s and the pair is still flirting with the 160 mark this morning (34-yr JPY low). This level prompted FX interventions to the tune of almost JPY 10tn by the Japanese Ministry of Finance at the end of April and alarm bells are ringing this time around as well. Vice Finance minister Kanda confirmed preparedness to take appropriate action in the event of excessive FX moves based on speculation. Excessive currency fluctuation negatively impact the national economy, he added. Finance Minister Suzuki later added weight by stressing that the government is watching FX moves closely. Minutes from the June Bank of Japan meeting fail to help the currency even as they bolster the case for a July rate hike: “if deemed appropriate, the central bank should raise the policy rate before it’s too late”. A small Japanese interest rate adjustment obviously doesn’t suffice against a hawkish leaning Fed keeping policy rates at their peak levels for longer.
Most recent French election polls continue pointing to a win for Marine Le Pen’s Rassemblement National in the first round of legislative elections next Sunday. They are forecast to get 35.5% of the vote, ahead of alliance of left-wing parties (Nouveau Front Populaire, 29%) and President Macron’s alliance (Ensemble, 21%). In the projected seat tally, they fail to get an outright majority though (210-250 guestimate in 577-seat parliament). Such hung parliament risks putting France in a political deadlock with RN (Bardella) so far ruling out delivering a PM for a minority government. Political uncertainty could thus remain high after elections with little momentum to put French ailing public finances back on track. The French 10-yr OAT-swapspread continues trading near recent multiyear highs (+45 bps) with French bonds unlikely to pull any comeback soon. The German/French 10-yr yield spread hit 80 bps for the first time since 2012. Euro weakness holds EUR/USD (just) below 1.07 this morning. The YTD low at 1.0601 remains the travel direction. Today’s eco calendar is thin with only German Ifo business climate which will normally reflect Friday’s weakness in PMI’s (political uncertainty). Speeches by ECB and Fed governors are a wildcard. This week’s eco agenda is back-loaded with the Fed’s preferred (May) PCE deflators and first national EMU (June) CPI data on Friday.
News & Views
The IMF in its annual review said that Hungary has come a long way reducing double digit inflation and bringing the current account deficit under control. It expects average annual inflation of 4.2% this year to ease to the 3% central bank target by 2026. But significant challenges remain with the fiscal deficit and debt ratio still well above the pre-pandemic levels. It also said that the windfall taxes introduced in 2022 are increasing market uncertainty and expressed criticism on the country’s “excessively high” and competition-hindering state ownership in key sectors. The IMF lashed out at the government’s interest rate freeze as well, as it distorts market conditions. The Hungarian government recently extended an interest rate cap on retail loans (introduced in Jan 2022) until the end of 2024. The IMF urged Hungary to pursue a credible and growth-friendly fiscal consolidation plan and said the government should help the central bank’s efforts to reduce inflation. The IMF lastly stressed that structural and governance reforms are necessary or risk losing access to the remaining locked up European funds, in turn leading to a higher risk premium, a weaker forint and tighter monetary policy weighing on growth.
China’s fiscal revenue fell 2.8% in the first five months of 2024 compared to the same period last year. It’s also an acceleration from the 2.7% drop in the January-April period and a sign of sluggish demand and the fragile property sector continuing to weigh on the economy. Expenditures rose 3.4% in the five months to May. The government pledged more fiscal stimulus to support the ailing economy and to reach the (ambitious) 5% growth target for this year. Part of the efforts include the recently kicked-off sale of CNY 1tn long-dated special treasury bonds to help fund mega projects in key sectors.
Graphs
GE 10y yield
The ECB cut its key policy rates by 25 bps at the June policy meeting. A more bumpy inflation path in H2 2024, the EMU economy gradually regaining traction and the Fed’s higher for longer US strategy make follow-up moves difficult. Markets are coming to terms with that. For the time being, though, the political narrative (France) dominates. After hitting a new YtD top at 2.7%, the German 10-yr yield corrected lower on safe haven bids.
US 10y yield
The Fed is seeking more evidence than just one slower-than-expected (May) CPI is providing. Upgraded inflation forecasts and a higher neutral rate complicate the exact timing of a first cut further. June dots suggest one move in 2024 followed by four more next year. Markets are positioned more aggressively, turning the recent low in yields into a technical support zone. The US 10-y yield is testing the downside of the 4.2/4.7% trading range.
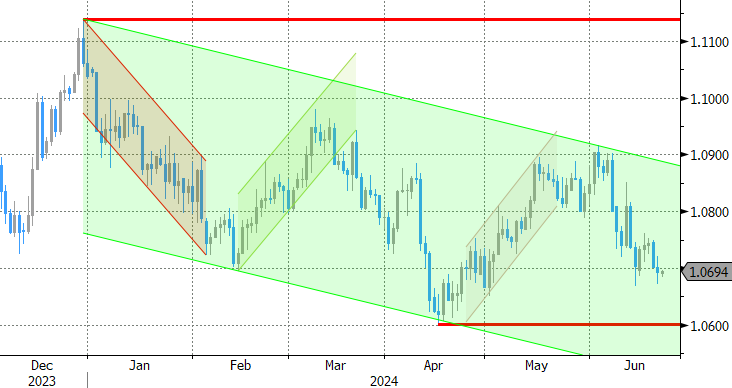
EUR/USD
EUR/USD is stuck in the 1.06-1.09 range. The desynchronized rate cut cycle with the ECB exceptionally taking the lead, strong US May payrolls and a swing to the right in European elections pulled the pair away from 1.09 resistance. The Fed meeting balanced the weaker than expected US CPI outcome. Euro fragility makes a return to the 1.06 downside more likely than not.
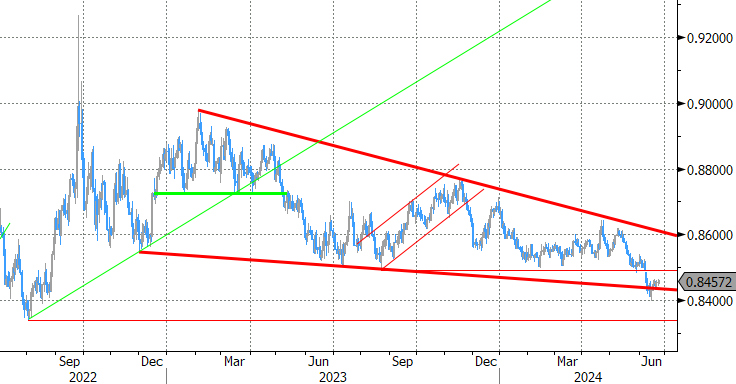
EUR/GBP
Debate at the BOE is focused at the timing of rate cuts. May headline inflation returned to 2%, but core measures weren’t in line with inflation sustainably returning to target any time soon. Still some BoE members at the June meeting appeared moving closer to a rate cut. This might cap further sterling gains. At the same time, the euro remains vulnerable to political event risk going into the French elections. EUR/GBP 0.84 is becoming solid support.
French Elections Coming Up
In focus today
The week kicks off in a quiet fashion in terms of data. The German Ifo business sentiment index will most likely mirror the weakness seen in last week's PMIs.
We have a string of ECB speeches throughout the day with high-influence members such as Schnabel, Villeroy and Nagel on the wire. The Fed speakers today include Waller and Daly.
European politics will be the centre of attention this week ahead of the first round of the French parliamentary elections. The most likely scenario is a "hung parliament", which would imply that the worst fears in markets of large spending increases should diminish. The second and final round will be held on 7 July.
On Thursday, we will have the first televised debate between Trump and Biden. The face-off could provide more insights into the ambitions on fiscal policy and regulation.
This week's data calendar is rather limited with the June inflation releases from France, Spain and Italy on Friday among the highlights.
Economic and market news
What happened Friday and over the weekend
Euro area PMIs declined more than expected in June. The composite indicator came in at 50.8 (cons: 52.5, prior: 52.2) with broad-based declines across manufacturing (45.6, prior: 47.3) and services (52.6, prior: 53.2). We do expect the economy to keep growing as services are still doing well amid a decline from a high level. The labour market is strong and real incomes are rising. Manufacturing is also expected to improve as the worst is over, but the rebound seems more fragile now as new orders weakened substantially in June. For the ECB, the slight cooling in the services sector PMIs and a drop in the output price index is welcoming news as the pressure from services inflation has been strong recently.
In the US, PMIs were stronger than expected. For June, both services and manufacturing PMIs beat expectations, as services came in at 55.1 (consensus: 53.7, prior: 54.8), and manufacturing stood at 51.7 (consensus: 51.0, prior: 51.3). The strong report is yet another sign of the continued resilience of the US economy. Both manufacturing input and output prices were lower.
UK PMIs for June were also lower than expected as the composite measure came in at 51.7 (prior: 53.0) with broad-based declines in activity growth across sectors. The BoE tends to place significant weight on the PMIs, and last summer's weak figures were likely a key reason behind the unchanged (vs. hike) decision back in September last year. However, price signals from the report remain sticky and rose at a faster pace than in the previous month, especially in the private sector where firms highlighted the need to cover their costs by increasing prices. We expect the first rate cut from BoE in August.
The leader of the leftist NPF alliance in France, Jean-Luc Mélenchon, said on Friday that the alliance plans to allocate EUR200bn over the next five years to deliver on its promise to roll back Macron's labour and pension reforms and increase minimum wages. EDP will present more details on how to finance its plans at a press conference this Friday ahead of the first round of voting on Sunday. According to Politico's most recent 'Poll of Polls', Le Pen's party (RN) leads by 33% ahead of NPF at 27% and Macron's ENS at 20%. Likewise, a poll by the Financial Times showed Le Pen was favoured amongst voters when it came to being trusted with the economy.