Sample Category Title
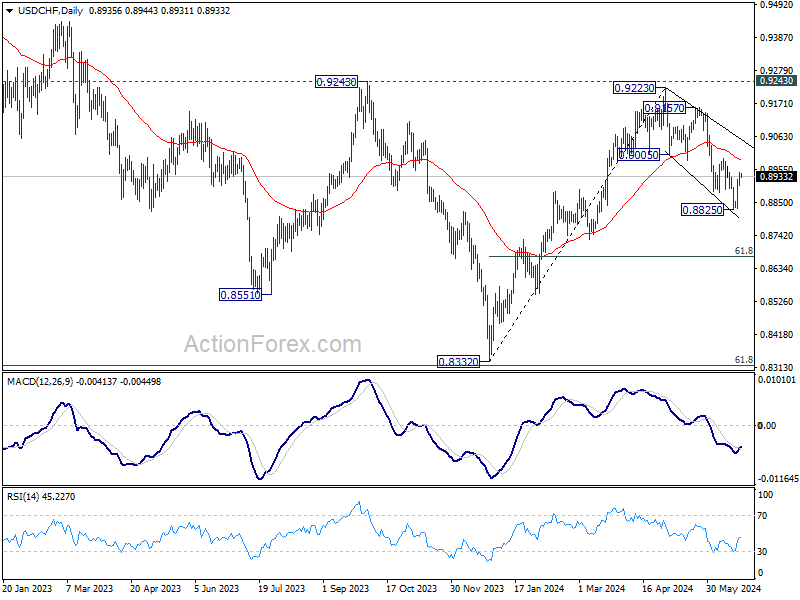
USD/CHF Daily Outlook
Daily Pivots: (S1) 0.8917; (P) 0.8931; (R1) 0.8958; More….
Intraday bias in USD/CHF stays neutral and more consolidations could be seen above 0.8825. Still, near term outlook remains bearish with 0.8992 resistance intact. Break of 0.8825 will resume the fall from 0.9223 to 61.8% retracement of 0.8332 to 0.9223 at 0.8672.
In the bigger picture, price actions from 0.8332 medium term bottom are seen as developing into a corrective pattern to the down trend from 1.0146 (2022 high). Rejection by 0.9243 resistance affirms this case, and maintains medium term bearishness. While more range trading could be seen between 0.8332/0.9243 first, downside break out is mildly in favor at a later stage.
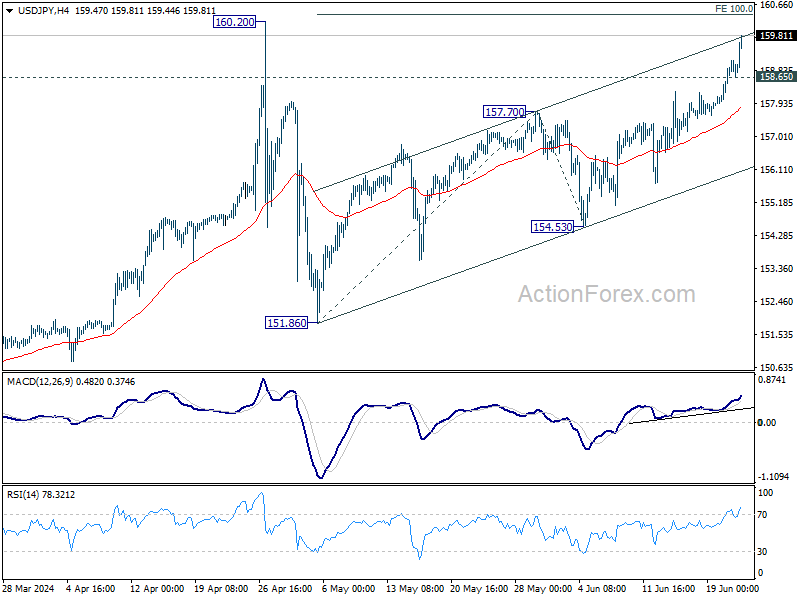
USD/JPY Daily Outlook
Daily Pivots: (S1) 159.02; (P) 159.44; (R1) 160.22; More...
Intraday bias in USD/JPY remains on the upside for the moment. Current rally should target 160.20 high, or possibly to 100% projection of 151.86 to 157.70 from 154.53 at 160.37. Upside could be limited there, at least on first attempt. On the downside, below 158.24 minor support will turn intraday bias neutral first. However, decisive break of 160.37 will pave the way to 161.8% projection at 163.97.
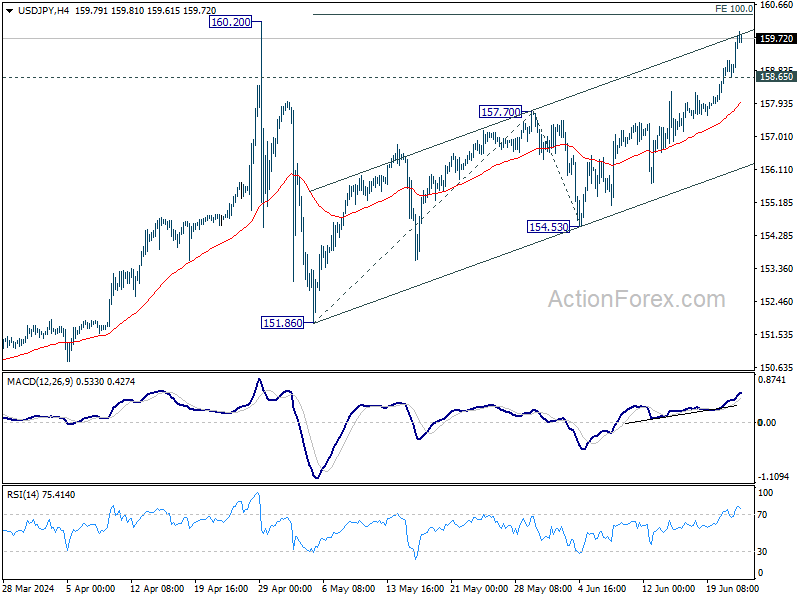
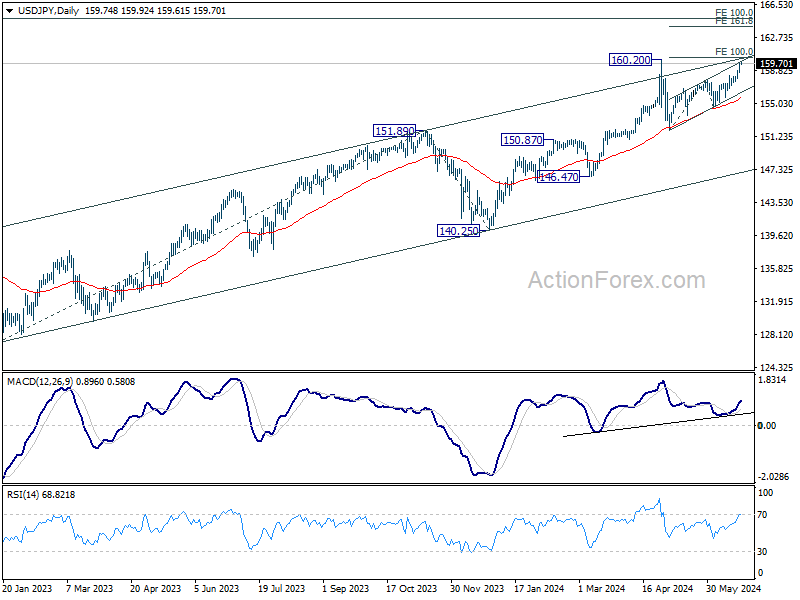
In the bigger picture, there is no sign of long term trend reversal yet. Further rally is expected as long as 150.87 resistance turned support holds. Decisive break of 160.02 will target 100% projection of 127.20 to 151.89 from 140.25 at 164.94.
Japan’s Inaction and Refrained Rhetoric Lead to Speculation on New Intervention Threshold
Yen recovered mildly in quiet Asian session along with the Swiss Franc, driven by mild risk aversion in the region. Despite this uptick, there is no strong indication of a significant rebound for the Japanese currency following its sharp decline last week. Notably, Japan did not utilize the thin liquidity at the beginning of the week to intervene in the currency markets. While some traders remain vigilant for possible intervention should USD/JPY surpass 160 level, we believe that the intervention threshold may have already been adjusted higher.
Japan's verbal intervention has been relatively restrained too. Finance Minister Shunichi Suzuki warned against excessive speculative movements in the current market, pledging to respond appropriately if necessary. However, stronger language, such as monitoring the markets with a "high sense of urgency," was notably absent. Meanwhile, top currency diplomat Masato Kanda only reiterated that "we are always ready to take appropriate action when there are excessive moves," and emphasized that Japan is prepared to intervene 24 hours a day if needed.
In the broader currency market, Sterling and US Dollar followed Yen and Swiss Franc as the stronger performers of the session. Meanwhile, New Zealand Dollar, Australian Dollar, and Canadian Dollar lagged, with Euro positioned in the middle. As the first half of the year draws to a close, upcoming inflation data from Canada, Australia, Tokyo, and the US are expected to inject more volatility into the markets.
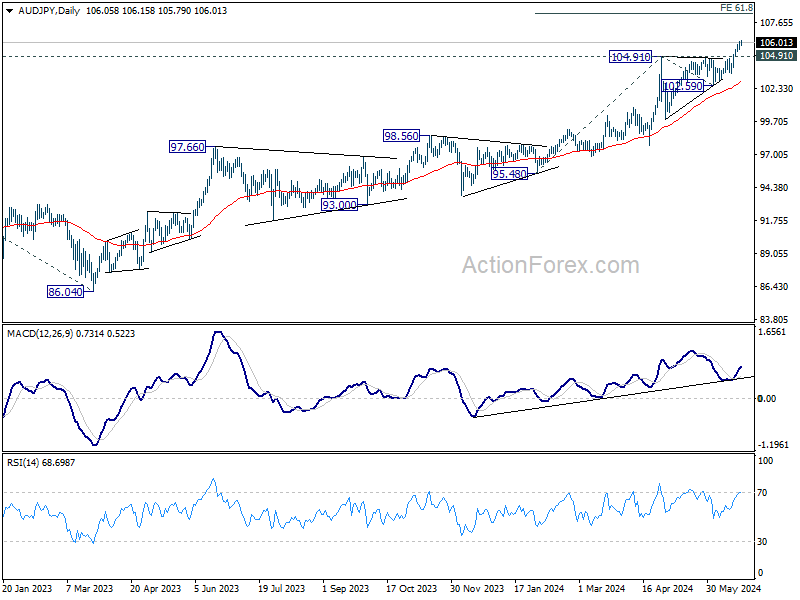
Technically, AUD/JPY's long term up trend resumed last week and surged to the highest level since 2007, passing through 2013 high at 105.42. Further rally is expected as long as 104.91 resistance turned support holds. Next target is 61.8% projection of 95.48 to 104.91 from 102.59 at 108.41 which is above 2007 high at 107.88. This advance will depend on Japan's intervention stance and Australia's monthly CPI data scheduled for release on Wednesday.
In Asia, at the time of writing, Nikkei is up 0.60%. Hong Kong HSI is down -1.02%. China Shanghai SSE is down -0.70%. Singapore Strait Times is down -0.04%. Japan 10-year JGB yield is up 0.0212 at 0.999.
BoJ deliberates on rate hikes, Yen depreciation, and JGB purchase adjustments
During Monetary Policy Meeting on June 13-14, BoJ board discussed the need for adjustments in response to rising inflation risks. One key opinion indicated that if April Outlook Report's economic and inflation forecasts are realized, BoJ will raise the policy interest rate and adjust monetary accommodation.
Another member warned that prices could "deviate upward" from the baseline scenario if recent cost increases are passed on to consumers, suggesting a need for further policy adjustments from a "risk management" perspective. It's also highlighted the growing "upside risks" to prices, with one member stating these risks have affected consumer sentiment and that the policy interest rate should be raised "not too late" if appropriate.
The impact of Yen's depreciation was also discussed, with an opinion suggesting an "upward revision" to the inflation outlook, warranting a higher risk-neutral policy interest rate. Some members emphasized the importance of basing monetary policy on the "overall picture of developments in economic activity and prices," rather than short-term foreign exchange fluctuations. They stressed that policy should be informed by trends in prices and wage developments.
Regarding asset purchases, one opinion recommended reducing the purchase amount of Japanese government bonds to allow long-term interest rates to form more freely in financial markets. This reduction should be "sizeable" and "predictable," while ensuring flexibility to maintain stability in JGB market.
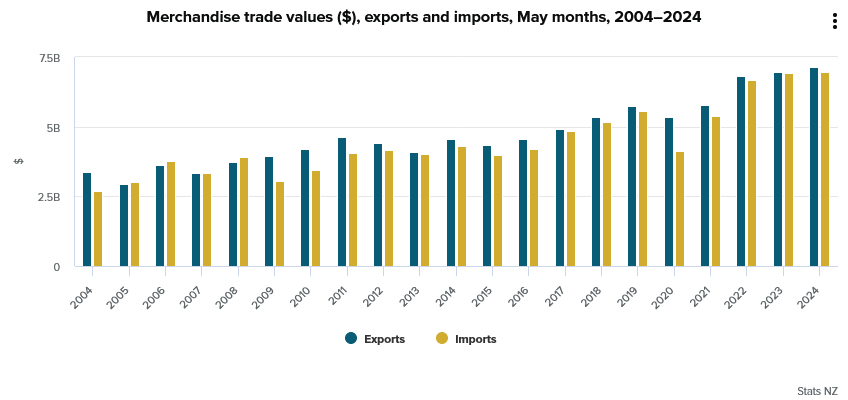
New Zealand's goods exports reach record high in may, trade surplus exceeds expectations
New Zealand's goods exports rose by 2.9% yoy to NZD 7.2B in May, marking the first time that monthly exports have surpassed the NZD 7B mark. Goods imports also saw a slight increase, rising by 0.6% yoy to NZD 7.0B. This resulted in a trade surplus of NZD 204m, exceeding the expected NZD 155m.
Breaking down the top monthly export movements by country, New Zealand saw mixed results. Exports to China fell by -12% yoy, and exports to Australia dropped by -3.8% yoy. In contrast, exports to the US surged by 33% yoy, while exports to the EU and Japan rose by 2.8% yoy and 12% yoy, respectively.
On the import side, imports from China increased by 2.6% yoy, while imports from the EU decreased by -1.8% yoy. Imports from Australia -4.7% yoy, whereas imports from the US and South Korea rose by 1.6% yoy and 5.8% yoy, respectively.
Inflation reports from Canada, Australia, Japan, and US to drive currencies
Inflation data will once again be the focus this week, with critical reports coming from Canada, Australia, and Tokyo in Japan. The United States will also release its PCE inflation data.
The minutes of BoC's June meeting revealed that governing council had considered delaying a rate cut until July but decided to act earlier this month, citing significant progress in reducing inflation. Thus, it is unlikely for BoC to deliver a back-to-back rate cut in July, although this will depend on how inflation evolves. Canada's CPI common has steadily declined from 3.9% in December to 2.6% in April. However, a stalling of progress in May could keep BoC cautious.
Australia's monthly CPI data for May might show a slight tick down in inflation. Yet, the readings have been stuck between 3.4% and 3.6% since last December, a situation that does not instill confidence in RBA to close the door on further tightening. While RBA will wait for Q2 CPI for a more comprehensive assessment, the monthly CPI could still provide valuable insight into inflation trends.
In Japan, Tokyo's core CPI is expected to tick up slightly in June, continuing to hover around the 2% level due to fluctuations in energy prices. BoJ has repeatedly indicated that a rate hike in July is a possibility, but the situation remains complex. Fading demand-led price pressures would likely keep the BoJ cautious about tightening further. However, cost-push inflation resulting from a weakening Yen could prompt a monetary policy response.
In the US, PCE core price index is expected to rise by only 0.1% mom in May, the smallest increase since last November. This would be a positive development for Fed, suggesting that inflationary pressures are easing. But it is way too early for Fed to decide on whether to start cutting interest rates in September, considering that it is only June. More data will be needed to make an informed decision.
Here are some highlights for the week:
- Monday: New Zealand trade balance; BoJ summary of opinions; Germany Ifo business climate.
- Tuesday: Japan corporate service price index; Australia Westpac consumer sentiment; Canada CPI; US house price index, consumer confidence.
- Wednesday: Australia monthly CPI; Germany Gfk consumer sentiment; Swiss UBS economic expectations; US new home sales.
- Thursday: Japan retail sales; New Zealand ANZ business confidence; Eurozone M3 money supply; US Q1 GDP final, jobless claims, durable goods orders, goods trade balance, pending home sales.
- Friday: Japan Tokyo CPI, unemployment rate, industrial production, housing starts; Germany import price: UK Q1 GDP final; Swiss KOF economic barometer; Germany unemployment; Canada GDP; US personal income and spending, PCE inflation, Chicago PMI.
USD/JPY Daily Outlook
Daily Pivots: (S1) 159.02; (P) 159.44; (R1) 160.22; More...
Intraday bias in USD/JPY remains on the upside for the moment. Current rally should target 160.20 high, or possibly to 100% projection of 151.86 to 157.70 from 154.53 at 160.37. Upside could be limited there, at least on first attempt. On the downside, below 158.24 minor support will turn intraday bias neutral first. However, decisive break of 160.37 will pave the way to 161.8% projection at 163.97.
In the bigger picture, there is no sign of long term trend reversal yet. Further rally is expected as long as 150.87 resistance turned support holds. Decisive break of 160.02 will target 100% projection of 127.20 to 151.89 from 140.25 at 164.94.
Economic Indicators Update
| GMT | Ccy | Events | Actual | Forecast | Previous | Revised |
|---|---|---|---|---|---|---|
| 22:45 | NZD | Trade Balance (NZD) May | 204M | 155M | 91M | -3M |
| 23:50 | JPY | BoJ Summary of Opinions | ||||
| 08:00 | EUR | Germany IFO Business Climate Jun | 89.7 | 89.3 | ||
| 08:00 | EUR | Germany IFO Current Assessment Jun | 88.4 | 88.3 | ||
| 08:00 | EUR | Germany IFO Expectations Jun | 91 | 90.4 |
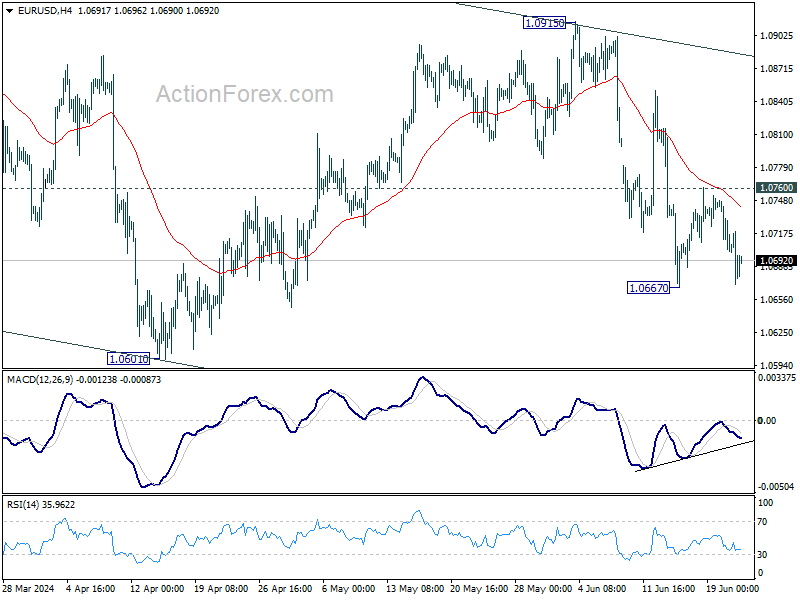
EUR/USD Remains At The Edge, Can It Recover?
Key Highlights
- EUR/USD failed to surpass 1.0765 and declined once again.
- A major bearish trend line is forming with resistance at 1.0710 on the 4-hour chart.
- GBP/USD declined heavily and traded below the 1.2680 support.
- Bitcoin price extended losses and traded below the $64,200 support.
EUR/USD Technical Analysis
The Euro failed to recover above the 1.0765 resistance against the US Dollar. EUR/USD started another decline and traded below the 1.0720 support.
Looking at the 4-hour chart, the pair settled below the 1.0720 level, the 100 simple moving average (red, 4-hour), and the 200 simple moving average (green, 4-hour). It is now consolidating near the 1.0670 support zone.
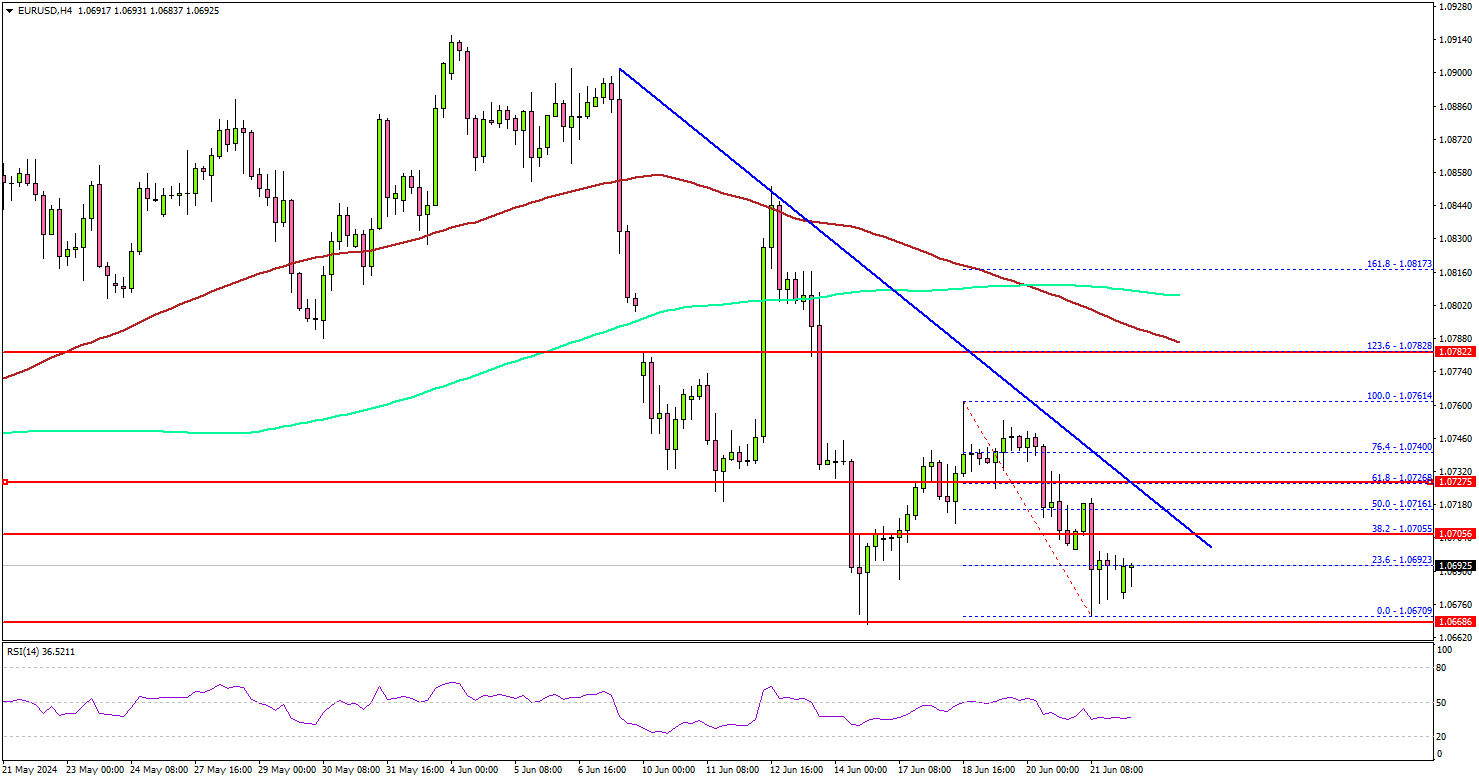
On the upside, the pair is facing resistance near the 1.0710 level. There is also a major bearish trend line forming with resistance at 1.0710 on the same chart.
The first major resistance is near the 1.0720 level. A clear move above the 1.0720 resistance might send it toward the 1.0750 level. The main resistance is still near 1.0765. Any more gains might call for a move toward the 1.0820 level in the near term.
If not, the pair might dip again. Immediate support is near the 1.0670 level. The next major support is near the 1.0650 zone. A downside break and close below the 1.0650 support zone could open the doors for a larger decline. In the stated case, the pair could decline toward the 1.0550 level.
Looking at GBP/USD, the pair trimmed most gains and there was a bearish reaction below the 1.2680 support zone.
Economic Releases
- German IFO Business Climate Index for June 2024 – Forecast 89.7, versus 89.3 previous.
- German IFO Current Assessment Index for June 2024 - Forecast 88.4, versus 88.3 previous.
BoJ deliberates on rate hikes, Yen depreciation, and JGB purchase adjustments
During Monetary Policy Meeting on June 13-14, BoJ board discussed the need for adjustments in response to rising inflation risks. One key opinion indicated that if April Outlook Report's economic and inflation forecasts are realized, BoJ will raise the policy interest rate and adjust monetary accommodation.
Another member warned that prices could "deviate upward" from the baseline scenario if recent cost increases are passed on to consumers, suggesting a need for further policy adjustments from a "risk management" perspective. It's also highlighted the growing "upside risks" to prices, with one member stating these risks have affected consumer sentiment and that the policy interest rate should be raised "not too late" if appropriate.
The impact of Yen's depreciation was also discussed, with an opinion suggesting an "upward revision" to the inflation outlook, warranting a higher risk-neutral policy interest rate. Some members emphasized the importance of basing monetary policy on the "overall picture of developments in economic activity and prices," rather than short-term foreign exchange fluctuations. They stressed that policy should be informed by trends in prices and wage developments.
Regarding asset purchases, one opinion recommended reducing the purchase amount of Japanese government bonds to allow long-term interest rates to form more freely in financial markets. This reduction should be "sizeable" and "predictable," while ensuring flexibility to maintain stability in JGB market.
New Zealand’s goods exports reach record high in may, trade surplus exceeds expectations
New Zealand's goods exports rose by 2.9% yoy to NZD 7.2B in May, marking the first time that monthly exports have surpassed the NZD 7B mark. Goods imports also saw a slight increase, rising by 0.6% yoy to NZD 7.0B. This resulted in a trade surplus of NZD 204m, exceeding the expected NZD 155m.
Breaking down the top monthly export movements by country, New Zealand saw mixed results. Exports to China fell by -12% yoy, and exports to Australia dropped by -3.8% yoy. In contrast, exports to the US surged by 33% yoy, while exports to the EU and Japan rose by 2.8% yoy and 12% yoy, respectively.
On the import side, imports from China increased by 2.6% yoy, while imports from the EU decreased by -1.8% yoy. Imports from Australia -4.7% yoy, whereas imports from the US and South Korea rose by 1.6% yoy and 5.8% yoy, respectively.
Forex and Cryptocurrency Forecast
EUR/USD: Eurozone - Rising Inflation, Falling Economy
As revised Eurostat data published on Monday, June 17, showed, inflation (CPI) in the 20 Eurozone countries accelerated to 2.6% (y/y) in May, compared to 2.4% in April when it was at its lowest since November 2023. The consumer price index in the services sector increased annually from 3.7% to 4.1%. Core inflation, excluding the cost of food and energy (CPI Core), accelerated to 2.9% in May, compared to 2.7% in April - the lowest since February 2022.
Such growth in consumer prices gave euro bulls a faint hope that the European Central Bank (ECB) would slow down the rate cut. Against this backdrop, EUR/USD went up, reaching a local high of 1.0760. However, the business activity statistics (PMI) in the Eurozone, released on June 21, showed that to support the economy, the rate needs to be reduced further, not frozen at the current level of 4.25%.
In Germany, the locomotive of the European economy, the PMI index in the manufacturing sector was 43.4 points in June, worsening compared to the May figure of 45.4 and significantly below the forecast of 46.4. The PMI index in the services sector fell from 54.2 to 53.5, failing to meet market expectations of 54.4. The preliminary Composite PMI index for Germany also declined in June to 50.6 points, against the forecast of 52.7 and 52.4 in May. It is worth noting that all three indicators were the weakest in the last two months.
Eurozone statistics, in general, were not very encouraging. According to preliminary data, the PMI index in the manufacturing sector fell from 47.3 in May to 45.6 in June, missing the forecast of 47.9. The PMI index in the services sector decreased from 53.2 to 52.6 (forecast 53.5). The Composite PMI fell from 52.2 to 50.8 (forecast 52.5) and nearly reached the critical mark of 50.0 points, separating progress from regression.
After these data were released, market participants awaited similar statistics from the USA, which were to be published at the end of the workweek. The Composite PMI showed that business activity in the US private sector, unlike the Eurozone, continues to grow confidently. According to preliminary estimates, this indicator increased from 54.5 in May to 54.6 in June. The PMI in the manufacturing sector grew from 51.3 to 51.7 over the same period, while the services sector business activity index increased from 54.8 to 55.1. All these indicators exceeded analysts' expectations (51.0 and 53.4, respectively).
In addition to PMI data, the Fed's monetary policy report at the end of Friday also drew significant interest. Following its publication, EUR/USD ended the week at 1.0691. Regarding the analysts' forecast for the near term, as of the evening of June 21, it remained unchanged from seven days ago. Thus, 60% of experts voted for the pair's decline, 20% for its growth, and another 20% remained neutral. In technical analysis, 100% of trend indicators and oscillators on D1 sided with the dollar and turned red, although a quarter of the latter are in the oversold zone. The nearest support for the pair is in the 1.0665-1.0670 zone, followed by 1.0600-1.0615, 1.0565, 1.0495-1.0515, 1.0450, and 1.0370. Resistance zones are located at 1.0760, then at 1.0810, 1.0890-1.0915, 1.0945, 1.0980-1.1010, 1.1050, and 1.1100-1.1140.
Next week, there is plenty of interesting and important information expected from the USA. On Tuesday, June 25, the US Consumer Confidence Index will be published. On Wednesday, June 26, we will learn the results of the US bank stress test. On Thursday, June 27, data on the US GDP for Q1 2024 and the number of initial jobless claims in the country will be released. Finally, at the end of the workweek, on Friday, June 28, data on the US consumer market, including such an important inflation indicator as the Core Personal Consumption Expenditure Index, will be published.
GBP/USD: How the Interest Rate Will Fall
On Wednesday, June 19, a day before the Bank of England (BoE) meeting, consumer inflation (CPI) data was published in the UK. Overall, the picture was quite good. The consumer price index remained at the previous level of 0.3% month-on-month, lower than the projected 0.4%. Year-on-year, the CPI fell from 2.3% to 2.0%, reaching the central bank's target for the first time since October 2021. The core index (Core CPI), excluding volatile components such as food and energy prices, also showed a noticeable decrease from 3.9% to 3.5% (y/y).
The still high level of inflation in the services sector was disappointing. This indicator was higher than forecasted in the central bank's May report and amounted to 5.7% (y/y) against the expected 5.3%. "Indicators such as rent growth remain quite high. [...] These data confirm that the Bank of England will not lower rates at tomorrow's meeting," commented ING Bank strategists on the published statistics on June 19, and they were right.
At its meeting on Thursday, June 20, the Bank of England left the key interest rate unchanged for the seventh consecutive time, at 5.25%. Seven members of the Monetary Policy Committee voted for such a decision, two votes were cast for lowering the rate, and zero votes for increasing it. According to several policymakers, such a decision by the regulator was "finely balanced."
The latest data on inflation in the services sector is unlikely to prevent the BoE from starting a cycle of easing its monetary policy (QE) in the second half of the year. Especially since, according to the Committee members, the higher-than-expected CPI was due to one-off wage payment factors.
If the parliamentary elections in the UK on July 4 and the inflation report on July 17 do not present significant surprises, the Bank of England is expected to begin lowering rates as early as August. As ING Bank strategists write, "markets are pricing in a 43% probability of the first rate cut in August and expect easing by 46 basis points (bps) by the end of the year." TDS analysts, in turn, give the following forecast: "We expect a 15 bps rate cut by the August meeting and around 50 bps in total for 2024." Several other market participants' forecasts also suggest a reduction of about 30 bps by November.
On the day after the BoE meeting, Friday, June 21, the Office for National Statistics (ONS) published fresh data on retail sales in the UK, which were significantly higher than forecasted. In May, they increased by 2.9% (m/m) after falling by -1.8% in April, with markets expecting a growth of 1.5%. The core retail sales index, excluding automotive fuel, also grew by 2.9% (m/m) against a previous decline of -1.4% and a market forecast of 1.3%. Year-on-year, retail sales increased by 1.3% compared to April's decrease of -2.3%, while core retail sales rose by 1.2% (y/y) against -2.5% a month earlier.
Preliminary business activity (PMI) data were mixed. However, overall, they showed that the UK's economy is on the rise. PMI in the manufacturing sector increased from 51.2 to 51.4 points (forecast 51.3). Business activity in the services sector amounted to 51.2, below the previous value of 52.9 and the forecast of 53.0. The Composite PMI showed a slight decline to 51.7 against the forecast of 53.1 and 53.0 a month earlier. Despite the last two indicators being below previous values, they still remain above the 50.0 horizon separating economic growth from decline.
Against this backdrop, the pound attempted to recoup some losses but failed, and GBP/USD ended the week at 1.2643, turning strong support in the 1.2675 zone into resistance.
The analysts' forecast for the near term looks neutral: 50% of experts voted for the dollar to strengthen, while the same number (50%) preferred the British currency.
As for technical analysis on D1, the advantage is on the dollar's side. Among trend indicators, the ratio of forces between red and green is 75% to 25% in favour of the former. Among oscillators, 85% point south (a quarter signals the pair is oversold) and only 15% look north. If the pair continues to fall, it will encounter support levels and zones at 1.2575-1.2610, 1.2540, 1.2445-1.2465, 1.2405, and 1.2300-1.2330. In the event of the pair's growth, it will face resistance at levels 1.2675, 1.2740-1.2760, 1.2800-1.2820, 1.2850-1.2860, 1.2895-1.2900, 1.2965-1.2995, 1.3040, and 1.3130-1.3140.
As for the events of the coming week, not many are expected. Among the most important is the publication of the UK's GDP data on Friday, June 28.
USD/JPY: BoJ Rate Hike Chances Close to Zero
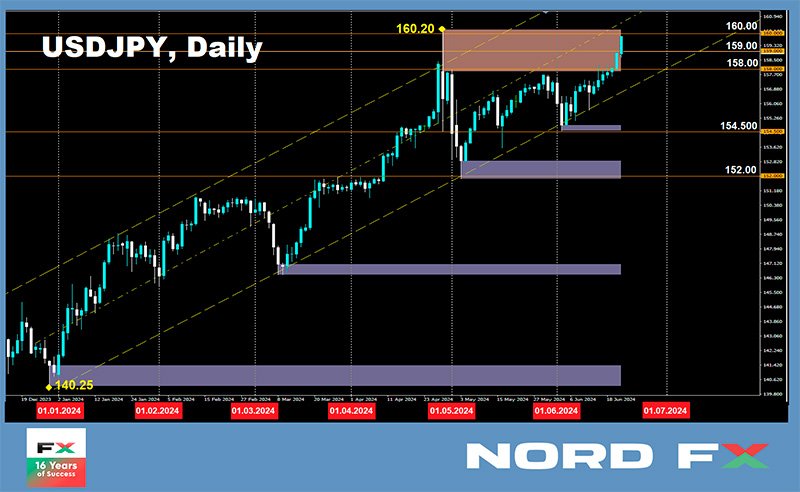
At its meeting on June 13-14, the Bank of Japan (BoJ) kept the interest rate unchanged at 0.1%. Recall that in March this year, the central bank made a "bold" move by raising the rate for the first time since 2007 (it had been at a negative level of -0.1% since 2016). However, after this single rate hike in 17 years, the BoJ is unlikely to continue raising it in the foreseeable future, no matter how much some analysts and investors might want it.
Such desires and forecasts are popular due to the very low level of the Japanese currency. In early 2011, USD/JPY traded around 76.00, and since then, the yen has weakened more than twofold – on April 29, 2024, the pair reached a level of 160.22, the highest since 1986. This negatively affects national businesses. The benefits of a weak yen for exports do not cover the negatives for imports, as the trade balance is negative; the country imports more than it exports. Expensive imports, primarily raw materials and energy, reduce production profitability. GDP growth rates are falling – in Q1 2024, this indicator showed an economic contraction to -1.8% (y/y) compared to +0.4% in the previous quarter. Additionally, the national debt relative to GDP is approaching 265%.
In such a situation, the economy needs support, not restraint by raising the key interest rate. Moreover, compared to other G10 countries, inflation in Japan is low and has been steadily declining in recent months. According to fresh data, the national CPI index, excluding food and energy prices, fell from 2.4% to 2.1%. Moreover, in June, it could fall below the BoJ's target level of 2.0%. Thus, combating inflation by raising rates is unnecessary and even harmful. But how can the yen's position be strengthened then?
Another method besides tightening monetary policy (QT) is currency interventions. Japan's top currency diplomat Masato Kanda stated on June 20 that the government "will respond carefully to excessive currency movements" and that he "has never felt limited in the potential for currency interventions" and that the interventions conducted in May "were quite effective in combating excessive currency movements caused by speculators."
The words are beautiful. However, looking at the chart, one would argue with the official about the effectiveness of the interventions. Of course, USD/JPY retreated from the 160.00 mark for a while. But this period was quite short, and now it is again approaching this height. One can also recall similar actions in previous years, which only temporarily restrained the national currency's weakening.
This time, it seems officials have come up with another way to increase the effectiveness of monetary policy without changing rates. According to Reuters, the Ministry of Finance's commission is likely to urge the government to issue shorter-maturity debt obligations to reduce the risk of interest rate changes. (For reference, the yield on 10-year Japanese government bonds currently exceeds 0.9%, nine times the central bank's rate).
The last chord of the past week for USD/JPY was set at 159.79. The continuation of the Fed's tight policy, confirmed at the June meeting, and the BoJ's ongoing soft policy still play in favour of the dollar. (Although, of course, new currency interventions are not excluded). Economists from Singapore's United Overseas Bank (UOB) believe that only a breakthrough of support at 156.50-156.80 will indicate that the pair's current upward momentum has faded.
The median forecast of experts for the near term is as follows: 75% of them voted for the pair's move south and the yen's strengthening (apparently expecting new interventions), while the remaining 25% pointed north. Indicators show the opposite picture; they have not even heard about interventions. Therefore, all 100% of trend indicators and oscillators on D1 are green, although 20% of the latter are in the overbought zone. The nearest support level is around 158.65, followed by 157.60-158.20, 156.80-157.05, 156.00-156.10, 155.45-155.80, 154.50-154.70, 153.60, 152.85, 151.85, 150.80-151.00, 149.70-150.00, 148.40, 147.60, and 146.50-147.10. The nearest resistance is in the 160.00-160.20 zone, followed by 162.50.
The upcoming week looks busy on Friday, June 28. On this day, data on consumer inflation (CPI) in the Tokyo region will be published, as well as data on industrial production volumes and the labour market situation in Japan. No other important economic statistics are planned for the coming days.
CRYPTOCURRENCIES: Patience, Patience, and More Patience
In the last review, we published a forecast by MN Capital founder Michael van de Poppe, who expected BTC/USD to fall to the $60,000-65,000 range. The analyst was essentially correct – the week's low was recorded on Friday, June 21, when the price dropped to around $63,365.
This time, we want to draw attention to the forecast of another influencer, the president of Euro Pacific Capital and a fierce opponent of cryptocurrencies, Peter Schiff. We have quoted his apocalyptic predictions multiple times. This time, the financier outlined a possible hedge fund strategy that would lead to bitcoin's collapse. According to him, investors in exchange-traded BTC spot ETFs treat digital gold as a speculative asset. Schiff noted that bitcoin has been in a "sideways" trend for the third month, trading below the March high. With such dynamics, investors might lose patience and decide to close positions at some point, causing BTC quotes to collapse amid a lack of liquidity.
It must be said that Schiff's negative forecast has some basis – in recent days, American spot Bitcoin ETFs have indeed shown an outflow of funds. Since June 7, their cumulative balance has decreased by $879 million to $15 billion. Over the past two weeks, long-term whale holders have sold digital gold worth $1.2 billion, with more than $370 million attributed to GBTC. Thus, whales and ETFs have collectively created downward pressure worth $1.7 billion during this time.
Of course, a cryptocurrency market crash is unlikely, no matter how much Peter Schiff might want it. However, the current situation raises concerns among many specialists. Usually, bullish cryptocurrency markets are fueled by general enthusiasm around the digital coin. However, analysts at IntoTheBlock observe that despite a surge in activity among major holders (whales) earlier this year, there is no influx of new participants in the market. In fact, the number of primary BTC users has sharply dropped to multi-year lows, falling to levels seen during the bear market of 2018. This lack of growth creates a critical misunderstanding of why investors are not buying bitcoins. "Retail investors remain on the sidelines," IntoTheBlock notes.
Perhaps it is all due to the relaxed summer mood, general macroeconomic gloom, lack of sources of fresh money inflow, and other drivers. But everything can change, of course. Speaking at the BTC Prague 2024 conference, MicroStrategy CEO Michael Saylor reiterated that bitcoin should be considered one of the safest assets today. When asked by journalists whether it is time to sell BTC, the entrepreneur replied that the asset currently lacks fundamental growth catalysts, but a price rise should be expected soon. According to Michael Saylor, those who show patience will later receive enormous profits from owning digital gold. (For reference: MicroStrategy is the largest holder of bitcoins among public companies, with 205,000 BTC on its balance sheet, worth over $13 billion).
Analysts at the financial company Bernstein have raised the target price of the first cryptocurrency to $200,000 by the end of 2025. The forecast is driven by expectations of "unprecedented demand from spot bitcoin ETFs managed by BlackRock, Fidelity, Franklin Templeton, and others." "We believe that ETFs have become a turning point for cryptocurrencies, causing structural demand from traditional pools of capital. In total, ETFs have attracted around $15 billion in new net funds," Bernstein's explanatory note reads.
According to the company's experts, bitcoin is in a new bullish cycle. They called the halving a unique situation where natural selling pressure from miners is halved or more, and new demand catalysts for cryptocurrency appear, leading to exponential price movements. Analysts pointed to previous cycles: in 2017, digital gold rose to a high roughly five times the marginal production cost and then fell to a low of 0.8 of this figure in 2018. "During the 2024-2027 cycle, we expect bitcoin to rise to 1.5 times this metric, implying a cycle high of $200,000 by mid-2025," Bernstein believes.
For now, at the time of writing, on the evening of Friday, June 21, the BTC/USD pair is far from $200,000 and trades at $64,150. The total cryptocurrency market capitalization stands at $2.34 trillion ($2.38 trillion a week ago). The Bitcoin Fear & Greed Index dropped from 70 to 63 points over 7 days but remains in the Greed zone.
To conclude the review, here's news from the world of Artificial Intelligence. For many years, there have been ongoing debates about the imperfections of the first cryptocurrency's concept. Some accuse the coin's creator, Satoshi Nakamoto, of shortsightedness, while others criticize the project's technical execution. To find out what's wrong with bitcoin, the editorial team at BeInCrypto asked the latest version of ChatGPT to analyze the cryptocurrency's whitepaper published by Nakamoto in October 2008. As a result, Artificial Intelligence found several shortcomings and errors in the main document of the crypto industry, some of which seem quite serious:
1. The 51% rule. The whitepaper claims that the network is secure if more than 50% of the power is controlled by honest participants. However, practice has shown that under certain conditions, attacks are possible with fewer resources.
2. Anonymity. The document mentions user anonymity, but bitcoin provides only pseudonymity. Transactions can be traced back to specific users.
3. Scalability. The document did not foresee scalability issues that became apparent with the network's popularity growth. High transaction volumes lead to delays and increased fees.
4. Software updates. The document does not address the need for regular software updates to maintain network security and implement new features.
5. Fork resistance. The document does not consider risks associated with network hard forks. Forks like Bitcoin Cash polarize the community, potentially reducing the network's value.
6. Regulation and legal issues. The document does not mention potential legal and regulatory obstacles for bitcoin. Since its publication, many countries have introduced or are considering regulatory measures.
7. Mining difficulty. The document's author did not foresee the significant increase in mining difficulty and the energy consumption changes. Modern mining requires enormous computing power and electricity. According to Greenpeace, in 2023, global bitcoin mining consumed approximately 121 TWh of electricity, comparable to the energy consumption of a country like Poland. This has led to significant CO2 emissions and serious atmospheric pollution, as stated in Greenpeace's report.
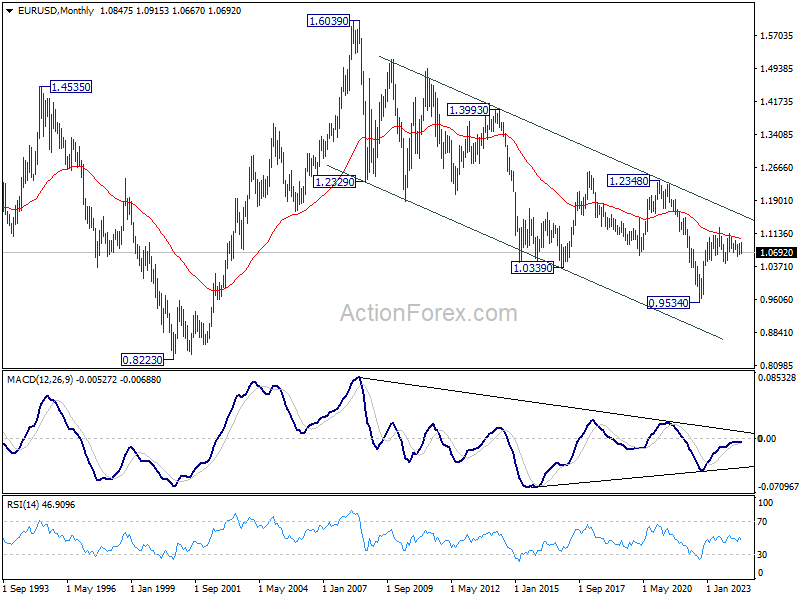
EUR/USD Weekly Outlook
EUR/USD stayed in consolidation above 1.0667 last week and outlook is unchanged. Initial bias remains neutral this week first and further fall is expected with 1.0760 resistance intact. Decline from 1.0915 is seen as another leg in the larger corrective pattern. Break of 1.0667 will target 1.0601 and below.
In the bigger picture, price actions from 1.1274 are viewed as a corrective pattern that's still in progress. Break of 1.0601 will target 1.0447 support and possibly further to 100% projection of 1.1274 to 1.0447 from 1.1138 at 1.0311. For now, this will remain the favored case as long as 1.0915 resistance holds, in case of rebound.
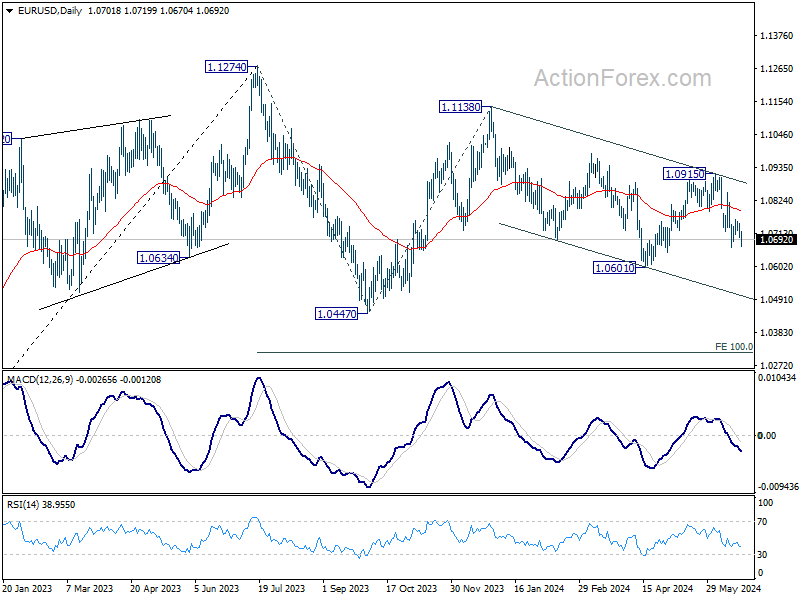
In the long term picture, a long term bottom is in place at 0.9534 (2022 low). But considering that upside is still capped below 55 M EMA (now at 1.1018), there is no sign of trend reversal yet. Down trend from 1.6039 (2008 high) could resume at a later stage if current selloff picks up momentum.

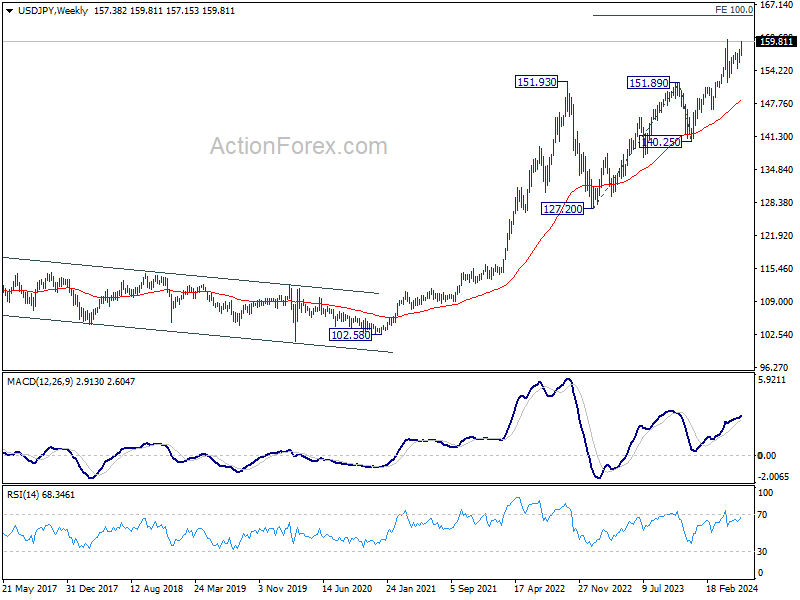
USD/JPY Weekly Outlook
USD/JPY's rise from 151.68 accelerated to as high as 159.81 last week and there is no clear sign of topping yet. Initial bias remains on the upside this week for 160.20 high, or possibly to 100% projection of 151.86 to 157.70 from 154.53 at 160.37. But upside should be limited there, at least on first attempt. On the downside, below 158.24 minor support will turn intraday bias neutral first. However, decisive break of 160.37 will pave the way to 161.8% projection at 163.97.
In the bigger picture, there is no sign of long term trend reversal yet. Further rally is expected as long as 150.87 resistance turned support holds. Decisive break of 160.02 will target 100% projection of 127.20 to 151.89 from 140.25 at 164.94.
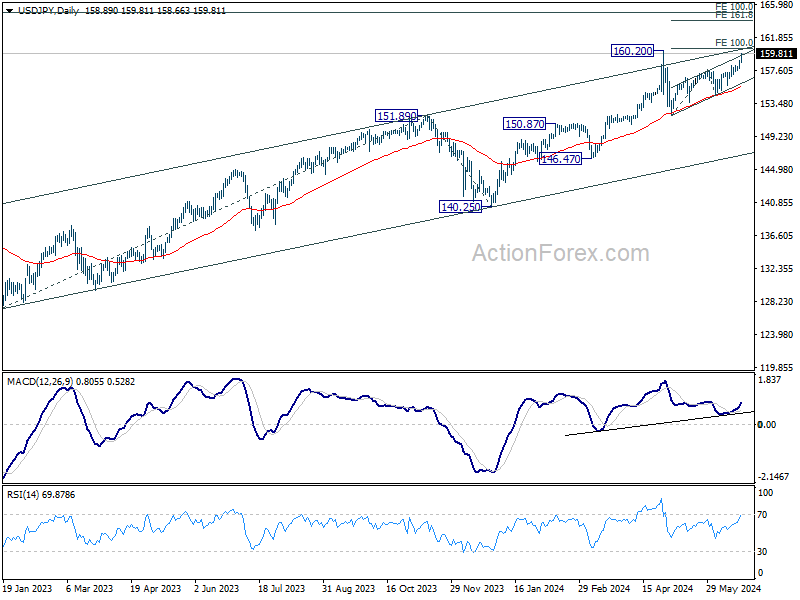
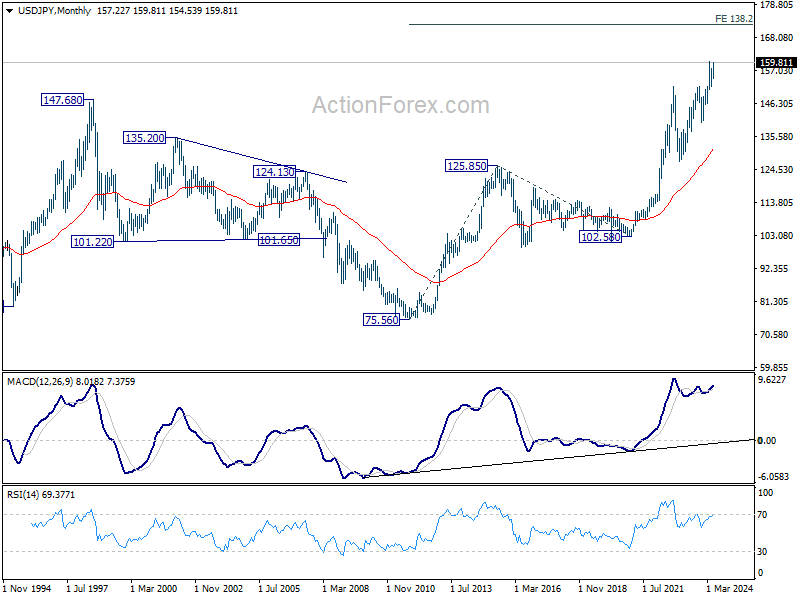
In the long term picture, as long as 140.25 support holds, up trend from 75.56 (2011 low) is still in progress. Next target is 138.2% projection of 75.56 (2011 low) to 125.85 (2015 high) from 102.58 at 172.08.