Sample Category Title
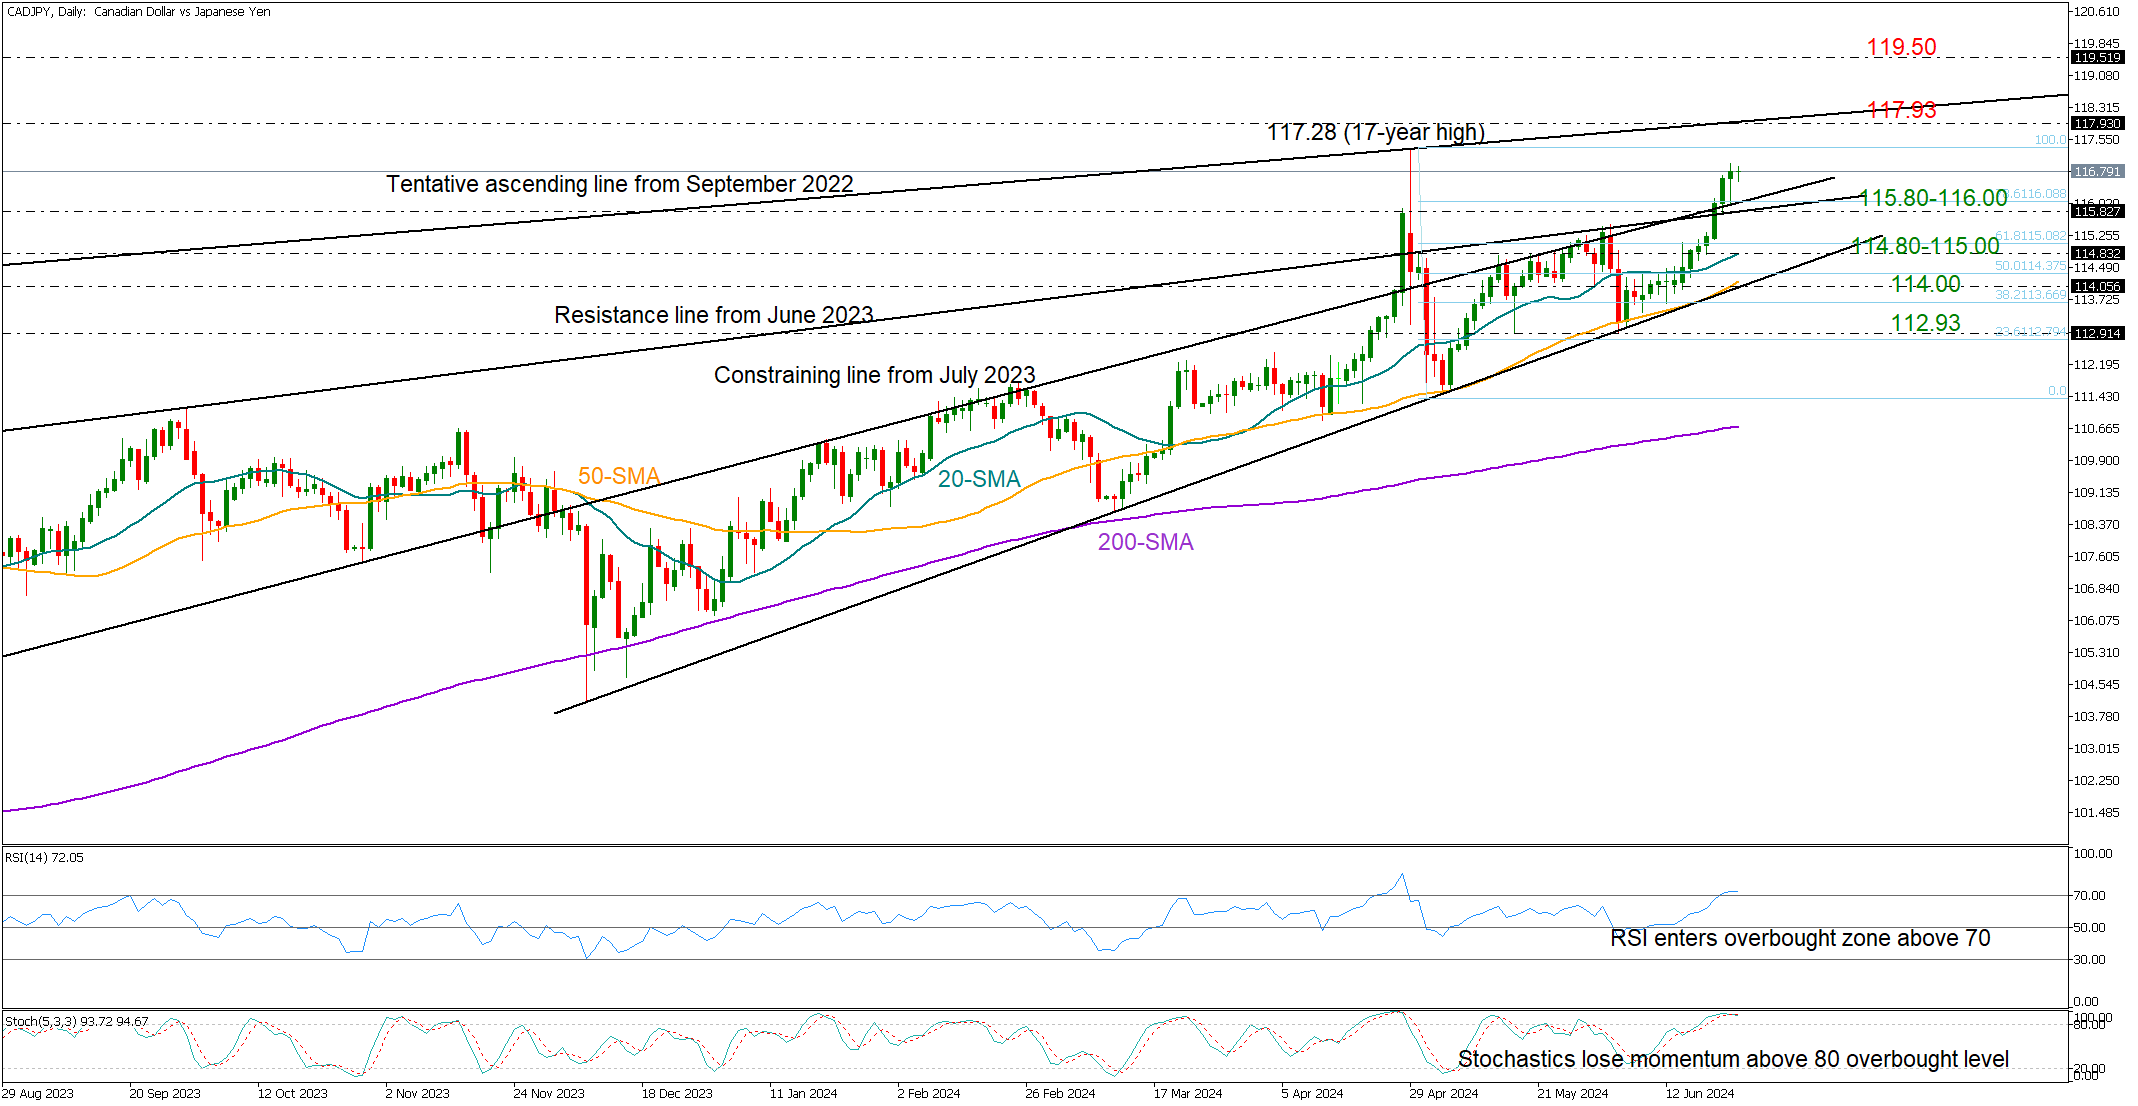
CADJPY Aims for April’s Multi-Year High
- CADJPY surpasses key resistance levels, but enters overbought zone
- Next resistance at 117.93; support at 115.80-116.00
- Canadian CPI inflation due for release at 12:30 GMT
CADJPY is in the third consecutive week of gains, having experienced an impressive rally to almost reach the 117.00 round level following the rebound near the 50-day simple moving average (SMA) at 113.20.
The bulls accelerated successfully above April’s closing price of 115.78 last Friday, surpassing the constraining lines from the summer of 2023. The focus is now on the 117.28 top and the ascending line, which connects the 2022 and 2024 highs at 117.93. A move higher could take a rest near the 119.50 barrier taken from October-November 2007, while a steeper increase could halt near the 121.00 round mark, where the 161.8% Fibonacci extension of May’s sharp downfall is located.
Based on the RSI and stochastic oscillator, the market is in an overbought state. Hence, the bulls might have limited room for improvement, though only a step below the 115.80-116.00 region could give the lead to the bears.
If the price tumbles below 115.80, the decline could stretch into the 114.80-115.00 territory, where the 20-day SMA is located. A step lower could then re-challenge the key 50-day SMA and the long-term support trendline at 114.00, a break of which could cause an aggressive downfall towards the 112.93 base.
Despite trading within bullish territory, CADJPY’s recent price surge might encourage some investors to take profits. A break below 115.80 could neutralize the short-term outlook again.
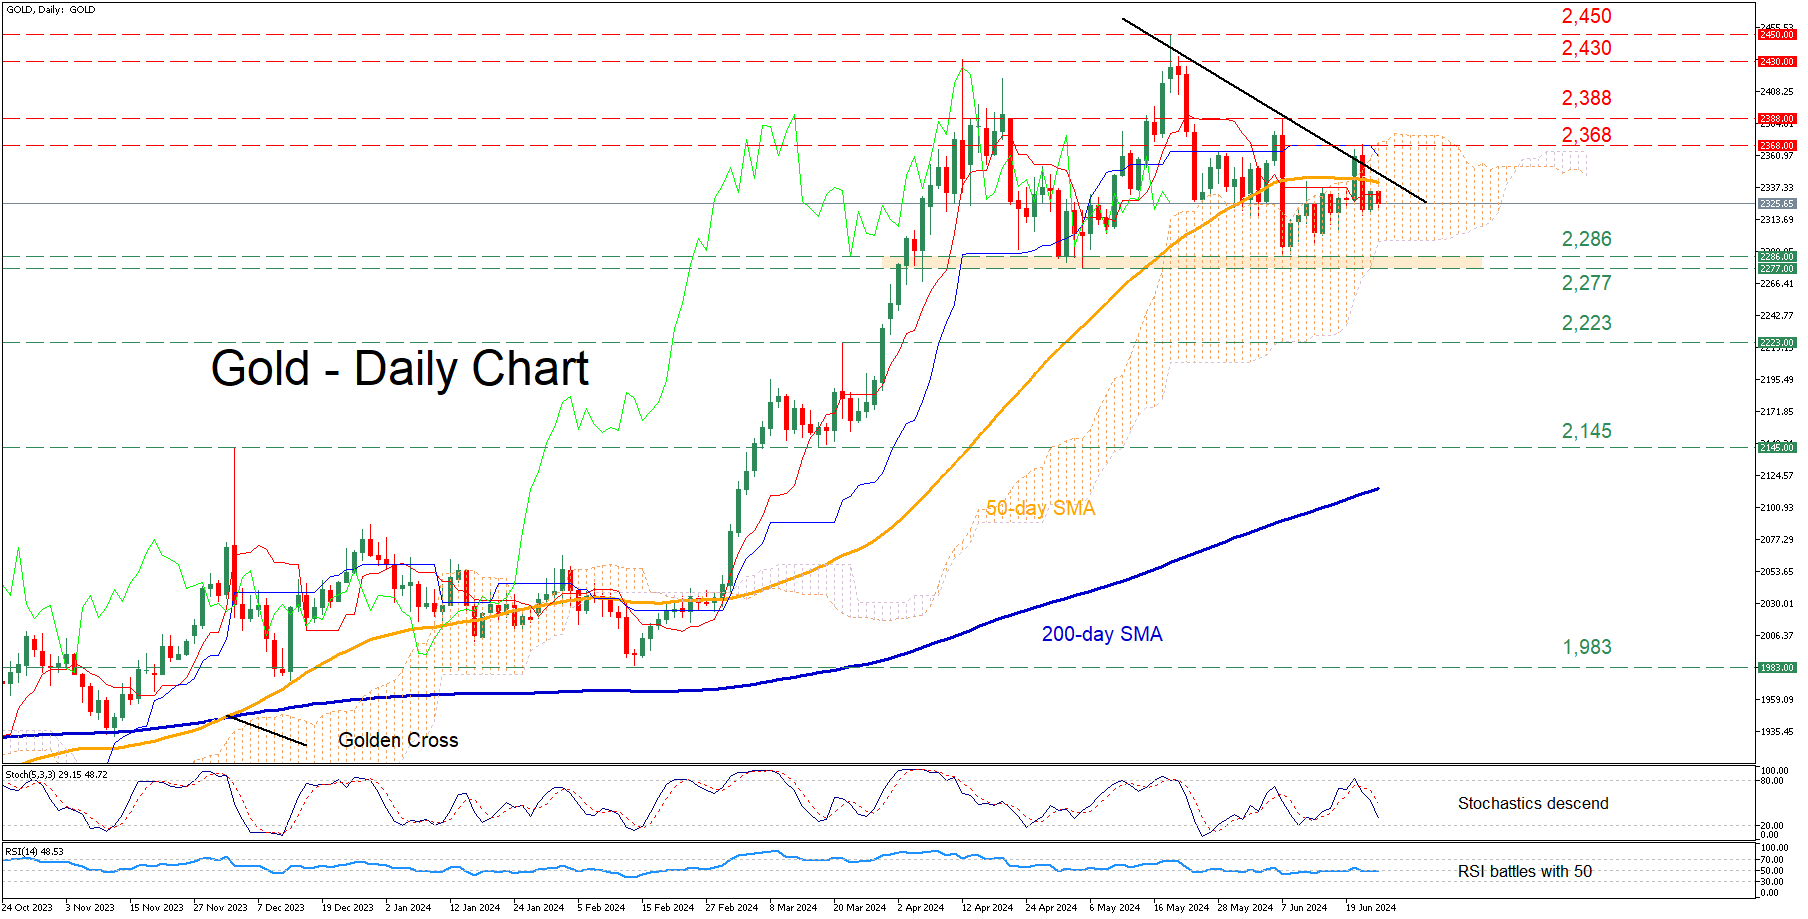
Gold Reverses Back Below 50-day SMA
- Gold retreats after unsuccessful break above 50-day SMA
- The price extends its structure of lower highs
- Momentum indicators turn bearish
Gold had been in a steady recovery from its recent one-month low, which led to the price closing above its 50-day simple moving average (SMA) last Thursday. Despite the violation of that crucial hurdle, bullion reversed back lower after failing to jump above the upper end of the Ichimoku cloud.
Should the latest weakness persist, initial support could be found at the 2,286-2,777 range, defined by the May and June lows. Sliding beneath that zone, the price could challenge the March resistance of 2,223, which could serve as support in the future. Further declines could then stall at 2,145, a region that has acted both as support and resistance in recent months.
On the flipside, if the price rotates back above the 50-day SMA, the latest rejection region of 2,368 could prove to be the first barricade for the bulls to overcome. Higher, the June peak of 2,388 may prevent further upside attempts ahead of the April high of 2,430. Failing to halt there, the price might revisit its record high of 2,450.
In brief, gold dipped below its 50-day SMA, extending its structure of lower highs. Therefore, a solid move above the restrictive trendline drawn by connecting these lower highs is needed for the price to escape its short-term bearish pattern.
Japanese Yen Technical Outlook: USD/JPY, EUR/JPY & GBP/JPY
- FX intervention chatter returns, but is it enough for the ailing JPY?
- USD/JPY at psychological 160.00 handle.
- EUR/JPY prints morningstar candlestick pattern, hinting at the potential for further upside.
Fundamental Overview
The Japanese Yen continues to tread water against its G 7 peers as its monetary policy stance continues to be scrutinized. Many analysts, myself included, had hoped for a bold approach from Bank of Japan (BoJ) Governor Ueda at the June meeting of the BoJ.
The Governor however opted to remain cautious given the existential risks which have become a hot topic for central banks globally. Following a swathe of Central Bank meetings in June, the one commonality seems to be the uncertainty from the global geopolitical sphere, which many central banks see as the main risk for the second half of 2024.
Since the BoJ meeting in June, the Japanese Yen has come under renewed selling pressure. FX intervention has been used in the past by the central bank, but this doesn’t seem to have a lasting impact anymore.
Comments from policymakers and Japanese officials have had a similarly lackluster impact of late. Thus the comments this morning from top FX diplomat Masato Kanda is unlikely to rescue the ailing JPY. Mr Kanda stated authorities are prepared to step in to support the Japanese yen 24 hours a day, if necessary, the Yen was trading below 160 per US dollar and remains there for now. This was followed by comments this morning from Moody’s Analyst Christian De Guzman, who stated that the BoJ is likely to take time raising interest rates. Another hint that market participants may be in for a bumpy ride when it comes to the Japanese Yen in the coming months.
The Week Ahead: Japanese and US Inflation Data
Looking ahead to the rest of the week, there is a fair bit of data which could have an impact on Japanese Yen pairs. Most notably the US PCE data (Federal Reserve’s preferred inflation gauge) and of course the Japanese unemployment rate and Tokyo inflation numbers. ANy increase in the PCE number or a print above estimates could lead to US dollar strength as market participants may view it as a sign that rates may remain higher for longer.
The Japanese unemployment data may prove key as one of the sticking points for BoJ Governor Ueda has been improving wage growth. A rise in unemployment may signal that wage growth may remain stagnant while a drop in unemployment could be seen as signs of a tight labor market which usually results in upward pressure on wage growth.
Finally, geopolitics remains a significant focus, and this week could be pivotal for developments in the Middle East. Any increase in tensions between Israel and Hezbollah might drive investors toward safe-haven assets. Additionally, the week concludes with the first round of the French Parliamentary elections which could have a lasting impact on the Euro and by extension EUR/JPY moving forward.
Japanese Yen Technical Outlook
USD/JPY
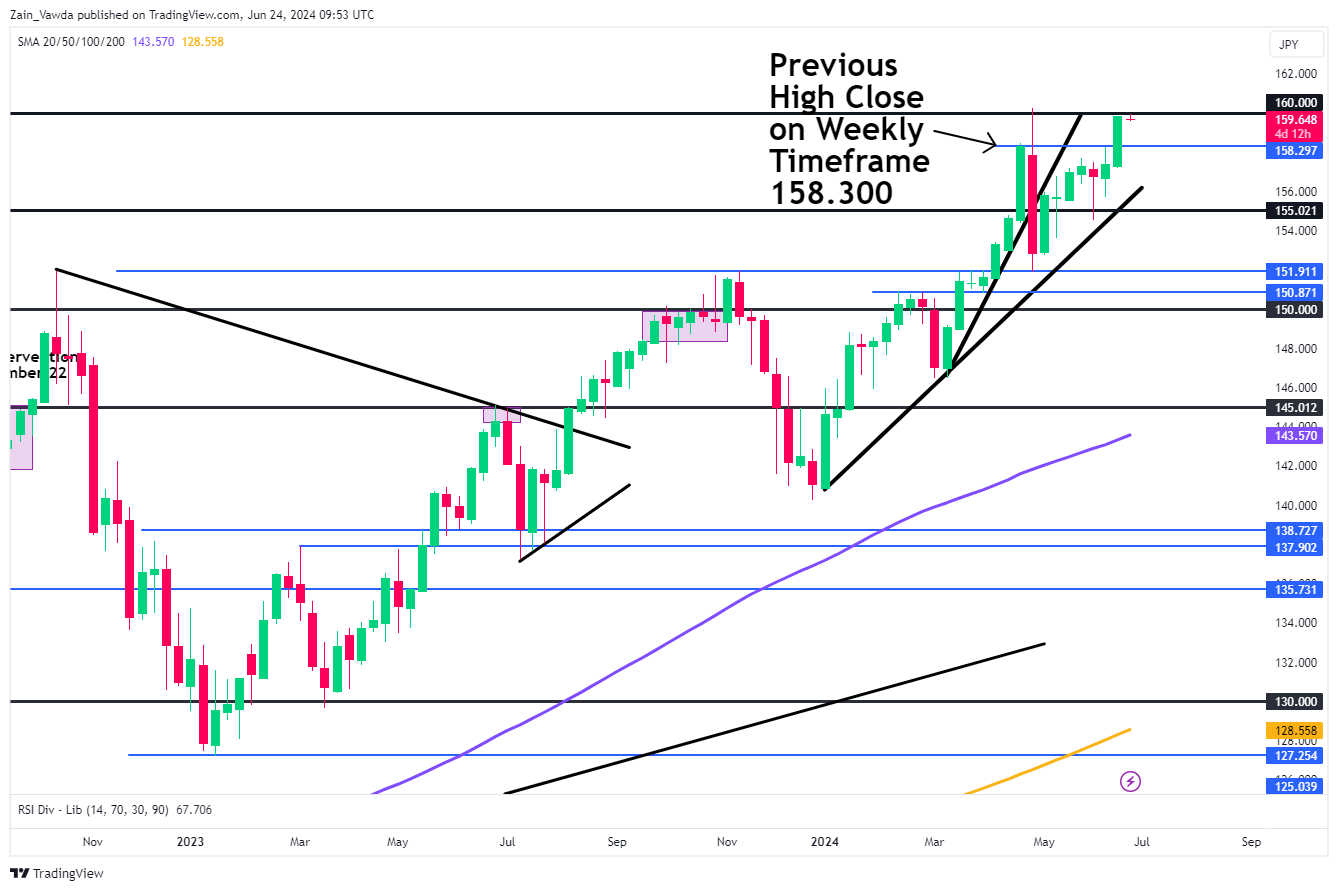
Looking at USDJPY from a technical perspective, the weekly chart below shows a very bullish close last week with no wick to the upside. This is usually a sign of the momentum in play and this is also the first time the weekly candle has closed above 158.300 (the previous weekly candle high close).
USD/JPY Weekly Chart – June 24, 2024
Source: TradingView.Com (click to enlarge)
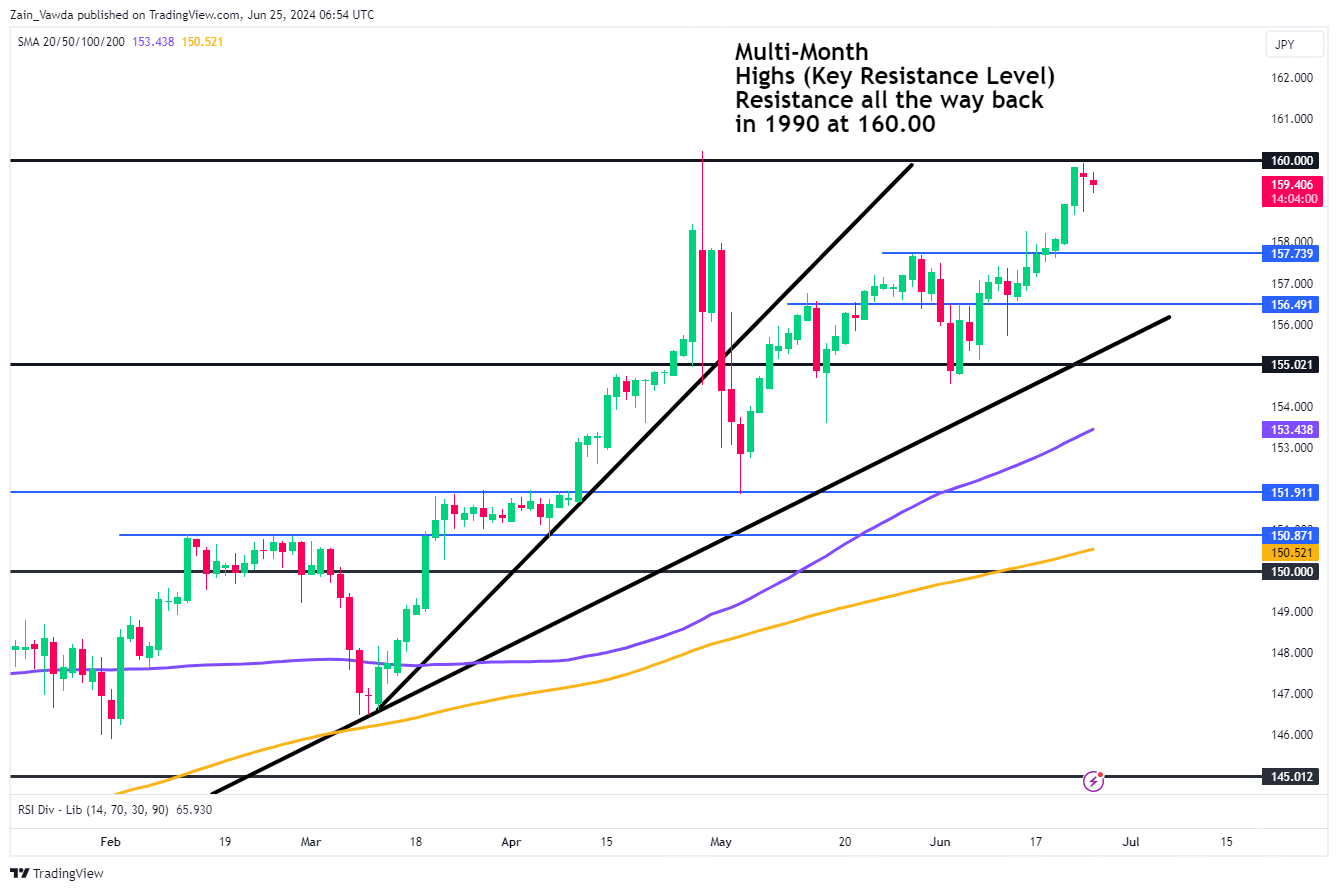
Dropping down to the daily timeframe and here it is a bit more indecisive. Despite ending the previous week on a bullish note, Sunday saw USD/JPY gap down at the market open. This has been followed by a gradual push lower throughout the early part of the European session, thanks in large part to US dollar weakness rather than intervention hopes.
Looking ahead and should USD/JPY continue to fall, immediate support rests at 158.300 with the next key area of support resting at 157.739. A break of these levels opens up a test of 156.50 and of course the psychological 155.000 handle.
To the upside, the outlook remains more uncertain as we do not have a lot in the way of historical price action to pay attention to. The first thing that needs to happen if USD/JPY is to continue higher is a daily candle close above the 160.oo psychological mark. This would be a huge milestone and could facilitate further upside for USD/JPY.
USD/JPY Daily Chart – June 24, 2024
Source: TradingView.Com (click to enlarge)
EUR/JPY
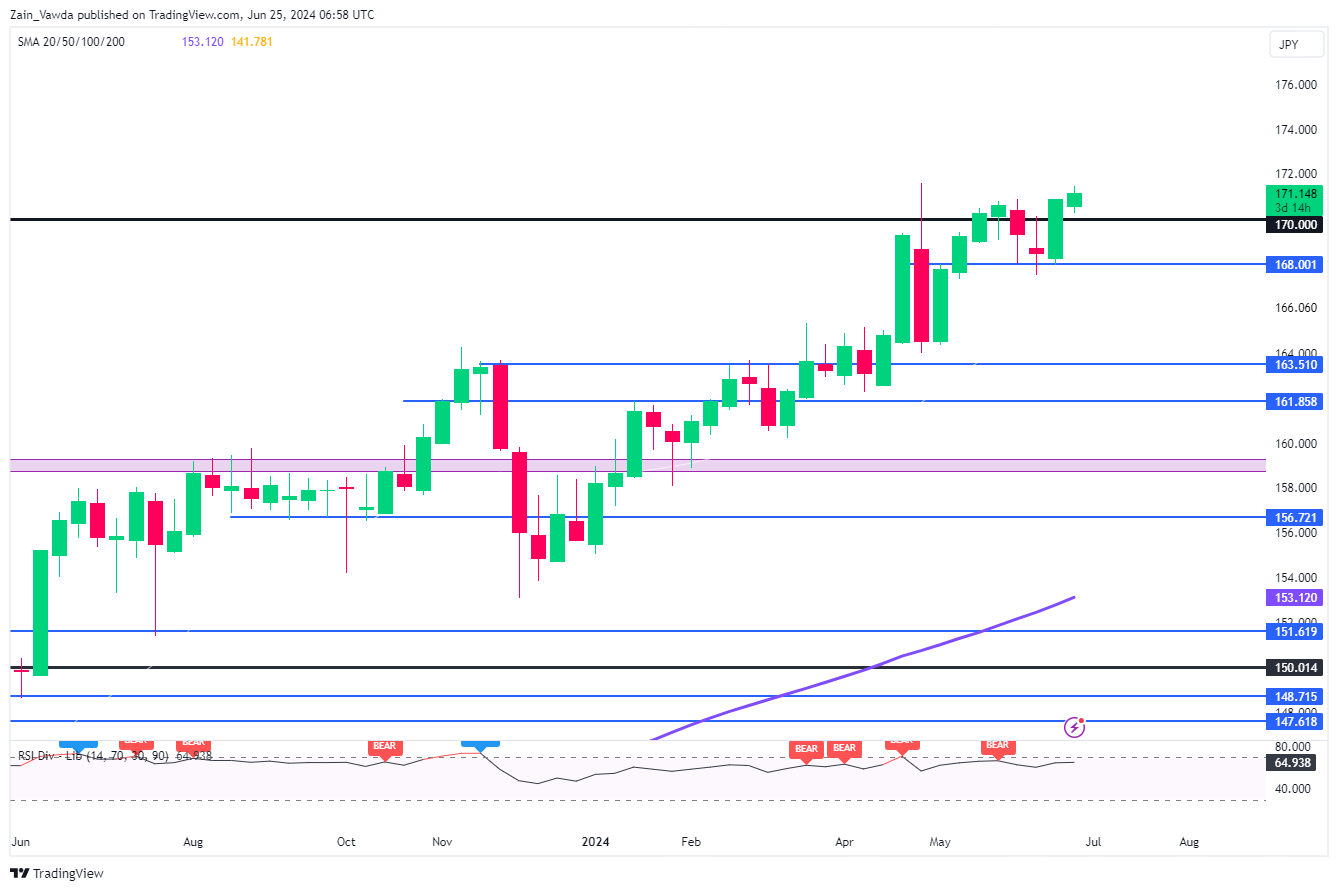
EUR/JPY on a weekly timeframe printed a bullish engulfing candle to close out last week while also closing above a key resistance level at the 170.00 handle. The weekly close looks to have a morningstar candlestick pattern hinting at further upside.
EUR/JPY Weekly Chart – June 25, 2024
Source: TradingView.Com (click to enlarge)
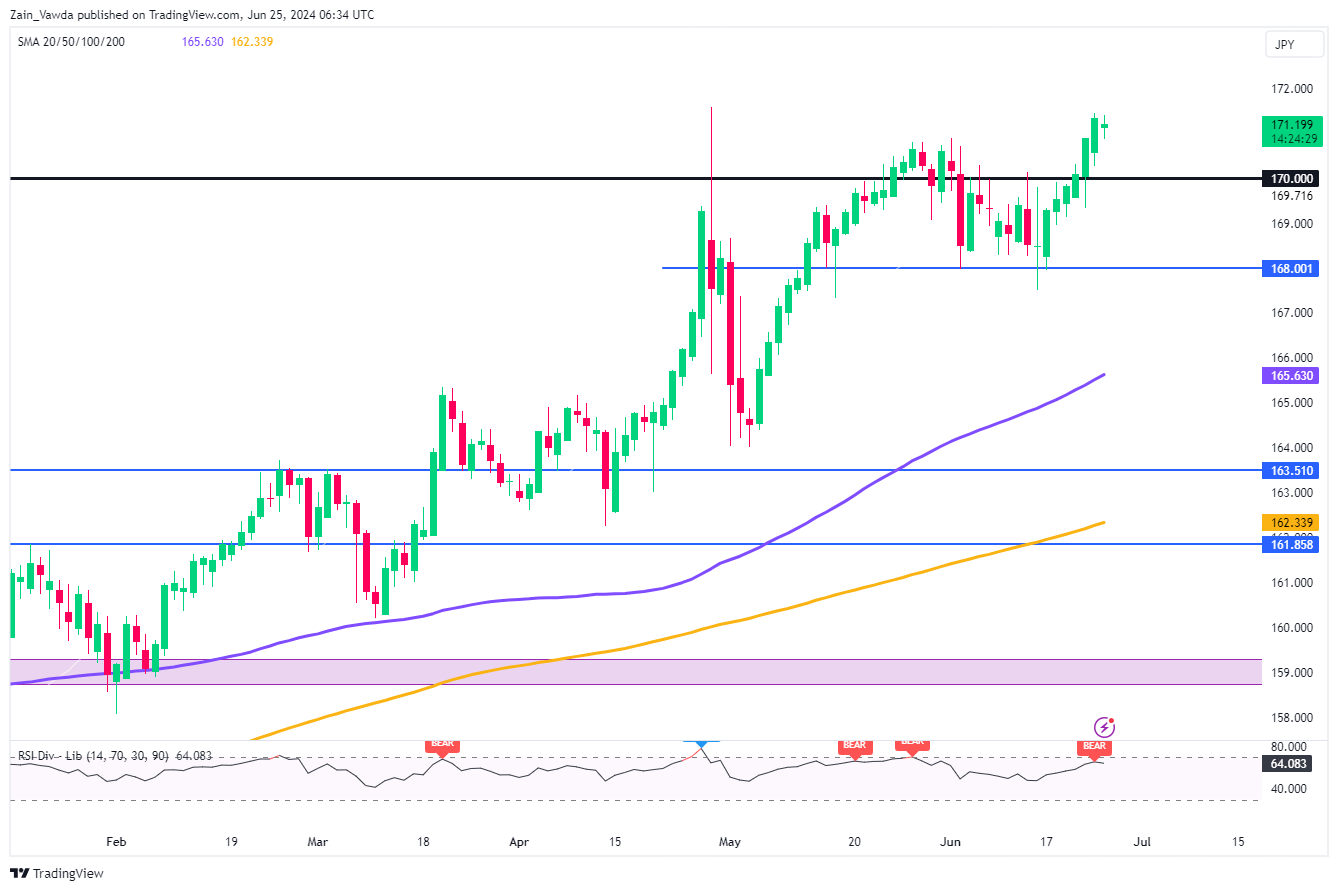
Dropping down to a daily timeframe and similar to USD/JPY, there is not much in terms of recent or historical price data above the 170.00 handle. Thus looking at the technical should EUR/JPY continue higher may prove challenging.
A retracement from here however, first has to navigate the 170.00 resistance now turned support area, before focus turns to the 168.00 handle and the 100-day MA at 165.63.
EUR/JPY Daily Chart – June 25, 2024
Source: TradingView.Com (click to enlarge)
GBP/JPY
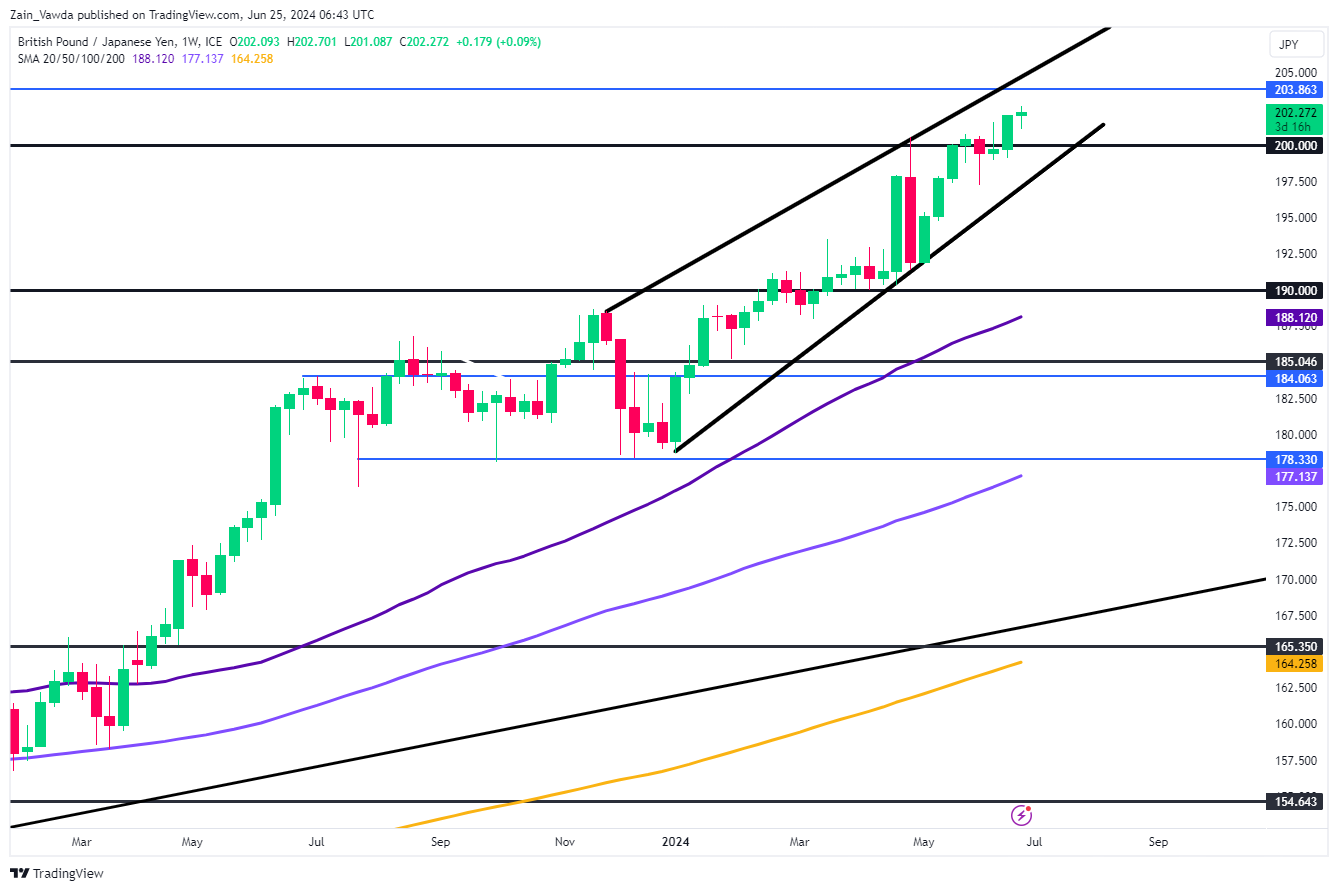
The Weekly timeframe on GBP/JPY echoes its counterparts with a bullish engulfing candle to round out last week. The weekly candle also closed convincingly above the 200.00, having done so only once previously (last week of May). This could prove significant with the engulfing candle hinting at some upside in the week ahead.
GBP/JPY Weekly Chart – June 25, 2024
Source: TradingView.Com (click to enlarge)
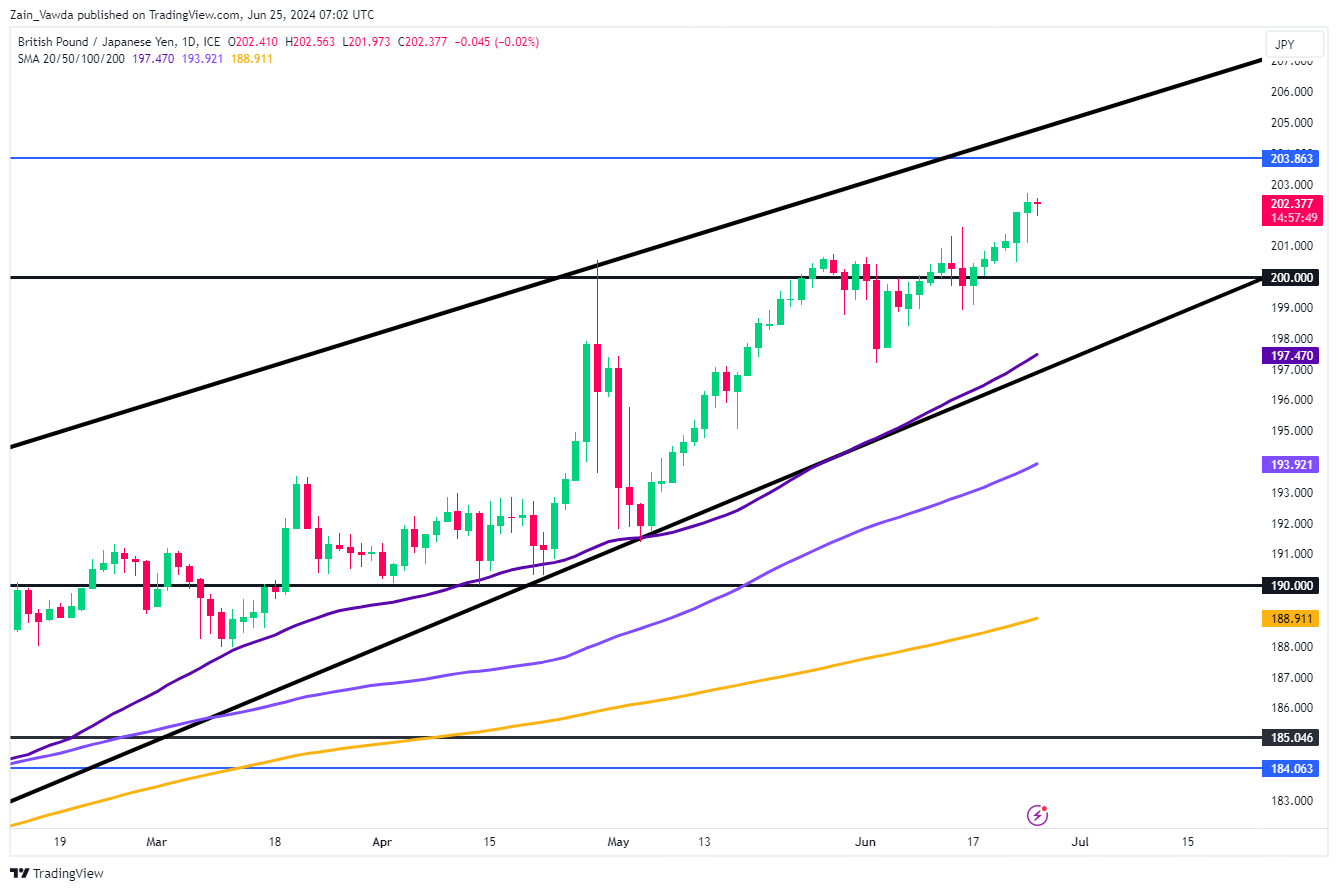
The key difference between EUR/JPY, USD/JPY and GBP/JPY is that the latter actually has some historic price action we may gauge above the 200.00 handle. Having taken a comprehensive look, immediate resistance rests at 203.86 before the psychological 205.00 handle comes into focus.
There is also a rising wedge formation in play, a break of which could lead to an extended move to the downside. A breach of 200.00 opens up a retest of the 50-day MA which rests toward the lower end of the wedge around 197.50, with the 100-day further down at 193.90.
GBP/JPY Daily Chart – June 25, 2024
Source: TradingView.Com (click to enlarge)
Dollar Declines: How Deep Could the Correction Be?
By the end of last week, the American currency traded rather mixed:
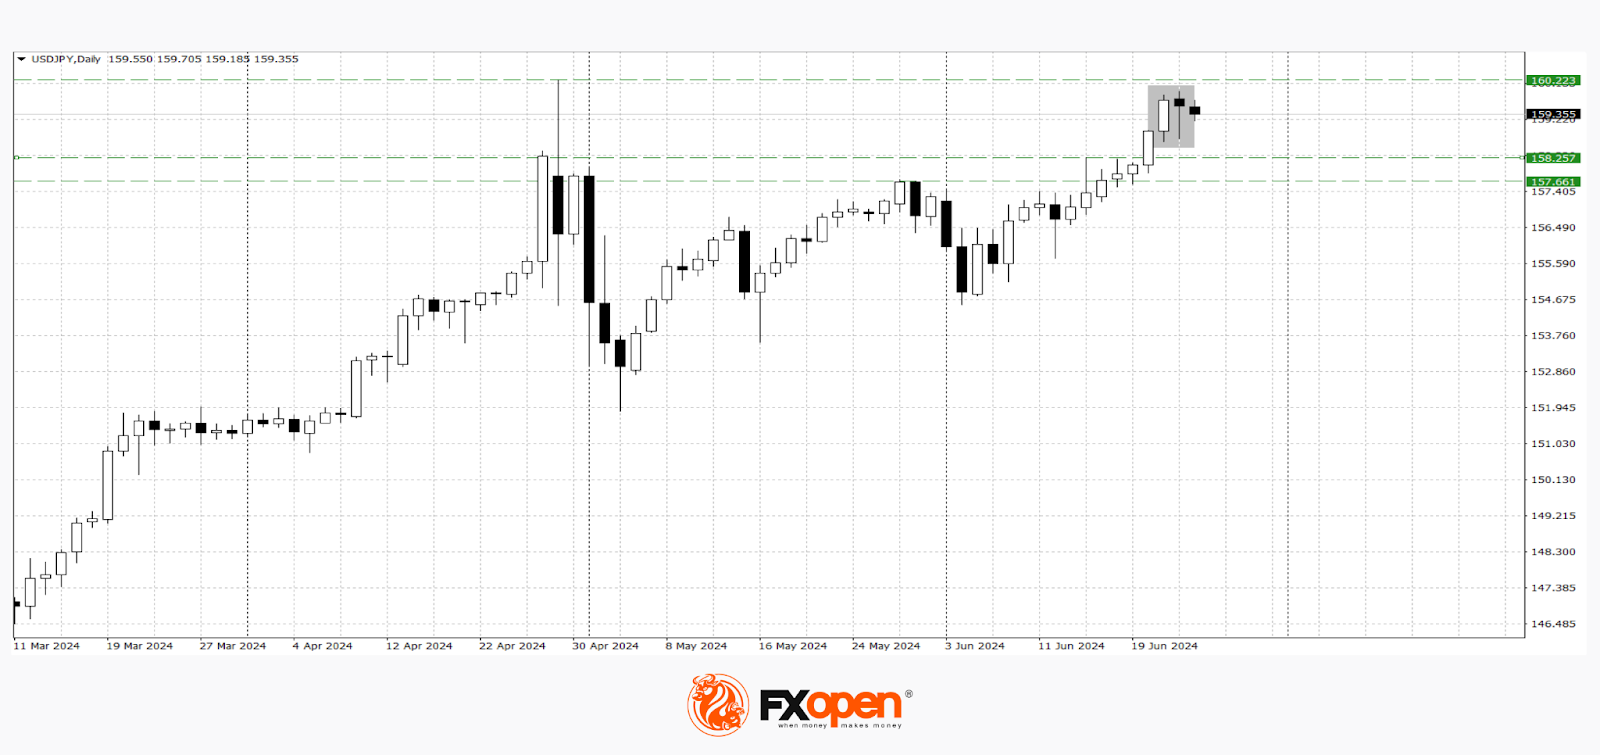
- The USD/JPY currency pair strengthened by more than 200 pips and almost tested the significant resistance level at 160.00.
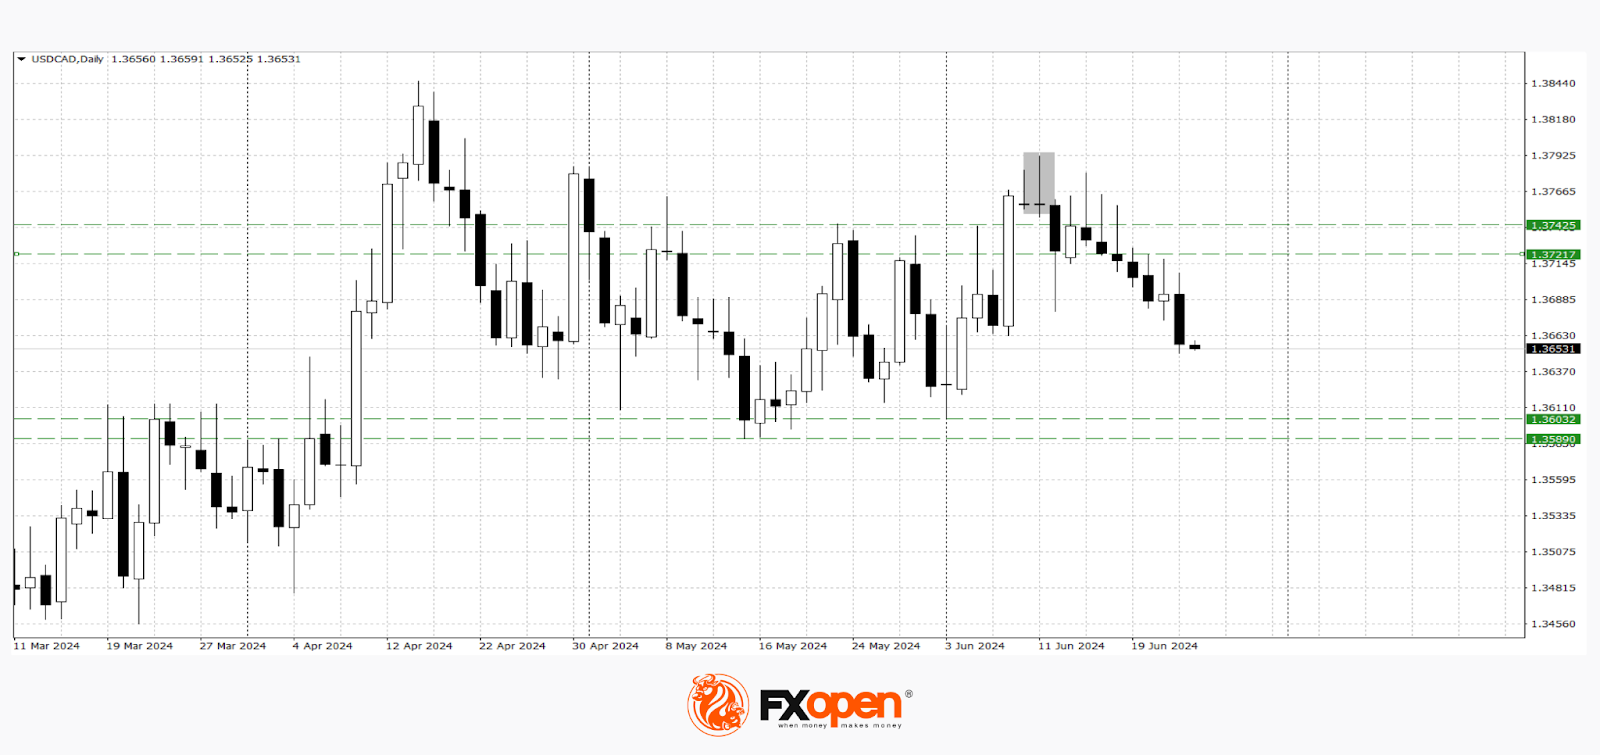
- The USD/CAD pair failed to break out of the medium-term flat corridor of 1.3740-1.3620.
- Sellers of the pound in the GBP/USD pair tried to push through the support at 1.2620-1.2600 but were unsuccessful.
However, despite recent successes, the upward momentum of dollar bulls began to slow down yesterday. In some directions, we observe a slowdown in the growth of the USD, and in some, reversal patterns have already formed.
USD/CAD
Last week, the range of 1.3740-1.3720 became a barrier to the resumption of growth in the USD/CAD pair. According to the technical analysis of USD/CAD, we observe the execution of the bearish pattern "shooting star" from 11 June. The nearest range where the price may fall within the execution of this pattern is 1.3600-1.3580. A resumption of the upward movement is possible after a confident strengthening above 1.3740. Events that could affect the pair's price formation include:
- Today at 14:00 (GMT +3:00), a speech by Michelle Bowman, a member of the US Federal Open Market Committee (FOMC).
- Today at 15:30 (GMT +3:00), the release of Canada's core consumer price index (CPI) for May.
- Today at 17:00 (GMT +3:00), the release of the US CB consumer confidence index for June.
USD/JPY
As expected, the USD/JPY pair managed to get as close as possible to 160.00, with yesterday's high recorded at 159.92. It failed to update April's high of the current year, and the price sharply bounced back from 159.92, losing over 100 pips in just a few hours.
According to the technical analysis of USD/JPY, a downward correction is possible in the coming trading sessions, as the "hanging man" pattern has formed on the daily timeframe. The execution of this pattern may contribute to a price decline towards recent lows at 158.20-157.70. A move and consolidation above 160.20 may lead to exponential growth of the pair towards historical highs.
Trade over 50 forex markets 24 hours a day with FXOpen. Take advantage of low commissions, deep liquidity, and spreads from 0.0 pips. Open your FXOpen account now or learn more about trading forex with FXOpen.
This article represents the opinion of the Companies operating under the FXOpen brand only. It is not to be construed as an offer, solicitation, or recommendation with respect to products and services provided by the Companies operating under the FXOpen brand, nor is it to be considered financial advice.
GBP/JPY Daily Outlook
Daily Pivots: (S1) 201.51; (P) 202.11; (R1) 203.09; More...
Intraday bias in GBP/JPY remains on the upside for 61.8% projection of 191.34 to 200.72 from 197.18 at 202.97. Firm break there will pave the way to 100% projection at 206.56 next. on the downside, below 200.46 minor support will turn intraday bias neutral first. But outlook will remain bullish as long as 198.90 support holds, in case of retreat.
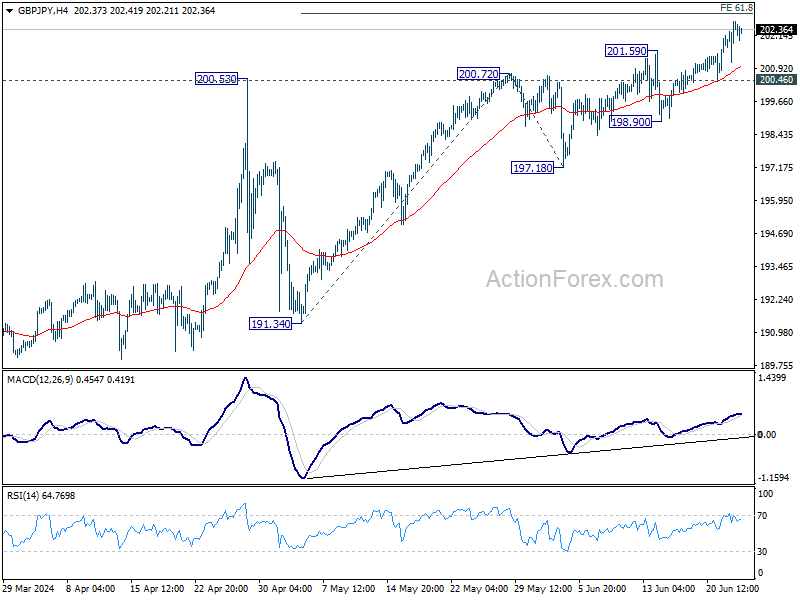
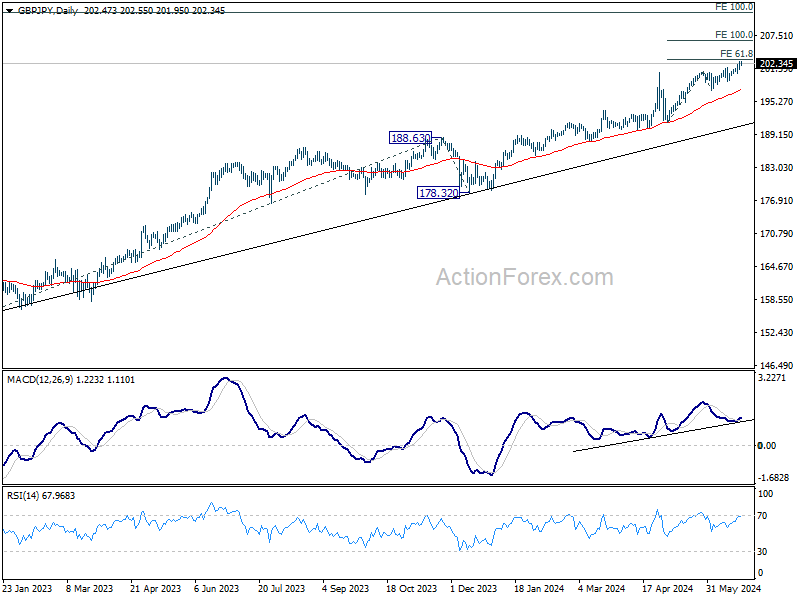
In the bigger picture, long term up trend is still in progress. Next target is 100% projection of 155.33 to 188.63 from 178.32 at 211.62. Outlook will stay bullish as long as 191.34 support holds, even in case of deep pullback.
EUR/JPY Daily Outlook
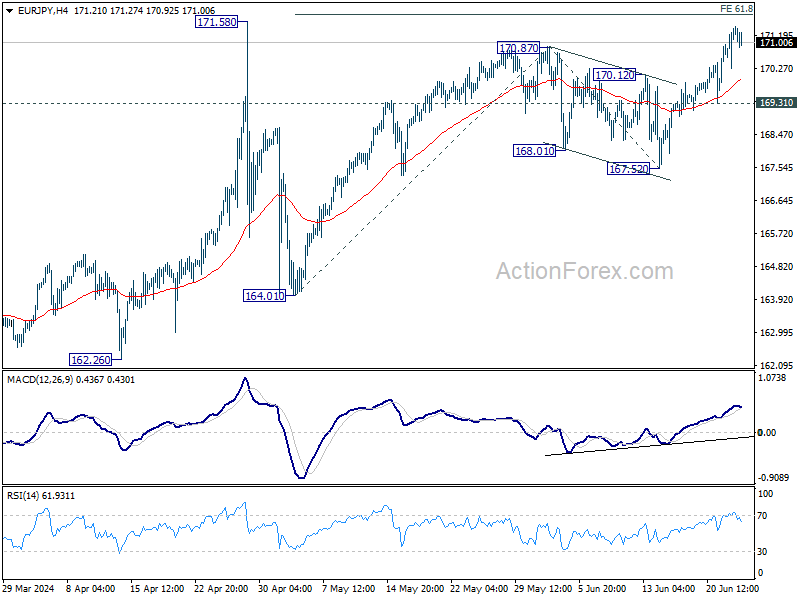
Daily Pivots: (S1) 170.60; (P) 171.03; (R1) 171.76; More...
Intraday bias in EUR/JPY is turned neutral with current retreat. Some consolidations could be seen first but further rally will remain in favor as long as 169.31 support hold, for 61.8% projection of 164.01 to 170.87 from 167.52 at 171.75. However, firm break of 169.31 will turn bias back to the downside for 167.52 support instead.
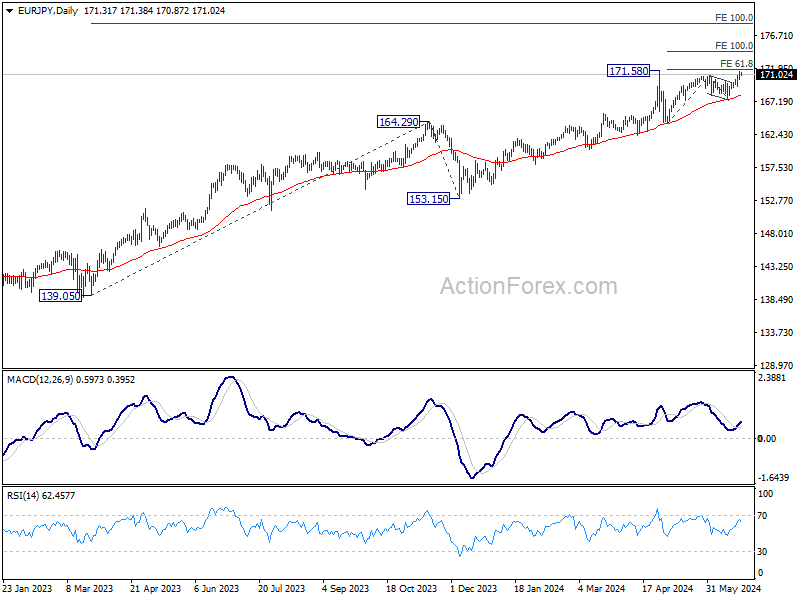
In the bigger picture, strong support from 55 D EMA indicates that the long term up trend is still in progress. Decisive break of 171.58 will confirm resumption and target 100% projection of 139.05 to 164.29 from 153.15 at 178.38. For now outlook will stay bullish as long as 164.01 support holds, even in case of deep pullback.
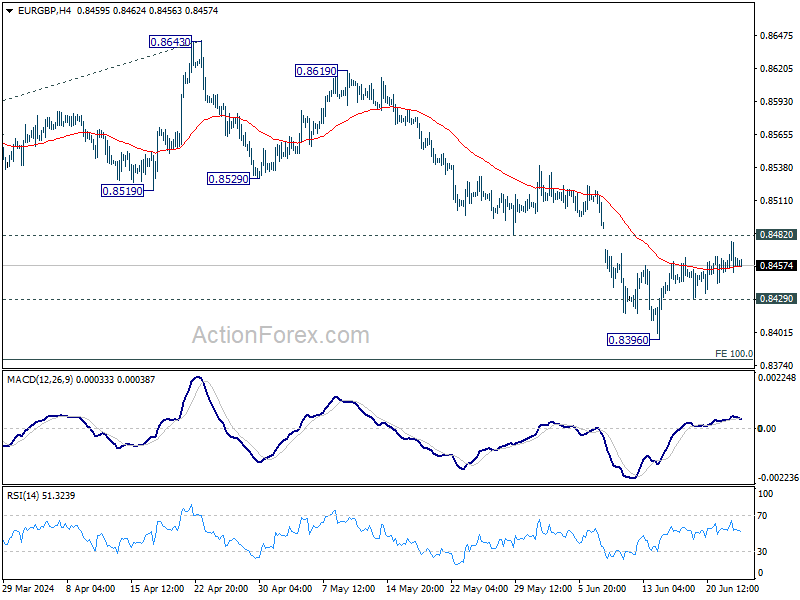
EUR/GBP Daily Outlook
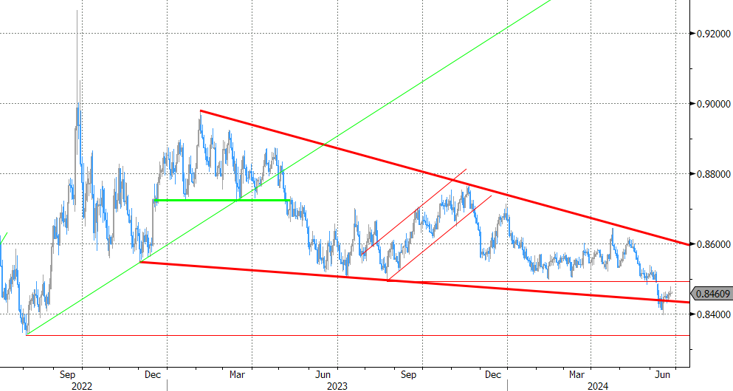
Daily Pivots: (S1) 0.8450; (P) 0.8464; (R1) 0.8476; More...
EUR/GBP is still extending the consolidation pattern from 0.8396 and intraday bias stays neutral. Outlook will stay bearish as long as 0.8482 support turned resistance holds. On the downside, below 0.8429 minor support will bring retest of 0.8396 low first. Further break there will resume larger down trend to 0.8376 projection level next.
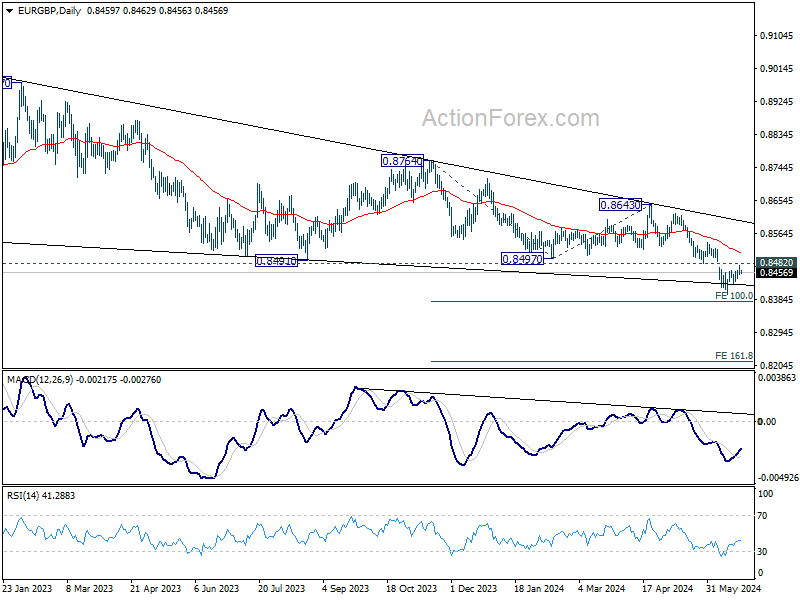
In the bigger picture, down trend from 0.9267 (2022 high) is in progress. Next target is 100% projection of 0.8764 to 0.8497 from 0.8643 at 0.8376. Sustained break there will target 161.8% projection at 0.8211 next. For now, outlook will remain bearish as long as 0.8643 resistance holds, even in case of stronger rebound.
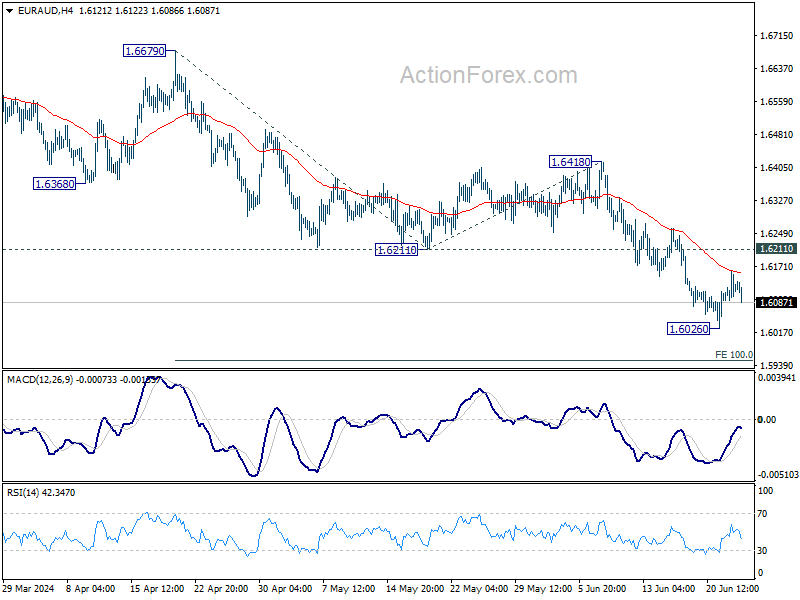
EUR/AUD Daily Outlook
Daily Pivots: (S1) 1.6090; (P) 1.6125; (R1) 1.6161; More...
Intraday bias in EUR/AUD stays neutral at this point. Consolidation from 1.6026 could extend further, but upside should be limited by 1.6211 support turned resistance to bring another fall. Below 1.6026 will turn bias back to the downside for 100% projection of 1.6679 to 1.6211 from 1.6418 at 1.5950.
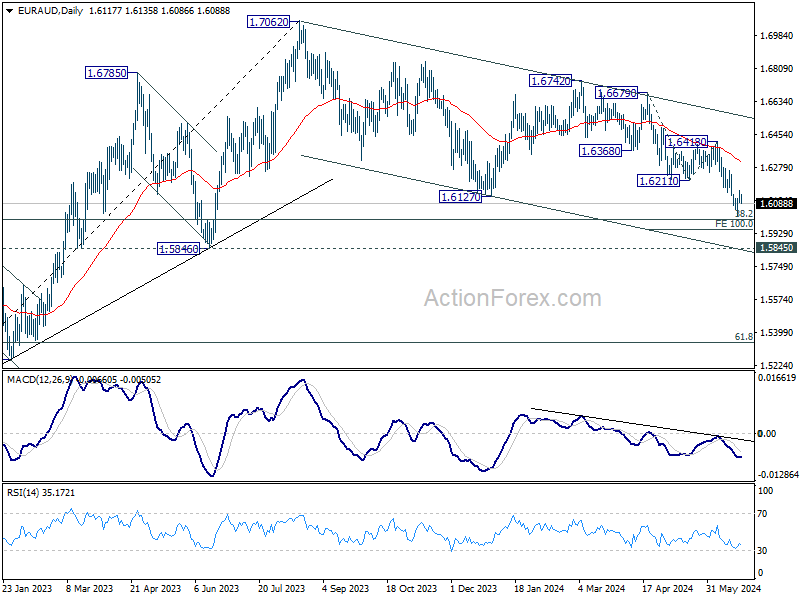
In the bigger picture, fall from 1.7062 medium term top is seen as a correction to the up trend from 1.4281 (2022 low) only. Strong support is still expected between 1.5846 and 38.2% retracement of 1.4281 to 1.7062 at 1.6000 to bring rebound. Break of 1.7062 is in favor as a later stage.
EUR/CHF Daily Outlook
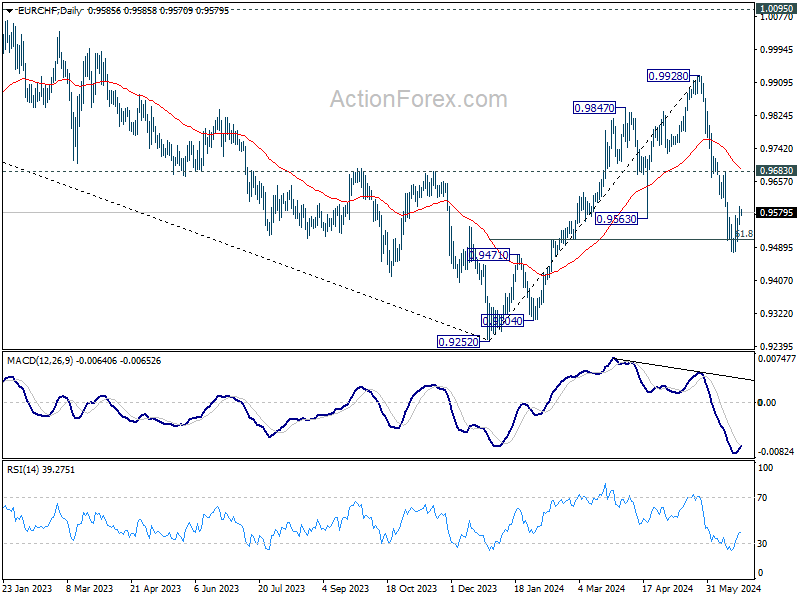
Daily Pivots: (S1) 0.9553; (P) 0.9574; (R1) 0.9606; More....
Intraday bias in EUR/CHF remains neutral for the moment and outlook is unchanged. Consolidation from 0.9476 could extend with stronger recovery. But outlook will remain bearish as long as 0.9683 resistance holds. On the downside, break of 0.9476, and sustained trading below 61.8% retracement of 0.9252 to 0.9928 at 0.9510 will bring retest of 0.9252 low next.
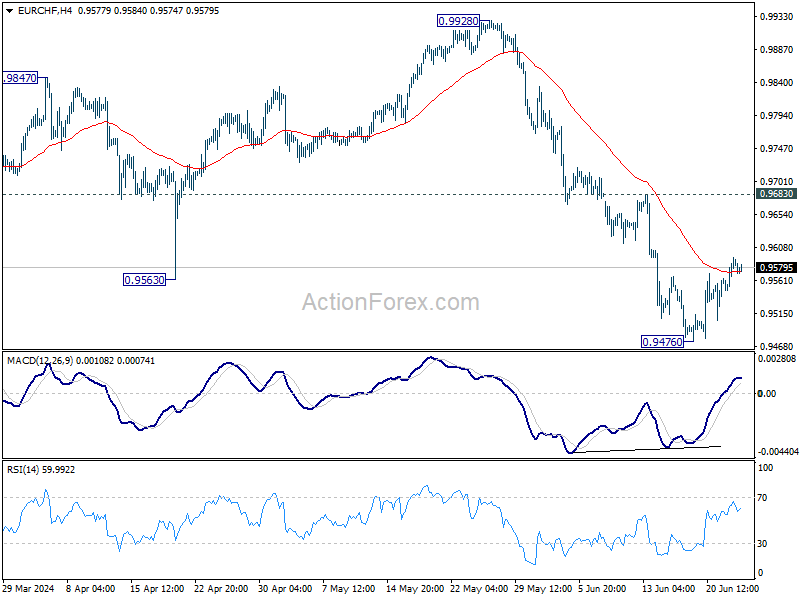
In the bigger picture, rebound from 0.9252 should have completed at 0.9228. Medium term outlook remains bearish with 1.0095 resistance intact. Firm break of 0.9252 will resume the down trend from 1.2004 (2018 high).
EUR/USD Has Little Upward/Rebound Potential
Markets
Fuss about potential Japanese FX interventions (USD/JPY 160) and more French political scenario’s dominated headlines yesterday, but failed to inspire trading. European risk sentiment improved with key indices rising by 0.5% to 1.5%. Safe haven assets like core bonds and the dollar travelled the other direction, resulting in marginally higher German yields and EUR/USD reconquering 1.07 (close 1.0733). Sentiment soured after European close with AI-darlings correcting from recent record races. The S&P 500 (-0.3%) and Nasdaq (-1.1%) ended with losses, fueling a late bid in US Treasuries. Comments by San Francisco Fed Daly (voter this year) were interesting. She stressed that at this point, inflation is not the only risk that the Fed faces. Daly admits that the labour market so far adjusted slowly with the unemployment rate only edging up. She fears though that we are getting nearer to a point where that benign outcome could be less likely. “Future labour market slowing could translate into higher unemployment, as firms need to adjust not just vacancies, but actual jobs”. Daly urged policy makers to remain vigilant to both inflation and labour market risks. If inflation falls more slowly than expected, Daly said it would be appropriate to hold interest rates higher for longer. If inflation falls quickly or the labor market cools more than expected, cutting rates would be necessary. From a risk/positioning point of view, we follow Daly’s reasoning. The bumpy inflation path ahead certifies the June FOMC dot plot calling for only one policy rate cut this year. A sudden weakening of the labour market is a bigger risk to this scenario that the inflation path.
Today’s eco calendar is empty in Europe. Some ECB members speak, but the focus gradually turns to next week’s Sintra symposium, the ECB’s equivalent of the end of August Jackson Hole meeting by the Fed. The US calendar is more interesting with house prices, Richmond Fed manufacturing index and especially consumer confidence. Speeches by Fed Bowman and Cook and the start of the US Treasury’s end-of-month refinancing operation serve as a wildcard. Going into Friday’s PCE deflators and with the end of quarter looming, we err on the side of a decent bid for US Treasuries. A bigger correction in (US) tech stocks would also fit this view. Together with this weekend’s French elections is why we stick to the view that EUR/USD has little upward/rebound potential even in case of softer US data. Intervention bells in USD/JPY (159.42) are still ringing.
News & Views
Australian consumer confidence as measured by the Westpac-Melbourne Institute improved modestly in June rising from 82.2 to 83.6, but remains well below the 100 level that signals the balance between pessimists and optimists. According to comments from Westpac, “the survey detail suggests positives from fiscal support measures are being negated by increased concerns about inflation and the outlook for interest rates”. Fiscal support measures made consumers turning more positive on current and future family finances. They also showed more preparedness to buy major household items. At the same time, consumers turned much more negative on the economy for the next year (-5.7%). Also intentions to buy a dwelling declined substantially. The survey comes as the Reserve bank of Australia at its June 19 meeting indicated that inflation has been easing more slowly than expected and that it remains prepared to do what is necessary to bring inflation back to target. The Aussie dollar continues trading in a tight range between 0.6575 and 0.6715 (currently 0.6665).
Argentina entered a technical recession in the first quarter of this year. Activity contracted 2.6% Q/Q after a decline of 2.5% in the final quarter of last year. Activity in Q1 was 5.1% lower compared to the same period last year. The recession comes as president Milei tries to restore public finances via aggressive spending cuts. Private consumption declined 6.7% Y/Y. Also public consumption was 5% lower. Imports shrank by 20.1% while exports rose 26.1%. Due to the contraction in activity the unemployment rate rose from 5.7% in Q4 2023 to 7.7%.
Graphs
GE 10y yield
The ECB cut its key policy rates by 25 bps at the June policy meeting. A more bumpy inflation path in H2 2024, the EMU economy gradually regaining traction and the Fed’s higher for longer US strategy make follow-up moves difficult. Markets are coming to terms with that. For the time being, though, the political narrative (France) dominates. After hitting a new YtD top at 2.7%, the German 10-yr yield corrected lower on safe haven bids.
US 10y yield
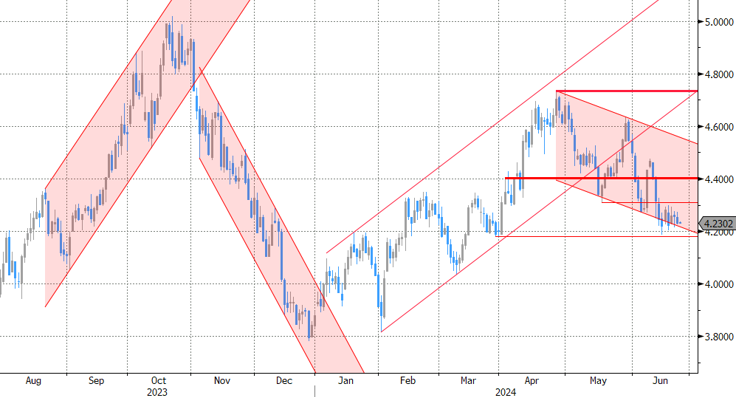
The Fed is seeking more evidence than just one slower-than-expected (May) CPI is providing. Upgraded inflation forecasts and a higher neutral rate complicate the exact timing of a first cut further. June dots suggest one move in 2024 followed by four more next year. Markets are positioned more aggressively, turning the recent low in yields into a technical support zone. The US 10-y yield is testing the downside of the 4.2/4.7% trading range.
EUR/USD
EUR/USD is stuck in the 1.06-1.09 range. The desynchronized rate cut cycle with the ECB exceptionally taking the lead, strong US May payrolls and a swing to the right in European elections pulled the pair away from 1.09 resistance. The Fed meeting balanced the weaker than expected US CPI outcome. Euro fragility makes a return to the 1.06 downside more likely than not.
EUR/GBP
Debate at the BOE is focused at the timing of rate cuts. May headline inflation returned to 2%, but core measures weren’t in line with inflation sustainably returning to target any time soon. Still some BoE members at the June meeting appeared moving closer to a rate cut. This might cap further sterling gains. At the same time, the euro remains vulnerable to political event risk going into the French elections. EUR/GBP 0.84 is becoming solid support.