Sample Category Title
GBP/USD Mid-Day Outlook
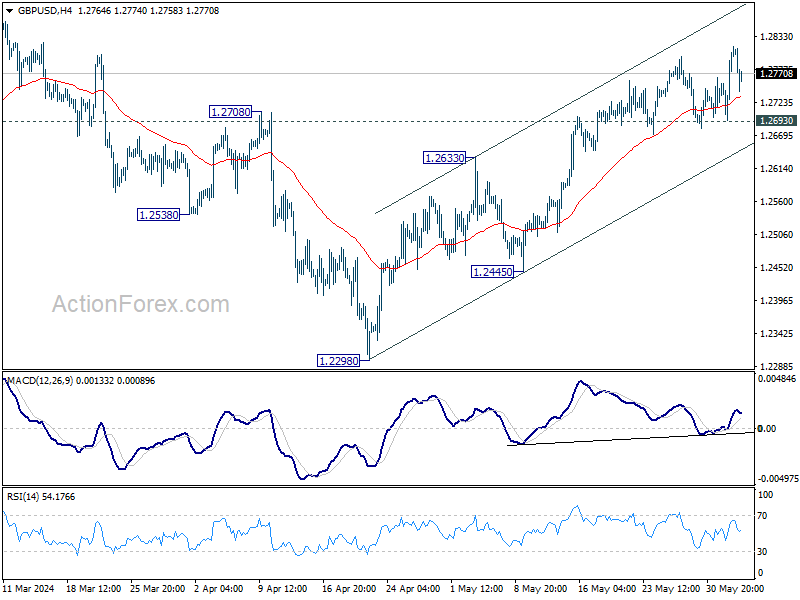
Daily Pivots: (S1) 1.2732; (P) 1.2770; (R1) 1.2847; More…..
Further rally is expected in GBP/USD with 1.2693 support intact, despite current retreat. Rise from 1.2298 should target 1.2892 resistance. However, break of 1.2693 will turn bias back to the downside for deeper pullback.
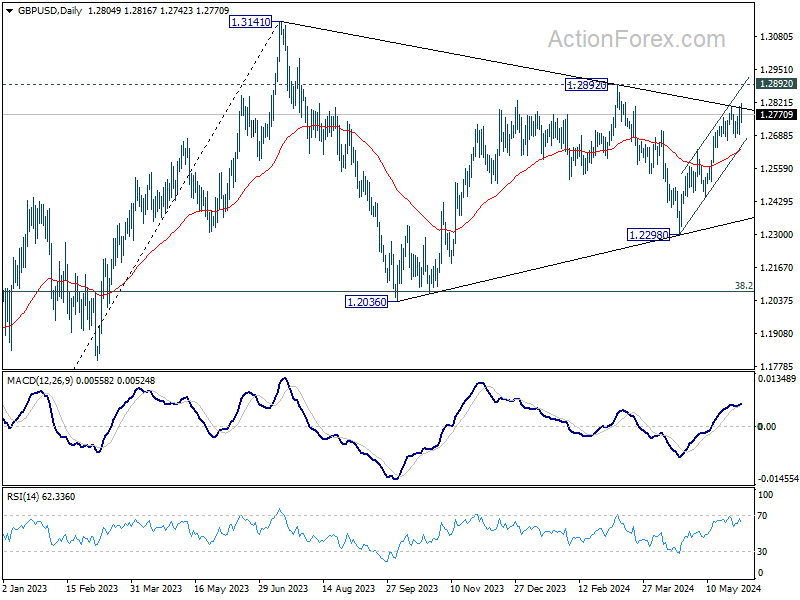
In the bigger picture, price actions from 1.3141 medium term top are seen as a corrective pattern. Fall from 1.2892 is seen as the third leg which might have completed already. Break of 1.2892 resistance will argue that larger up trend from 1.0351(2022 low) is ready to resume through 1.3141. Meanwhile, break of 1.2445 support will extend the corrective pattern with another decline instead.
USD/JPY Mid-Day Outlook
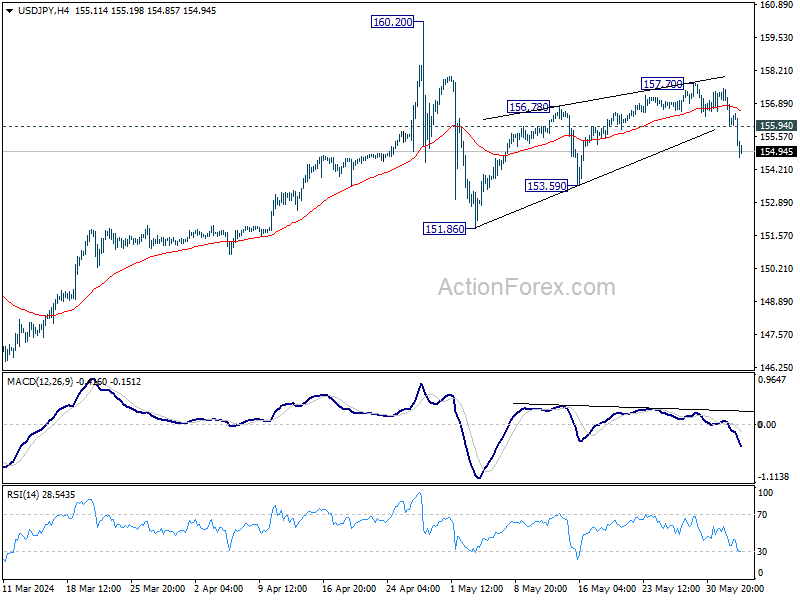
Daily Pivots: (S1) 155.53; (P) 156.50; (R1) 157.06; More….
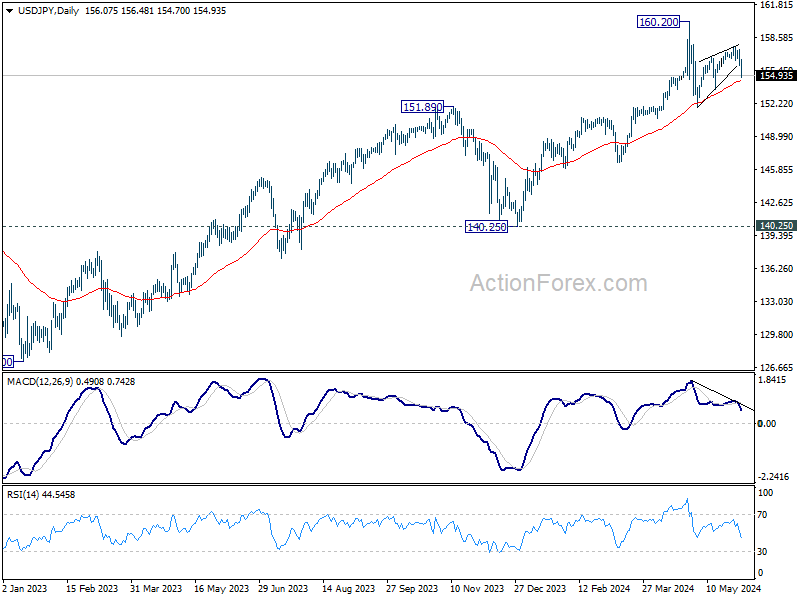
Intraday bias in USD/JPY stays on the downside at this point. Rebound from 151.86 should have completed with three waves up to 157.70. Fall from there is seen as the third leg of the corrective pattern from 160.20. Break of 153.59 will pave the way to 151.86 support and below. On the upside, above 155.94 minor resistance will turn intraday bias neutral first. But rise will stay on the downside as long as 157.70 resistance holds, in case of recovery.
In the bigger picture, a medium term top might be formed at 160.20. As long as 55 W EMA (now at 147.77) holds, fall from 160.20 is seen as correcting the rise from 140.25 only. However, sustained break of 55 W EMA will argue that larger correction is possibly underway, and target 146.47 support next.
WTI Tumbles Below Key Support of 76.50
- WTI crude oil collapses, breaks key zone
- RSI and MACD point to further declines
- Even if the price rebounds, the bears may recharge
- A break above 80.90 could shift the outlook to positive
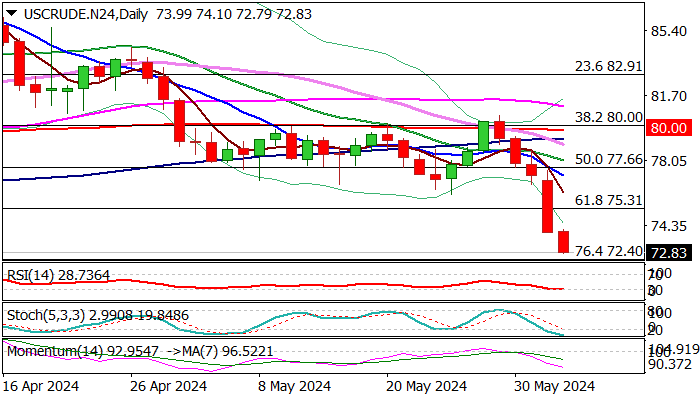
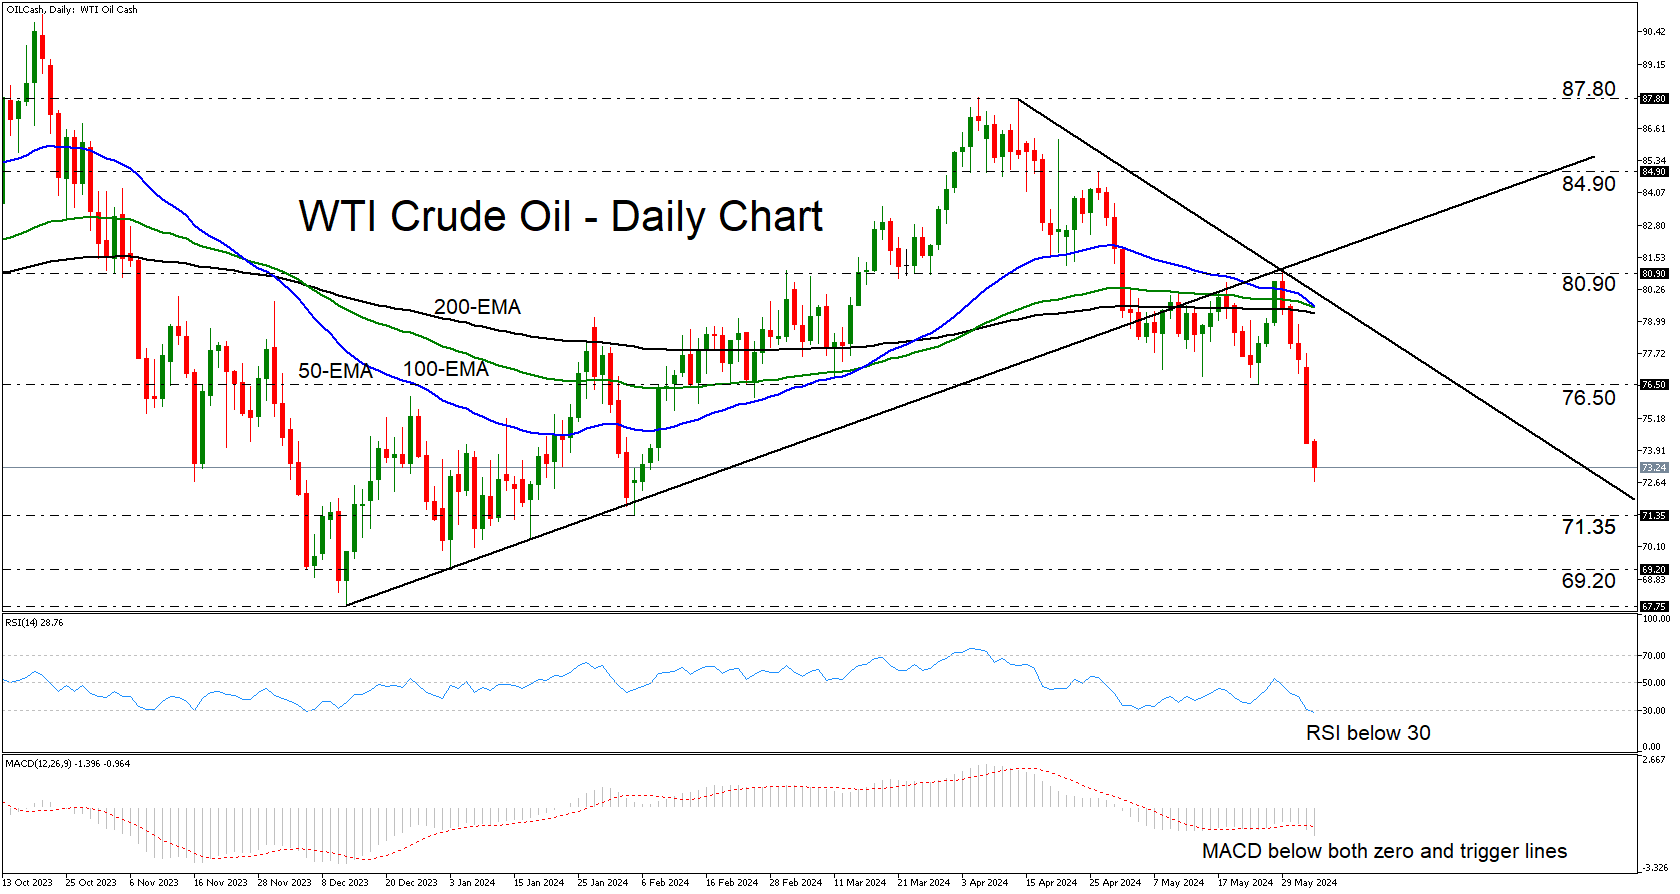
WTI crude oil fell sharply yesterday, breaking below the key support (now turned into resistance) area of 76.50. The tumble confirmed a lower low on the daily chart, confirming that the downtrend marked by the trendline drawn from the high of April 12 is still in force.
Both the RSI and the MACD are detecting negative momentum, implying that further declines may be looming. The former has just ticked below its 30 line, while the MACD is lying below both its zero and trigger lines.
The price is currently headed towards the 71.35 support, marked by the low of February 5, from where it could rebound given the overstretched and sharp collapse. However, the bears could still take the reins from below the 76.50 zone and push for another leg south. A break below 71.35 could target the 69.20 or 67.75 barriers.
On the upside, a break above 80.90 and a return above the uptrend line taken from the low of December 13 may be needed for the outlook to brighten again. Such a strong recovery may encourage extensions towards the peak of April 26 at 84.90.
To sum up, WTI crude oil collapsed yesterday, breaking below a key support zone and signaling the resumption of the prevailing downtrend. Even if the price rebounds somewhat due to the stretched fall, the outlook could stay overly bearish.
Japanese Yen Strengthens Unexpectedly Against US Dollar
The USD/JPY pair unexpectedly declined last night due to a weakening US dollar. Currently, it is hovering around 156.33.
Japanese Finance Minister Shunichi Suzuki highlighted the government's recent interventions to support the yen, significantly impacting the market. Official data reveals that throughout April, Japan spent approximately 9.79 trillion yen (62.2 billion USD) on efforts to stabilise the national currency.
Suzuki pointed out that the interventions aimed to mitigate excessive fluctuations in the currency market. He affirmed that Japan would continue to monitor the forex market and act against disorderly movements vigilantly, expressing satisfaction with the effects of these measures. This marks the first time the Japanese authorities have acknowledged their market interventions conducted in late April and early May.
The yen's strengthening is also bolstered by the recent depreciation of the US dollar, driven by market anticipations of a potential earlier rate cut by the US Federal Reserve. As expectations grow for softened US monetary policy, the dollar has declined, boosting other currencies, including the yen.
USD/JPY technical analysis
On the H4 chart, USD/JPY completed a correction wave, reaching 157.70. A new wave of decline aiming for 153.77 is forming. Once this target is reached, a potential correction to 155.44 (testing from below) may follow, preceding a further decline towards 149.70. The bearish outlook is technically supported by the MACD indicator, with its signal line below zero and pointing sharply downwards.
On the H1 chart, the correction phase to 157.47 has concluded, and a downward impulse towards 155.44 is underway. Following this, a correction to 156.45 (testing from below) could occur, potentially leading to a further drop to 155.22, the primary target. This scenario is technically confirmed by the Stochastic oscillator, whose signal line is positioned above 80 and is anticipated to drop to 20.
Summary
The yen's unexpected strengthening reflects a complex interplay of domestic interventions and broader market reactions to shifts in US monetary policy. Given the ongoing adjustments in global economic expectations and central bank policies, investors and traders should closely monitor these developments, as further fluctuations in the USD/JPY pair are likely.
USD/CHF Mid-Day Outlook
Daily Pivots: (S1) 0.8926 (P) 0.8983; (R1) 0.9016; More….
USD/CHF accelerates to as low as 0.8921 so far today, touching 100% projection of 0.9223 to 0.8987 from 0.9157 at 0.8921. There is no sign of bottoming yet and intraday bias stays on the downside. Break of 0.8921 will target 0.8883 fibonacci level. On the upside, above 0.8987 support turned resistance will turn intraday bias neutral first.
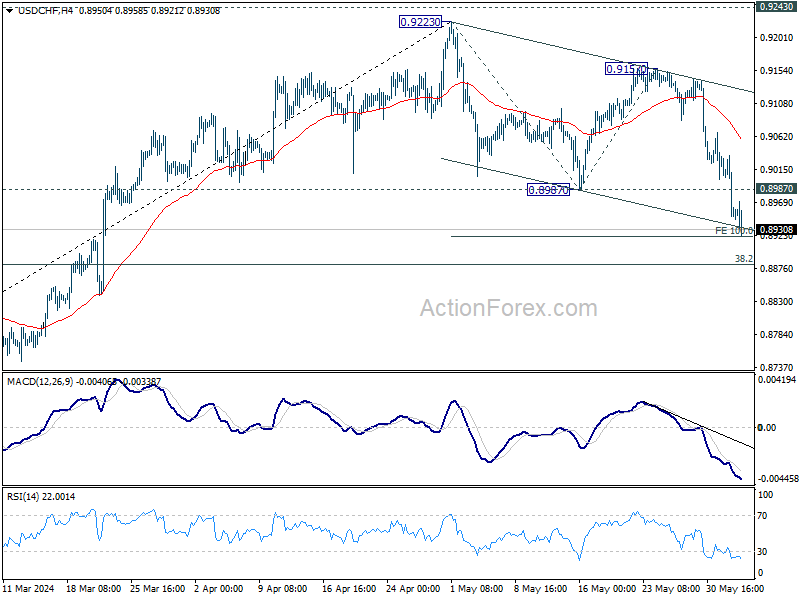
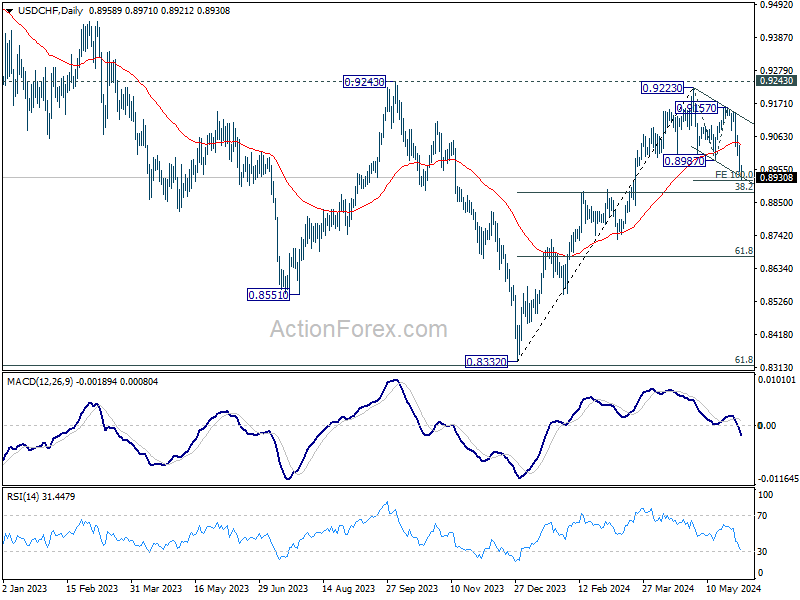
In the bigger picture, price actions from 0.8332 medium term bottom are tentatively seen as developing into a corrective pattern to the down trend from 1.0146 (2022 high). Rejection by 0.9243 resistance, followed by sustained break of 38.2% retracement of 0.8332 to 0.9223 at 0.8883 will strengthen this case, and maintain medium term bearishness. However, decisive break of 0.9243 will argue that the trend has already reversed and turn medium term outlook bullish for 1.0146.
Yen and Swiss Franc Skyrocket Amid Lower Treasury Yields and Market Cautiousness
Japanese Yen and Swiss Franc are seeing significant upward momentum today. As news flow has been very slow, these safe-have currencies' are likely partly supported by the extended decline in benchmark treasury yields across the US and Europe. This movement also suggests an underlying risk aversion among investors, although the downturns in European indices and US futures remain relatively moderate.
The development raises speculation about whether traders are preemptively positioning themselves in anticipation of the upcoming ISM Services and US Non-Farm Payroll data later this week. Another pivotal arises: will the markets interpret negative surprises in the upcoming data as genuinely unfavorable, or will the recent "bad news is good news" scenario continue to prevail? In any case, June promises to be a turbulent month, closing out the first half of the year with potentially significant volatility.
In the broader currency markets, Dollar is trailing behind as the distant third strongest, outpaced by the appreciating Yen and Swiss Franc by a mile. Australian Dollar is notably weaker, leading New Zealand and Canadian Dollars as the worst, while Euro and Sterling are positioned in the middle of the pack.
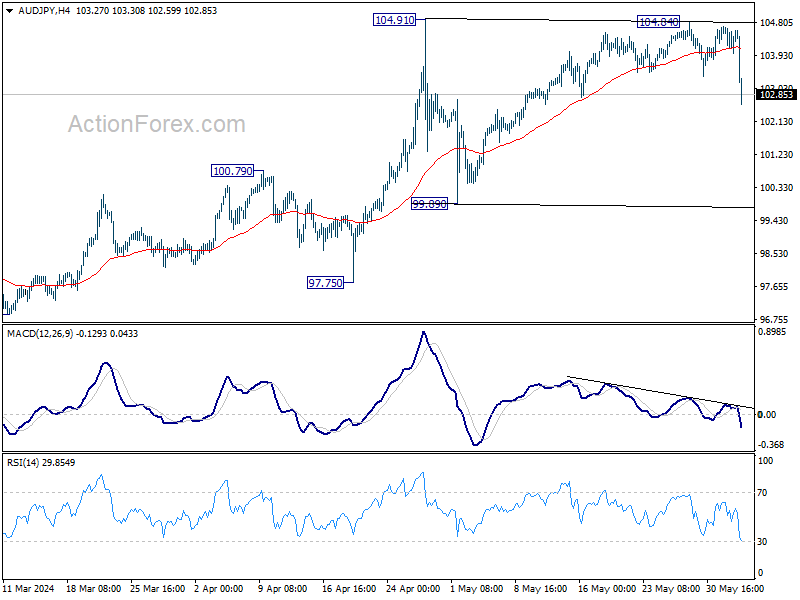
Technically, AUD/JPY's steep decline suggest that a short term top was formed at 104.84 already, on bearish divergence condition in 4H MACD, ahead of 104.91 resistance. Fall from 104.84 is seen as the third leg of the corrective pattern from 104.91. Risk will now stay on the downside as long as 104.84 resistance holds, even in case of recovery. Further fall should be seen towards 99.89 support.
In Europe, at the time of writing, FTSE is down -0.28%. DAX is down -0.63%. CAC is down -0.34%. UK 10-year yield is down -0.0268 at 4.196. Germany 10-year yield is down -0.032 at 2.547. Earlier in Asia, Nikkei fell -0.22%. Hong Kong HSI rose 0.22%. China Shanghai SSE rose 0.41%. Singapore Strait Times fell -0.30%. Japan 10-year JGB yield fell -0.031 to 1.037.
Swiss CPI unchanged at 1.4% yoy in May, core CPI at 1.2% yoy
Swiss CPI was steady at 1.4% yoy in May. Core CPI was also unchanged at 1.2% yoy. Domestic product inflation was unchanged at 2.0% yoy. Imported products inflation fell from -0.4% yoy to -0.6% yoy.
Comparing with the prior month, CPI rose 0.3% mom in. Core CPI rose 0.2% mom. Domestic product rose 0.5% mom while imported products rises was flat for the month.
BoJ's Ueda: Monetary policy adjustments possible if inflation rises
BoJ Governor Kazuo Ueda addressed the parliament today, indicating that the central bank is prepared to adjust its level of monetary support if underlying inflation accelerates as forecasted. Ueda added, "If our economic and price outlook, or risks, change, that will also be reason to change the level of interest rates."
Discussing long-term interest rates, Ueda mentioned that the central bank's fundamental approach is to allow market forces to determine these rates. However, he also emphasized that BoJ would conduct "nimble" market operations if long-term interest rates were to spike, highlighting the bank's readiness to increase bond buying when necessary.
Japan's Suzuki confirms impact of market intervention to support yen
Japan's Finance Minister Shunichi Suzuki confirmed today that recent interventions in the currency market had a notable impact on stabilizing Yen. During a press conference following a regular cabinet meeting, Suzuki explained that the interventions at the end of April and early May were specifically targeted to counteract excessive currency market movements.
According to data released by the Ministry of Finance last Friday, Japan spent JPY 9.79T over the past month to bolster Yen. This data confirmed traders' and analysts' suspicions that Tokyo conducted significant dollar-selling interventions.
These interventions occurred shortly after Yen plummeted to a 34-year low of 160.245 per dollar on April 29 and again in the early hours of May 2 in Tokyo.
USD/CHF Mid-Day Outlook
Daily Pivots: (S1) 0.8926 (P) 0.8983; (R1) 0.9016; More….
USD/CHF accelerates to as low as 0.8921 so far today, touching 100% projection of 0.9223 to 0.8987 from 0.9157 at 0.8921. There is no sign of bottoming yet and intraday bias stays on the downside. Break of 0.8921 will target 0.8883 fibonacci level. On the upside, above 0.8987 support turned resistance will turn intraday bias neutral first.
In the bigger picture, price actions from 0.8332 medium term bottom are tentatively seen as developing into a corrective pattern to the down trend from 1.0146 (2022 high). Rejection by 0.9243 resistance, followed by sustained break of 38.2% retracement of 0.8332 to 0.9223 at 0.8883 will strengthen this case, and maintain medium term bearishness. However, decisive break of 0.9243 will argue that the trend has already reversed and turn medium term outlook bullish for 1.0146.
Economic Indicators Update
| GMT | Ccy | Events | Actual | Forecast | Previous | Revised |
|---|---|---|---|---|---|---|
| 23:50 | JPY | Monetary Base Y/Y May | 0.90% | 2.20% | 2.10% | |
| 01:30 | AUD | Current Account Balance (AUD) Q1 | -4.9B | 5.9B | 11.8B | 2.7B |
| 06:30 | CHF | CPI M/M May | 0.30% | 0.40% | 0.30% | |
| 06:30 | CHF | CPI Y/Y May | 1.40% | 1.40% | ||
| 07:55 | EUR | Germany Unemployment Change May | 25K | 7K | 10K | |
| 07:55 | EUR | Germany Unemployment Rate May | 5.90% | 5.90% | 5.90% | |
| 14:00 | USD | Factory Orders M/M Apr | 0.70% | 1.60% |
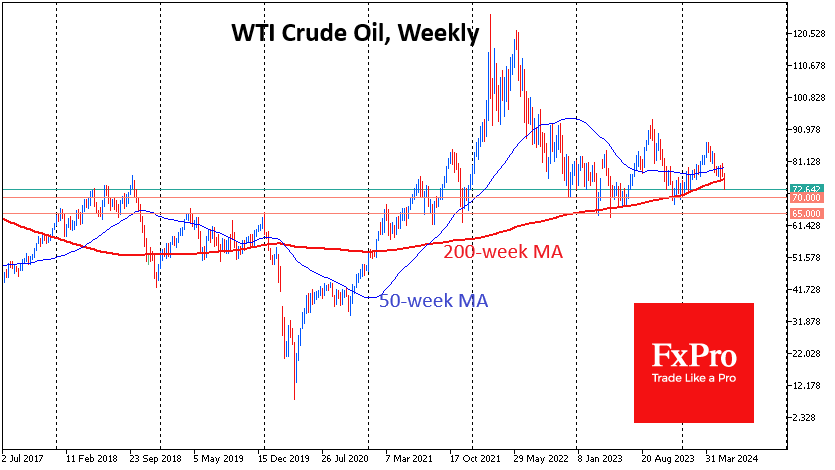
Oil Probably Setting Up for a Repeat of 2020 or 2014
In the middle of last week, WTI crude bounced off resistance in the form of the 200-day moving average and moved closer towards the lower end of the May trading range. Oil is also trading below its 50-day average, which is pointing downwards. All of this is evidence of an intensifying bearish medium and long-term trend.
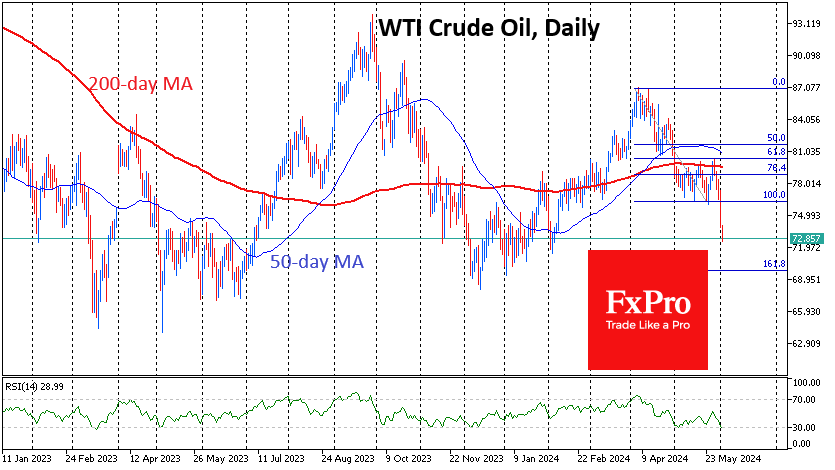
Earlier, we also pointed out that the cartel, especially Saudi Arabia and Russia, is becoming hawkish, preferring to give active signals or cut production when the price gets close to the 200-week average. This curve reflects ultra-long-term trends, averaging the price over almost four years. Oil has been receiving impressive support after touching this line in 2019 and 2023. Since the beginning of this year, there have been new attempts to break below, which have so far resulted in strong upside momentum.
It very much looks like that situation has now changed. Oil is already more than 3% below its 200-week average, having been under sustained pressure since the start of the week. In addition, the intensified daily selling of oil in US trading since last Wednesday has contributed to this.
In 2020, the breakdown of this long-term support culminated in a hike in some oil contracts into negative territory. We saw just as much market drama in 2014 after a similar signal. It was perhaps only in 2018 that oil managed to turn to the upside, falling just 18% below its 200-week average.
Thus, we may be seeing the beginning of the formation of one of the significant downtrends in oil, capable of being on par with the 2014-2016 or 2020 sell-offs. In this case, the price may roll back to the $30 area—the price area where most oil production projects lose profitability.
However, the bulls still have a significant support area of around $65-$70 per barrel. This was the resistance area in 2019 and the support area in the last three years.
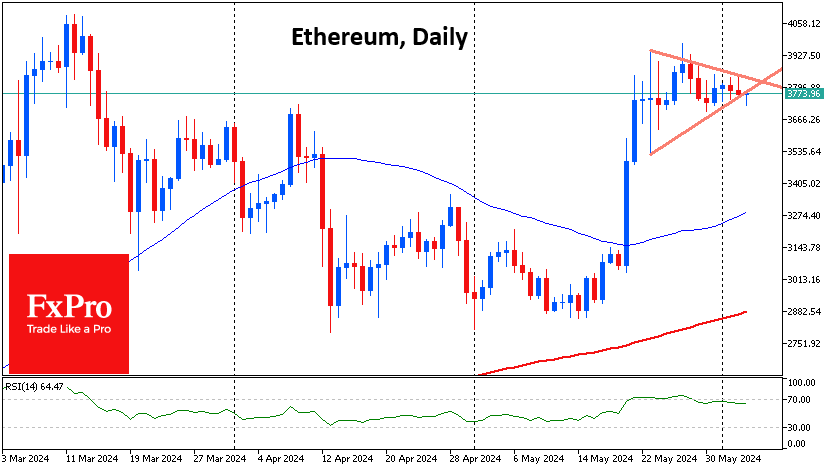
Ethereum’s Bull Pennant Needs Confirmation
Market picture
The cryptocurrency market loses just over 0.5% in 24 hours, to $2.56 trillion. The moderate pressure is due to another failed attempt by Bitcoin to consolidate above $70K, which is now retreating 0.2%. Ethereum has pulled back 1.8% in the same time frame, while the top coins are moving without a single trend, from Dogecoin’s 2.2% decline to Toncoin’s 1.4% rise.
Ethereum may be forming a Bull Pennant (a triangle forming after a rapid rise). As a rule, such a consolidation is followed by a breakout of the upper boundary and subsequent growth. However, this scenario needs confirmation. A sustained advancement above $3900 will indicate a full-fledged realisation of growth in ETHUSD. A bearish scenario cannot be ruled out when a failure under the support at $3700 will trigger a steady decline.
According to CoinShares, crypto funds saw inflows of just $185 million last week after $1.05 billion a week earlier. Bitcoin investments were up $148 million, Ethereum investments were up $34 million, and Solana investments were up $6 million. Outflows from Grayscale’s Bitcoin ETF rose sharply to $260 million for the week. Inflows into Ethereum continued for a second week after the SEC approved a spot ETF with an expected launch in July.
News background
According to Cryptoquant, investors have withdrawn 797,000 ETH worth $3bn from exchanges to wallets following the approval of the Ethereum-ETF. Bitcoin shows a similar trend in the dynamics of available coins on the CEX.
BTC and ETH exchange balances are at multi-year lows. BTC’s share [of total supply] has fallen to 11.6%, and Ethereum’s share has fallen to 10.6%. Whales continue to accumulate while asset supply is shrinking, BtcEcho noted.
Australia’s CBOE subsidiary will launch trading of a spot bitcoin ETF. This became possible after the issuer received AFS registration from the Securities and Investments Commission of Australia.
MicroStrategy and its founder, Michael Saylor, have reached a $40 million settlement with the U.S. Attorney’s Office for the District of Columbia (USA) in a tax evasion case.
Michael van de Poppe expects the approval of a spot Ethereum-ETF could spark an altcoin rally. He named five altcoins that he said he is “buying right now.” In his view, they are Optimism (OP), Arbitrum (ARB), WO Network (WO), Wormhole (WORM) and Dogecoin (DOGE).
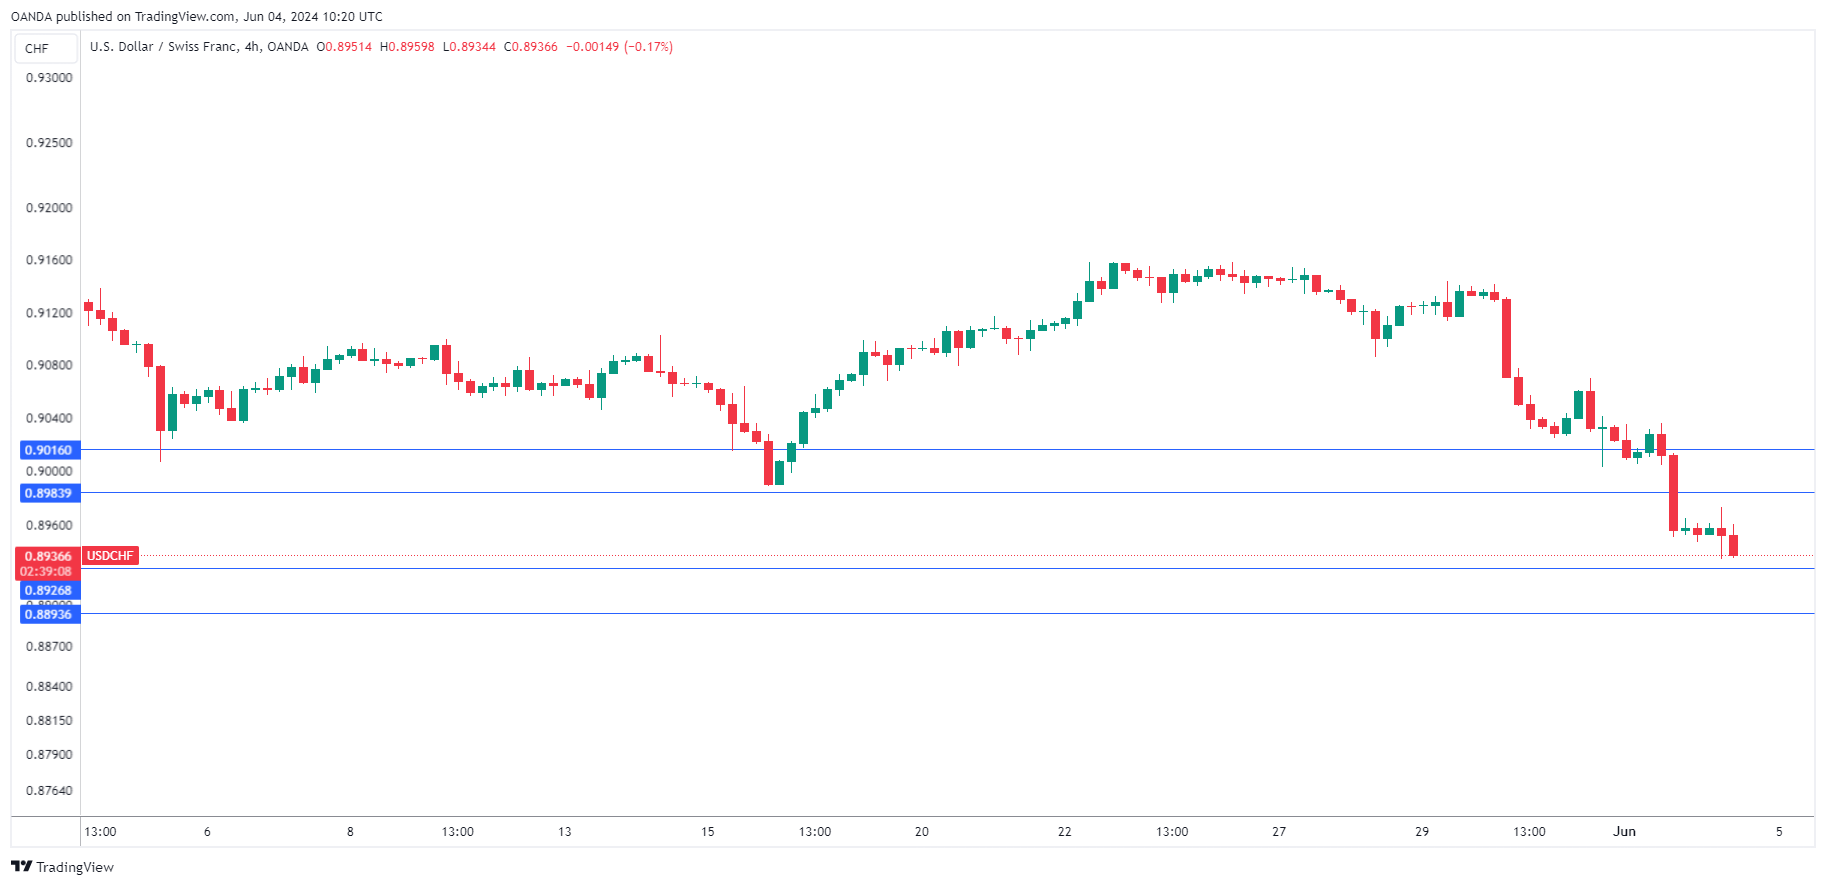
Swiss Franc Edges Higher as Inflation Holds at 1.4%
The Swiss franc is in positive territory on Tuesday. USD/CHF is trading at 0.8935 in the European session, down 0.24% on the day. The Swissie has posted its strongest rally of the year, with gains of 2% since May 29th and is trading at its highest level since March 21st.
Swiss inflation unchanged
Switzerland’s inflation rate remained unchanged in May and the Swiss franc has shown limited movement on Tuesday. Inflation remained at 0.3% m/m, just below the market estimate of 0.4%. On an annualized basis, inflation was steady at 1.4%. The core rate, which excludes food and energy, was also unchanged in May, with a gain of 1.2%.
The May inflation reading of 1.4% matches the 2024 high and has weakened the case for a rate cut when the Swiss National Bank meets on June 20th. The SNB took the lead in March and was the first major central bank to lower interest rates.
The Swiss franc has declined around 7% against the US dollar this year SNB Chair Jordan made headlines last week when he said that the weak franc was feeding inflation and that the central bank could counteract this by intervening in the currency markets. This has triggered an impressive rally by the Swiss franc.
In the US, the ISM Manufacturing PMI slowed for a second straight month, dropping in May from 49.2 to 48.7. As well, construction activity slowed in May. These releases point to a slowdown in the US economy and have raised expectations of a rate cut. The markets have priced in a 62% probability of a September rate cut, compared to 46% just one week ago.
USD/CHF Technical
- USD/CHF is testing support at 0.8926. Below, there is support at 0.8893
- 0.8983 and 0.9016 are the next resistance lines
WTI Outlook: Oil Extends Steep Fall on Growing Demand Concerns
WTI oil price remains in a steep fall for the fifth consecutive day, losing over 1% and hitting new four-month low in early Tuesday’s trading, after 3.8% drop on Monday (the biggest daily fall since Nov 16).
The sentiment soured on growing concerns about weakening US demand, indicated by weaker than expected data from the US manufacturing sector, as well as signals that OPEC+ may review and gradually ease its voluntary production cut from October, after keeping it unchanged in cartel’s meeting last Sunday.
Technical picture on daily chart is firmly bearish, as the latest bear-leg of larger downtrend from $87.61 (2024 peak, posted on Apr 12) has so far retraced nearly 76.4% of $67.70/$87.61 (Dec 2023 / Apr 2024 rally).
However, reaction to the latest sharp bearish acceleration (oil price was down over 9% in past five days) should be anticipated, as oversold conditions may prompt partial profit-taking.
Bears face solid supports at $72.40 (Fibo 76.4%) and $71.40 (Feb 5 higher low) where increased headwinds could be expected.
Correction is likely to be limited in current circumstances (strong downtrend / negative fundamentals) and likely offer better levels to re-enter the downtrend.
Broken Fibo 61.8% ($75.31) and former range floor ($76.13) offer good resistances which should ideally cap and guard falling 10/20DMA’s ($77.19/$78.02 respectively) violation of which would dent bears and expose upper pivots at $78.75 / $80.60 (200DMA / May 29 lower top).
Res: 74.10; 75.31; 76.13; 77.19.
Sup: 72.40; 71.40; 70.61; 70.00.