Sample Category Title
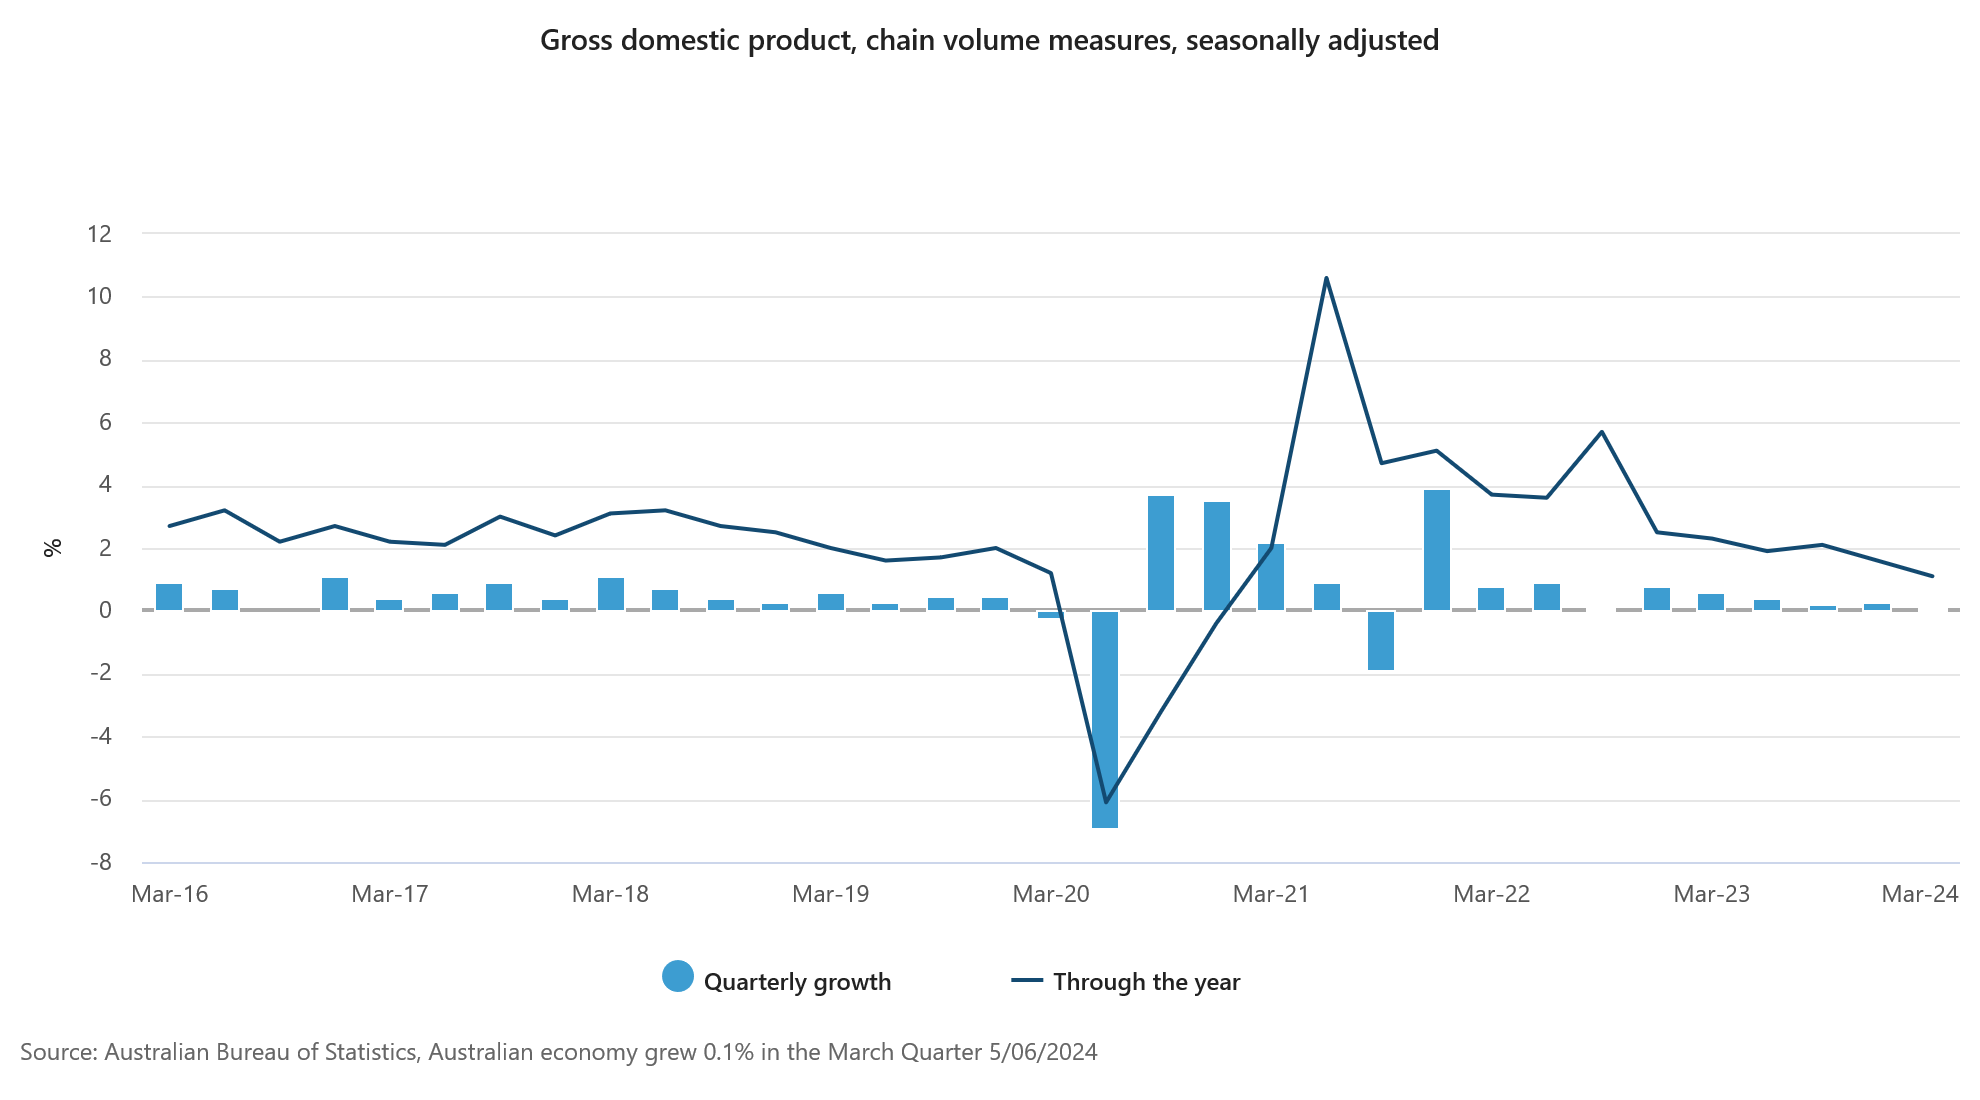
Australia’s Q1 GDP rises 0.1% qoq, lowest annual growth since late 2020
Australia's GDP grew by 0.1% qoq in Q1, below the anticipated 0.2% growth. On a year-over-year basis, GDP increased by 1.1%.
Katherine Keenan, head of national accounts at ABS, remarked that GDP growth was weak in March, marking the lowest annual growth rate since December 2020. She also highlighted that GDP per capita fell for the fifth consecutive quarter, declining by -0.4% in March and -1.3% over the past year.
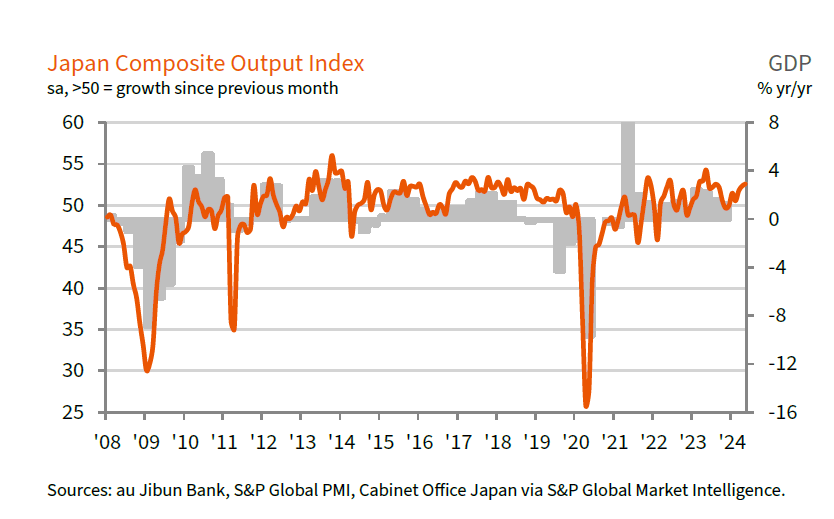
Japan’s PMI composite hits highest since August 2023
Japan's PMI Services index was finalized at 53.8 in May, slightly lower than April's 54.3. Meanwhile, PMI Composite index rose to 52.6 from 52.3 in April, marking its highest level since August 2023 and staying above 50 neutral mark for the fifth consecutive month.
Trevor Balchin, Economics Director at S&P Global Market Intelligence, noted that the Japanese service sector's "strong upturn was sustained," with only slight easing in growth rates for activity and new work. New export business expanded the most since this metric was introduced in September 2014. Both the future activity and employment indices increased since April and were among the highest on record.
Balchin also highlighted that while costs continued to rise sharply, the strong demand for services led firms to be confident in raising prices. In May, average prices charged for services increased at the third-fastest rate on record, following only April 2014 and April 2024.
Japan’s nominal labor earnings rise 2.1% yoy, real wages still declining
Japan's nominal labor cash earnings increased by 2.1% yoy in April, surpassing the expected 1.7% and marking the 28th consecutive month of growth. Excluding bonuses and nonscheduled payments, average wages climbed by 2.3% yoy. However, overtime and other allowances were down by -0.6% yoy.
Despite the rise in nominal wages, real wages fell by -0.7% yoy, continuing a 25-month streak of declines, the longest on record. Nonetheless, the rate of decline was smaller than the revised -2.1% yoy drop in March, as many major companies implemented salary increases during the latest spring annual wage negotiations.
GBPAUD Reacting Higher From Elliott Wave Extreme Area
In this technical blog, we will look at the past performance of the 1-hour Elliott Wave Charts of GBPAUD. In which, the rally from the 09 May 2024 low unfolded in a corrective sequence but provided an extreme trading opportunity. In this case, the pullback managed to reach the equal legs area & provided a buying opportunity. So, we advised members not to sell it but to buy the equal legs area for a minimum reaction higher to happen. We will explain the structure & forecast below:
GBPAUD 1-Hour Elliott Wave Chart From 6.03.2024
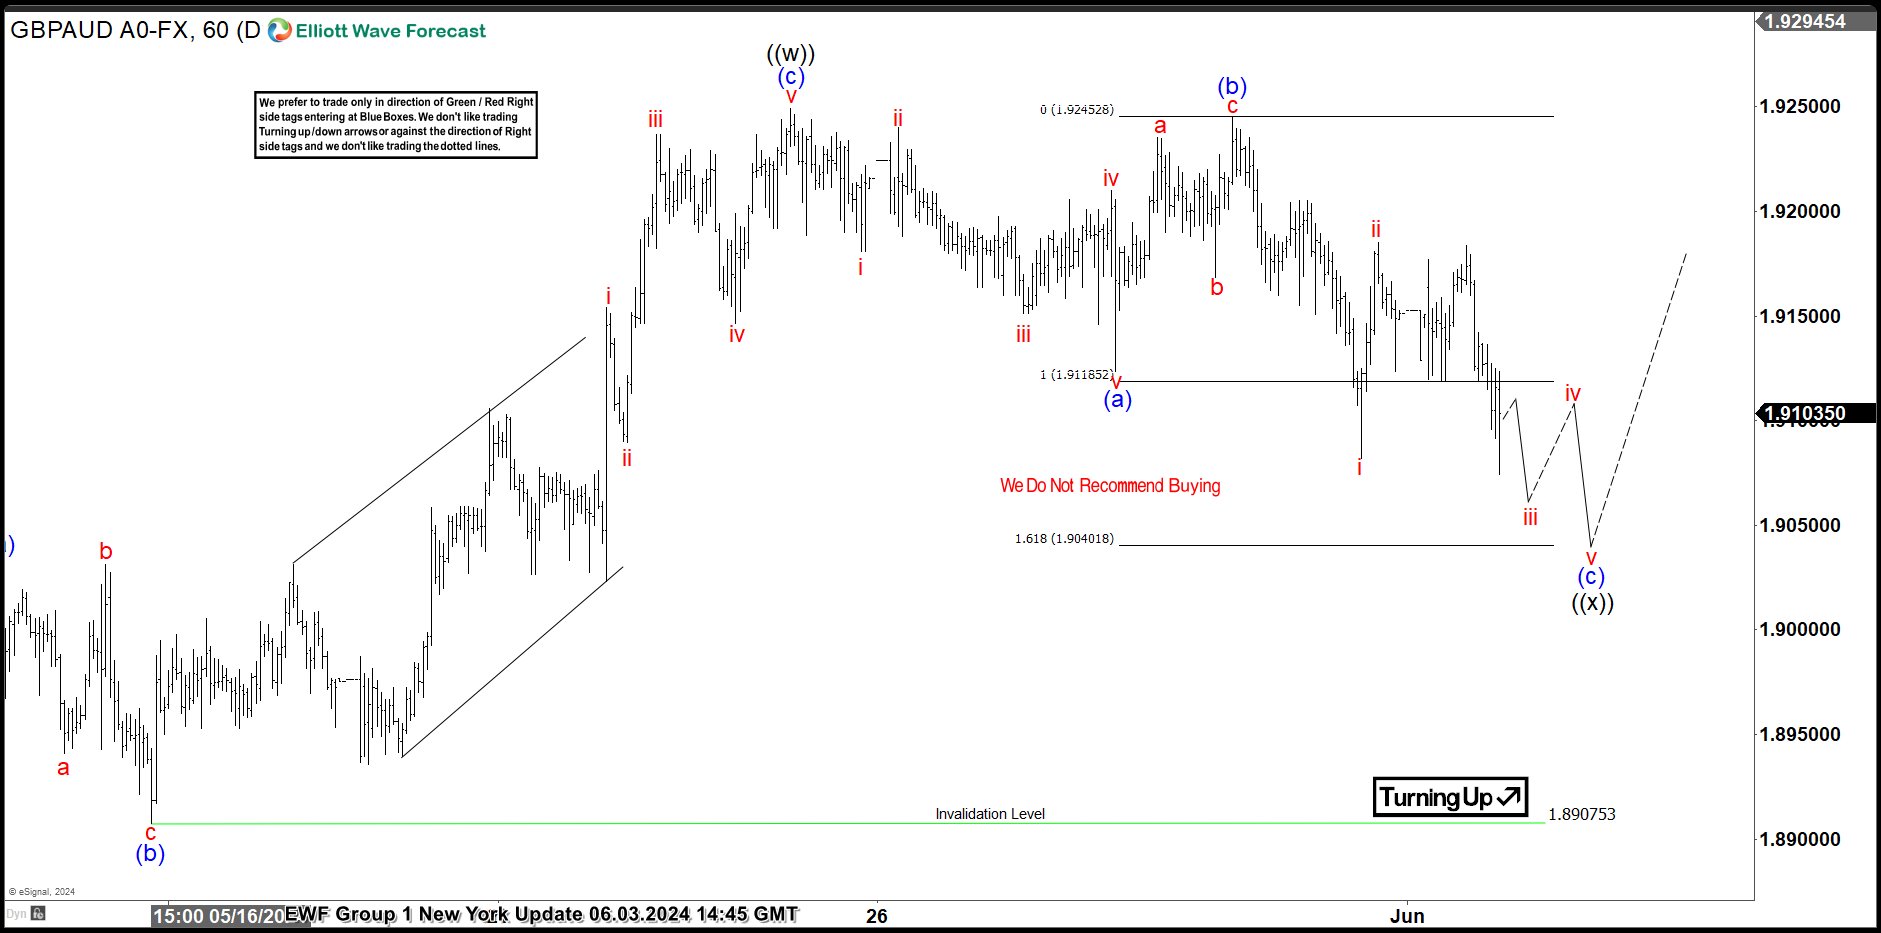
Here’s the 1-hour Elliott wave Chart from the 6.03.2024 NY update. In which, rally to 1.9249 high ended the wave ((w)) & made a pullback in wave ((x)). The internals of that pullback unfolded as Elliott wave zigzag structure where wave (a) ended at 1.9123 low. A bounce to 1.9245 high ended wave (b) bounce. Then the pair started the next leg lower in wave (c) towards 1.9118- 1.9040 equal legs area. From there, buyers were expected to appear looking for new highs ideally or for a 3-wave bounce minimum.
GBPAUD Latest 1-Hour Elliott Wave Chart From 6.04.2024
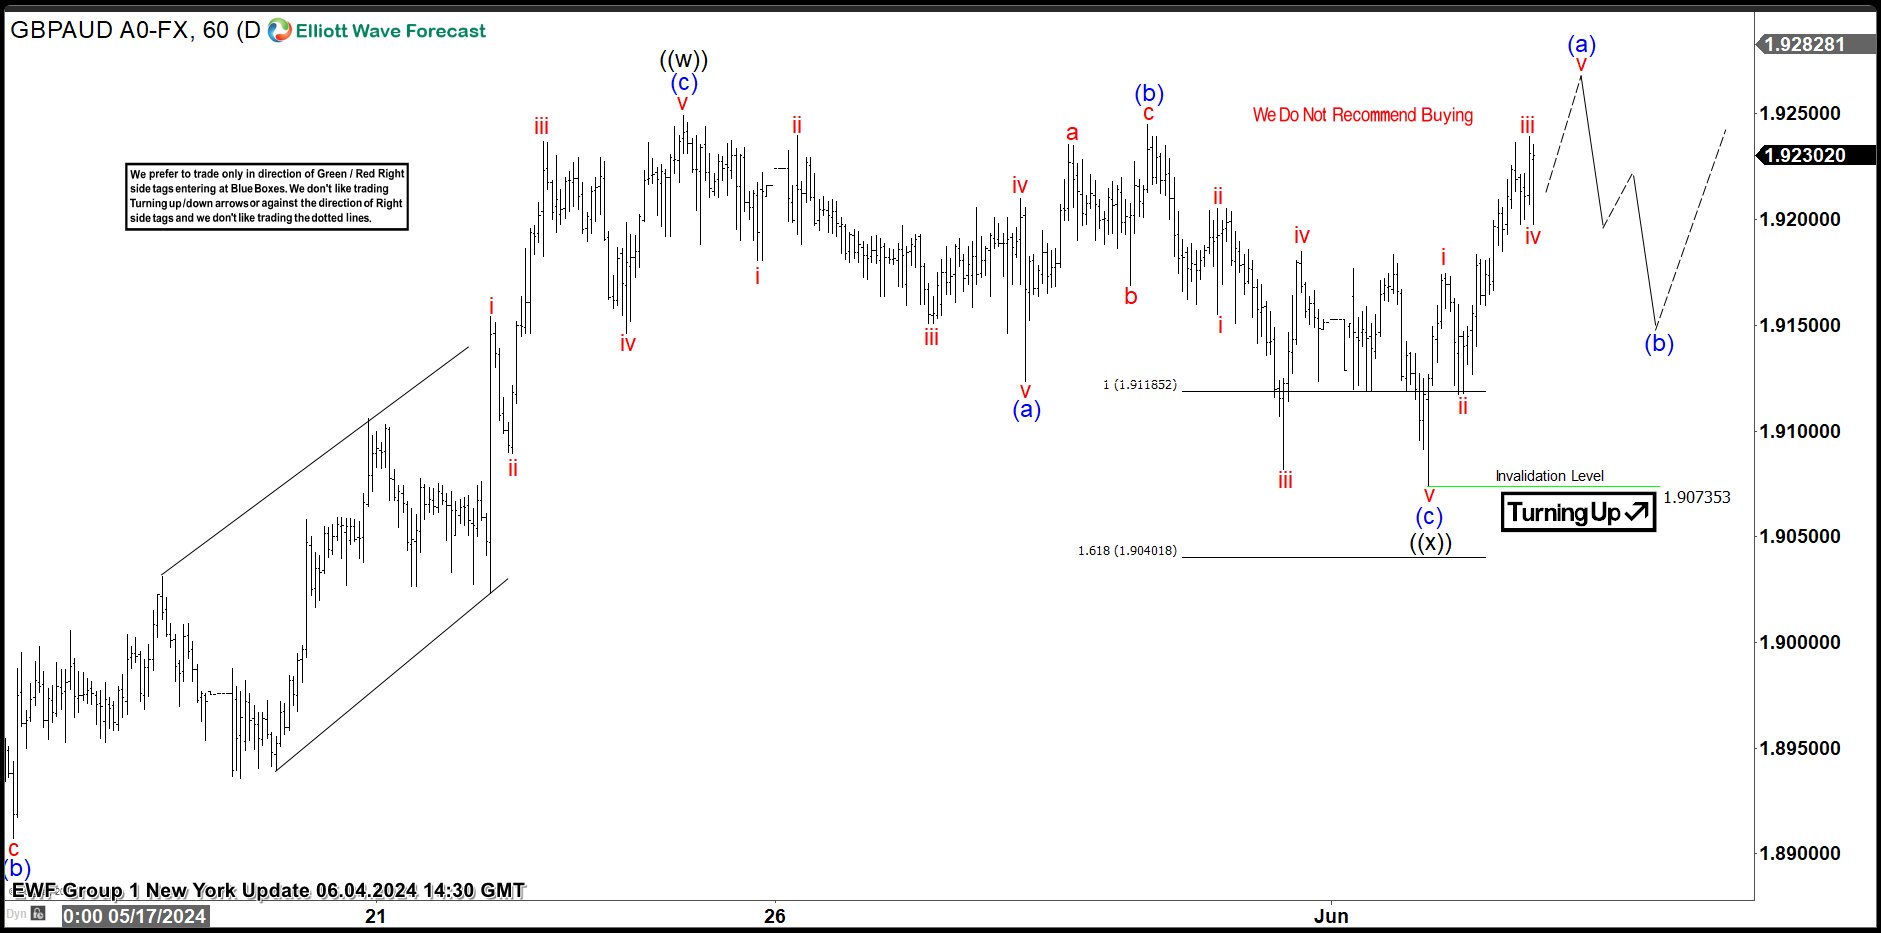
Above is the Elliott wave Chart from the 6.04.2024 NY update. The GBPAUD is showing a reaction higher taking place from the equal legs area. Right after ending the zigzag correction. Allowed members to create a risk-free position shortly after taking a long position. However, a break above 1.9249 high is yet to be seen to confirm the next extension higher & avoid a double correction lower.
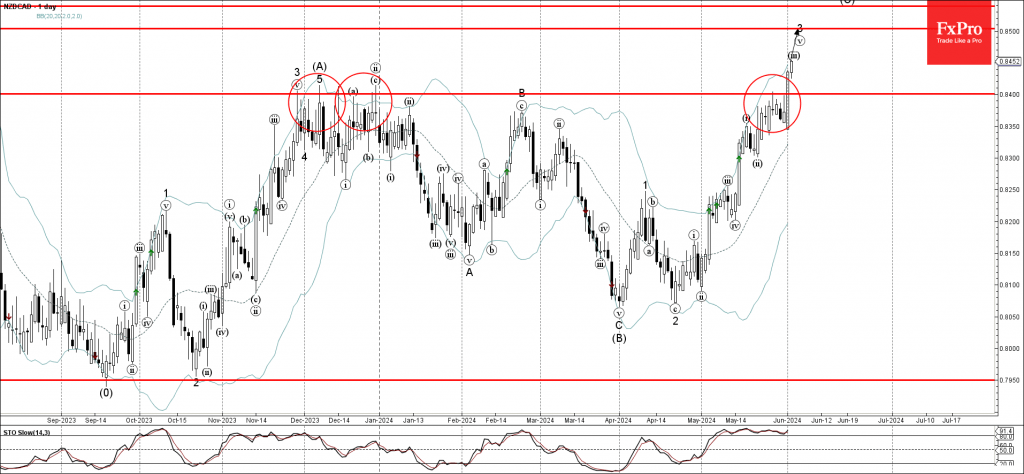
NZDCAD Wave Analysis
- NZDCAD broke resistance level 0.8400
- Likely to rise to resistance level 0.8500
NZDCAD currency pair recently broke strong resistance level 0.8400 (which previously reversed the pair multiple time sin November and December).
The breakout of the resistance level 0.8400 accelerated the active impulse wave 3, which belongs to the higher order impulse wave (C) from the start of March.
Given the bearish Canadian dollar sentiment seen across the FX markets today, NZDCAD currency pair be expected to rise further to the next resistance level 0.8500 (target price for the completion of the active impulse wave 3).
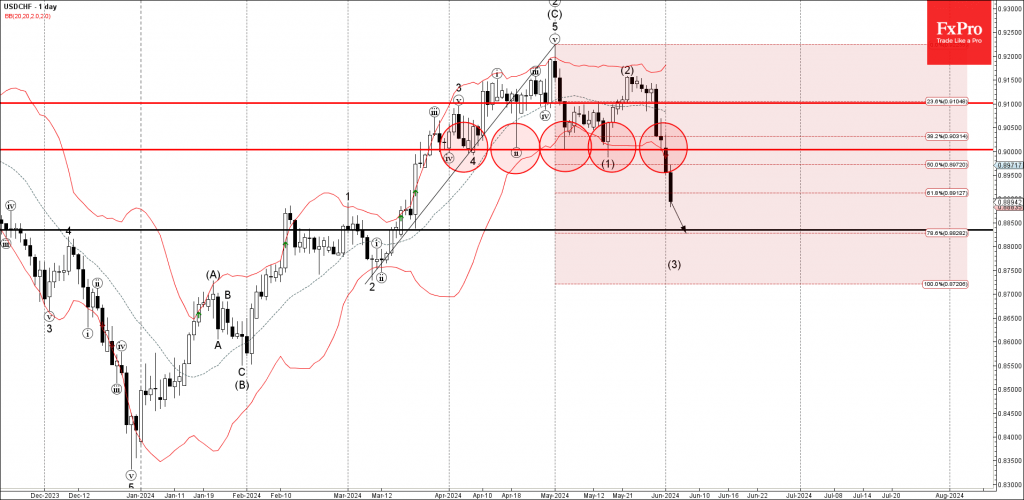
USDCHF Wave Analysis
- USDCHF broke round support level 0.9000
- Likely to fall to support level 0.8850
USDCHF currency pair recently broke the round support level 0.9000 (which has been reversing the price from the start of April).
The breakout of the support level 0.9000 coincided with the breakout of the 50% Fibonacci correction of the previous upward impulse from March.
Given the strong Swiss franc inflows, USDCHF currency pair be expected to fall further to the next support level 0.8850 (former minor support from the end of March).
Dollar Traders Lock Gaze on NFP Report
- Fed sticks to ‘higher for longer’ mentality
- PMIs pose downside risks to nonfarm payrolls
- But point to sticky wage growth
- The data comes out on Friday, at 12:30 GMT
US inflation slows but Fed signals patience
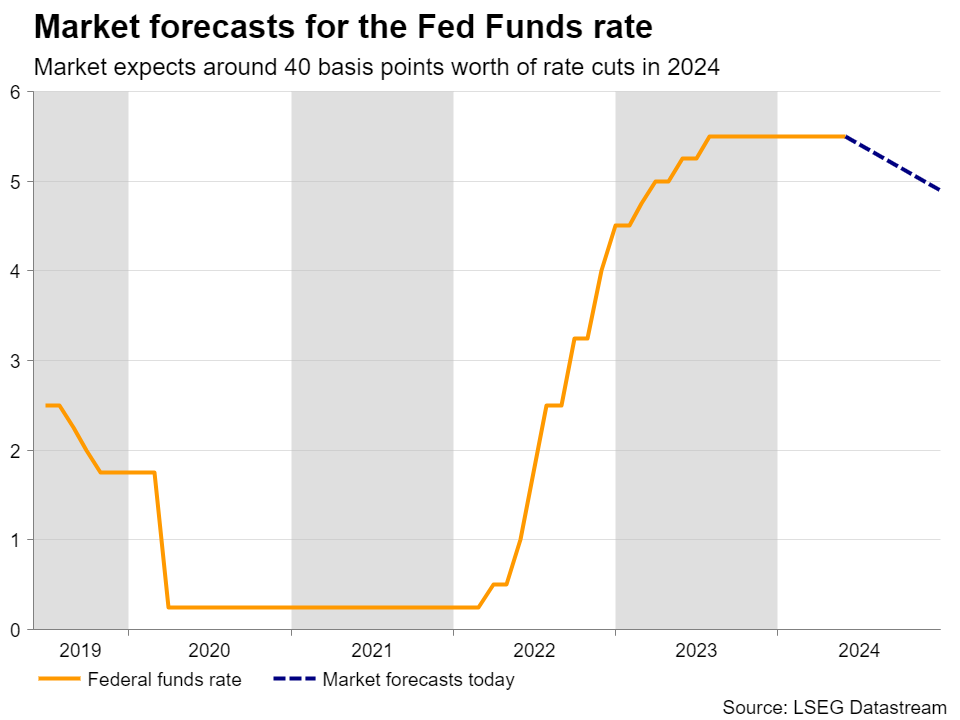
Although the latest CPI data revealed that inflation in the US has resumed its downtrend, Fed officials have been continuously signaling patience about when they may start lowering interest rates, with some of the ultra-hawks, like Minneapolis Fed President Neel Kashkari, even leaving the door open to the possibility of resuming rate hikes.
That said, Kashkari is not a voting member this year and thus, given that most of the rate setters have been abiding by just a ‘higher for longer’ mantra, investors have scaled back their rate cut bets to the extent where only 40bps worth of reductions are expected by the end of the year, with the probability for a first quarter-point cut being delivered in September now resting at around 70%.
NFP could slow, but wages may accelerate
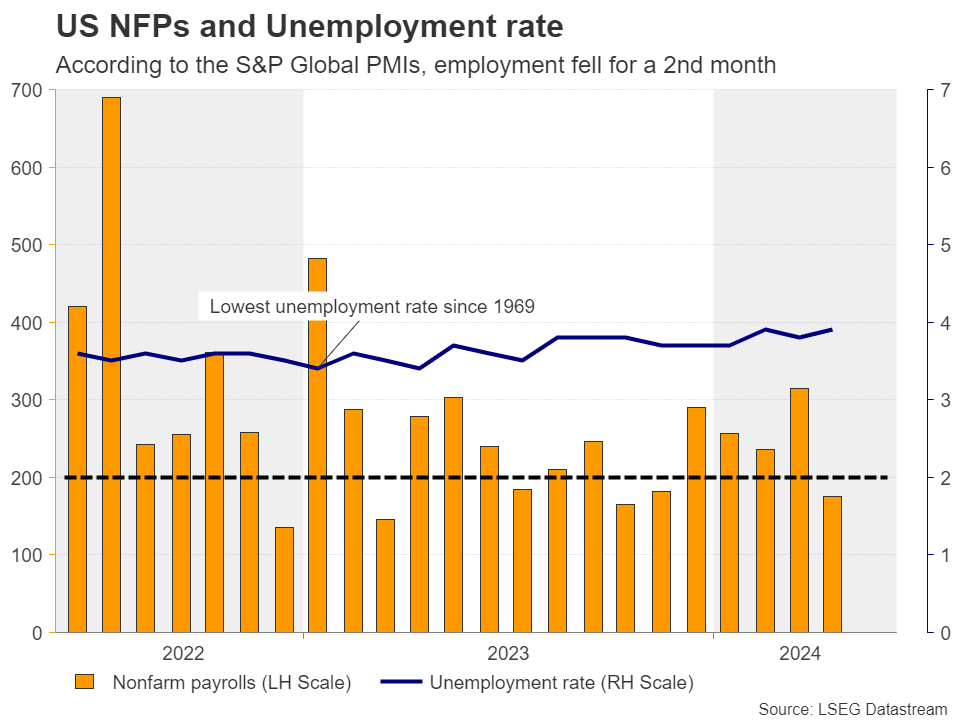
So, as the market tries to figure out whether and when the Fed will decide to press the rate-cut button, Friday’s nonfarm payrolls for May are likely to attract special attention. According to the preliminary S&P Global PMIs for the month, employment fell for a second successive month in May, contrasting with the prevailing hiring trend that’s been in place for 45 months. This poses some downside risks to the forecast of a mild acceleration in nonfarm payrolls to 185k from 175k. The unemployment rate is anticipated to have held steady at 3.9%.
Having said that, input and output prices accelerated in May and, among many others, one of the drivers of input prices was higher labor costs. Thus, even if the official jobs report reveals that the world’s largest economy has added less jobs than in April, average hourly earnings may point to still-elevated wage growth, which could lead to stickier consumer prices in the months to come. Indeed, expectations are for a mild acceleration to 0.3% m/m from 0.2%, which would keep the y/y rate at 3.9%.
Dollar retreat to stay limited
Therefore, even as the labor market continues to show signs of cooling, due to inflationary risks, the Fed may not risk changing its mentality. A still-elevated wage growth rate may revive concerns about whether inflation will meet the 2% objective soon, thereby supporting the US dollar, even if the first reaction is negative due to a potential slowdown in nonfarm payrolls. A good proxy for exploiting some dollar gains may be the dollar/loonie pair. The probability for a BoC rate cut on Wednesday has risen to around 85%, while the total number of bps worth of reductions by the end of the year now rests at around 65. Ergo, a rate cut accompanied by dovish language by the BoC could help dollar/loonie trade north.
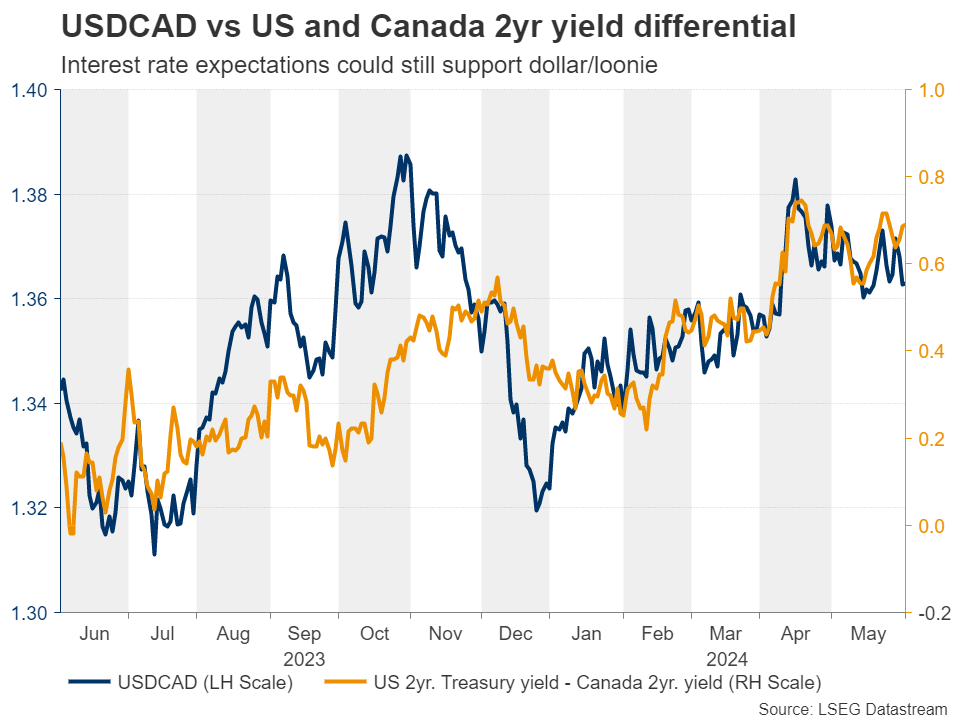
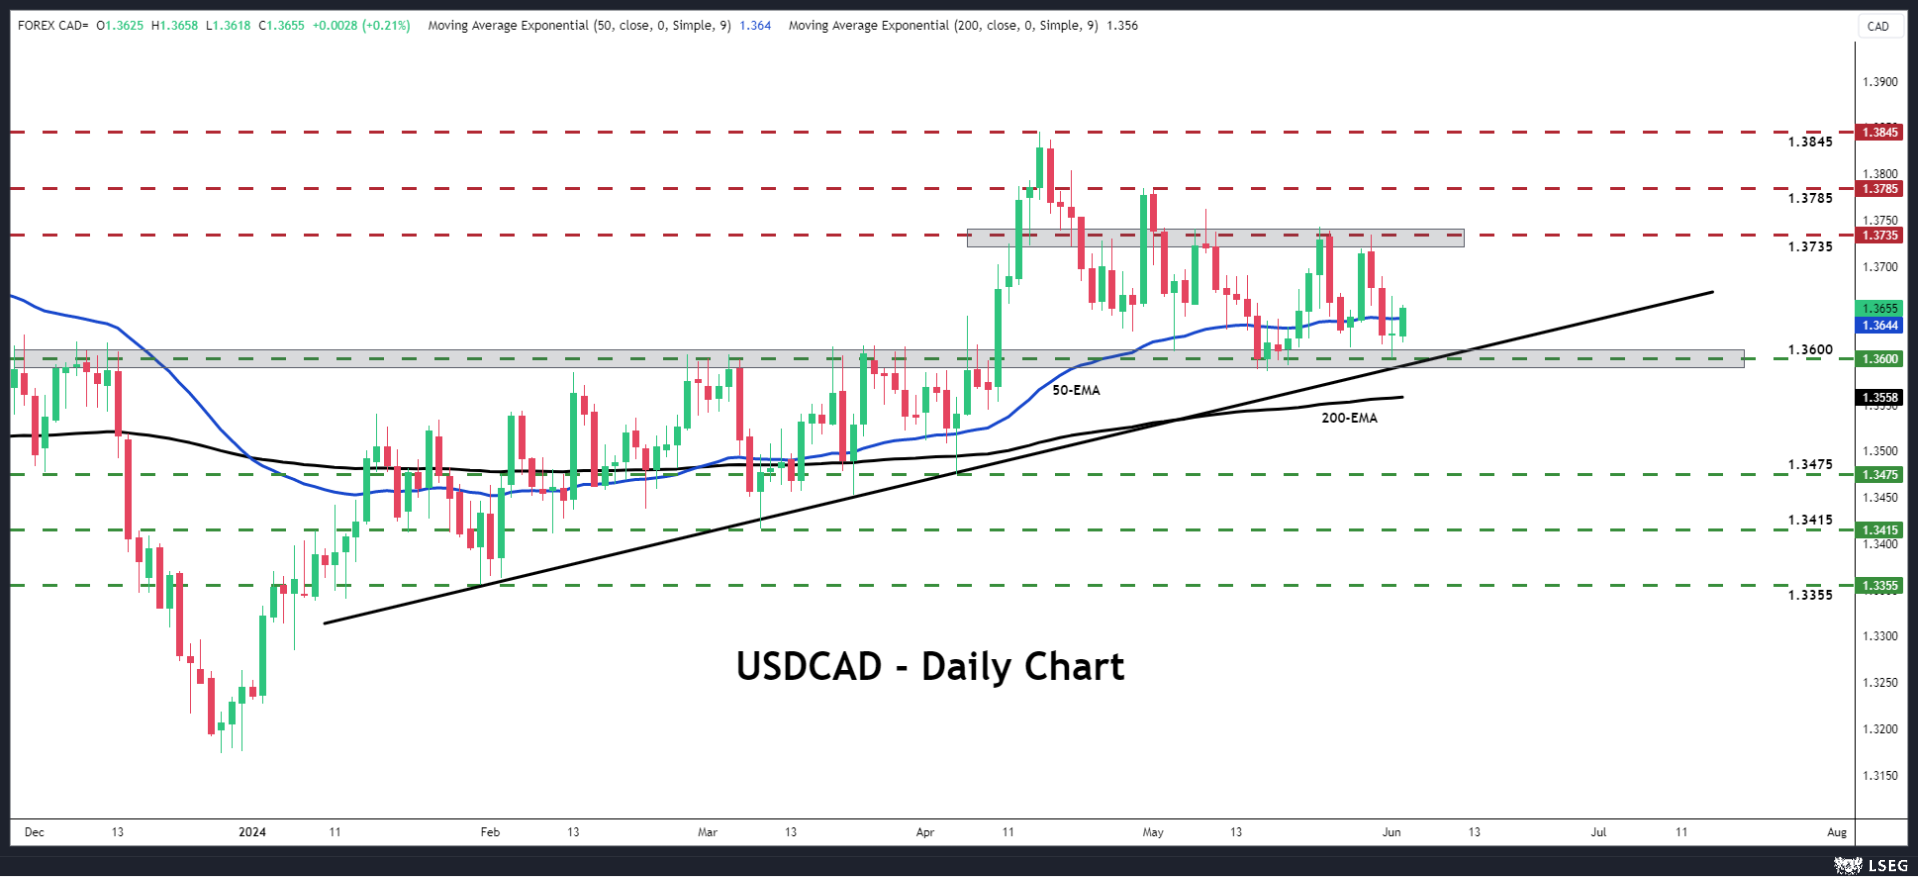
USDCAD uptrend still intact
Technically, dollar/loonie has been trading in a sideways manner lately, staying between the key support zone of 1.3600 and the resistance barrier of 1.3735. That said, in the bigger picture, it continues to hold above the uptrend line drawn from the low of January 31, which means that the near-term outlook remains cautiously positive.
If the bulls are willing to charge again, they may test the 1.3735 area again soon, the break of which could signal the resumption of the prevailing uptrend. The first line of bear-defense may be at around 1.3785, with the next resistance marked by the high of April 16, at around 1.3845. For the picture to darken, the pair may need to drop below the crossroads of the 1.3600 zone and the aforementioned uptrend line.
Sunset Market Commentary
Markets
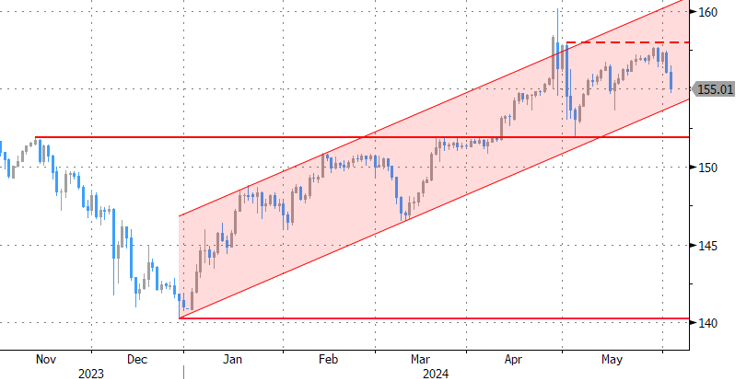
Markets remained stuck in yesterday’s (US) trading mode in absence of important EMU eco data or ECB talk (silent period ahead of Thursday’s meeting). That means a bid for core bonds as the (US) growth part of the equation enters the spotlight. Investors yesterday zoomed in on significantly declining new orders in the US manufacturing ISM. The demand side of the story is one out of three factors pulling oil prices lower as well. The other ones being supply (OPEC+ will scale back production cuts after September) and technical reasons (Brent drops below $80.5/ support area). The downleg in oil prices continues today with Brent crude trading near $76/b from $77/b. Support coming from the YTD low kicks in at $74.38/b. US Treasuries and German Bunds already trade higher again in the run-up to April JOLTS job openings. An unexpected decline of openings only reinforced this momentum. US yields lose 5 to 6 bps with the belly of the curve outperforming the wings. The US 2-yr (4.78%) and 10-yr yield (4.36%) are sliding towards the mid-May lows of respectively 4.70% and 4.31%. German yields lose 4.5 to 7 bps in a similar curve move. We retain May German unemployment data which showed a 25k increase (vs 7k expected). It matches the third highest monthly rise since July 2022. The German unemployment rate held steady at 5.9%. The Federal Labor Agency said that the traditional spring recovery hasn’t really taken off this year. In FX space, EUR/USD (1.0875) moved back into more familiar territory after yesterday’s first close above 1.09 since March 20. The jury remains out given this week’s remaining US eco data (ADP, ISM services, payrolls) and ECB policy meeting. The trade-weighted dollar similarly bounced off the 104 support area for now. USD/JPY is exception to the rule as core bond yields decline. The pair dips from 156+ to 155. Finance Minister Suzuki this morning commented on the country’s interventions to counter excessive FX moves ‘which were driven by speculation’. He believes that “they had a certain effect”. Sources close to the Bank of Japan also suggested that the central bank will likely discuss the reduction of bond purchases as early as the next, June 14, policy meeting. They currently buy at a pace of roughly JPY 6tn per month. Any shift will be gradual according to the sources. Japanese yields briefly responded to the Bloomberg article but eventually followed today’s global market move.
News & Views
Swiss inflation rose 0.3% m/m in May. The as-expected outcome matched last month’s pace and kept the yearly figure at 1.4%. Switzerland’s Federal Statistical Office attributed the increase to housing rentals (amid the rise of a key reference rate) and international package holidays as well various fresh vegetables and petrol. Core inflation (excluding fresh and seasonal products, energy and fuel) rose 0.2% m/m and 1.2% y/y - slightly below the 1.3% consensus. That prompted a kneejerk move lower of the Swiss franc against the euro. But CHF quickly overcame this weakness to even become one of the top G10 performers today. EUR/CHF drops towards the 0.97 big figure, the lowest since mid-April, in lockstep with core bond yields even as money markets have raised bets to >50% for a rate cut by the Swiss National Bank on June 20 in the wake of the CPI release. Market sentiment is fragile but not outright risk-off as to add to current CHF strengthening. In a speech last week, SNB president Jordan did say the franc had weakened more than enough after EUR/CHF hit 0.99+ from +0.93 at the beginning of the year. His comments triggered a turnaround that apparently has strong legs and more room to run.
Czech nominal wages grew 7% y/y in the first quarter of the year, easing only marginally from an upwardly revised 7.1% a quarter earlier. In real terms, wages shot up 4.8% y/y with Q4’s negative growth reduced from -1.2% to just -0.5%. It’s the first positive real wage increase in nine quarters. It could turn out to be a boost for consumer spending and therefore help kickstart the currently sluggish economic recovery. Q1 GDP numbers were revised down from 0.5% to 0.3% last week. Today’s outcome was 0.6 ppts higher than the Czech National Bank’s spring forecast for both nominal and real wage growth. It supports their hawkish stance which will most likely end up in the central bank cutting at a 25 bps clip from June on instead of the 50 bps pace so far in 2024. Czech swap rates add up to 3 bps at the front end of the curve, parting ways with core markets and regional peers. The CZK tried to eke out a gain at first but succumbed eventually. EUR/CZK moved from 24.66 to 24.76.
Graphs
USD/JPY: JPY and CHF benefit from lower core bond yields
EUR/CHF: SNB Jordan’s CHF comments proved to be a turning point for the swiss franc
Oil prices: triple whammy of demand concern, more supply and deteriorating technical picture
US 10-yr yield approaches 4.31% support level with key important US eco data still to come this week
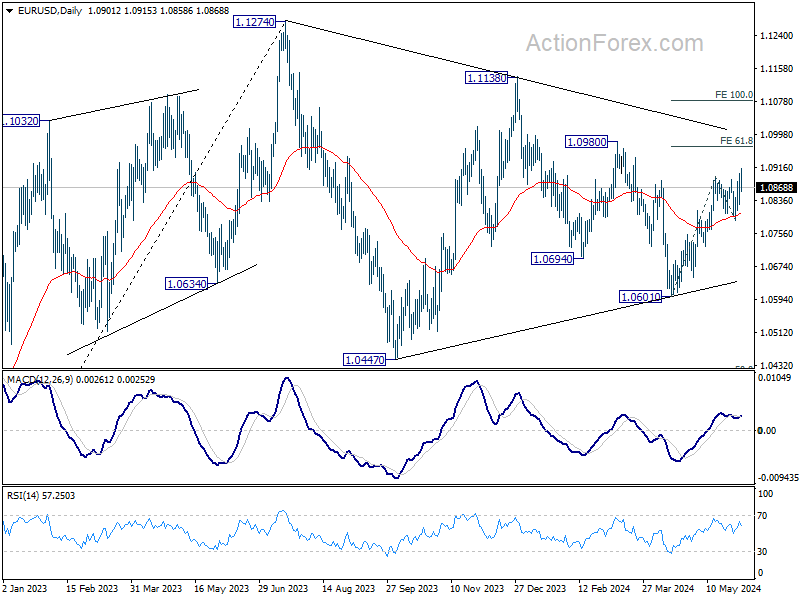
EUR/USD Mid-Day Outlook
Daily Pivots: (S1) 1.0854; (P) 1.0879; (R1) 1.0931; More….
Further rally is still expected in EUR/USD despite current retreat. Rise from 1.0601 should target 61.8% projection of 1.0601 to 1.0894 from 1.0788 at 1.0969. However, break of 1.0788 will turn intraday bias back to the downside for deeper pullback instead.
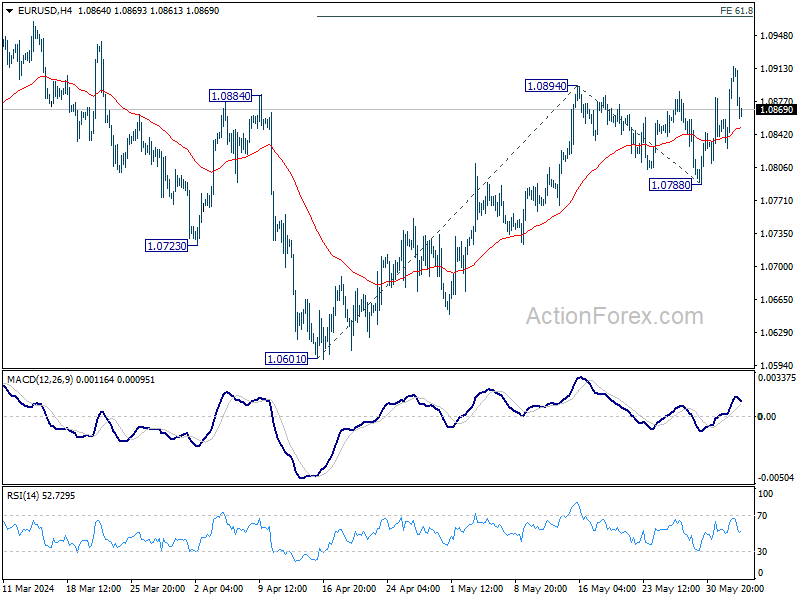
In the bigger picture, price actions from 1.1274 are viewed as a corrective pattern. Fall from 1.1138 is seen as the third leg and could have completed. Firm break of 1.1138 will argue that larger up trend from 0.9534 (2022 low) is ready to resume through 1.1274 high. On the downside, break of 1.0788 support will extend the corrective pattern instead.