Sample Category Title
AUD/USD and NZD/USD Could Continue Higher
AUD/USD is correcting gains from the 0.6700 zone. NZD/USD is showing positive signs and might attempt a fresh increase above 0.6200.
Important Takeaways for AUD USD and NZD USD Analysis Today
- The Aussie Dollar started a downside correction from 0.6700 against the US Dollar.
- There is a key bullish trend line forming with support at 0.6645 on the hourly chart of AUD/USD at FXOpen.
- NZD/USD is gaining pace above the 0.6145 support zone.
- There is a major bullish trend line forming with support at 0.6170 on the hourly chart of NZD/USD at FXOpen.
AUD/USD Technical Analysis
On the hourly chart of AUD/USD at FXOpen, the pair started a fresh increase from the 0.6590 support. The Aussie Dollar was able to clear the 0.6630 resistance to move into a positive zone against the US Dollar.
There was a close above the 0.6645 resistance and the 50-hour simple moving average. Finally, the pair tested the 0.6700 zone. A high was formed near 0.6698 and the pair is now correcting gains.
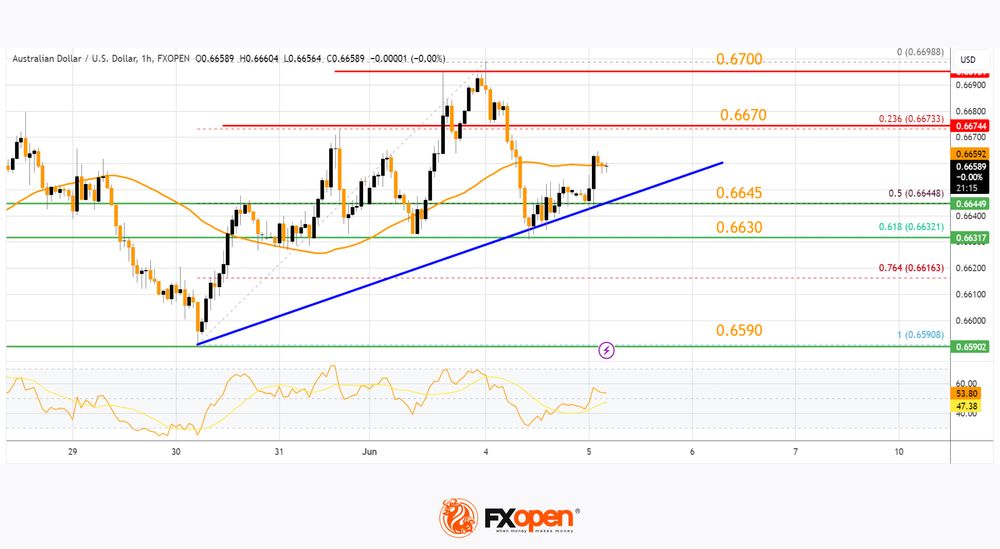
There was a move below the 0.6670 level. The pair declined below the 50% Fib retracement level of the upward move from the 0.6590 swing low to the 0.6698 high. On the downside, initial support is near a key bullish trend line at 0.6645.
The next major support is near the 61.8% Fib retracement level of the upward move from the 0.6590 swing low to the 0.6698 high at 0.6630.
If there is a downside break below the 0.6630 support, the pair could extend its decline toward the 0.6590 level. Any more losses might signal a move toward 0.6520.
On the upside, the AUD/USD chart indicates that the pair is now facing resistance near 0.6670. The first major resistance might be 0.6700. An upside break above the 0.6700 resistance might send the pair further higher.
The next major resistance is near the 0.6720 level. Any more gains could clear the path for a move toward the 0.6750 resistance zone.
NZD/USD Technical Analysis
On the hourly chart of NZD/USD on FXOpen, the pair started a steady increase from the 0.6085 zone. The New Zealand Dollar broke the 0.6130 resistance to start the recent increase against the US Dollar.
The pair settled above 0.6145 and the 50-hour simple moving average. It tested the 0.6200 zone and is currently correcting gains. The pair corrected lower below the 0.6170 level. The pair also traded below the 23.6% Fib retracement level of the upward wave from the 0.6088 swing low to the 0.6198 high.
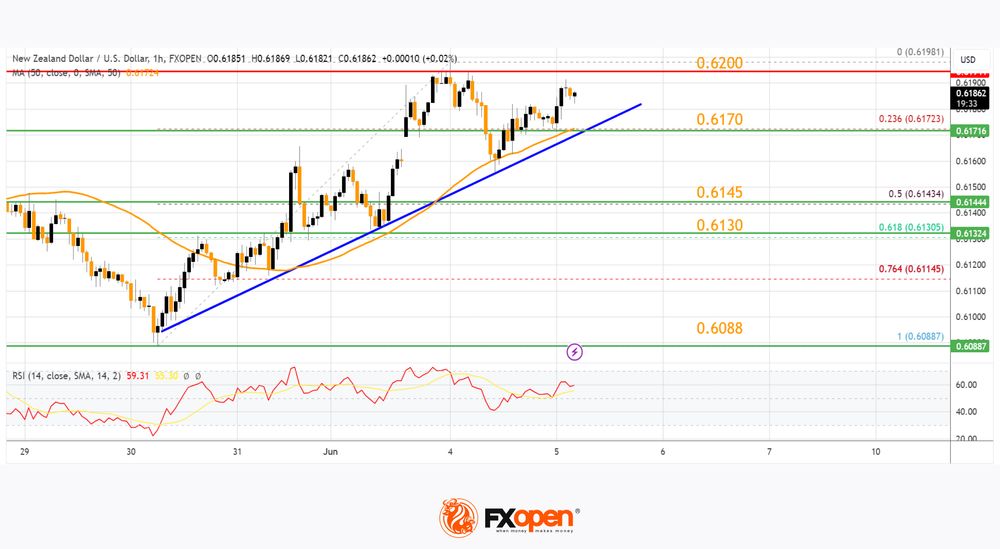
The NZD/USD chart suggests that the RSI is still above 50 and signaling more upsides. On the downside, there is major support forming near 0.6170 and a trend line.
The next major support is near the 50% Fib retracement level of the upward wave from the 0.6088 swing low to the 0.6198 high at 0.6145.
If there is a downside break below the 0.6145 support, the pair might slide toward the 0.6130 support. Any more losses could lead NZD/USD in a bearish zone to 0.6088.
On the upside, the pair might struggle near 0.6200. The next major resistance is near the 0.6220 level. A clear move above the 0.6220 level might even push the pair toward the 0.6250 level. Any more gains might clear the path for a move toward the 0.6320 resistance zone in the coming days.
Trade over 50 forex markets 24 hours a day with FXOpen. Take advantage of low commissions, deep liquidity, and spreads from 0.0 pips. Open your FXOpen account now or learn more about trading forex with FXOpen.
This article represents the opinion of the Companies operating under the FXOpen brand only. It is not to be construed as an offer, solicitation, or recommendation with respect to products and services provided by the Companies operating under the FXOpen brand, nor is it to be considered financial advice.
EUR/USD to Hold Below 1.09 Given the Risk of Euro Weakness
Markets
The three-day Treasury rally morphed into a four-day advance yesterday. The common theme is some worry on (US) growth momentum. It all started last Thursday with downward revisions to Q1 GDP data (especially consumption). Slightly disappointing spending data on Friday, a steeper drop in new orders in the manufacturing sector on Monday and a sharp reduction in the amount of outstanding US vacancies (JOLTS report; lowest tally since February 2021) yesterday all provided core bond momentum. Oil prices trade $7/b lower (Brent) over the same time period adding a virtuous element to the bond rally. US yields lost another 3.8 bps (2-yr) to 6.8 bps (7-yr) yesterday with the US 10-yr yield testing the mid-May range bottom at 4.31%. The past sessions’ move is mainly triggered by a drop in real rates. US Treasuries outperformed German Bunds with German yields closing 3.5 bps to 4.6 bps lower on the day. Technical resistance (EUR/USD 1.09-area) and the approaching ECB-meeting prevented a more EUR/USD gains with the pair finishing at 1.0879. Risk sentiment on stock markets soured in Europe (-1%), but Wall Street eventually managed to turn a negative start into a slightly positive finish.
Today’s US eco calendar contains ADP employment change and services ISM. Consensus expects another solid job growth figure (+175k) while the services ISM is forecast to undo last month’s slip below the 50 boom/bust mark which was only the second since the early stages of the Covid-outbreak. From a short-term point of view, we believe that any form of disappointment in the data could still extend the Treasury rally with the 4.31%-mark in the US 10-yr yield at risk of giving away. Next levels to watch are 4.25% (50% retracement on this year’s upmove) and 4.19% (early April low). We expect EUR/USD to hold below 1.09 given the risk of euro weakness in the wake of the flagged ECB rate cut which will automatically trigger anticipation on more to come and more than at is currently discounted.
News & Views
A survey of the UK Think Thank ‘Official Monetary and Financial Institutions Forum’ (OMFIF) sees a potential change in the allocation strategy of global reserve managers. OMFIF surveyed 73 central banks with $5.4tn of international reserves under management. In the wake of the 2008 financial crisis, diversification was a key consideration. In the period of the pandemic and the war in Ukraine, assessment managers turned to safe have currencies and assets. According to OMFIF ,this year the percentage of reserve managers that expects to go risk-on in their portfolios has doubled to 29% from 14% in 2023. On currencies, cyclical factors are driving reserve managers towards the dollar. Over the next 12-24 months, a net 18% of respondents expect to increase their allocation to the dollar primarily due to the positive outlook for the US economy and higher interest rates. The euro is next highest at net 7%, suggesting that reserve managers will double down on traditional reserve currencies Appetite for the renminbi has soured. Even after a rise of the share of gold from 9% to 11% last year, 15% of the respondents indicate to raise the proportion of gold in a 1-2y horizon.
The Australian economy grew a modest 0.1% Q/Q in the first quarter of the year. Activity in this respect was 1.1% higher compared to the same period in 2023. The Australian Bureau of Statistics said that “GDP growth was weak in March, with the economy experiencing its lowest through the year growth since December 2020. GDP per capita fell for the fifth consecutive quarter, falling 0.4% in March and 1.3% through the year”. Household spending rose 0.4% Q/Q, but this was mostly on essentials like electricity, health, rent and food. Capital investment decreased 0.9%. Net exports subtracted 0.9 ppts from growth. Inventories via higher imports add 0.7 ppts. Despite modest spending growth, the household savings ratio declined to 0.9% as income received grew at the lowest rate since December 2021. Still, with inflation showing sticky (3.6% Y/Y CPI in April), there is little room for the RBA to embark for an easing cycle anytime soon. AUD/USD trades little changed near 0.665.
Graphs
GE 10y yield
ECB President Lagarde clearly hinted at a June rate cut which has broad backing. A more bumpy inflation path in H2 2024, the EMU economy gradually regaining traction and the Fed’s higher for longer US strategy make follow-up moves difficult. Markets are coming to terms with that. The German 10y yield set a new YtD top at 2.7%.

US 10y yield
The Fed in May acknowledged the lack of progress towards the 2% inflation objective, but Fed Chair Powell indicated that further tightening was unlikely. However, the FOMC Minutes still showed internal debate on whether policy is restrictive enough. Sticky inflation suggests any rate cut will be a tough balancing act while several policy makers hint at a higher neutral rate. The US 10-y yield is stuck in the 4.3/4.7% trading range.
EUR/USD
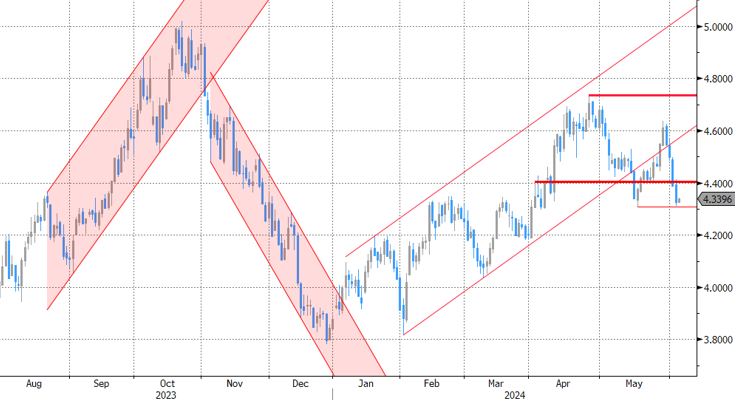
Economic divergence, a likely desynchronized rate cut cycle with the ECB exceptionally taking the lead and higher than expected US CPI data pushed EUR/USD to the 1.06 area. From there, better EMU data gave the euro some breathing space. The dollar lost further momentum on softer than expected early May US data. Some further consolidation in the 1.06/1.09 area might be on the cards short-term.

EUR/GBP
Debate at the Bank of England is focused at the timing of rate cuts. Slower than expected April disinflation and a surprise general election on July 4 suggest that a June cut in line with the ECB looks improbable. Sterling gained momentum with money markets now discounting a Fed-like scenario. EUR/GBP tested the 2023 & 2024 lows near 0.85. We expect this important support level to hold.

GBP/JPY Daily Outlook
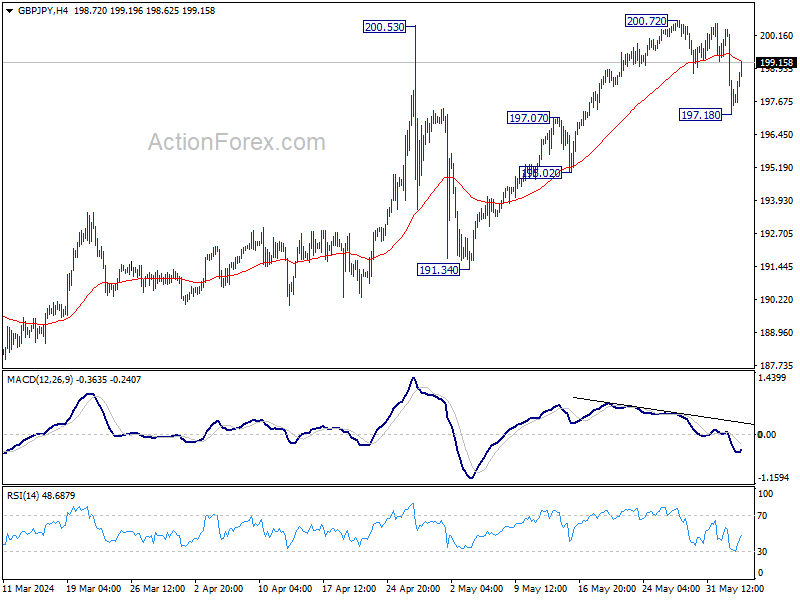
Daily Pivots: (S1) 196.55; (P) 198.48; (R1) 199.73; More….
GBP/JPY recovery after diving to 197.18 support, and intraday bias is turned neutral first. Nevertheless, current development suggests that rise from 191.34 has completed at 200.72 after rejection by 200.53. On the downside, break of 197.18 will resume the fall to 155.02. Further break of 195.02 will target 191.34 support next.
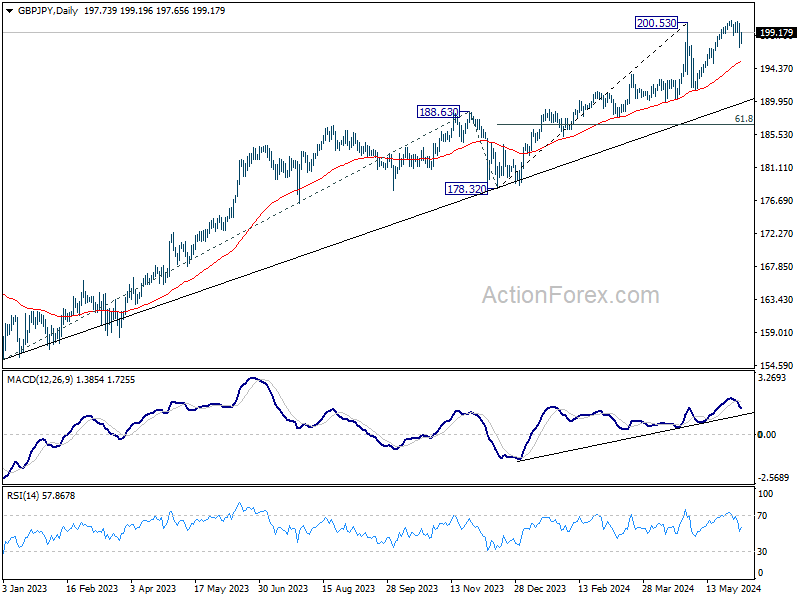
In the bigger picture, as long as 188.63 resistance turned support holds, long term up trend is expected to continue. Sustained trading above 200.53 will pave the way to 100% projection of 155.33 to 188.63 from 178.32 at 211.62.
EUR/JPY Daily Outlook
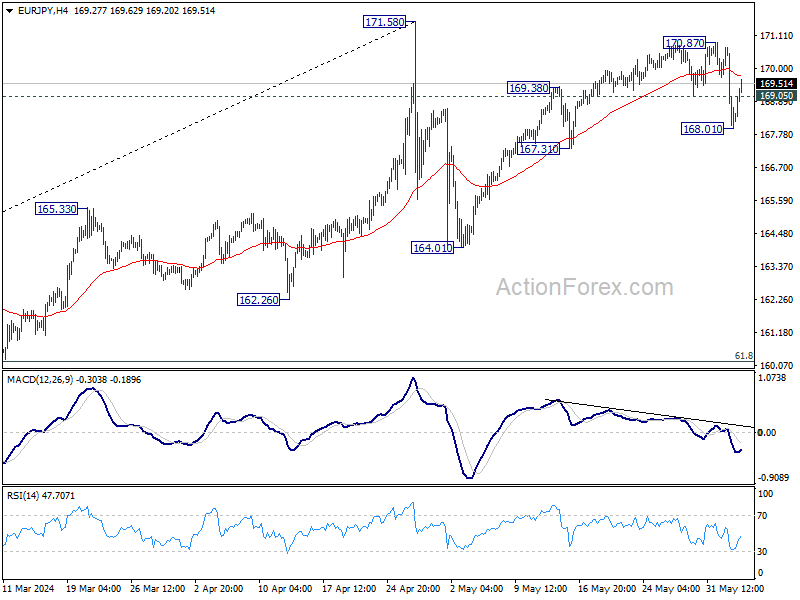
Daily Pivots: (S1) 167.46; (P) 169.09; (R1) 170.15; More….
EUR/JPY recovers after dipping to 168.01 and intraday bias is turned neutral. Nevertheless, current development suggests that rebound from 164.31 has completed at 170.81. Risk will now stay on the downside as long as 170.87 resistance holds. Below 168.01 will target 167.31 support first. Break there will target 164.01 support next.
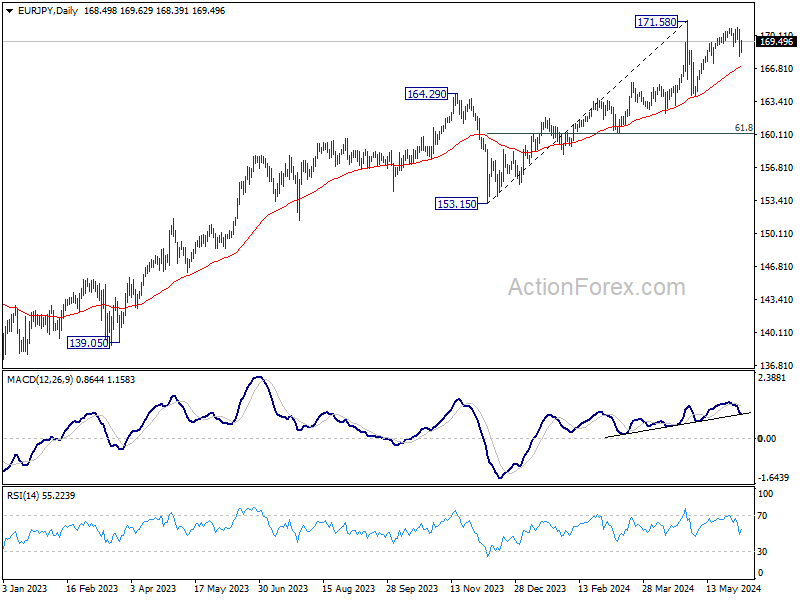
In the bigger picture, a medium top was formed at 171.58 after brief breach of 169.96 (2008 high). But as long as 55 W EMA (now at 166.81) holds, price actions from there is seen as correcting the rise from 153.15 only. That is, larger up trend remains in favor to continue. However, sustained break of 55 W EMA will argue that larger scale correction is underway and target 153.15 support.
EUR/GBP Daily Outlook
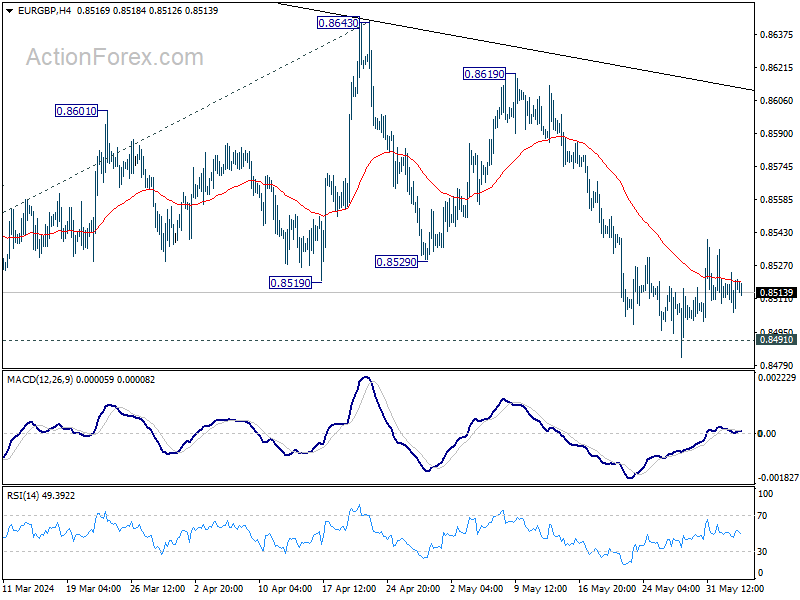
Daily Pivots: (S1) 0.8509; (P) 0.8517; (R1) 0.8527; More….
No change in EUR/GBP's outlook and intraday bias stays neutral for the moment. Further decline is expected as long as 55 D EMA (now at 0.8549) holds. Decisive break of 0.8491/7 will resume larger down trend to 0.8376 projection level next. However, sustained break of 55 D EMA will turn bias back to the upside for 0.9643 resistance instead.
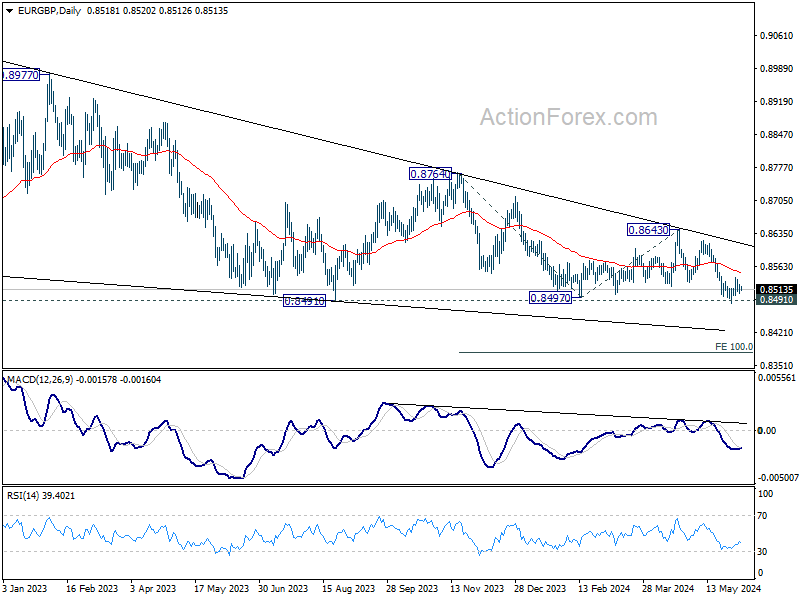
In the bigger picture, outlook remains bearish as EUR/GBP is capped below medium term falling trendline. That is, down trend from 0.9267 (2022 high) is still in progress. Firm break of 0.8491/7 will target 100% projection of 0.8764 to 0.8497 from 0.8643 at 0.8376.
EUR/AUD Daily Outlook
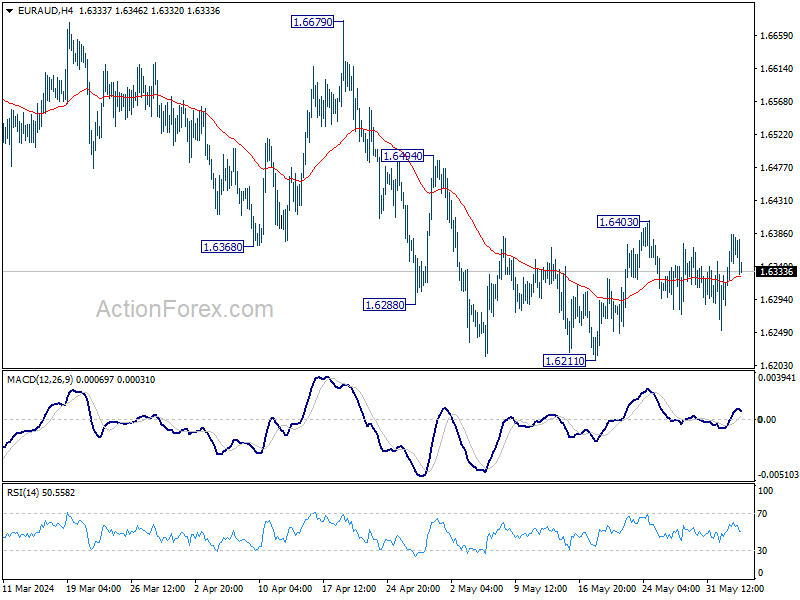
Daily Pivots: (S1) 1.6304; (P) 1.6345; (R1) 1.6401; More….
Range trading continues in EUR/AUD and intraday bias remains neutral for the moment. On the downside, firm break of 1.6211 support will resume the whole decline from 1.6742, as the third leg of the correction from 1.7062. On the upside, above 1.6403 will resume the rebound from 1.6211 instead.
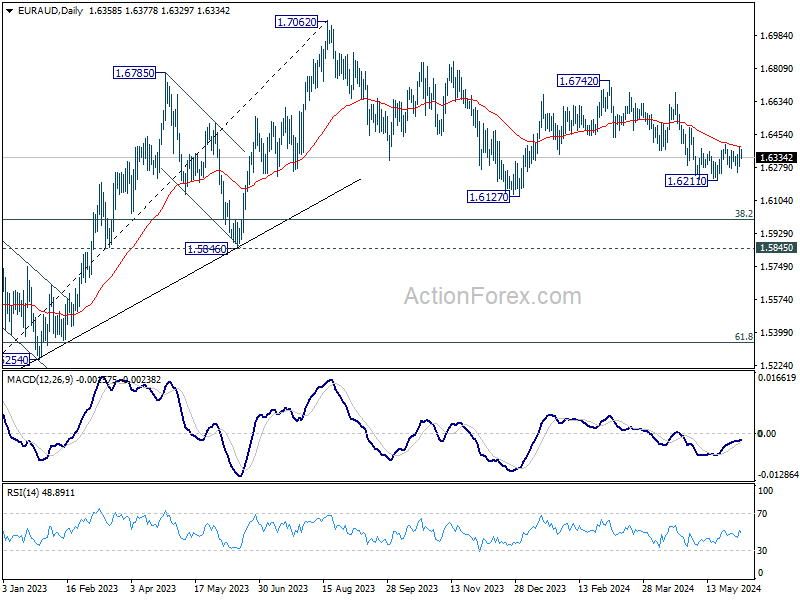
In the bigger picture, fall from 1.7062 medium term top is seen as a correction to the up trend from 1.4281 (2022 low). In case of deeper fall, strong support is expected around 1.5846 and 38.2% retracement of 1.4281 to 1.7062 at 1.6000 to bring rebound. Break of 1.7062 is in favor as a later stage.
EUR/CHF Daily Outlook
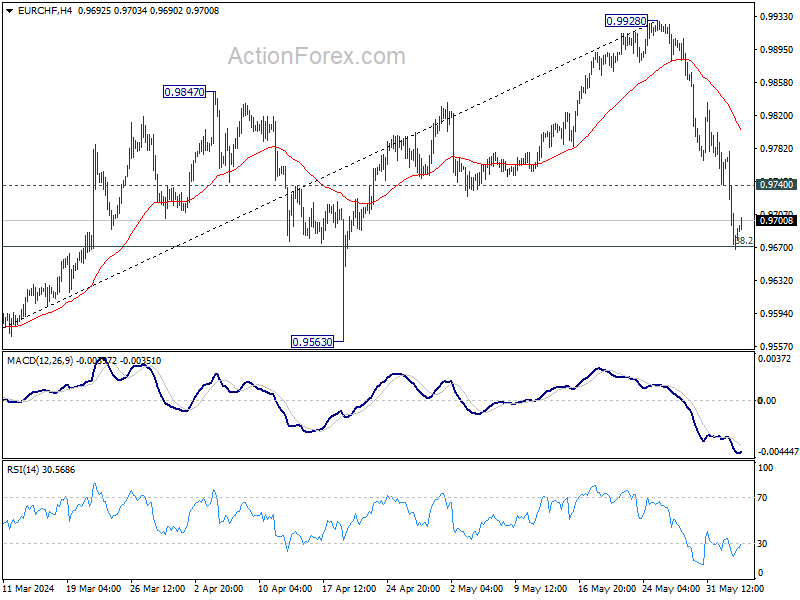
Daily Pivots: (S1) 0.9643; (P) 0.9712; (R1) 0.9754; More….
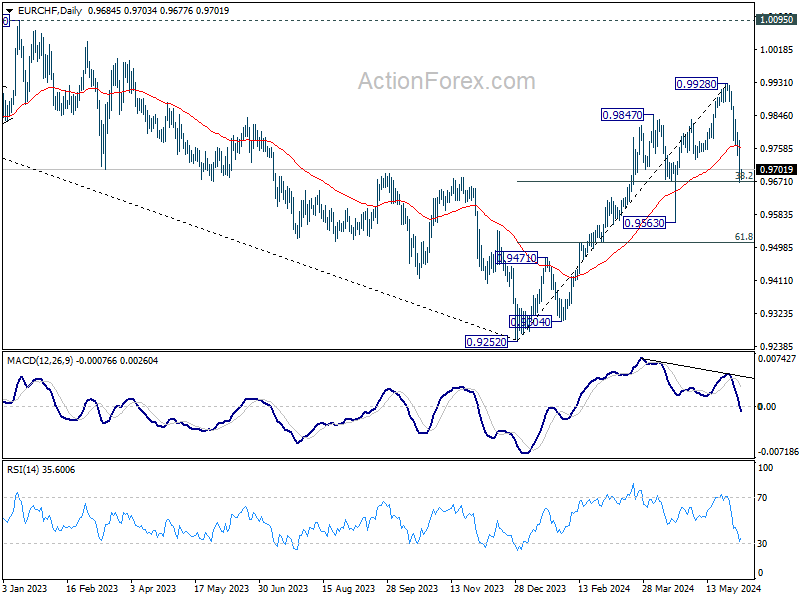
EUR/CHF's fall from 0.9928 extended lower last week and touched 38.2% retracement of 0.9252 to 0.9928 at 0.9670. Strong support is expected from this fibonacci level to bring rebound. Break of 0.9740 minor resistance will turn intraday bias back to the upside. Nevertheless, sustained break of 0.9670 will bring deeper fall to 0.9563 support instead.
In the bigger picture, as long as 0.9563 support holds, rise from 0.9252 medium term bottom is still in favor to continue. Next target is 38.2% retracement of 1.2004 (2018 high) to 0.9252 (2023 low) at 1.0303, even just as a correction to the down trend from 1.2004.
USD/CAD Daily Outlook
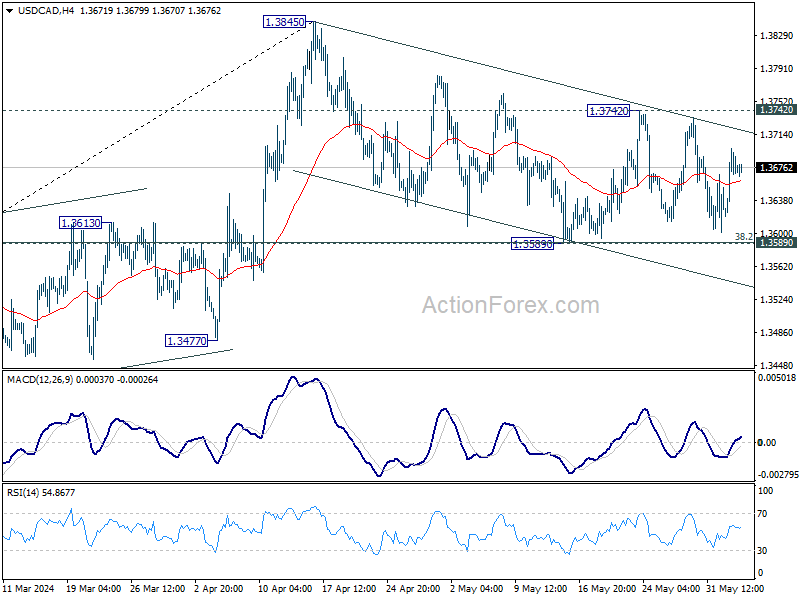
Daily Pivots: (S1) 1.3631; (P) 1.3665; (R1) 1.3709; More….
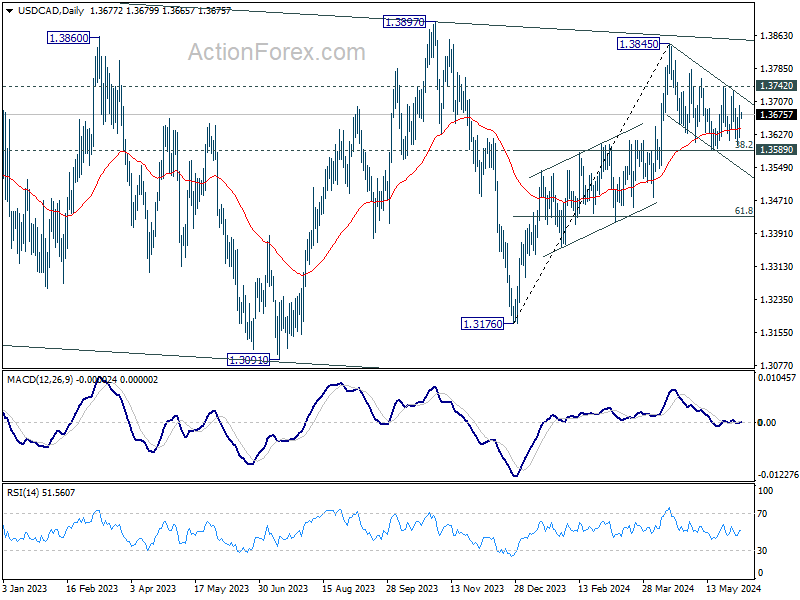
Range trading continues in USD/CAD and intraday bias remains neutral for the moment. On the upside, break of 1.3742 resistance will revive the case that correction from 1.3845 has completed at 1.3589. Intraday bias will be back on the upside for retesting 1.3845. On the downside, firm break of 1.3589 support will argue that whole rise from 1.3176 has completed at 1.3845 already. Fall from 1.3845 should then resume to 61.8% retracement of 1.3176 to 1.3845 at 1.3432.
In the bigger picture, price actions from 1.3976 (2022 high) are viewed as a corrective pattern. In case of another fall, strong support should emerge above 1.2947 resistance turned support to bring rebound. Firm break of 1.3976 will confirm up resumption of whole up trend from 1.2005 (2021 low). Next target is 61.8% projection of 1.2401 to 1.3976 from 1.3176 at 1.4149.
AUD/USD Daily Report
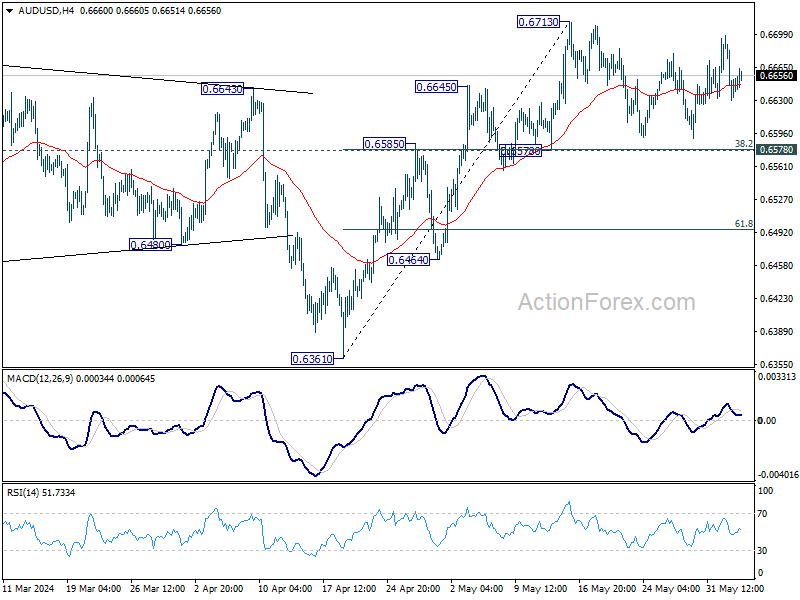
Daily Pivots: (S1) 0.6621; (P) 0.6660; (R1) 0.6689; More….
No change in AUD/USD's outlook as consolidation continues below 0.6713. As long as 0.6578 cluster support (38.2% retracement of 0.6361 to 0.6713 at 0.6579) holds, further rally remains in favor. On the upside, firm break of 0.6713 will resume whole rise from 0.6361 to 0.6870 resistance next. However, sustained break of 0.6578 will dampen this bullish view, and bring deeper fall to 61.8% retracement at 0.6495.
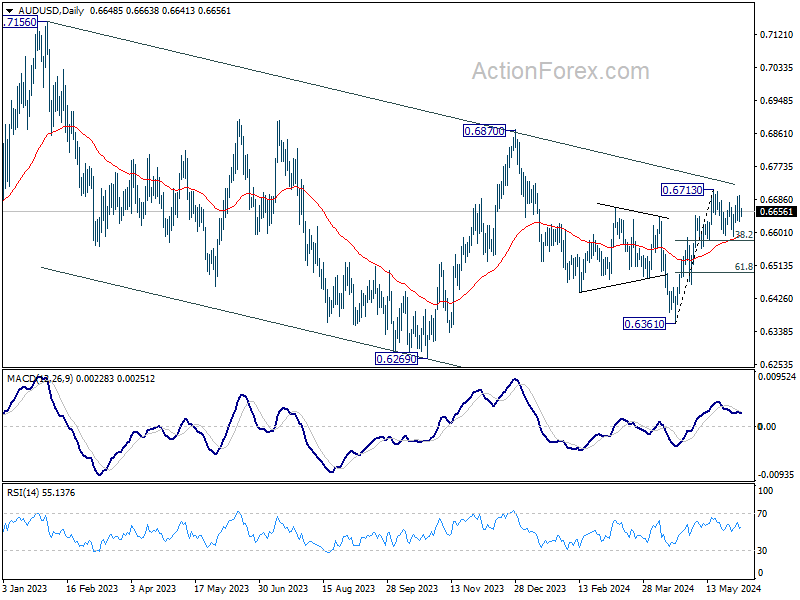
In the bigger picture, price actions from 0.6169 (2022 low) are seen as a medium term corrective pattern to the down trend from 0.8006 (2021 high). Fall from 0.7156 (2023 high) is seen as the second leg, which could have completed at 0.6269 already. Rise from there is seen as the third leg which is now trying to resume through 0.6870 resistance.
USD/JPY Daily Outlook
Daily Pivots: (S1) 154.13; (P) 155.31; (R1) 156.07; More….
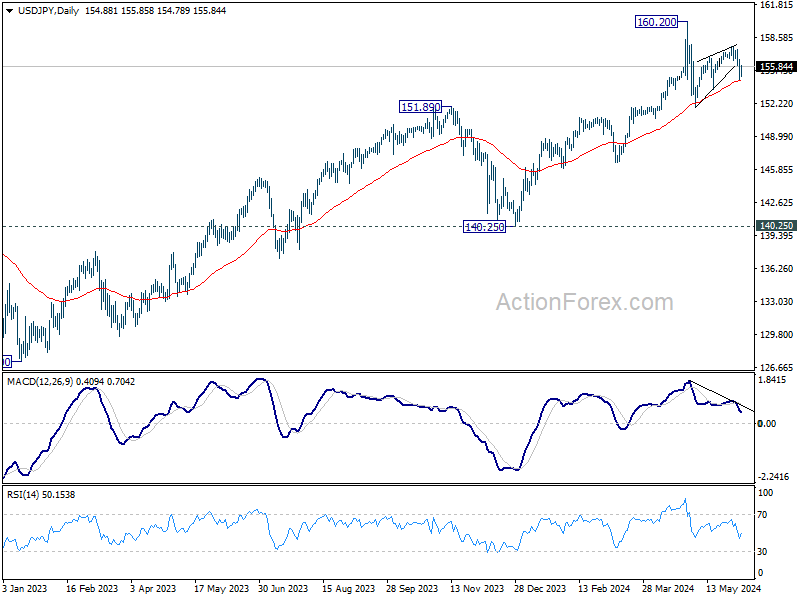
Intraday bias in USD/JPY is turned neutral first as it recovered after dipping to 154.53. But risk will stay on the downside as long as 157.70 resistance holds. Fall from there is seen as the third leg of the corrective pattern from 160.20. On the downside, break of 154.53 will target 153.59 support first. Break there will pave the way to 151.86 support and below.
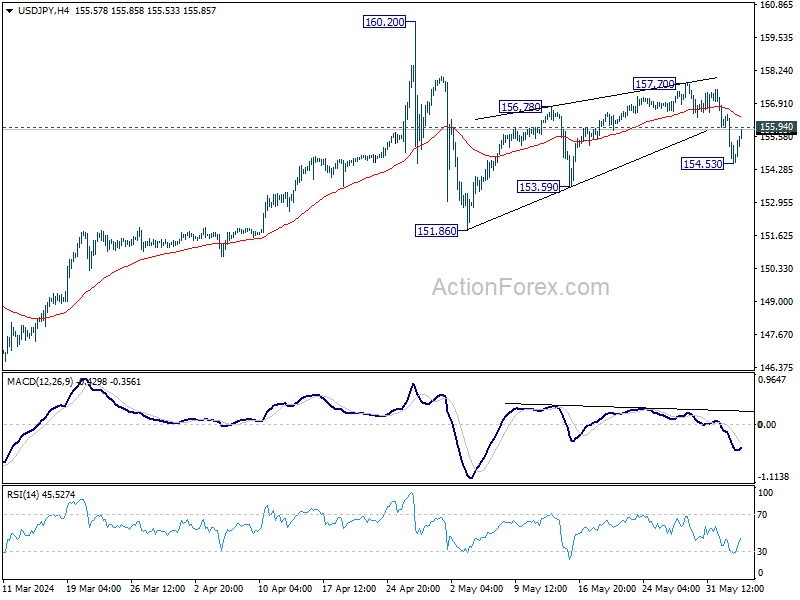
In the bigger picture, a medium term top might be formed at 160.20. As long as 55 W EMA (now at 147.77) holds, fall from 160.20 is seen as correcting the rise from 140.25 only. However, sustained break of 55 W EMA will argue that larger correction is possibly underway, and target 146.47 support next.