Sample Category Title
Summary 4/1 – 4/5
Monday, Apr 1, 2024
| GMT | Ccy | Events | Consensus | Previous |
|---|---|---|---|---|
| 23:50 | JPY | Tankan Large Manufacturing Index Q1 | 10 | 12 |
| 23:50 | JPY | Tankan Non - Manufacturing Index Q1 | 31 | 30 |
| 23:50 | JPY | Tankan Large Manufacturing Outlook Q1 | 11 | 8 |
| 23:50 | JPY | Tankan Non - Manufacturing Outlook Q1 | 30 | 24 |
| 23:50 | JPY | Tankan Large All Industry Capex Q1 | 9.20% | 13.50% |
| 00:30 | JPY | Manufacturing PMI Mar F | 48.2 | 48.2 |
| 01:45 | CNY | Caixin Manufacturing PMI Mar | 51 | 50.9 |
| 13:30 | CAD | Manufacturing PMI Mar | 49.7 | |
| 13:45 | USD | Manufacturing PMI Mar F | 52.5 | 52.5 |
| 14:00 | USD | ISM Manufacturing PMI Mar | 48.5 | 47.8 |
| 14:00 | USD | ISM Manufacturing Prices Paid Mar | 52.8 | 52.5 |
| 14:00 | USD | ISM Manufacturing Employment Index Mar | 45.9 | |
| 14:00 | USD | Construction Spending M/M Feb | 0.50% | -0.20% |
| 14:30 | CAD | BoC Business Outlook Survey | ||
| 23:01 | GBP | BRC Shop Price Index Y/Y Feb | 2.20% | 2.50% |
| 23:50 | JPY | Monetary Base Y/Y Mar | 2.50% | 2.40% |
| GMT | Ccy | Events | |
|---|---|---|---|
| 23:50 | JPY | Tankan Large Manufacturing Index Q1 | |
| Forecast: 10 | Previous: 12 | ||
| 23:50 | JPY | Tankan Non - Manufacturing Index Q1 | |
| Forecast: 31 | Previous: 30 | ||
| 23:50 | JPY | Tankan Large Manufacturing Outlook Q1 | |
| Forecast: 11 | Previous: 8 | ||
| 23:50 | JPY | Tankan Non - Manufacturing Outlook Q1 | |
| Forecast: 30 | Previous: 24 | ||
| 23:50 | JPY | Tankan Large All Industry Capex Q1 | |
| Forecast: 9.20% | Previous: 13.50% | ||
| 00:30 | JPY | Manufacturing PMI Mar F | |
| Forecast: 48.2 | Previous: 48.2 | ||
| 01:45 | CNY | Caixin Manufacturing PMI Mar | |
| Forecast: 51 | Previous: 50.9 | ||
| 13:30 | CAD | Manufacturing PMI Mar | |
| Forecast: | Previous: 49.7 | ||
| 13:45 | USD | Manufacturing PMI Mar F | |
| Forecast: 52.5 | Previous: 52.5 | ||
| 14:00 | USD | ISM Manufacturing PMI Mar | |
| Forecast: 48.5 | Previous: 47.8 | ||
| 14:00 | USD | ISM Manufacturing Prices Paid Mar | |
| Forecast: 52.8 | Previous: 52.5 | ||
| 14:00 | USD | ISM Manufacturing Employment Index Mar | |
| Forecast: | Previous: 45.9 | ||
| 14:00 | USD | Construction Spending M/M Feb | |
| Forecast: 0.50% | Previous: -0.20% | ||
| 14:30 | CAD | BoC Business Outlook Survey | |
| Forecast: | Previous: | ||
| 23:01 | GBP | BRC Shop Price Index Y/Y Feb | |
| Forecast: 2.20% | Previous: 2.50% | ||
| 23:50 | JPY | Monetary Base Y/Y Mar | |
| Forecast: 2.50% | Previous: 2.40% | ||
Tuesday, Apr 2, 2024
| GMT | Ccy | Events | Consensus | Previous |
|---|---|---|---|---|
| 00:00 | AUD | TD Securities Inflation M/M Mar | -0.10% | |
| 00:30 | AUD | RBA Meeting Minutes | ||
| 06:30 | CHF | Real Retail Sales Y/Y Feb | 0.40% | 0.30% |
| 07:30 | CHF | Manufacturing PMI Mar | 44.9 | 44 |
| 07:45 | EUR | Italy Manufacturing PMI Mar | 48.8 | 48.7 |
| 07:50 | EUR | France Manufacturing PMI Mar F | 45.8 | 45.8 |
| 07:55 | EUR | Germany Manufacturing PMI Mar F | 41.6 | 41.6 |
| 08:00 | EUR | Eurozone Manufacturing PMI Mar F | 45.7 | 45.7 |
| 08:30 | GBP | Mortgage Approvals Feb | 57K | 55K |
| 08:30 | GBP | M4 Money Supply M/M Feb | 0.20% | -0.10% |
| 08:30 | GBP | Manufacturing PMI Mar F | 49.9 | 49.9 |
| 12:00 | EUR | Germany CPI M/M Mar P | 0.40% | 0.40% |
| 12:00 | EUR | Germany CPI Y/Y Mar P | 2.40% | 2.70% |
| 14:00 | USD | Factory Orders M/M Feb | 1.00% | -3.60% |
| GMT | Ccy | Events | |
|---|---|---|---|
| 00:00 | AUD | TD Securities Inflation M/M Mar | |
| Forecast: | Previous: -0.10% | ||
| 00:30 | AUD | RBA Meeting Minutes | |
| Forecast: | Previous: | ||
| 06:30 | CHF | Real Retail Sales Y/Y Feb | |
| Forecast: 0.40% | Previous: 0.30% | ||
| 07:30 | CHF | Manufacturing PMI Mar | |
| Forecast: 44.9 | Previous: 44 | ||
| 07:45 | EUR | Italy Manufacturing PMI Mar | |
| Forecast: 48.8 | Previous: 48.7 | ||
| 07:50 | EUR | France Manufacturing PMI Mar F | |
| Forecast: 45.8 | Previous: 45.8 | ||
| 07:55 | EUR | Germany Manufacturing PMI Mar F | |
| Forecast: 41.6 | Previous: 41.6 | ||
| 08:00 | EUR | Eurozone Manufacturing PMI Mar F | |
| Forecast: 45.7 | Previous: 45.7 | ||
| 08:30 | GBP | Mortgage Approvals Feb | |
| Forecast: 57K | Previous: 55K | ||
| 08:30 | GBP | M4 Money Supply M/M Feb | |
| Forecast: 0.20% | Previous: -0.10% | ||
| 08:30 | GBP | Manufacturing PMI Mar F | |
| Forecast: 49.9 | Previous: 49.9 | ||
| 12:00 | EUR | Germany CPI M/M Mar P | |
| Forecast: 0.40% | Previous: 0.40% | ||
| 12:00 | EUR | Germany CPI Y/Y Mar P | |
| Forecast: 2.40% | Previous: 2.70% | ||
| 14:00 | USD | Factory Orders M/M Feb | |
| Forecast: 1.00% | Previous: -3.60% | ||
Wednesday, Apr 3, 2024
| GMT | Ccy | Events | Consensus | Previous |
|---|---|---|---|---|
| 00:30 | JPY | Services PMI Mar F | 54.9 | 54.9 |
| 01:45 | CNY | Caixin Services PMI Mar | 52.7 | 52.5 |
| 08:00 | EUR | Italy Unemployment Feb | 7.20% | 7.20% |
| 09:00 | EUR | Eurozone CPI Y/Y Mar P | 2.50% | 2.60% |
| 09:00 | EUR | Eurozone CPI Core Y/Y Mar P | 3.00% | 3.10% |
| 12:15 | USD | ADP Employment Change Mar | 150K | 140K |
| 13:45 | USD | Services PMI Mar F | 51.7 | 51.7 |
| 14:00 | USD | ISM Services PMI Mar | 52.8 | 52.6 |
| 14:30 | USD | Crude Oil Inventories | 3.2M | |
| 21:45 | NZD | Building Permits M/M Feb | -8.80% |
| GMT | Ccy | Events | |
|---|---|---|---|
| 00:30 | JPY | Services PMI Mar F | |
| Forecast: 54.9 | Previous: 54.9 | ||
| 01:45 | CNY | Caixin Services PMI Mar | |
| Forecast: 52.7 | Previous: 52.5 | ||
| 08:00 | EUR | Italy Unemployment Feb | |
| Forecast: 7.20% | Previous: 7.20% | ||
| 09:00 | EUR | Eurozone CPI Y/Y Mar P | |
| Forecast: 2.50% | Previous: 2.60% | ||
| 09:00 | EUR | Eurozone CPI Core Y/Y Mar P | |
| Forecast: 3.00% | Previous: 3.10% | ||
| 12:15 | USD | ADP Employment Change Mar | |
| Forecast: 150K | Previous: 140K | ||
| 13:45 | USD | Services PMI Mar F | |
| Forecast: 51.7 | Previous: 51.7 | ||
| 14:00 | USD | ISM Services PMI Mar | |
| Forecast: 52.8 | Previous: 52.6 | ||
| 14:30 | USD | Crude Oil Inventories | |
| Forecast: | Previous: 3.2M | ||
| 21:45 | NZD | Building Permits M/M Feb | |
| Forecast: | Previous: -8.80% | ||
Thursday, Apr 4, 2024
| GMT | Ccy | Events | Consensus | Previous |
|---|---|---|---|---|
| 00:30 | AUD | Building Permits M/M Feb | 3.20% | -1.00% |
| 06:30 | CHF | CPI M/M Mar | 0.30% | 0.60% |
| 06:30 | CHF | CPI Y/Y Mar | 1.40% | 1.20% |
| 07:45 | EUR | Italy Services PMI Mar | 53.2 | 52.2 |
| 07:50 | EUR | France Services PMI Mar F | 47.8 | 47.8 |
| 07:55 | EUR | Germany Services PMI Mar F | 49.8 | 49.8 |
| 08:00 | EUR | Eurozone Services PMI Mar F | 51.1 | 51.1 |
| 08:30 | GBP | Services PMI Mar | 53.4 | 53.4 |
| 09:00 | EUR | Eurozone PPI M/M Feb | -0.70% | -0.90% |
| 09:00 | EUR | Eurozone PPI Y/Y Feb | -8.60% | -8.60% |
| 11:30 | USD | Challenger Job Cuts Y/Y Mar | 8.80% | |
| 11:30 | EUR | ECB Meeting Accounts | ||
| 12:30 | CAD | Trade Balance (CAD) Feb | 0.5B | 0.5B |
| 12:30 | USD | Trade Balance (USD) Feb | -66.0B | -67.4B |
| 12:30 | USD | Initial Jobless Claims (Mar 29) | 212K | 210K |
| 14:30 | USD | Natural Gas Storage | -36B | |
| 23:30 | JPY | Household Spending Y/Y Feb | -2.80% | -6.30% |
| GMT | Ccy | Events | |
|---|---|---|---|
| 00:30 | AUD | Building Permits M/M Feb | |
| Forecast: 3.20% | Previous: -1.00% | ||
| 06:30 | CHF | CPI M/M Mar | |
| Forecast: 0.30% | Previous: 0.60% | ||
| 06:30 | CHF | CPI Y/Y Mar | |
| Forecast: 1.40% | Previous: 1.20% | ||
| 07:45 | EUR | Italy Services PMI Mar | |
| Forecast: 53.2 | Previous: 52.2 | ||
| 07:50 | EUR | France Services PMI Mar F | |
| Forecast: 47.8 | Previous: 47.8 | ||
| 07:55 | EUR | Germany Services PMI Mar F | |
| Forecast: 49.8 | Previous: 49.8 | ||
| 08:00 | EUR | Eurozone Services PMI Mar F | |
| Forecast: 51.1 | Previous: 51.1 | ||
| 08:30 | GBP | Services PMI Mar | |
| Forecast: 53.4 | Previous: 53.4 | ||
| 09:00 | EUR | Eurozone PPI M/M Feb | |
| Forecast: -0.70% | Previous: -0.90% | ||
| 09:00 | EUR | Eurozone PPI Y/Y Feb | |
| Forecast: -8.60% | Previous: -8.60% | ||
| 11:30 | USD | Challenger Job Cuts Y/Y Mar | |
| Forecast: | Previous: 8.80% | ||
| 11:30 | EUR | ECB Meeting Accounts | |
| Forecast: | Previous: | ||
| 12:30 | CAD | Trade Balance (CAD) Feb | |
| Forecast: 0.5B | Previous: 0.5B | ||
| 12:30 | USD | Trade Balance (USD) Feb | |
| Forecast: -66.0B | Previous: -67.4B | ||
| 12:30 | USD | Initial Jobless Claims (Mar 29) | |
| Forecast: 212K | Previous: 210K | ||
| 14:30 | USD | Natural Gas Storage | |
| Forecast: | Previous: -36B | ||
| 23:30 | JPY | Household Spending Y/Y Feb | |
| Forecast: -2.80% | Previous: -6.30% | ||
Friday, Apr 5, 2024
| GMT | Ccy | Events | Consensus | Previous |
|---|---|---|---|---|
| 00:30 | AUD | Trade Balance (AUD) Mar | 10.50B | 11.03B |
| 05:00 | JPY | Leading Economic Index Feb P | 111.6 | |
| 06:00 | EUR | Germany Factory Orders M/M Feb | 0.60% | -11.30% |
| 07:00 | EUR | Germany Import Price Index M/M Feb | -0.10% | 0.00% |
| 06:45 | EUR | France Industrial Output M/M Feb | 0.50% | -1.10% |
| 07:00 | CHF | Foreign Currency Reserves (CHF) Mar | 678B | |
| 08:30 | GBP | Construction PMI Mar | 49.8 | 49.7 |
| 09:00 | EUR | Eurozone Retail Sales M/M Feb | -0.30% | 0.10% |
| 12:30 | CAD | Net Change in Employment Mar | 34.5K | 40.7K |
| 12:30 | CAD | Unemployment Rate Mar | 5.90% | 5.80% |
| 12:30 | USD | Nonfarm Payrolls Mar | 205K | 275K |
| 12:30 | USD | Unemployment Rate Mar | 3.90% | 3.90% |
| 12:30 | USD | Average Hourly Earnings M/M Mar | 0.30% | 0.10% |
| 14:00 | CAD | Ivey PMI Mar | 54.2 | 53.9 |
| GMT | Ccy | Events | |
|---|---|---|---|
| 00:30 | AUD | Trade Balance (AUD) Mar | |
| Forecast: 10.50B | Previous: 11.03B | ||
| 05:00 | JPY | Leading Economic Index Feb P | |
| Forecast: | Previous: 111.6 | ||
| 06:00 | EUR | Germany Factory Orders M/M Feb | |
| Forecast: 0.60% | Previous: -11.30% | ||
| 07:00 | EUR | Germany Import Price Index M/M Feb | |
| Forecast: -0.10% | Previous: 0.00% | ||
| 06:45 | EUR | France Industrial Output M/M Feb | |
| Forecast: 0.50% | Previous: -1.10% | ||
| 07:00 | CHF | Foreign Currency Reserves (CHF) Mar | |
| Forecast: | Previous: 678B | ||
| 08:30 | GBP | Construction PMI Mar | |
| Forecast: 49.8 | Previous: 49.7 | ||
| 09:00 | EUR | Eurozone Retail Sales M/M Feb | |
| Forecast: -0.30% | Previous: 0.10% | ||
| 12:30 | CAD | Net Change in Employment Mar | |
| Forecast: 34.5K | Previous: 40.7K | ||
| 12:30 | CAD | Unemployment Rate Mar | |
| Forecast: 5.90% | Previous: 5.80% | ||
| 12:30 | USD | Nonfarm Payrolls Mar | |
| Forecast: 205K | Previous: 275K | ||
| 12:30 | USD | Unemployment Rate Mar | |
| Forecast: 3.90% | Previous: 3.90% | ||
| 12:30 | USD | Average Hourly Earnings M/M Mar | |
| Forecast: 0.30% | Previous: 0.10% | ||
| 14:00 | CAD | Ivey PMI Mar | |
| Forecast: 54.2 | Previous: 53.9 | ||
Weekly Economic & Financial Commentary: The First of Many Ticks Higher in the Longer-Run Median Dot
Summary
United States: Steady, As She Goes
- This week's economic data largely reinforced existing economic growth patterns. Consumer momentum remains largely intact, inflation continues to inch back down, albeit at a slower pace, and rate-sensitive sectors stayed in a holding pattern.
- Next week: ISM Indices (Mon. & Wed.), Trade Balance (Thu.), Employment (Fri.)
International: Global Central Banks Holding Steady For Now
- This week saw the announcement of monetary policy decisions from both G10 and emerging market economies. Sweden’s Riksbank held its policy rate steady at 4.00% and opened the door for either a May or June rate cut. We maintain our call for an initial June cut for now. The South Africa Reserve Bank held its policy rate steady at 8.25% and offered hawkish-leaning guidance.
- Next week: China PMIs (Sun.), Japan Tankan Survey (Mon.), Eurozone CPI (Wed.)
Interest Rate Watch: Dancing with the Stars: The First of Many Ticks Higher in the Longer-Run Median Dot
- Last week, the median “longer-run” dot moved higher in the FOMC’s latest Summary of Economic Projections (SEP). The increase in the median dot was small (just 6 bps), but the uptick in the median marks the first time it has been above 2.5% since March 2019. We expect the longer-run dot to continue to cautiously drift higher in coming SEP meetings.
Topic of the Week: Economic Costs of the Francis Scott Key Bridge Collapse
- The Francis Scott Key Bridge collapsed early Tuesday morning when a cargo ship leaving the Port of Baltimore collided with one of the bridge's support pillars. How important is the Port of Baltimore to U.S. goods trade?
Week Ahead – Rate Cut Hopes Rest on US Jobs Report and Eurozone Flash CPI
- Nonfarm payrolls report and European flash CPI to shape rate cut bets
- ISM PMIs to also be important for Fed expectations and US dollar
- Canadian employment and Chinese PMIs also on the agenda
Fed hawks rear their ugly heads
The March round of policy meetings reinforced June as the likely date when most central banks will begin cutting rates. Yet, doubts remain about whether or not inflation is on a sustainable path downwards, especially in the United States.
Although FOMC members maintained their projection of three rate reductions this year, they appear to have become more reluctant to commit to a specific timeframe for cutting rates. Inflation in the US has stalled around 3.0%, while the labour market remains very tight.
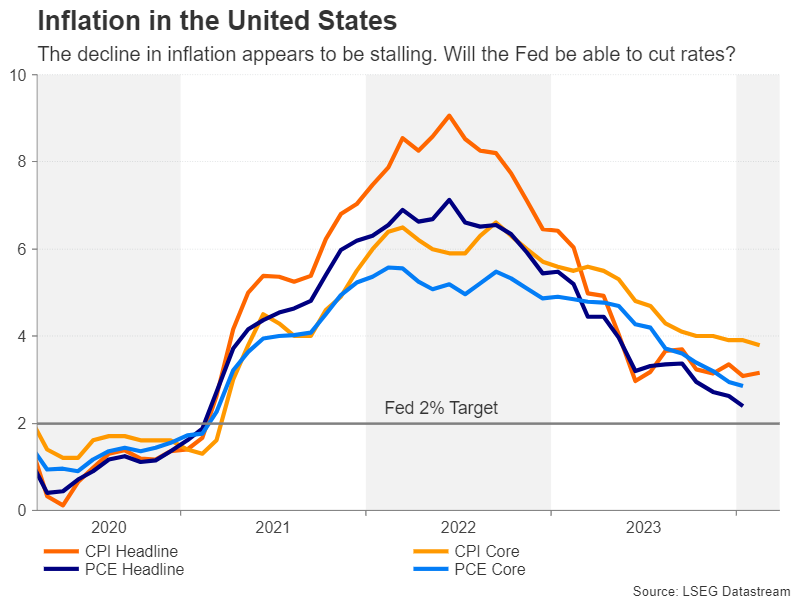
The worry is that cutting rates pre-emptively under such settings could refuel inflationary pressures. From the Fed’s perspective, the damage to its credibility would be greater in such a scenario than if it were to keep policy restrictive for longer than necessary.
But for the markets, the base case of a soft landing is imperative to feeding risk appetite so any change to that outlook risks putting an end to the rally on Wall Street and possibly giving the US dollar a leg up. The best hope for investors therefore is that the incoming data will be neither too hot, nor too cold.
Is the US labour market really cooling?
That’s mostly been the case for the labour market, although it has been cooling down so gradually that it has kept the Fed on edge about overheating concerns. But the slowdown became more apparent in February when the unemployment rate ticked up to 3.9% and wage growth moderated to 4.3% y/y.
Jobs growth has stayed solid, however, with nonfarm payrolls increasing by 275k. The forecast for March is that the economy added 198k new jobs and the jobless rate held steady at 3.9%, while average hourly earnings growth is expected to have eased to 4.1% y/y.
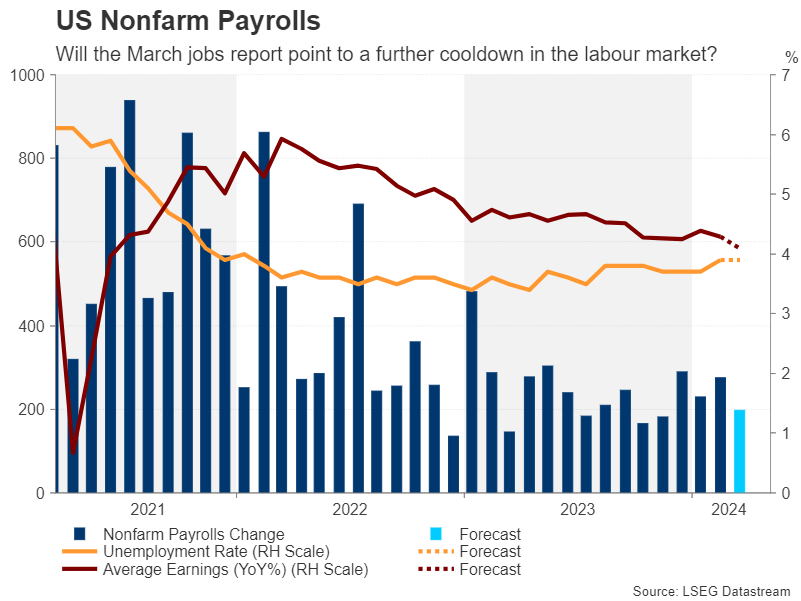
Friday’s data will be preceded by the ISM PMIs. The manufacturing PMI is due on Monday and the services one on Wednesday. The former is anticipated to have improved slightly in March, but the latter is projected to have ticked lower. Other releases will include factory orders and the JOLTS job openings on Tuesday, as well as the ADP employment report on Wednesday.
If there’s a broadly positive set of figures, particularly if there’s a hotter-than-expected NFP print, this would likely deal a further blow to rate cut bets, providing another boost to the dollar.
Eurozone CPI eyed as June rate cut moves closer
As the Fed gets jittery about inflation persisting above the 2% target, there’s been better progress for the European Central Bank. Headline CPI declined to 2.6% in February and is forecast to fall further to 2.5% in March. Core CPI that excludes food, energy, alcohol and tobacco prices is expected to edge down to 3.0%.
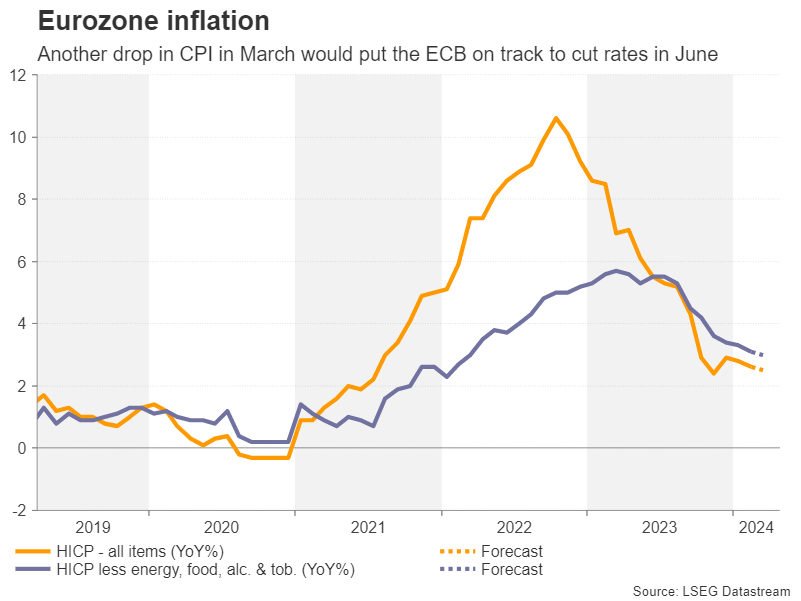
ECB policymakers have been out in droves lately, all calling for a rate cut at the June meeting. A downside surprise would endorse such a move, pressuring the euro, but stronger-than-expected readings could lessen the odds for a June cut.
However, any boost to the euro from stronger numbers would likely be limited and short-lived as one month’s data would not be seen as shifting expectations very significantly when there is such a strong consensus within the ECB for a summer cut.
In other data out of the Eurozone, the bloc’s unemployment rate is due on Wednesday, producer prices will follow on Thursday, and on Friday, German industrial orders and French industrial production will wrap up the week.
Loonie might shrug off Canadian jobs data
In Canada, employment stats for March will be the highlight, which are released on Friday along with the Ivey PMI. The Bank of Canada is another central bank that’s headed for starting its easing cycle in June. A cut became more certain after inflation fell more than expected in February, dropping below 3.0%. The labour market has also been slowing in recent months, with the jobless rate climbing to 5.8%.
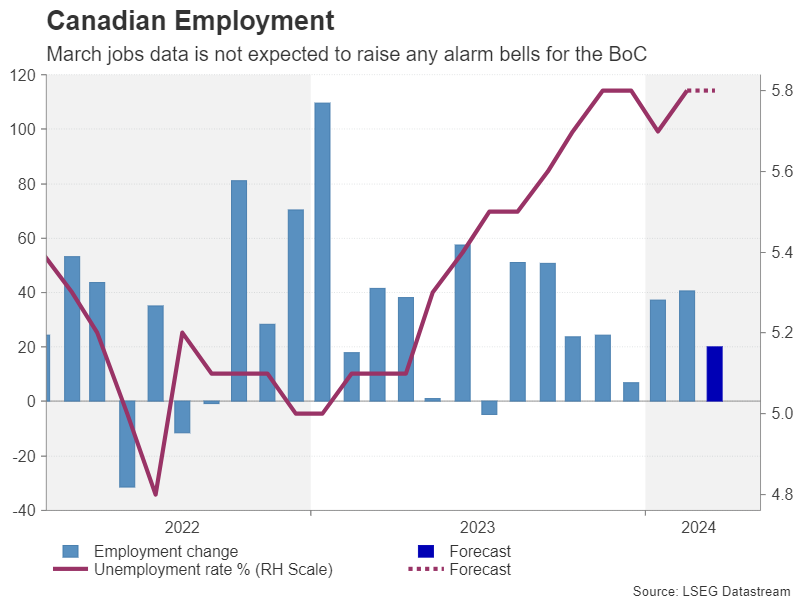
Employment likely rose slightly, by 20k, in March, which probably won’t have a huge impact on rate cut odds, unless there’s a big miss or a beat.
The Canadian dollar has been on a shallow downtrend versus the greenback in 2024 as US data has been mostly strong. Hence, much of the reaction on Friday will be driven more by US dollar dynamics when the NFP is also due.
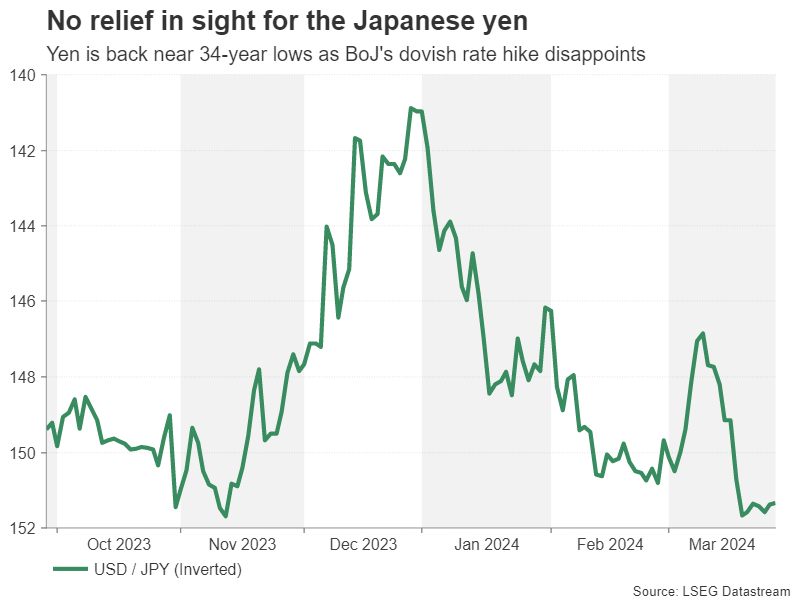
BoJ’s Tankan survey and Chinese PMIs on the way too
Fed rate cut expectations will be crucial for the Japanese yen as well, which has come under attack following the Bank of Japan’s dovish rate hike and speculation about a possible intervention.
Investors are not convinced that the BoJ will be in a position to tighten policy again anytime soon after the massive steps taken at the March meeting. Accommodative policy may be required for a while longer to support the economy and ensure that inflation doesn’t fall back below 2%. But Monday’s quarterly Tankan survey may offer some support to the battered yen if it points to growing optimism by Japanese businesses. Household spending figures out on Friday will also be watched.
Elsewhere, Chinese PMI numbers will likely attract some attention on Monday. The official manufacturing PMI is expected to rise to 49.9 and the alternative Caixin PMI is forecast to improve marginally to 51.0.
Indications that the recovery in the world’s industrial powerhouse is gathering pace could lift sentiment at the start of the week when volumes are expected to be light due to the long Easter holiday weekend in many markets, potentially buoying the China-sensitive Australian dollar.
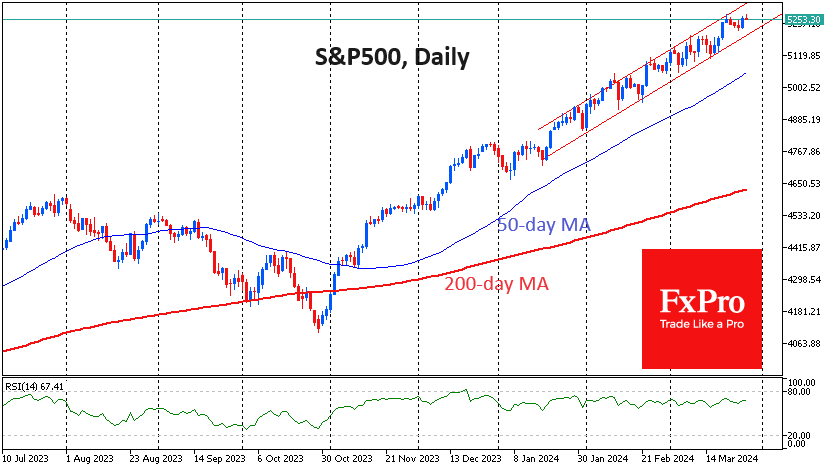
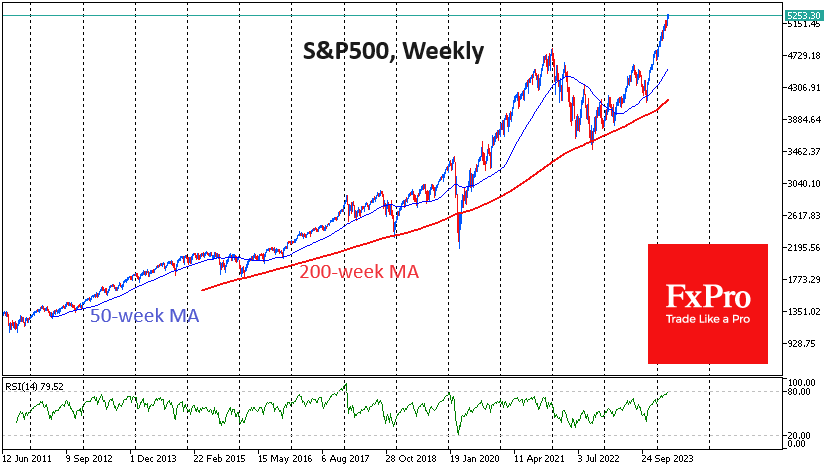
S&P500’s Soft Growth Could Last for Months
The US equity market continued its upward trend, with the S&P500 rising 10.8% in the first quarter, exceeding the historical average gain for a full calendar year. We are even more impressed by the low volatility of the index since the end of January.
The S&P500 has moved in a range of less than 2.5%. Frequent small market pullbacks provide fodder for further buying. This type of rally is seen in mature bull markets that have had enough of a push off the bottom but are not yet struggling to go higher.
It is also important to note that the current rally is becoming increasingly broad-based. The Magnificent Seven are falling apart, with Apple and Tesla clearly suffering, but the growth is encompassing more stocks. The broadest of the popular indices, the Russell 2000, broke out to its highest level since January 2022 on Thursday. However, it has traded in a broad sideways range from April 2022 to February 2024. This is an important sign of the health of the whole stock market, not just a set of popular investment narratives.
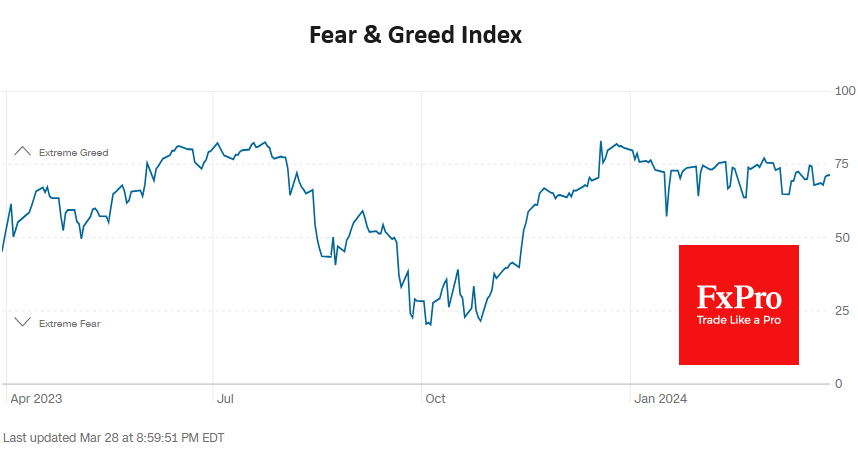
For four months, since the second half of December, CNN’s Fear and Greed Index has hovered near “extreme greed”, although most of the time, it has been just below that line. It is very close to the edge, with a solid bullish trend remaining, but without the market overheating, so there is no need to let off steam.
The VIX implied volatility index is at levels typical of much of 2018 and 2019, giving no hope of an imminent end to the upside. The entirety of 2017 saw the VIX below current levels, so it would not be fair to call this an anomaly.
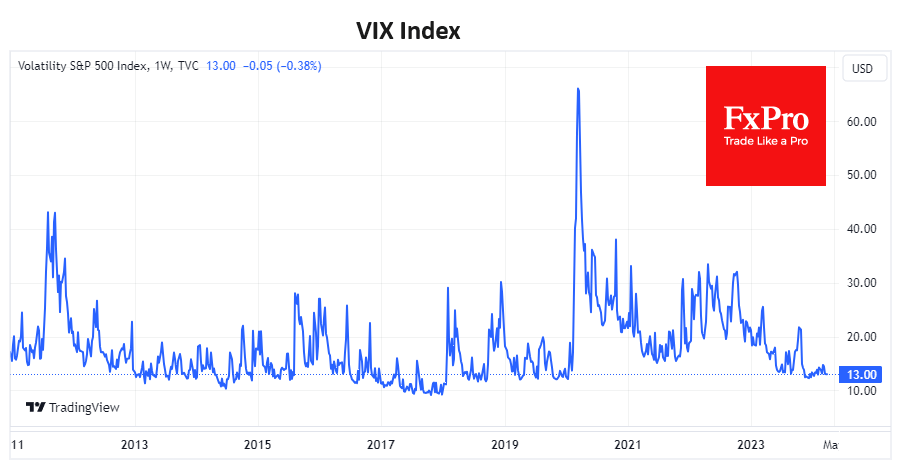
We have seen similar amplitude dynamics in the S&P500 from August 2017 to January 2018, April to September 2018 and October 2019 to February 2020. The duration of these episodes ranged from 4 to 6 months, but the growth was interrupted by changing external circumstances, from trade wars to a pandemic.
On the weekly timeframe, the RSI is approaching 80, a strongly overbought zone. When it touched this level in January 2020, a strong bearish sentiment formed, and we saw a small correction even before we started to fear a pandemic. But there’s another example: from November 2017 to January 2018, the RSI was above 80, and the S&P500 rose more than 9% to its peak.
All in all, the rise in the S&P500 doesn’t look excessive. The market isn’t overheated and isn’t about to collapse under its own weight. However, investors should be aware of any external circumstances that could damage the economy, as the equity index could very quickly revise equity expectations and trigger a deep correction.
Dollar Edges Lower as PCE Inflation Data Aligns with Expectations, Gold Hits Record
Dollar dips mildly in the wake of the latest PCE inflation data, which largely met market expectations without delivering any significant surprises. Notably, headline inflation saw a slight uptick, primarily driven by rising energy costs. Core inflation saw a slight deceleration from last month's upwardly revised figures. However, a key point of concern remains the stubbornly high services inflation, which is expected to continue drawing attention from Fed.
Yen is mixed following Tokyo CPI data, which confirmed a slowdown in both core and core-core CPI. This supports BoJ's cautious approach towards further policy tightening The contraction in industrial production raises flags, although this was offset by a notable uptick in retail sales, showcasing some positive momentum within the economy.
Looking at the week's performance across currencies, Canadian Dollar emerges as the frontrunner, buoyed by robust Canadian GDP data. Sterling is occupying the second spot in strength, followed by Australian Dollar. Swiss Franc lags as the week's weakest currency, with Kiwi and Euro trailing. Dollar and Yen find themselves positioned in the middle.
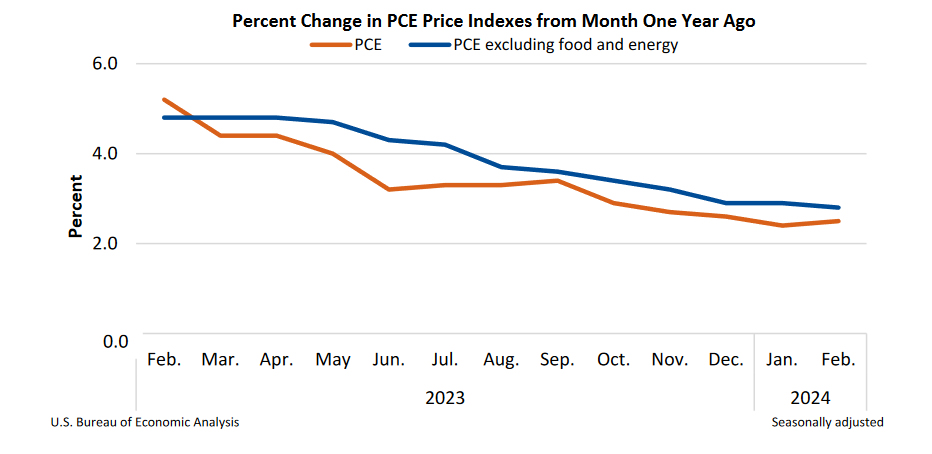
US PCE price index rises to 2.5% yoy in Feb, core PCE down to 2.8% yoy
US personal income rose 0.3% mom or USD 66.5B in February, below expectation of 0.4% mom. Personal spending rose 0.8% mom or USD 145.5B, above expectation of 0.8% mom.
PCE price index rose 0.3% mom below expectation of of 0.4% mom. Core PCE price index (excluding food and energy) rose 0.3% mom, matched expectations. Goods prices increased 0.1% mom while services index surged 0.6% mom. Food prices rose 0.1% mom and energy prices increased 2.3% mom.
Over the 12-month period, PCE price index accelerated from 2.4% yoy to 2.5% yoy, matched expectations. Core PCE price index slowed from upwardly revised 2.9% yoy to 2.8% yoy, matched expectations. Goods prices were up 0.2% yoy while services prices increased 3.8% yoy. Food prices were up 1.3% yoy while energy prices decreased -2.3% yoy.
Tokyo inflation moderates, supporting BoJ's measured approach
Japan Tokyo CPI core (ex-food) slowed slightly from 2.5% yoy to 2.4% yoy in March, matched expectations. Headline CPI ticked up from 2.5% yoy to 2.6% yoy. CPI core-core (ex-food and energy) also slowed from 3.1% yoy to 2.9% yoy. Service price gains slowed to from 2.1% yoy to 2.0% yoy.
This constellation of data suggests softening of cost-push inflationary pressures within Tokyo, Japan's economic nucleus, and a concurrent easing in service-sector inflation. This trend could provide BoJ a leverage for a more cautious approach on tightening, despite widespread expectations of another rate hike in the latter half of the year.
Other economic indicators for February released paint a mixed picture. Industrial production fell -0.1% mom, falling short of the anticipated 1.2% growth. In contrast, retail sales outperformed expectations, surging by 4.6% yoy against forecasted 3.0% increase. Meanwhile, unemployment rate rose from 2.4% to 2.6%, exceeding the projected steady rate of 2.4%.
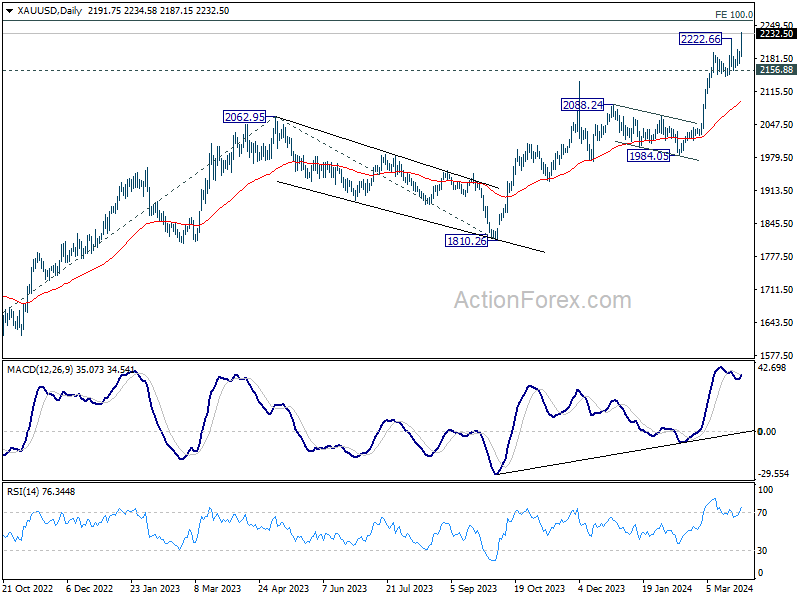
Record-breaking Gold targets 2250, poised for push toward 2500
Gold surges to new record high in quiet holiday trading today. The precious metal continues to be supported by expectation of global central bank easing ahead. SNB has already started rate cutting earlier this month. ECB is widely expected to follow in Spring, probably in June. Whether Fed is going to cut two or three times this year, the cycle will start anyway.
Inflation is looking more like a rear-mirror thing now, and benchmark treasury yields also dip notably recently because of that. US 10-year yield now looks more likely heading back to 4% handle, rather than 4.4%. Germany 10-year yield is back pressing 2.3%, comparing over 2.45% earlier in the month. US 10-year yield is also back to 3.95%, comparing to above 4.2% earlier in the month.
Geopolitical risks is another factor support Gold as there is not end of seen yet with Russian invasion of Ukraine, Israel/Hamas conflicts, nor Houthi's Red Sea attacks. In addition, US election in November approaching, with far-fetching implications.
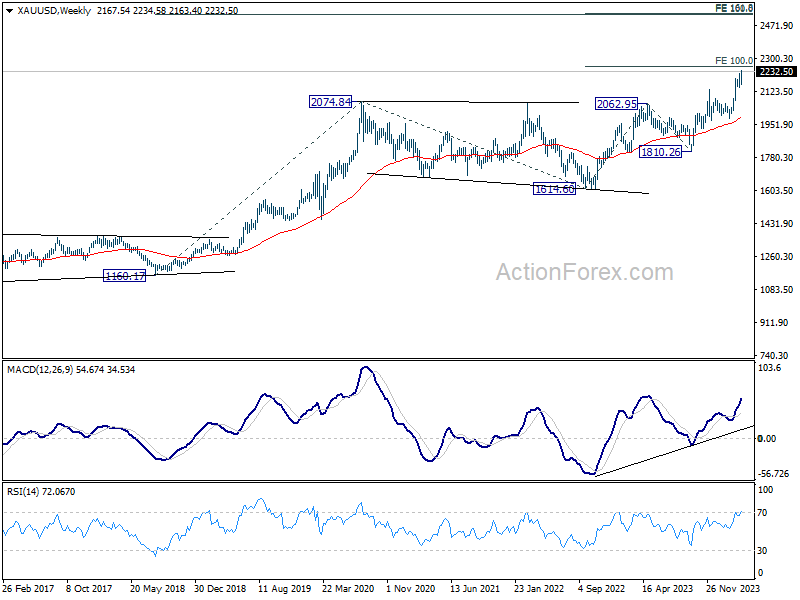
Technically, immediate focus is now on 100% projection of 1614.60 to 2062.95 from 1810.26 at 2258.61. Decisive break there would pave the way to 161.8% projection at 2535.69. This level coincides with long term target of 100% projection of 1160.17 to 2074.84 at 1614.60 at 2529.27. So in short, overcoming 2250 handle would send Gold through 2500 mark. In any case, near term outlook will stay bullish as long as 2156.88 support holds.
Economic Indicators Update
| GMT | Ccy | Events | Actual | Forecast | Previous | Revised |
|---|---|---|---|---|---|---|
| 23:30 | JPY | Tokyo CPI Y/Y Mar | 2.60% | 2.60% | 2.50% | |
| 23:30 | JPY | Tokyo CPI ex Fresh Food Y/Y Mar | 2.40% | 2.40% | 2.50% | |
| 23:30 | JPY | Tokyo CPI ex Food Energy Y/Y Mar | 2.90% | 3.10% | ||
| 23:30 | JPY | Unemployment Rate Feb | 2.60% | 2.40% | 2.40% | |
| 23:50 | JPY | Industrial Production M/M Feb P | -0.10% | 1.20% | -6.70% | |
| 23:50 | JPY | Retail Trade Y/Y Feb | 4.60% | 3.00% | 2.10% | |
| 05:00 | JPY | Housing Starts Y/Y Feb | -8.20% | -5.50% | -7.50% | |
| 07:45 | EUR | France Consumer Spending M/M Feb | 0.00% | 0.20% | -0.30% | -0.60% |
| 12:30 | USD | Personal Income M/M Feb | 0.30% | 0.40% | 1.00% | |
| 12:30 | USD | Personal Spending Feb | 0.80% | 0.40% | 0.20% | |
| 12:30 | USD | PCE Price Index M/M Feb | 0.30% | 0.40% | 0.30% | 0.40% |
| 12:30 | USD | PCE Price Index Y/Y Feb | 2.50% | 2.50% | 2.40% | |
| 12:30 | USD | Core PCE Price Index M/M Feb | 0.30% | 0.30% | 0.40% | 0.50% |
| 12:30 | USD | Core PCE Price Index Y/Y Feb | 2.80% | 2.80% | 2.80% | 2.90% |
| 12:30 | USD | Wholesale Inventories Feb P | 0.50% | 0.20% | -0.30% | |
| 12:30 | USD | Goods Trade Balance (USD) Feb P | -91.8B | -89.6B | -90.5B |
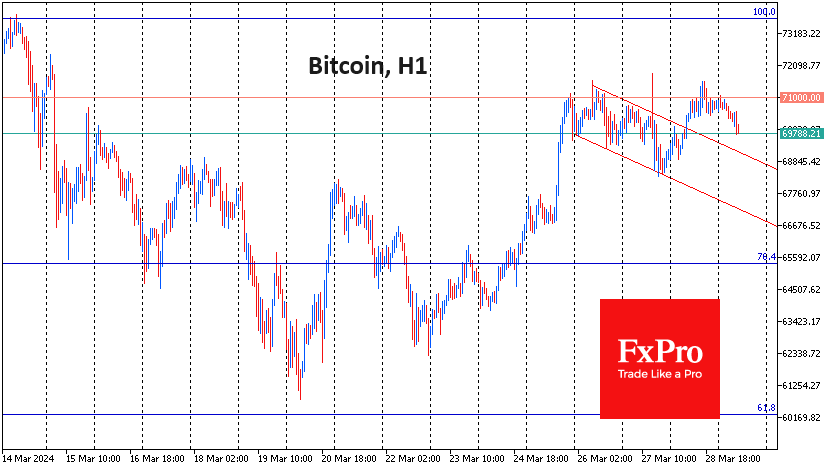
Bitcoin Fails to Surpass $71K this Week
Market picture
The cryptocurrency market is up 0.3% in 24 hours to $2.66 trillion, but it’s not due to reduced volatility. Bitcoin and Ethereum are trading close to the previous day’s levels. Among the top coins, Doge (+7.4%) and BNB (+3.8%) are the best performers. At the other end of the spectrum are Avalanche (-1.3%) and Toncoin (-0.9%).
Bitcoin’s fourth attempt to consolidate above $71K this week was unsuccessful. The Nasdaq100 also showed some downward bias, indicating a cautious attitude towards risky assets, although the S&P500 closed at another high.
Bitcoin has thus found strong resistance, preventing the bulls from launching an offensive. The caution in this case is due to the non-trading days in the US and UK, which greatly reduce the activity of institutional traders. The $69.5K and $68.5K levels attract our increased attention. Without significant support from buyers there, the correction could become more global.
According to Deribit, open interest in Bitcoin options maturing on 29 March has risen to an all-time high of $9.5bn.
News background
In another recalculation, the mining difficulty of the first cryptocurrency decreased by 0.97%. The indicator stood at 83.13 T. The average hash rate for the period since the previous change in value was 593.99 EH/s.
According to Bitwise, a few asset managers have already allocated 3% of client funds to the first cryptocurrency, and many are ready to do so soon.
Previously, there was some concern in the institutional environment about the potential collapse of BTC to zero, but amid the success of the ETF, the ‘zeroing out’ narrative has disappeared from the agenda.
The Dencun update to the Ethereum network is the foundation for global blockchain adoption, which could benefit TradFi companies in the crypto space, according to Metis.
Former FTX CEO Sam Bankman-Fried was sentenced to 25 years in prison and fined $11 billion by a court in the Southern District of New York. Prosecutors asked for a 40–50-year behind bars.
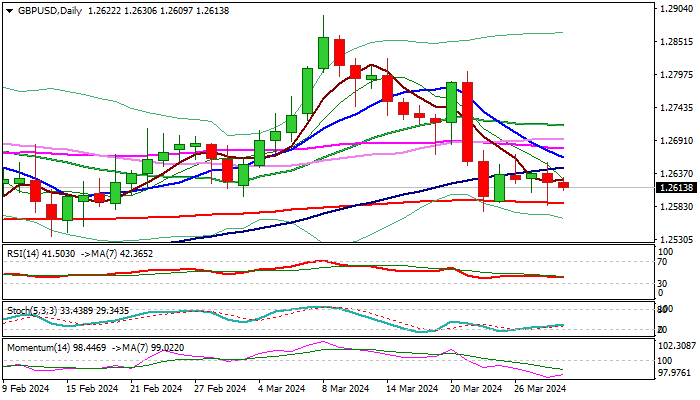
GBP/USD: Cable Moves Within Extended Range Ahead of Key US Data
Cable remains in extended sideways mode, with a narrow range on holiday-thinned markets on Good Friday.
Near-term action is ranging between 200DMA (1.2588) and thin daily cloud (spanned between 1.2634 and 1.2663), with predominantly bearish daily studies keeping the downside at risk, although the pair is still looking for stronger direction signal.
Markets await release of key economic data today – US PCE price index – Fed’s preferred inflation measure, which is expected to contribute to timing and pace of highly anticipated Fed rate cuts.
Basically, higher than expected inflation numbers in February would likely cool the expectations for the start of rate cuts in June and lift the dollar, though significantly lower volumes on Good Friday may affect the action.
Res: 1.2634; 1.2663; 1.2689; 1.2715.
Sup: 1.2600; 1.2588; 1.2575; 1.2518.
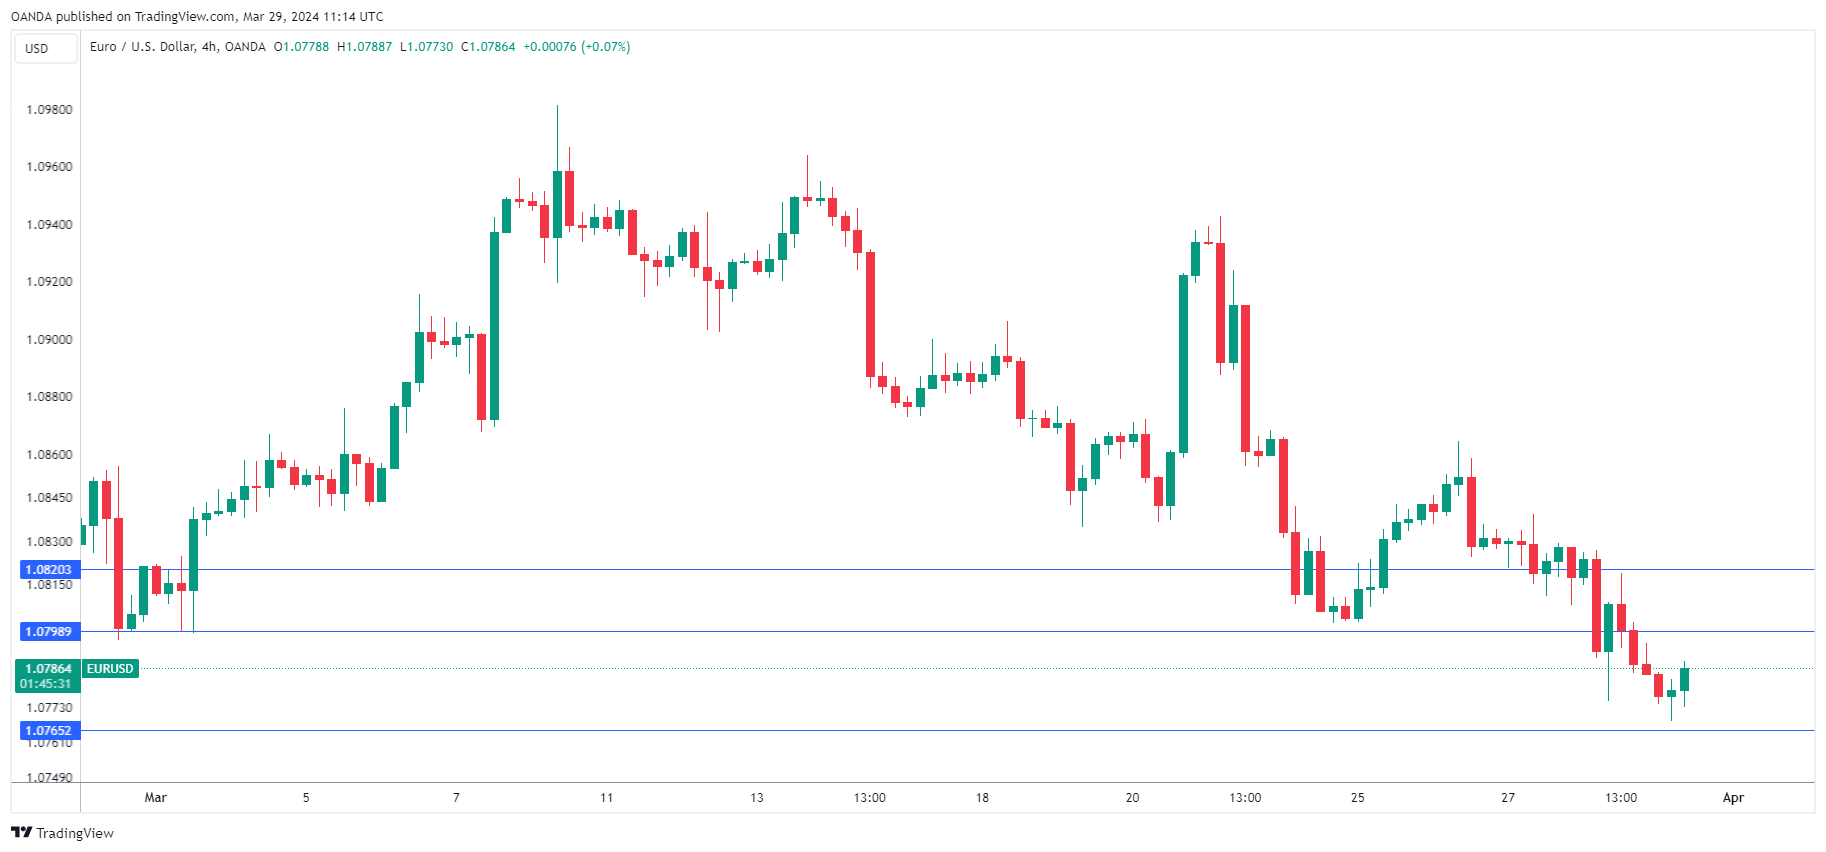
EUR/USD Falls to Five-Week Low
The euro has edged lower on Friday. In the European session, EUR/USD is trading at 1.0782, down 0.05%.
It has been a bumpy road for the euro in 2024, as the currency has declined 2.3% so far this year. Earlier today, EUR/USD dropped as low as 1.0768, its lowest level since February 21.
Weak German data weighs on euro
Germany, the largest economy in the eurozone, continues to struggle and that is weighing on the eurozone as well as the euro. German consumer confidence is mired in negative territory and this week's retail sales report was dismal, with a 1.9% decline m/m in February. This was shy of the market estimate of 0.3% and marked a fourth straight decline. On an annualized basis, retail sales slumped by 2.7%, a fourth straight decline.
German and eurozone data has been weak, which is not surprising as elevated interest rates have dampened growth. The European Central Bank held the key interest rate at 4.0% for a fourth straight time this month and must decide on the appropriate timing for a rate cut.
The April or June meetings appear the most likely times for a rate cut. ECB member Francois Villeroy was the latest ECB policy maker to weigh in, saying on Thursday it was important to make a "moderate cut", even if the ECB decided to then resume holding rates. ECB member Fabio Panetta said the same day that the central bank was leaning towards lowering rates as inflation continued to decline.
In the US, the week wraps up with the PCE Core Index, considered the Federal Reserve's preferred inflation indicator. The index is expected to tick lower to 0.3% m/m in February, compared to 0.4% in January. Fed Chair Jerome Powell will speak at a conference in San Francisco and the markets will be hoping for some insights about rate policy.
EUR/USD Technical
- EUR/USD tested support at 1.0765 earlier. Below, there is support at 1.0743
- 1.0798 and 1.0820 are the next resistance lines
US PCE price index rises to 2.5% yoy in Feb, core PCE down to 2.8% yoy
US personal income rose 0.3% mom or USD 66.5B in February, below expectation of 0.4% mom. Personal spending rose 0.8% mom or USD 145.5B, above expectation of 0.8% mom.
PCE price index rose 0.3% mom below expectation of of 0.4% mom. Core PCE price index (excluding food and energy) rose 0.3% mom, matched expectations. Goods prices increased 0.1% mom while services index surged 0.6% mom. Food prices rose 0.1% mom and energy prices increased 2.3% mom.
Over the 12-month period, PCE price index accelerated from 2.4% yoy to 2.5% yoy, matched expectations. Core PCE price index slowed from upwardly revised 2.9% yoy to 2.8% yoy, matched expectations. Goods prices were up 0.2% yoy while services prices increased 3.8% yoy. Food prices were up 1.3% yoy while energy prices decreased -2.3% yoy.
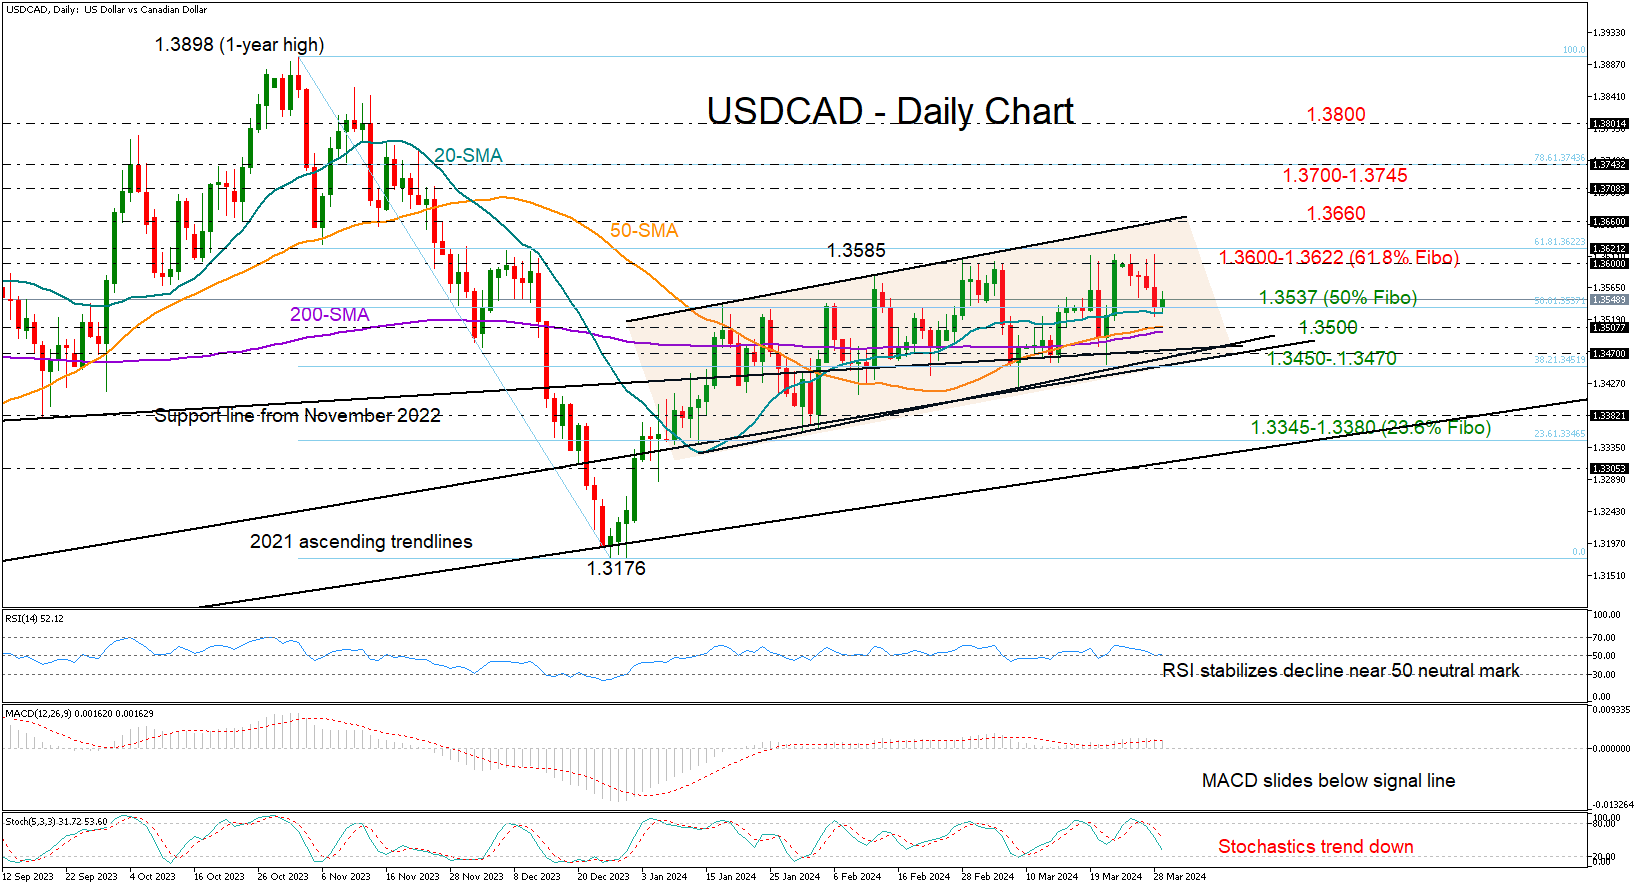
USDCAD Pauses Four-Day Slide
- USDCAD pauses bearish correction near support area
- Technical signals are weak amid holiday-thinned liquidity conditions
- All eyes turn to the US core PCE inflation due at 12:30 GMT
USDCAD was trading with soft positive momentum around 1.3547 during Friday’s early European trading hours as investors headed into the Easter holiday.
Technically, the pair found support around its 20-day simple moving average (SMA) after a four-day decline. Notably, the SMA lines played a key role as pivot points during the month of March. Hence, the odds for an upside reversal are high as long as the price holds above those lines in the 1.3500 region. The trendline zone slightly lower at 1.3450-1.3470 could also prevent a crash out of the bullish channel and towards the 1.3345-1.3380 constraining area.
Disappointingly, the technical indicators are not favoring the bulls at the moment. Even though the RSI is trying to rotate higher near its 50 neutral mark, the stochastic oscillator has already started a new negative cycle, while the MACD has slipped below its red signal line, suggesting that sentiment has yet to improve.
Nonetheless, should the 20-day SMA hold steady, there is a possibility for the pair to reverse upwards and revisit the 1.3600 psychological level. A victory there may not excite traders unless the price also crawls above the channel’s upper band at 1.3660. If that scenario unfolds, the door will open for the 1.3700-1.3745 territory and then for the 1.3800 number.
In summary, although the bulls don’t have an advantage according to the technical signals, a recovery phase in USDCAD is possible, as the pair is currently testing a key support zone.