Sample Category Title
Gold’s Price Reaches New Heights Amid Global Market Uncertainty
On Friday, the price of gold reached an unprecedented peak, soaring above 2,230 USD. The global capital market experienced low activity due to the observance of Good Friday in many Catholic countries, leading to abrupt movements by investors.
The surge in gold prices is primarily attributed to anticipations that global financial regulators will lower lending costs within the year. Furthermore, escalating geopolitical tensions have bolstered gold's appeal as a safe-haven asset.
March saw gold's price increase by over 9%, marking a significant uptick for what is typically considered a conservative investment. Several key developments support this rally:
- US Federal Reserve's rate cut intentions: in its March meeting, the Fed outlined plans to reduce interest rates three times over the year.
- Bank of Japan's policy shift: this month, the Bank of Japan abandoned its negative interest rate policy.
- Swiss National Bank's rate adjustment: in an unexpected move, the Swiss National Bank lowered its interest rate, sparking speculation that other financial authorities might take similar actions.
Gold's status as a safe asset has been reinforced amidst a market climate favouring risk aversion, driven by ongoing geopolitical instability, especially in the Middle East.
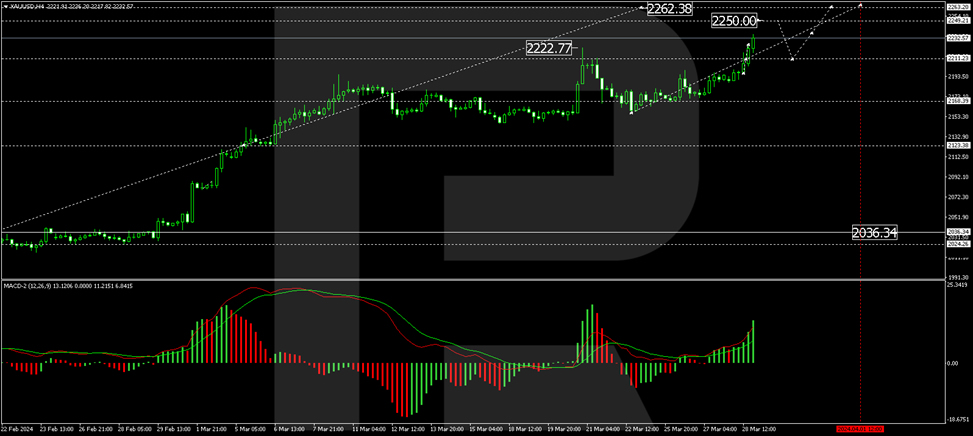
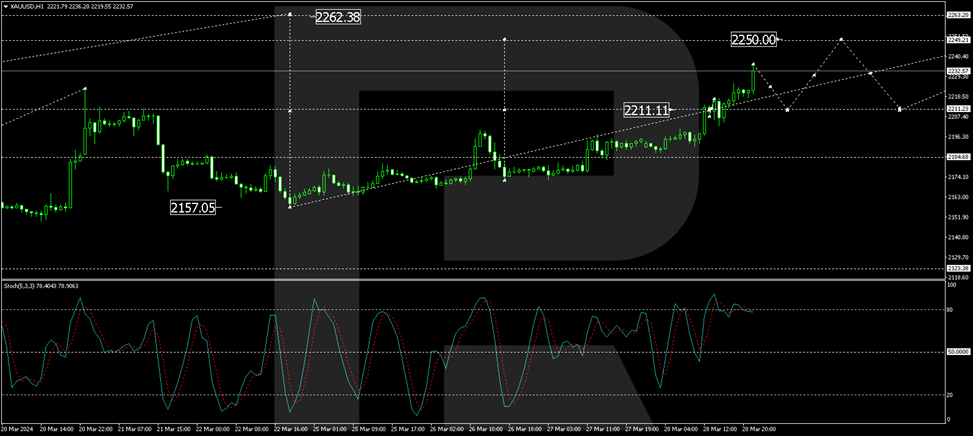
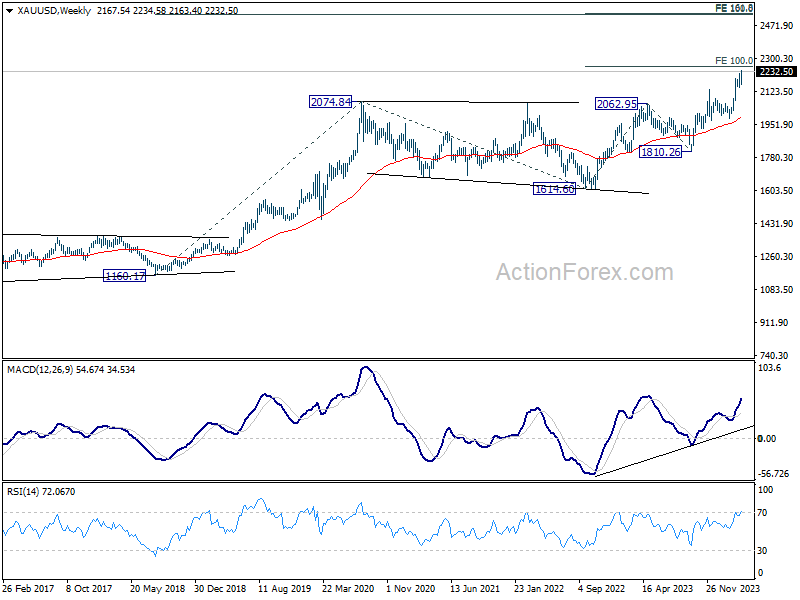
Technical analysis of XAU/USD
H4 chart analysis: The H4 chart reveals that XAU/USD prices have broken out of their consolidation range, embarking on the fifth wave of growth. An upward movement towards 2,250 USD is currently forming. Following this, a corrective movement to 2,211.11 USD may occur, potentially leading to a new growth phase targeting 2,262.38 USD. This scenario is supported by the MACD indicator, with the signal line positioned above zero and trending upwards.
H1 chart analysis: On the H1 chart, XAU/USD established a consolidation range of around 2,211.11 USD. An upward breakout from this range could set the stage for a rise towards 2,250 USD. After achieving this level, a correction towards 2,222.50 USD may unfold before considering a further ascent to 2,262.38 USD and a pullback to 2,180.60 USD. The Stochastic oscillator, currently above 80, indicates a forthcoming decline to 20, aligning with this analysis.
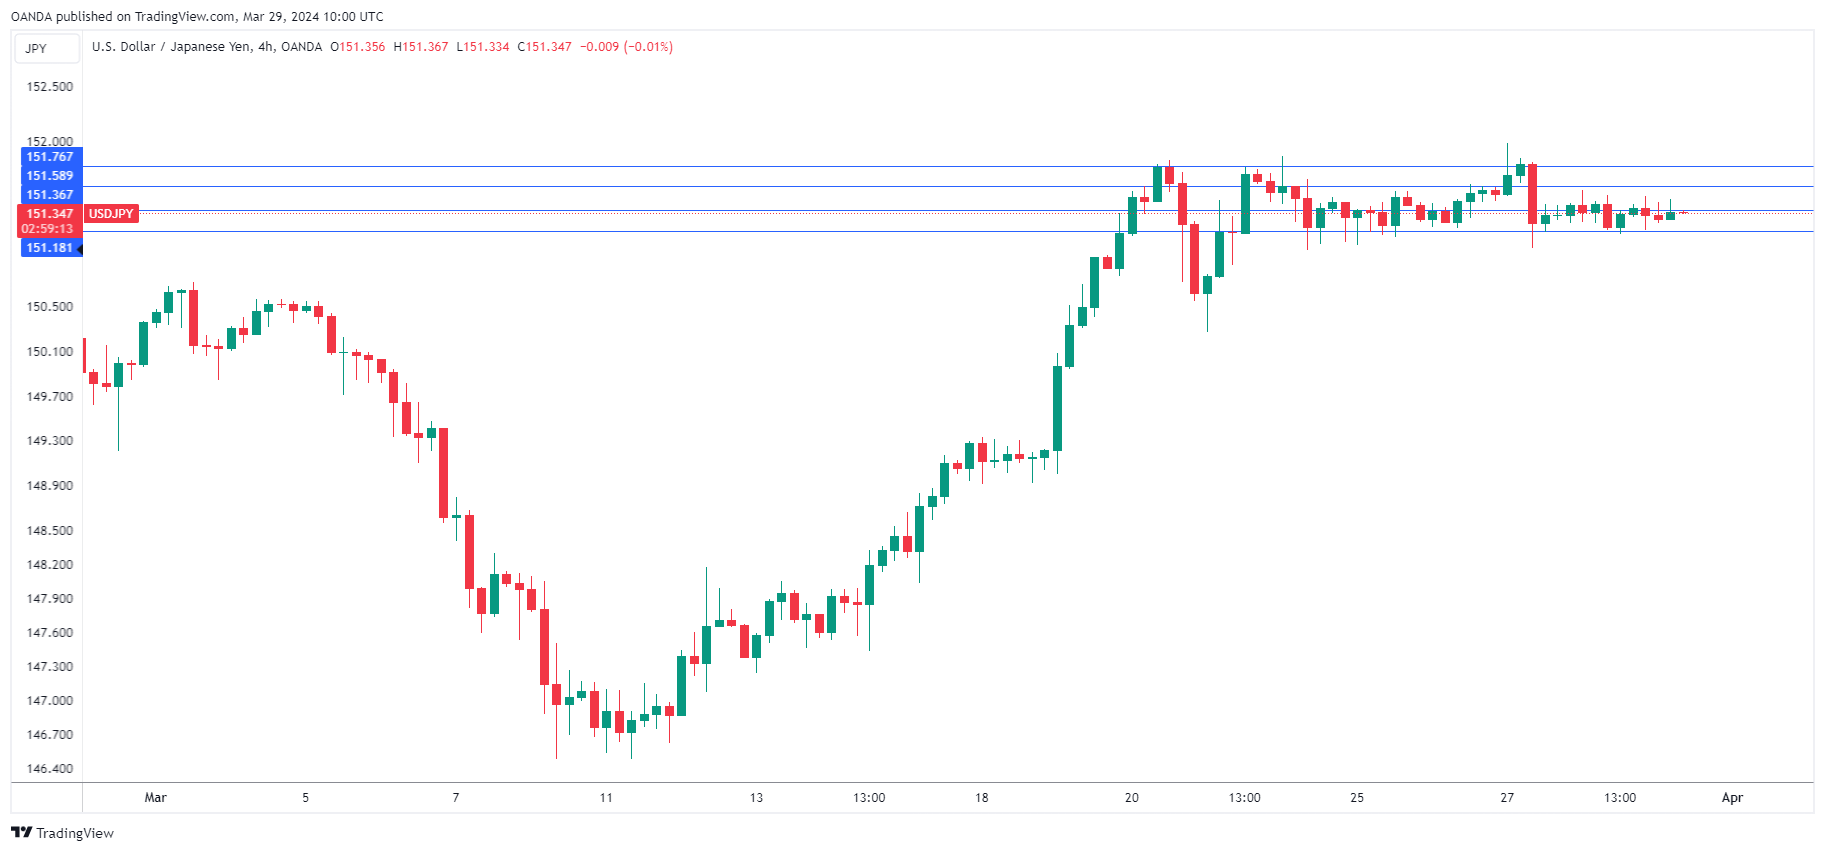
Japanese Yen Steady as Tokyo Core CPI Ticks Lower
The Japanese yen continues to have a quiet week and is unchanged in the European session at 151.17.
Tokyo Core CPI inches lower to 2.4%
Tokyo Core CPI, which excludes fresh food, eased to 2.4% y/y in March, a drop lower than the 2.5% gain in February and matching expectations. This inflation indicator is closely watched as it is considered a leading indicator of nationwide inflation. The Tokyo “core core” CPI index, which excludes fresh food and energy, eased to 2.9%, down from 3.1% in February.
Cost-push inflation and services inflation are weakening, which presents a problem for the Bank of Japan, which wants to see services inflation replace cost-push inflation in order to ensure that inflation remains sustainable. The BoJ pressed the rate-hike trigger last week, a dramatic move that was made easier as national wage negotiations have resulted in a significant pay hike for workers of major companies. However, if services inflation doesn’t show signs of rising, BoJ policy makers are likely to shy away from additional rate hikes.
Despite the market buzz over the BoJ lifting rates out of negative territory for the first time in eight years, the BoJ hasn’t really exited its accommodative policy. Last week, the BoJ said it would buy roughly the same amount of government bonds as before, and the summary of opinions of the March meeting indicated that members want to proceed cautiously and slowly toward policy normalization.
The BoJ rate hike hasn’t provided a boost for the ailing yen, which has been trading around 151.50 for most of the week. This has raised concerns that Japan’s Ministry of Finance could intervene in the currency markets in order to prop up the yen. So far, the MoF has sufficed with verbal intervention, but that could change if the yen continues to lose ground.
USD/JPY Technical
- 151.58 and 151.76 are the next resistance lines
- USD/JPY has pushed below support at 151.36 and is testing support at 151.18
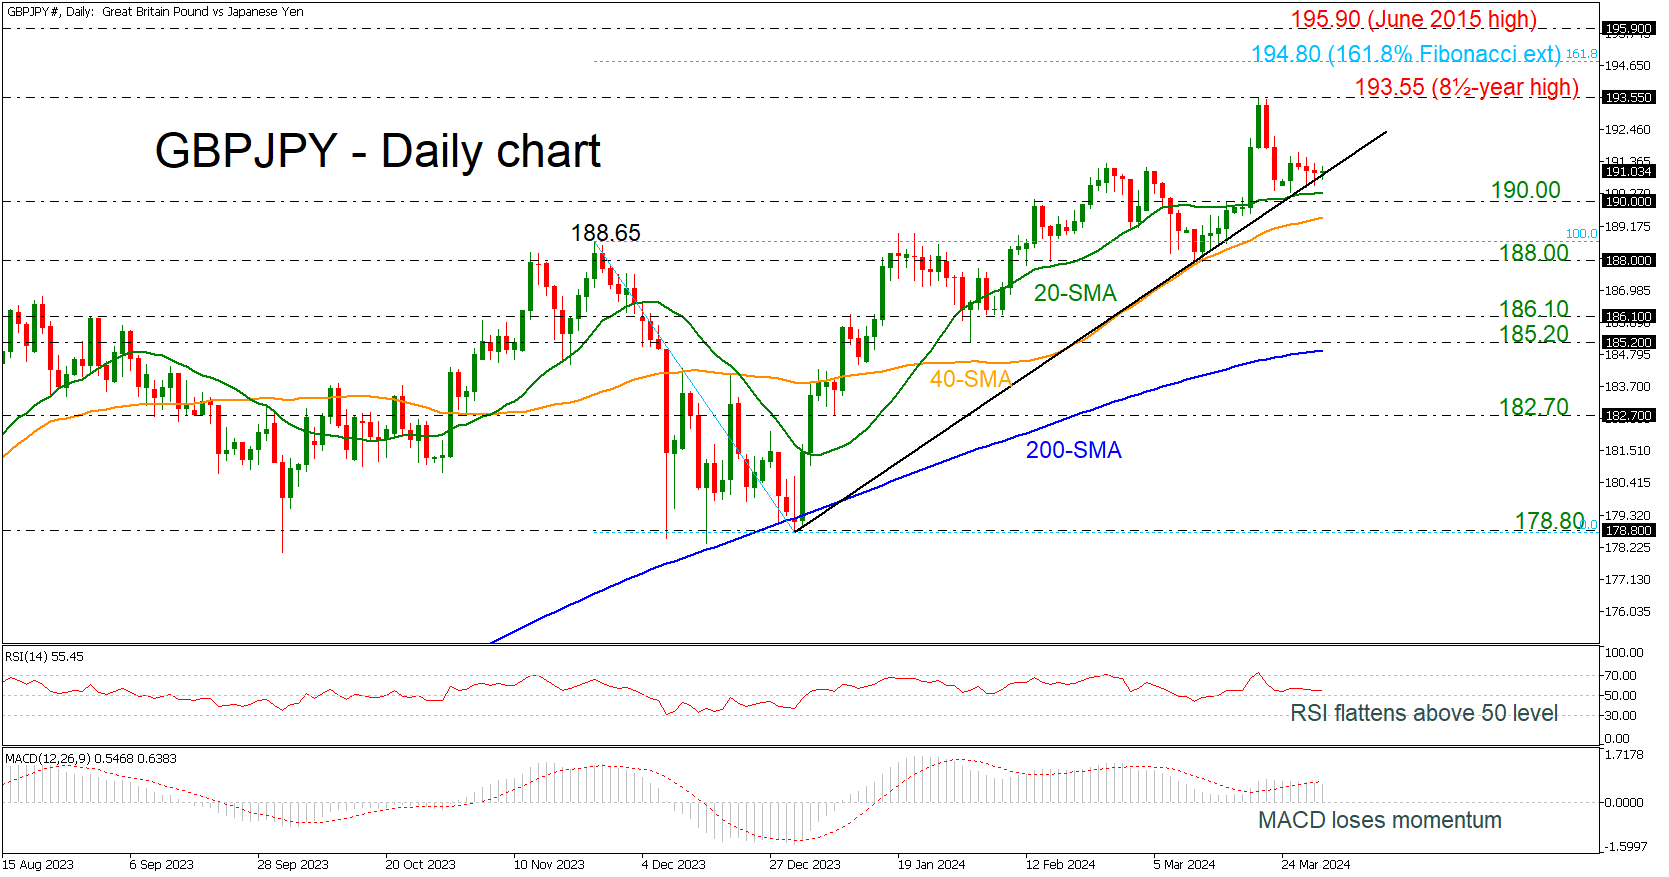
GBPJPY Weakens Near 191.00
- GBPJPY remains above the rising trend line
- But technical oscillators are losing steam as well
GBPJPY has been posting some flat days over the last four sessions, holding near the short-term uptrend line. The market is developing near the 191.00 round number with the technical oscillators confirming the weakening momentum. The RSI is moving horizontally above the neutral threshold of 50, while the MACD is holding beneath its trigger line above zero level.
If the market rebounds off the diagonal line, the next resistance is coming from the eight-and-a-half year high of 193.55. A potential higher high could drive the price towards the 161.8% Fibonacci extension level of the down leg from 188.65 to 178.80 at 194.80.
On the other hand, a successful decline could find immediate support near the 20-day simple moving average (SMA) and the 190.00 psychological mark. Slightly lower, the 50-day SMA at 189.45 may act as a turning point for the pair; however, even lower the 188.00 handle could switch the outlook to a more neutral one.
To sum up, GBPJPY is failing to extend the ascending tendency and a negative retracement cannot be ruled out.
Gold Price and Crude Oil Price Gain Bullish Momentum
Gold price started a steady increase above the $2,200 resistance level. Crude oil prices are gaining bullish momentum and might rise toward $85.00.
Important Takeaways for Gold and Oil Prices Analysis Today
- Gold price started a decent increase from the $2,158 zone against the US Dollar.
- A connecting bullish trend line is forming with support near $2,218 on the hourly chart of gold at FXOpen.
- Crude oil prices rallied above the $81.60 and $82.00 resistance levels.
- There is a key bullish trend line forming with support at $82.30 on the hourly chart of XTI/USD at FXOpen.
Gold Price Technical Analysis
On the hourly chart of Gold at FXOpen, the price found support near the $2,158 zone. The price formed a base and started a fresh increase above the $2,175 level.
There was a decent move above the 50-hour simple moving average and $2,200. The bulls pushed the price above the $2,220 resistance zone. Finally, the bears appeared near $2,235, A high was formed near $2,236.20 and the price is now consolidating gains.
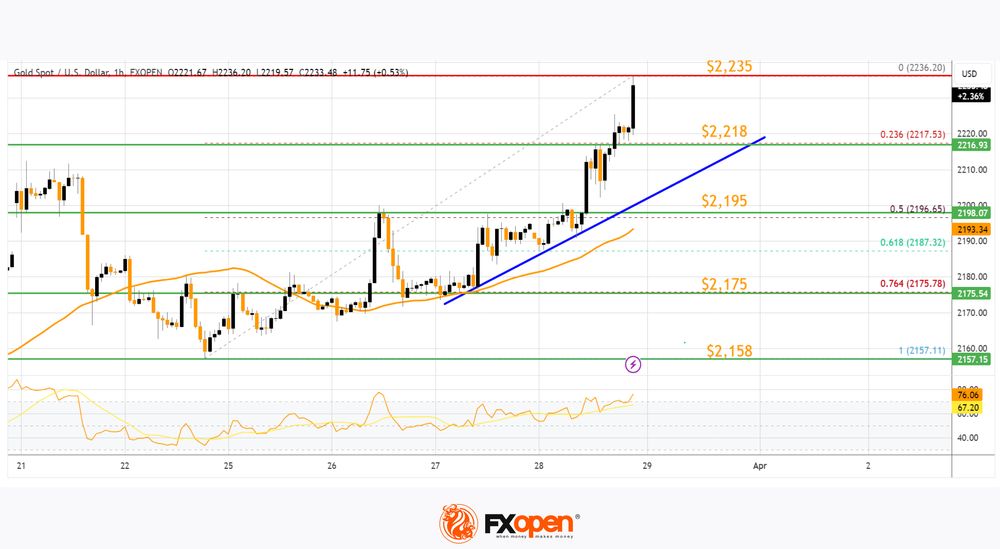
The current price action is positive above the 23.6% Fib retracement level of the upward move from the $2,157 swing low to the $2,236 high. The RSI is still stable near 60 and the price could aim for more gains.
Immediate resistance is near the $2,235 level. The next major resistance is near the $2,240 level. An upside break above the $2,240 resistance could send Gold price toward $2,250. Any more gains may perhaps set the pace for an increase toward the $2,265 level.
Initial support on the downside is near the $2,218 zone. There is also a connecting bullish trend line forming with support near $2,218. If there is a downside break below the $2,218 support, the price might decline further.
In the stated case, the price might drop toward the $2,195 support or the 50% Fib retracement level of the upward move from the $2,157 swing low to the $2,236 high.
Oil Price Technical Analysis
On the hourly chart of WTI Crude Oil at FXOpen, the price started a major rally against the US Dollar. The price gained bullish momentum after it broke the $80.00 resistance.
There was a sustained upward move above the $81.60 and $82.00 resistance levels. The bulls pushed the price toward $82.80. The current price action is positive above the 50-hour simple moving average and RSI is stable above 60.
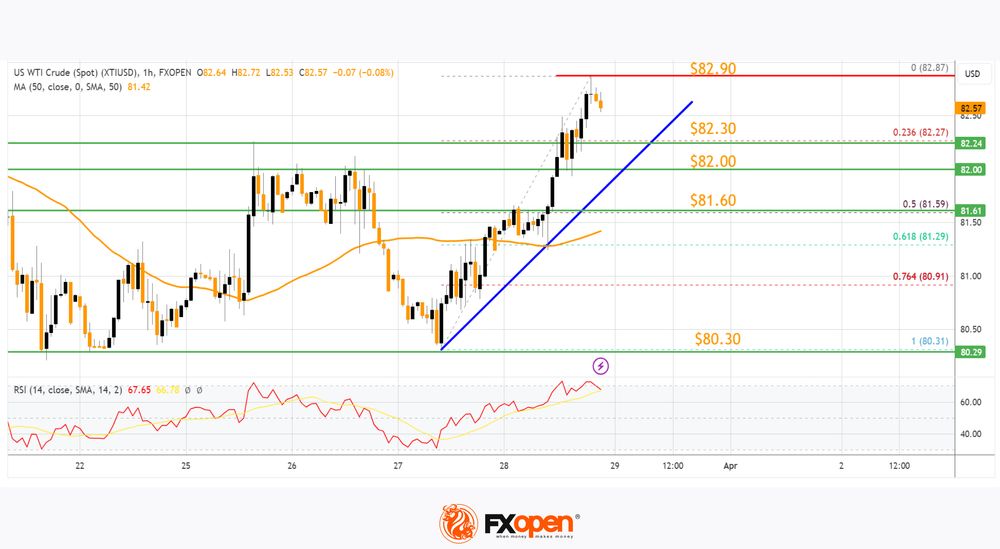
The price is holding gains above the 23.6% Fib retracement level of the upward move from the $80.30 swing low to the $82.87 high.
If the price climbs higher again, it could face resistance near $82.90. The next major resistance is near the $83.50 level. Any more gains might send the price toward the $85.00 level.
Conversely, the price might correct gains and test $82.30. There is also a key bullish trend line forming with support at $82.30. The next major support on the WTI crude oil chart is near the $81.60 zone and the 50% Fib retracement level of the upward move from the $80.30 swing low to the $82.87 high.
If there is a downside break, the price might decline toward $80.30. Any more losses may perhaps open the doors for a move toward the $78.80 support zone.
Start trading commodity CFDs with tight spreads. Open your trading account now or learn more about trading commodity CFDs with FXOpen.
This article represents the opinion of the Companies operating under the FXOpen brand only. It is not to be construed as an offer, solicitation, or recommendation with respect to products and services provided by the Companies operating under the FXOpen brand, nor is it to be considered financial advice.
Strong Growth is Good News If Inflation Remains Low
The US printed a better-than-expected growth of 3.4%. Sales grew more than expected, the GDP price index fell but fell slower than expected to 1.7%, corporate profits jumped nearly 4% in the Q3 versus less than 1% printed a quarter earlier and consumer sentiment jumped to the highest levels since mid-2021. In other words, the data could hardly be better than this, the stock markets could hardly perform better than this, and the Federal Reserve (Fed) could hardly be more dovish than this given the strength of the data - even though the set of data that was released yesterday was again a warning that the Fed is not in a rush to cut rates to save the economy. The economy doesn’t need the Fed’s help. This is also the message that the Fed’s Waller conveyed this week. The man stated the obvious as he said that the recent economic data deserves delaying rate cuts and reducing the number of them, and that he wants to see ‘at least a couple of months of better inflation data’ before easing. But this is not what the majority of Fed members think. They think on the contrary that three rate cuts would be suitable for this year.
As such, yesterday’s better-than-expected GDP pill went down the market’s throat quite smoothly, as Waller’s hawkish remarks were mostly washed away by the soft-landing bets and bets that the Fed will – in all cases – cut rates into summer if it doesn’t want to take the centerstage in the US political turmoil into the November election. In this context, if inflation doesn’t get meaningfully ugly, the rate cut should arrive by June or July. On this belief, we saw the S&P500 gain after a strong GDP data yesterday. The index advanced to a fresh record, Nasdaq however closed slightly lower. The dollar index extended gains. The EURUSD fell to 1.0775, turning the medium term outlook from bullish to neutral, and Cable remained offered near its 100-DMA, as, in contrast to the strong American growth, this week’s numbers confirmed that the UK ended last year in a recession. The contraction in the second half was slightly smaller than expected, but economic troubles and the cost-of-living crisis were real. The data backed the dovish BoE expectations and should keep sterling offered into the 100-DMA, near 1.2655, against a broadly stronger US dollar – as the US dollar bulls defy the dovish Fed expectations faced with data unideal for rate cuts.
Today, most exchanges around the developed world will be closed due to Good Friday holiday, but the US will print its latest core PCE figure – which is the Fed’s favourite inflation metric. A hotter-than-expected inflation report could further back the USD bulls, and – maybe - temper the dovish Fed expectations provided that a good growth number is good news as long as inflation remains low. If inflation shows signs of picking up, it suddenly becomes bad news.
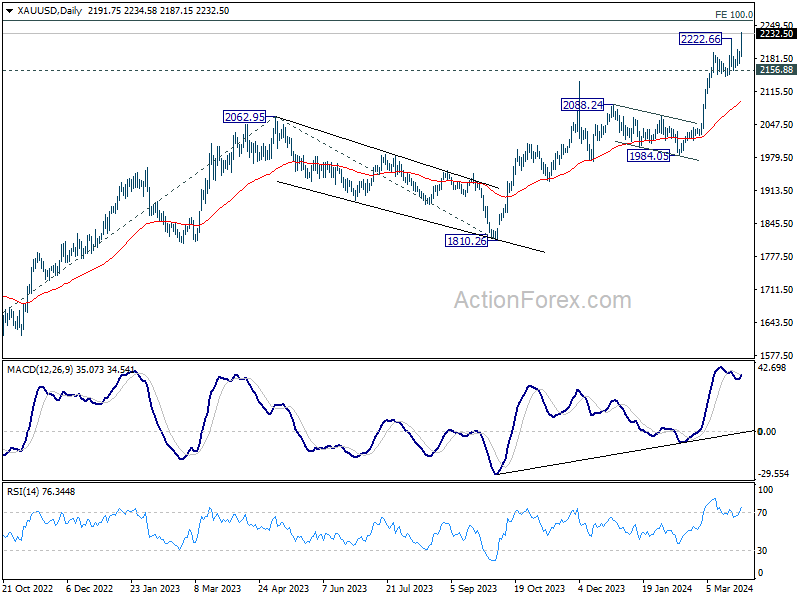
Record-breaking Gold targets 2250, poised for push toward 2500
Gold surges to new record high in quiet holiday trading today. The precious metal continues to be supported by expectation of global central bank easing ahead. SNB has already started rate cutting earlier this month. ECB is widely expected to follow in Spring, probably in June. Whether Fed is going to cut two or three times this year, the cycle will start anyway.
Inflation is looking more like a rear-mirror thing now, and benchmark treasury yields also dip notably recently because of that. US 10-year yield now looks more likely heading back to 4% handle, rather than 4.4%. Germany 10-year yield is back pressing 2.3%, comparing over 2.45% earlier in the month. US 10-year yield is also back to 3.95%, comparing to above 4.2% earlier in the month.
Geopolitical risks is another factor support Gold as there is not end of seen yet with Russian invasion of Ukraine, Israel/Hamas conflicts, nor Houthi's Red Sea attacks. In addition, US election in November approaching, with far-fetching implications.
Technically, immediate focus is now on 100% projection of 1614.60 to 2062.95 from 1810.26 at 2258.61. Decisive break there would pave the way to 161.8% projection at 2535.69. This level coincides with long term target of 100% projection of 1160.17 to 2074.84 at 1614.60 at 2529.27. So in short, overcoming 2250 handle would send Gold through 2500 mark. In any case, near term outlook will stay bullish as long as 2156.88 support holds.
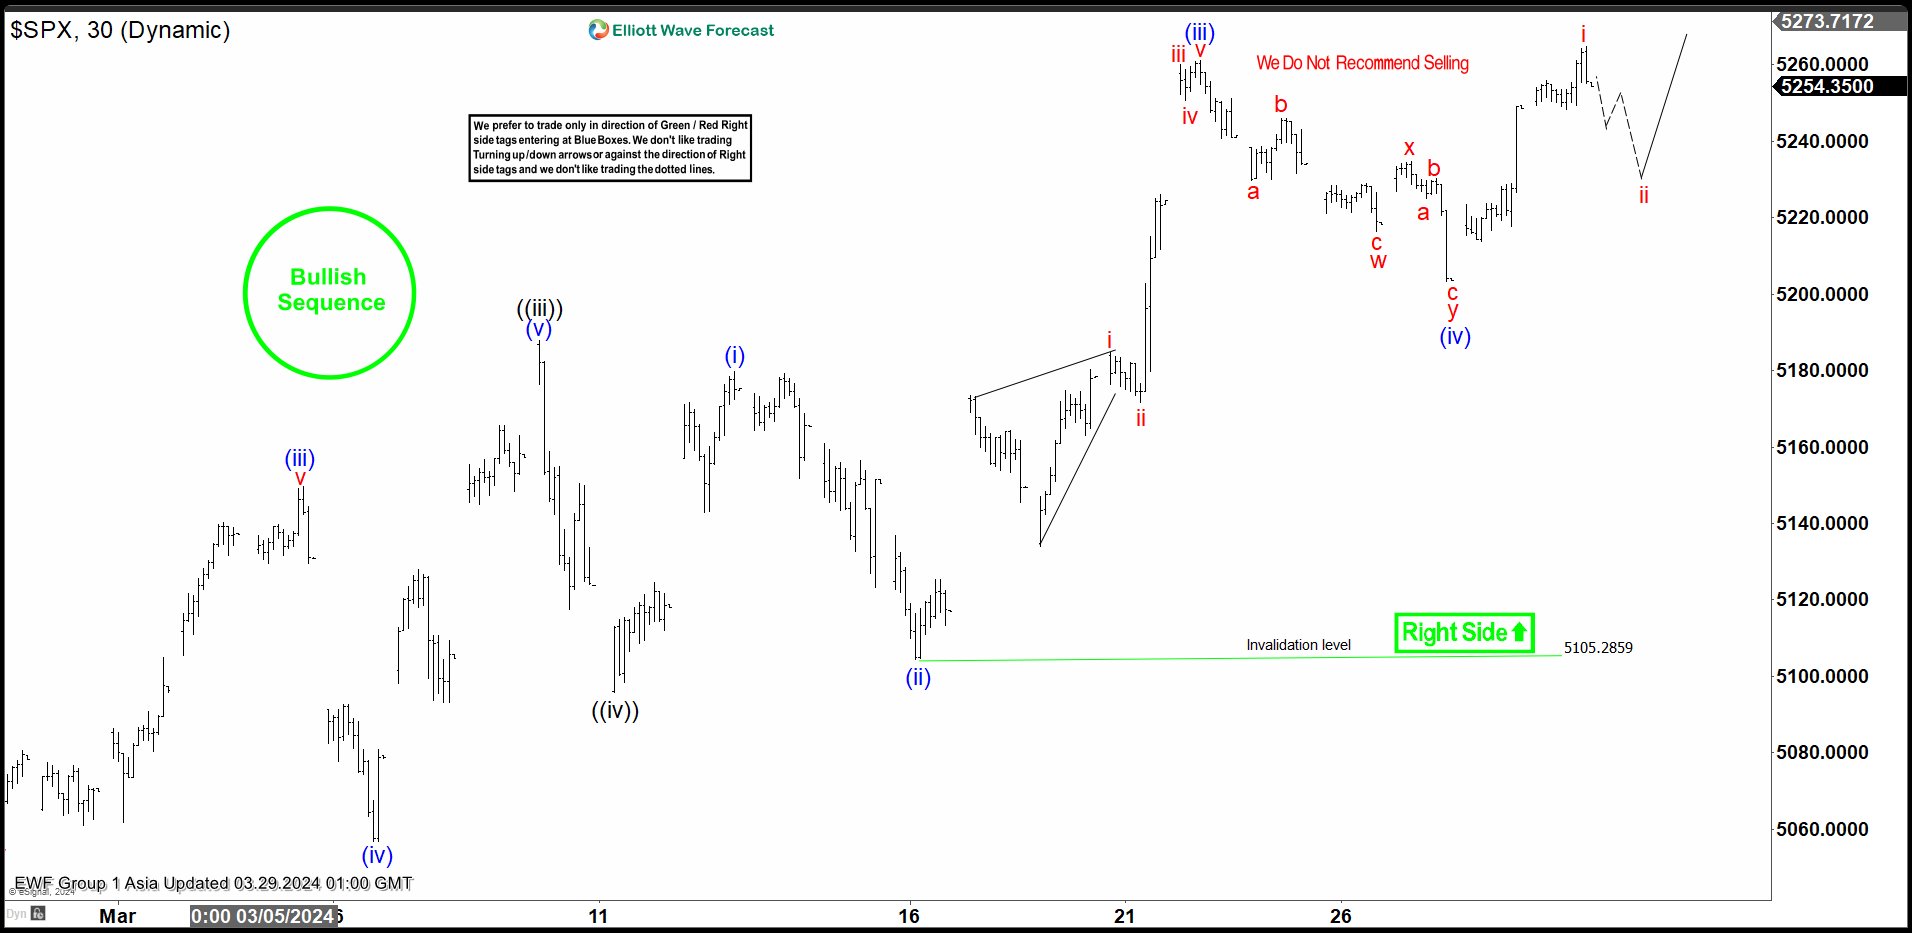
S&P 500 (SPX) Looking to Complete 5 Waves Impulse
Short Term Elliott Wave view in S&P 500 (SPX) suggests cycle from 1.6.2024 low is in progress as a 5 waves impulse. Up from 1.6.2024 low, wave ((i)) ended at 4931.09 and pullback in wave ((ii)) ended at 4845.15. Wave ((iii)) higher ended at 5187.78 as the 30 minutes chart below shows and pullback in wave ((iv)) ended at 5095.88. The Index has resumed higher in wave ((v)) with subdivision as another 5 waves in lesser degree.
Up from wave ((iv)), wave (i) ended at 5179.87 and dips in wave (ii) ended at 5105.28. Index resumed higher in wave (iii) towards 5261.1. Pullback in wave (iv) ended at 5203.42. Internal subdivision of wave (iv) unfolded as a double three Elliott Wave structure. Down from wave (iii), wave a ended at 5229.87 and wave b ended at 5246.09. Wave c lower ended at 5216.32 which ended wave w. Rally in wave x ended at 5234.7. Down from wave x, wave a ended at 5225.05and wave b ended at 5230.38. Index then resumed lower in wave c towards 5203.42 which completed wave y of (iv). Near term, as far as pivot at 5105.28 stays intact, expect dips to find support in 3, 7, 11 swing for further upside.
S&P 500 (SPX) 30 Minutes Elliott Wave Chart
S&P 500 (SPX) Elliott Wave Video
https://www.youtube.com/watch?v=i2TgE9KNrxw
Tokyo inflation moderates, supporting BoJ’s measured approach
Japan Tokyo CPI core (ex-food) slowed slightly from 2.5% yoy to 2.4% yoy in March, matched expectations. Headline CPI ticked up from 2.5% yoy to 2.6% yoy. CPI core-core (ex-food and energy) also slowed from 3.1% yoy to 2.9% yoy. Service price gains slowed to from 2.1% yoy to 2.0% yoy.
This constellation of data suggests softening of cost-push inflationary pressures within Tokyo, Japan's economic nucleus, and a concurrent easing in service-sector inflation. This trend could provide BoJ a leverage for a more cautious approach on tightening, despite widespread expectations of another rate hike in the latter half of the year.
Other economic indicators for February released paint a mixed picture. Industrial production fell -0.1% mom, falling short of the anticipated 1.2% growth. In contrast, retail sales outperformed expectations, surging by 4.6% yoy against forecasted 3.0% increase. Meanwhile, unemployment rate rose from 2.4% to 2.6%, exceeding the projected steady rate of 2.4%.
ECB’s Villeroy champions agile gradualism over wait-and-see in rate cut strategy
ECB Governing Council member Francois Villeroy de Galhau said in a speech overnight that risks to inflation are now "balanced", but risks to growth are "on the downside". There, "the time has come to take out an insurance against this second risk by beginning rate cuts," he emphasized.
Villeroy said whether it's April or June for the first cut has "no existential importance". After all, he reiterated that it should happen in Spring.
He also noted that ECB would probably start with a "moderate cut". After that " we won't be obliged to reduce rates at every Governing Council, but we should keep that option."
"We'll probably start with a moderate cut," he said. "After that, we won't be obliged to reduce rates at every Governing Council, but we should keep that option."
Regarding how far the ECB will ultimately go, Villeroy said it has a significant margin to lower rates before policy stops being restrictive or becomes too accommodative. "This is another reason to prefer agile gradualism to excessive wait-and-see," he added.
The Weekly Bottom Line: Fed in No Rush to Cut Interest Rates
U.S. Highlights
- New home sales fell in February, but remain fairly flat over the past three months. New home prices, meanwhile, continued to head lower last month, and are now down 13% from their 2022 peak.
- U.S. GDP growth in the fourth quarter of 2023 was revised up from 3.2% (annualized) previously, to an even better 3.4%.
- Given signs that inflation may have firmed up at the start of this year, Fed officials, including Fed Governor Waller, continued to argue for patience when it comes to reducing the policy rate.
Canadian Highlights
- The federal government hopes to reduce the non-permanent resident share of Canada’s population from 6.5% to 5% by 2027. If achieved, this would reduce pressure on housing and other infrastructure, but also potentially weigh on economic growth.
- In the near-term, however, the economy looks to have got off to a strong start in 2024. GDP surged 0.6% m/m in January and preliminary estimates point to another above-trend gain in February.
- With provincial budget season nearly wrapped up, the Big 4 provinces are expecting a deteriorated fiscal backdrop this year, on the back of weak revenues and decent spending gains.
U.S. – Fed in No Rush to Cut Interest Rates
The last week of March has been fairly quiet in a holiday-shortened week. With no primary data reports published so far, attention gravitated toward Fed speeches and second-tier reports. Equity markets, such as the S&P 500, struggled for direction, but managed to push higher later in the week.
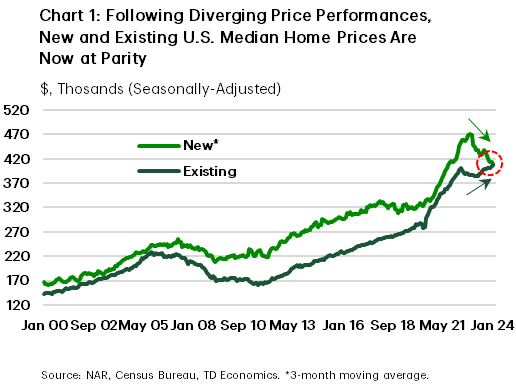
Signals from the housing market were mixed. Following a strong showing in existing home sales in February, new home sales fell a modest 0.3% last month. But, on a three-month moving average basis, the typically volatile series shows a mostly flat trend. What’s more interesting is the fact that the median new home price continues to decline, and has fallen roughly 13% from its peak at the end of 2022. At present, new and existing single-family home prices are essentially at parity (Chart 1). However, we expect there could be more weakness in new home prices ahead given there is 8.4 months of supply in that market, compared to a much tighter balance of 3 months in the existing home market .
Other secondart-tier releases lent support to a positive economic narrative. An upward revision to fourth-quarter GDP from 3.2% (annualized) previously to 3.4% marked a welcome surprise. Turning to more recent data, durable goods orders improved in February for a change. Total orders rose 1.4% following a downwardly revised 6.9% drop in January, and when excluding the volatile transportation category orders rose 0.5% after falling in the previous two months. Meanwhile, initial jobless claims edged lower last week to 210 thousand, reaffirming the notion of a still-robust labor market.
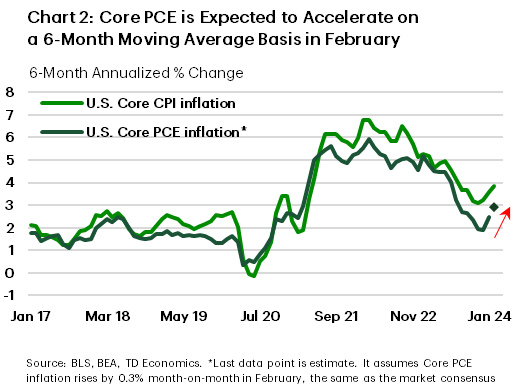
Financial markets are closed tomorrow for Good Friday, but the key personal income and spending (PCE) report for February will still be released. Markets expect real spending to improve by 0.1% m/m in February following an equal-sized drop in January. At the same time, the monthly gain in core PCE inflation, the Fed’s preferred inflation measure, is expected to ease to 0.3% m/m from 0.4% m/m in the month prior. Assuming the data comes in as expected, annual core inflation would hold at 2.8%. However, it would be at 2.9% over the most recent six month period, suggesting progress on inflation has stalled (Chart 2). This supports a more patient Fed when it comes to reducing the policy rate.
Several Fed officials, including Fed Governor Waller, drove this point home this week. Chair Powell is speaking tomorrow too but we anticipate no major change to the narrative that the Fed can be patient until it sees sustained progress on inflation before cutting interest rates. Next week’s highly anticipated employment report will help fill an added piece to the Fed’s policymaking puzzle.
Canada – Governments Steal The Show
Recent Canadian economic developments have been dominated by governments. The federal government made considerable waves late last week with its plan to shrink the share of non-permanent residents in Canada’s population from its current level of 6.5% to 5% by 2027 (Chart 1). Even with a growing population, this implies a net drawdown of these types of newcomers over the next several years.
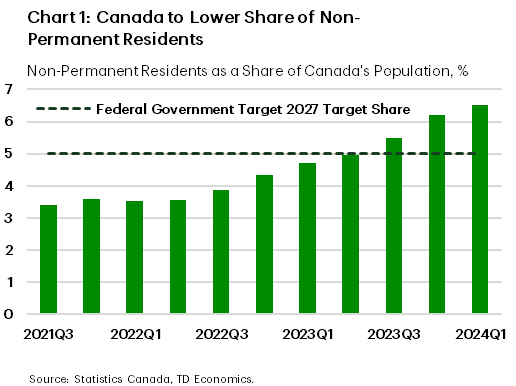
Just this week, fresh population data showed that over 800k non-permanent residents came to Canada in 2023 – by far the largest inflow on record back to the 1970s. This category helped the country’s population balloon by a massive 3.2% in 2023. If the federal government succeeds in achieving its target, the result will be a huge step down in Canada’s population growth over the medium term. This will offer significant assistance in aligning new housing supply with demand, while reducing pressure on rents and other infrastructure.
The federal government’s policy could also potentially weigh on economic growth and inflation, possibly pointing to a lower level of interest rates than would otherwise be the case over the medium term. However, in the very near-term, economic growth has gotten off to a surprisingly strong start in 2024. Industry-based GDP data for January showed that the economy expanded by a hearty 0.6% month-on-month, led by a rebound in public sector production after the resolution of strikes in Quebec. February’s preliminary estimate is also solid, pointing to 0.4% monthly gain. Combined, these numbers suggest that first quarter economic growth could be well above our recent forecast.
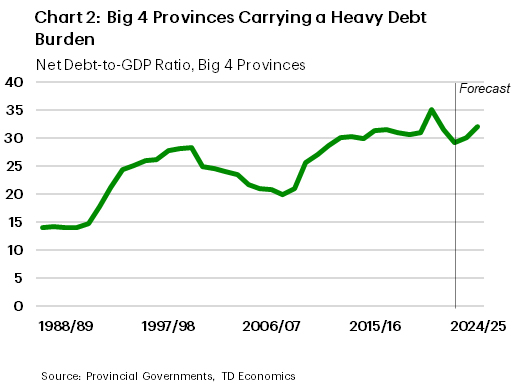
With the release of Ontario’s budget this week, we nearly have the full picture of the provincial budget season. We only await fiscal blueprints from Manitoba next week, and then the federal government on April 16th. Still, information at hand allows for a few key takeaways. First, the fiscal backdrop is set to deteriorate meaningfully this year. Across the Big 4 provinces (B.C., Ontario, Quebec, and Alberta), deficits are expected to total -1% of GDP. That’s the largest shortfall (outside of the pandemic) since 2012/13. Anticipated deficits for this fiscal year across the Big 4 come courtesy of what’s expected to be considerably slower revenue gains alongside decent spending growth, with the latter having the potential to support the economy during its rough patch.
Meanwhile, net debt-to-GDP (the common measure of a government’s debt burden) is expected to rise to 31% across the Big 4 (Chart 2). That’s not quite the highest on record, but it’s close. With these elevated debt burdens come rising interest costs. For example, Quebec and Ontario combined expect to spend nearly $25 billion on debt servicing charges. These costs are higher than what these governments will spend on many other major programs. Notably, high debt loads will also leave provinces vulnerable to unexpected events.