Sample Category Title
Australian Dollar Slides After Weak Retail Sales Report
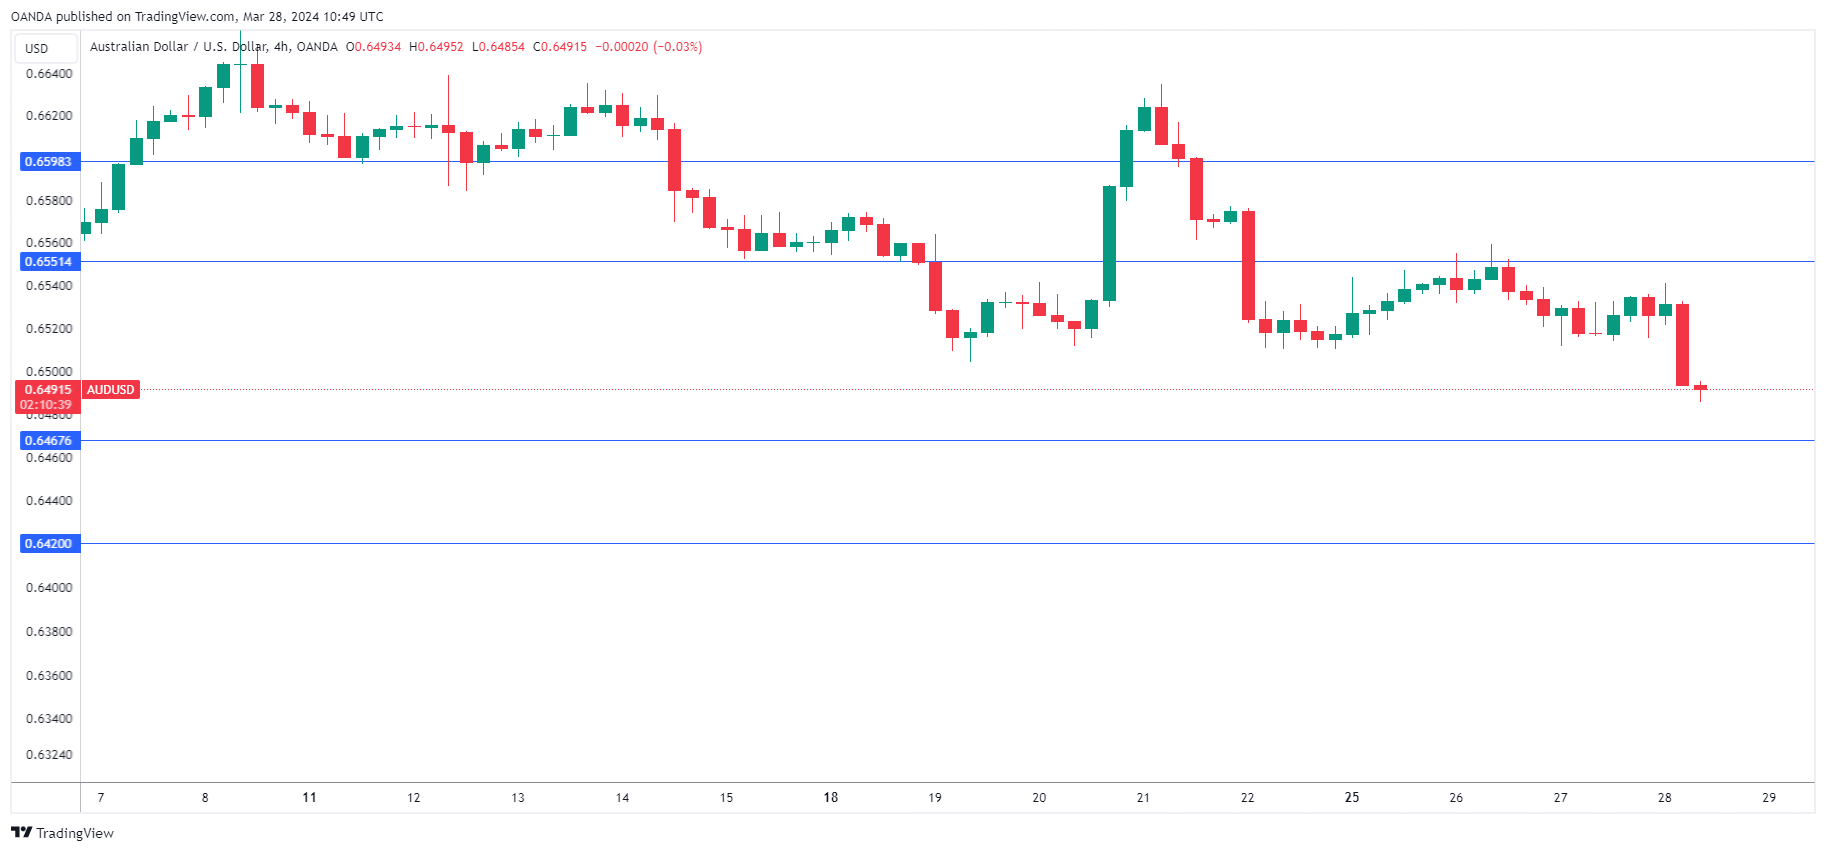
The Australian dollar is down sharply and has fallen to a three-week low. In the European session, AUD/USD is trading at 0.6491, down 0.66%.
Australia’s retail sales rise 0.3%
Australia’s retail sales slipped in February to 0.3% m/m, a sharp drop from the 1.1% gain in January and shy of the market forecast of 0.4%. Retail sales were up 1.6% y/y, which is considered weak reading given Australia’s rapid population growth.
Retail sales would slipped to just a 0.1% gain but seven Taylor Swift shows in Melbourne and Sidney boosted spending on clothing, merchandise and dining out, according to the Australian Bureau of Statistics.
Consumer spending remains weak due to elevated interest rates and high inflation. The Reserve Bank of Australia left rates unchanged for a fourth straight time at the March meeting and consumers are feeling pessimistic about the economy, which has dampened consumer spending.
The markets are looking at a rate cut in August or September but the RBA is yet to rule out rate hikes, although the language of the RBA statement at the March meeting was a bit more dovish than at the previous meeting. This week’s inflation release didn’t provide much support for lowering rates, with February CPI remaining unchanged at 3.4% for a third straight month.
The RBA is wary about lowering rates before it is convinced that inflation will remain sustainable in the 2% to 3% target range and won’t rebound if rates are cut. The next meeting is on May 7th and the first-quarter inflation report, which will be released in late April, could have a major impact on the central bank’s rate decision.
AUD/USD Technical
- AUD/USD is putting pressure on resistance at 0.6551. Above, there is resistance at 0.6598
- There is support at 0.6467 and 0.6420
ECB’s Panetta: Conditions for monetary easing are materializing
In a speech delivered in Rome, ECB Governing Council member Fabio Panetta acknowledged the impact of restrictive policies on demand, attributing these measures, alongside the falling energy prices, as key factors in the "rapid fall in inflation".
More importantly, Panetta highlighted "risks to price stability have diminished". Hence, and the "conditions are materializing to launch monetary easing."
AUDUSD Gets Bearish Vibes
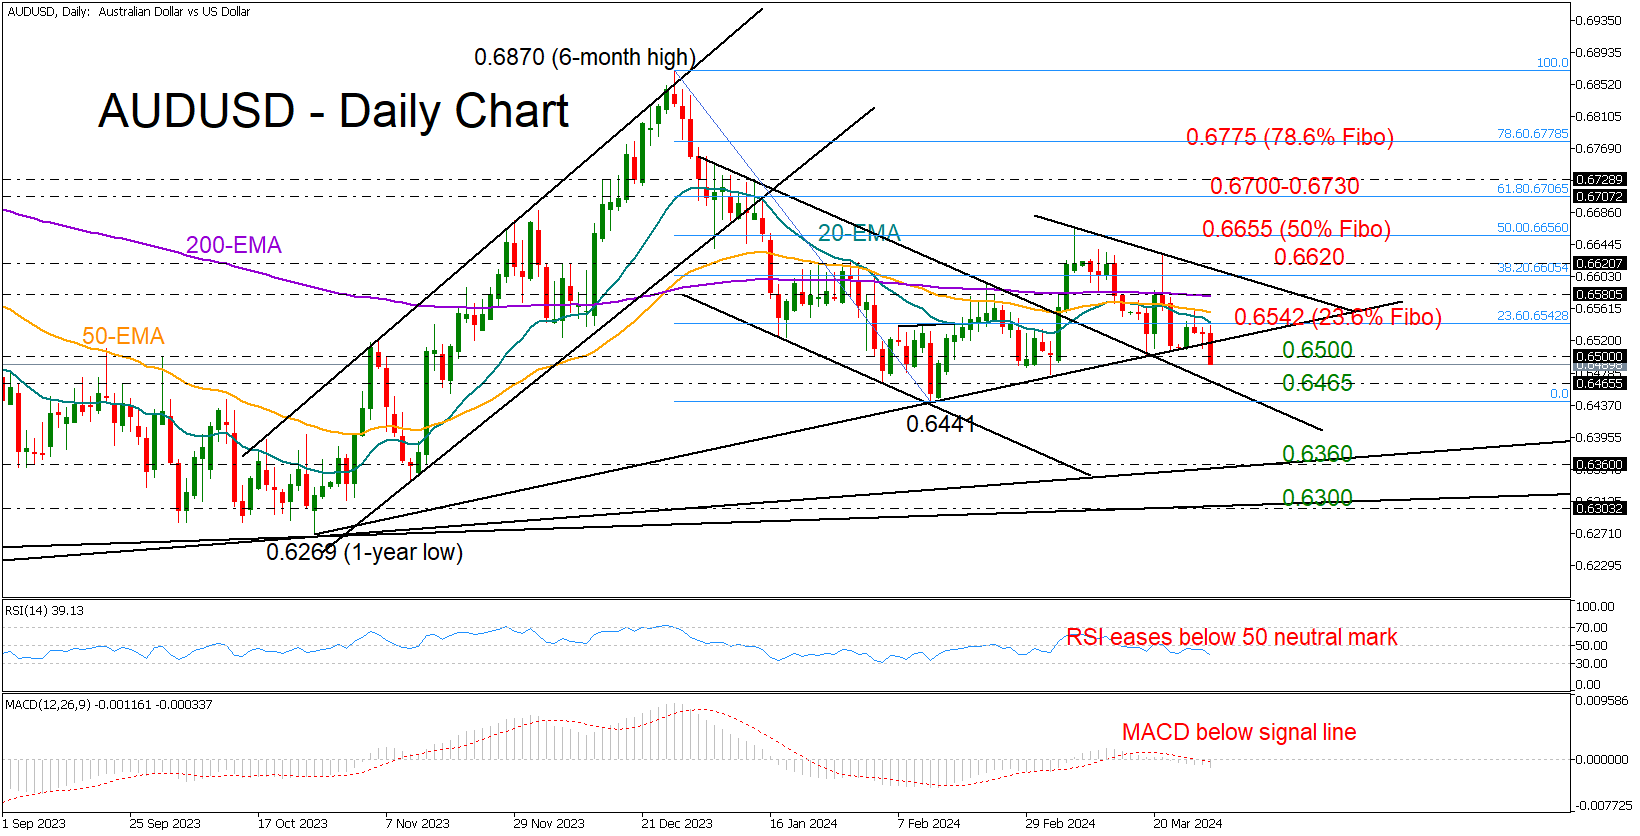
- AUDUSD violates key support zone
- Bearish pressures could persist in short-term
AUDUSD’s short-term upward pattern is under threat as it faces the risk of closing below the October support trendline at 0.6500, following another rejection near its exponential moving averages (EMAs).
Technical indicators suggest the bears are in control as the RSI is decelerating below its 50 neutral mark and the MACD is weakening within the negative region.
If the price stays below 0.6500, there is a possibility of it retesting the upper band of the broken bearish channel (January-March) at 0.6465 and February’s low at 0.6440. Neglecting to pivot there could result in a drop towards 0.6370, where the ascending trendline linking the pandemic and 2023 lows is positioned. The 0.6269-0.6300 territory could be the next destination if selling forces further strengthen.
To improve market sentiment, the pair will have to surpass its EMAs and exceed the March barrier of 0.6620. In the event that scenario plays out, resistance might be encountered around the 0.6655 level, which represents the 50% Fibonacci retracement of the December-February downtrend, and then within the range of 0.6700-0.6730.
In summary, the short-term bias for AUDUSD appears to be tilted downwards. Once the bears successfully claim the 0.6500 floor, the January-February downtrend will come back into focus.
WTI Oil Futures in Fierce Battle With 50.0% Fibo
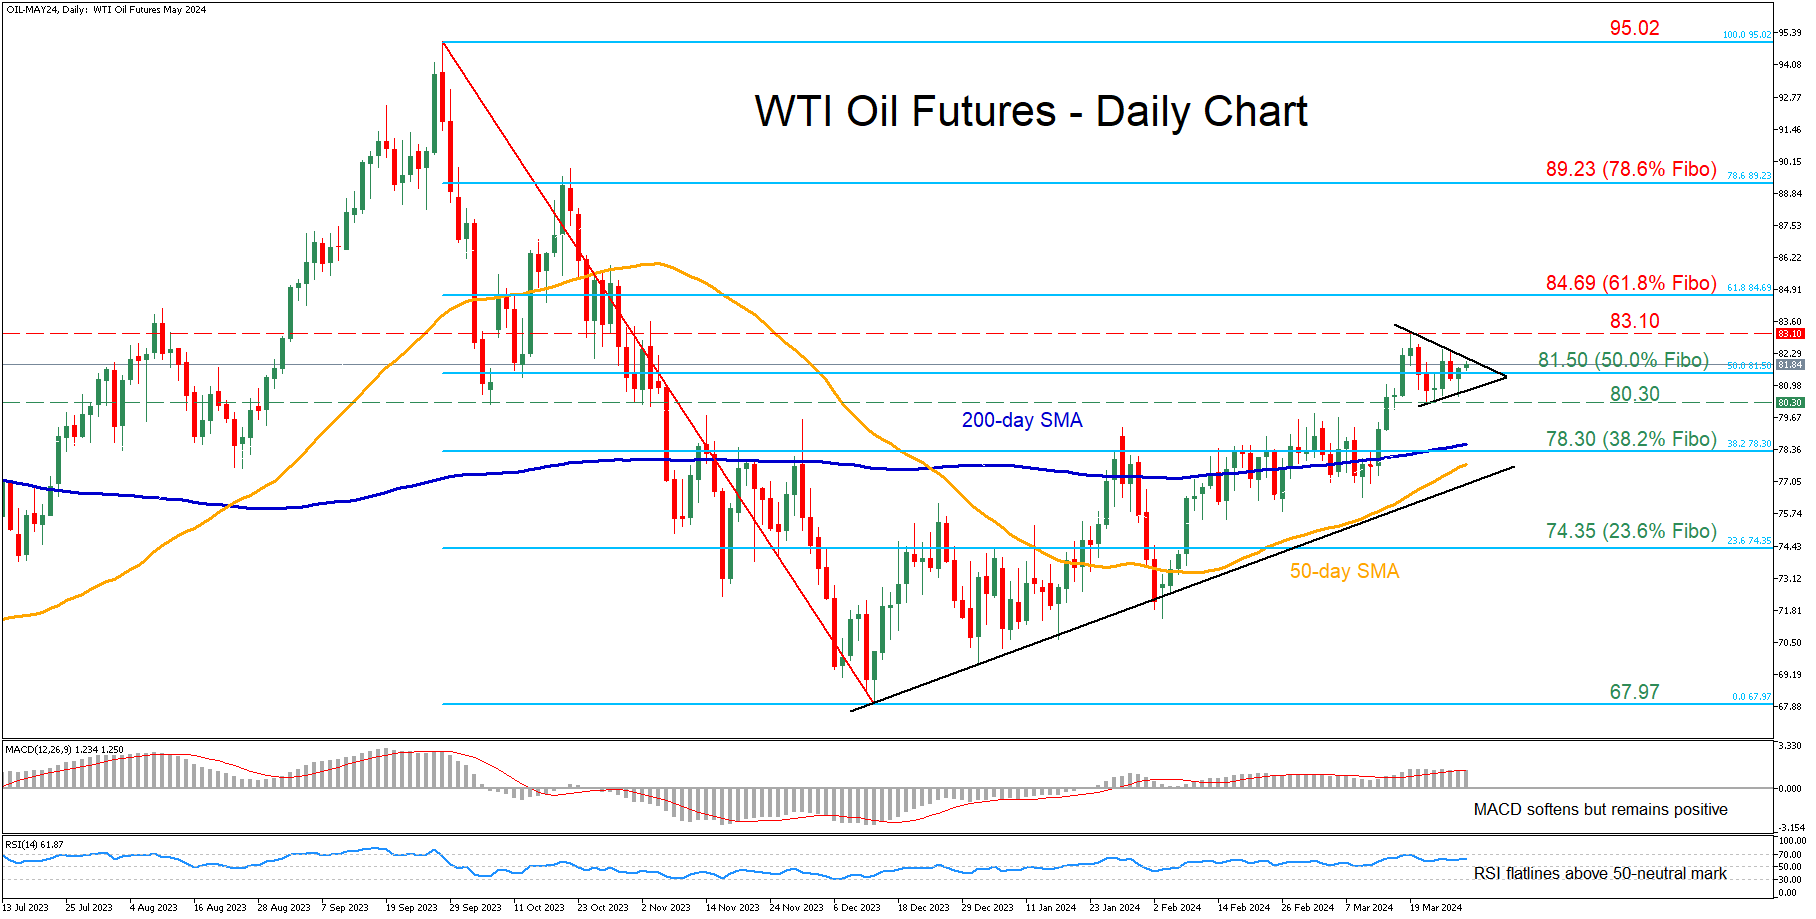
- WTI futures post an almost 5-month peak
- But fail to advance further and hover around 50.0% Fibo
- Oscillators suggest that the bulls retain the upper hand
WTI oil futures (May delivery) have been in a steady recovery from their December bottom of 67.97, posting an almost five-month peak of 83.10 last week. However, the advance seems to be on hold for now as the price has reversed lower and formed a symmetrical triangle around the 50.0% Fibonacci retracement of the 95.02-67.97 downleg.
Given that both the RSI and MACD are tilted to the upside, the bulls could attack 83.10, which is the highest level observed since November 3. Further advances could then stall around the 61.8% Fibo of 84.69. Surpassing that zone, the price could ascend to face the 78.6% Fibo of 89.23, a region that held strong in October 2023.
On the flipside, if sellers re-emerge and push the price back below the 50.0% Fibo of 81.50, the decline could then cease at the recent support of 80.30. Lower, the 38.2% Fibo of 78.30 could act as the next line of defense. A violation of that territory could set the stage for the 23.6% Fibo of 74.35.
In brief, WTI oil futures’ rebound has stalled in the past few sessions, with the price lingering around the 50.0% Fibo of 81.50. Nevertheless, the formation of a pennant pattern around that region might be hinting at a potential breakout move in the upcoming sessions.
Nasdaq 100: Deteriorating Market Breadth Does Not Bode Well for the Bulls
- The price actions of Nasdaq 100 have reached the lower limit of a major resistance zone of 18,435/620.
- Heightened over-concentration risk from Nvidia as its current year-to-date returns of 87% contributed to 55% of Nasdaq 100’s year-to-date return of 10.50% as of 27 March.
- Nasdaq 100’s market breadth indicators have started to deteriorate which increases the risk of an imminent multi-week corrective decline sequence.
Since the publication of our previous analysis, the price actions of the US Nas 100 Index (a proxy of the Nasdaq 100 future) have continued to surge upwards towards 18,270 and 18,435 resistance levels as flagged in our report. Thereafter, the red-hot Index rocketed to print another fresh all-time high of 18,497 on last Thursday, 21 March ex-post FOMC.
The current major uptrend phases of the major US benchmark stock indices; S&P 500, Nasdaq 100, and Dow Jones Industrial Average in place since their respective October 2023 lows have continued to oscillate in impulsive bullish up moves sequences without any medium-term multi-week correction corrective decline of -5% or more, except for the small-caps Rusell 2000 that saw a loss of -8.4% during the period of 26 December 2023 to 16 January 2024 (high to low).
Over-concentration risk from Artificial Intelligence (AI) theme play
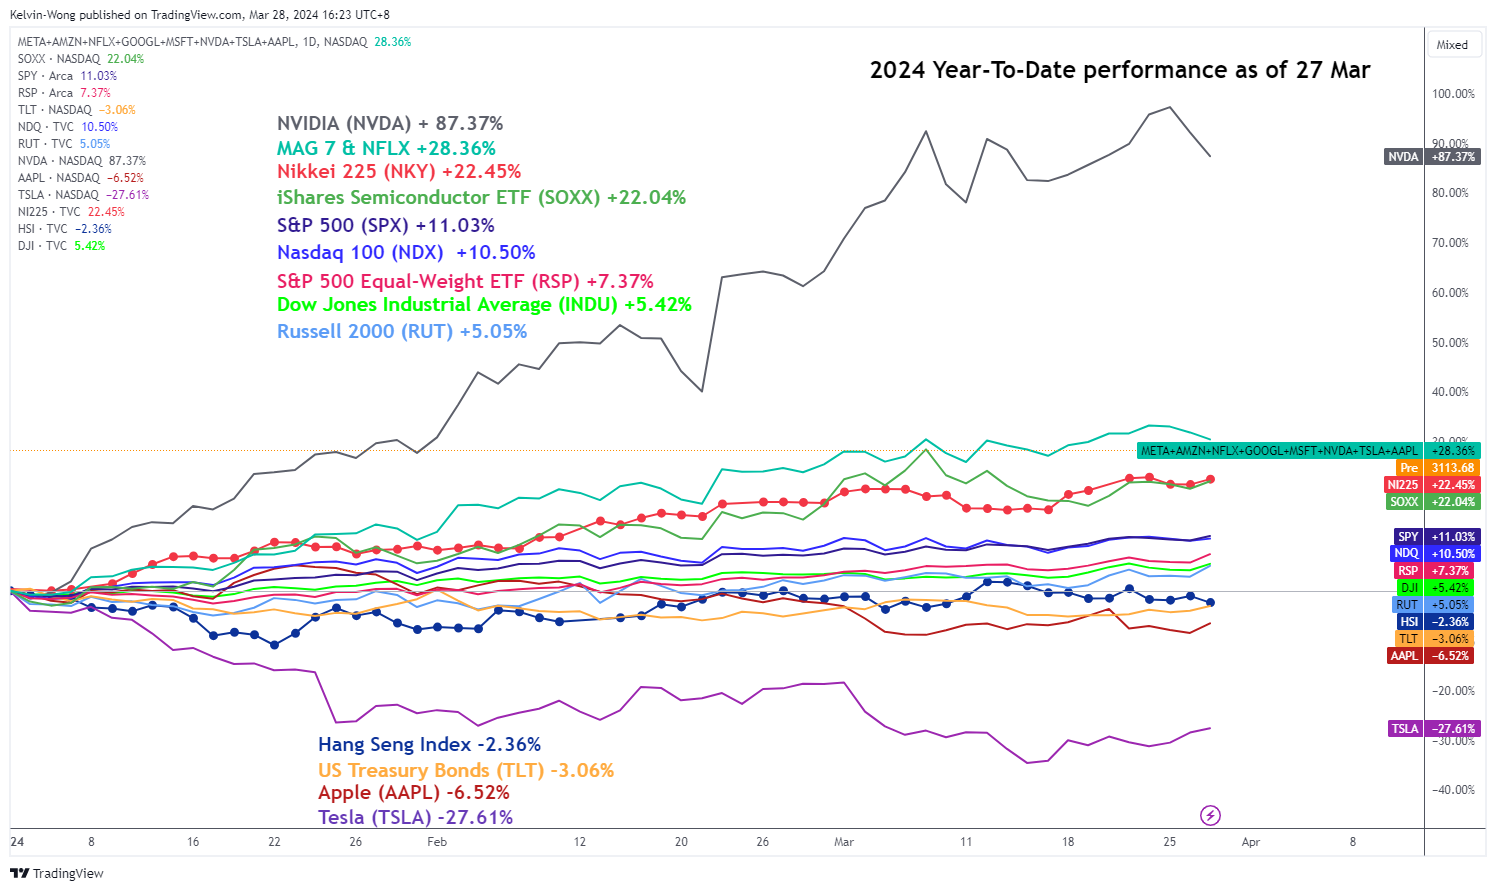
Fig 1: 2024 YTD performance of major US benchmark stock indices & key component stocks & ETFs as of 27 Mar 2024 (Source: TradingView, click to enlarge chart)
Q1 2024 is ending soon with one more day to go, the year-to-date performances of the major US benchmark stock indices as of yesterday, 27 March look set to end positively with another second consecutive winning quarter led by the S&P 500 (+11.03%), and Nasdaq 100 (+10.50%) with the Dow Jones Industrial Average (5.42%) as well as Russell 2000 (+5.05%) trailing behind.
The main significant star contributor has been the stellar bullish run of Nvidia that rocketed to a year-to-date return of +87.37% (with a current peak of +97.24%) due to its market leadership in producing bespoke semiconductor chips that are being used to power up the current in-demand hardware servers to run generative AI functions for corporations (see Fig 1).
At this current rate of return seen in the share price of Nvidia has surpassed the returns of the S&P 500 and Nasdaq 100 by around a multiple of 9 X, also due to the market capitalization weightage calculation of the component stocks that make up the S&P 500, and Nasdaq 100, Nvidia has risen to become the third-ranked component stock behind Apple, Microsoft with a weightage of 5.30%, and 6.60% respectively.
In a nutshell, after a simple calculation using the current S&P 500, and Nasdaq 100 market cap weightage coupled with the current year-to-date return of +87.37% of Nvidia, the sole share price movement of Nvidia has contributed almost half the current-year-date return of S&P 500 at 42%, and a larger extend of 55% for Nasdaq 100.
A lone star that is holding the fort without any significant bullish support from the rest has increased the risk of vulnerability to trigger a potential multi-week correction in the US benchmark stock indices if macro factors deteriorate such as a reduction in the Fed dovish pivot narrative in terms of the number of interest rate cuts for 2024 (currently three cuts are being priced in according to CME FedWatch Tool), a further uptick in the geopolitical risk premium, and the rise of a currency war if the China central bank, PBoC attempts to guide the Chinese yuan to weaker levels against the US dollar.
Market breadth has turned lacklustre
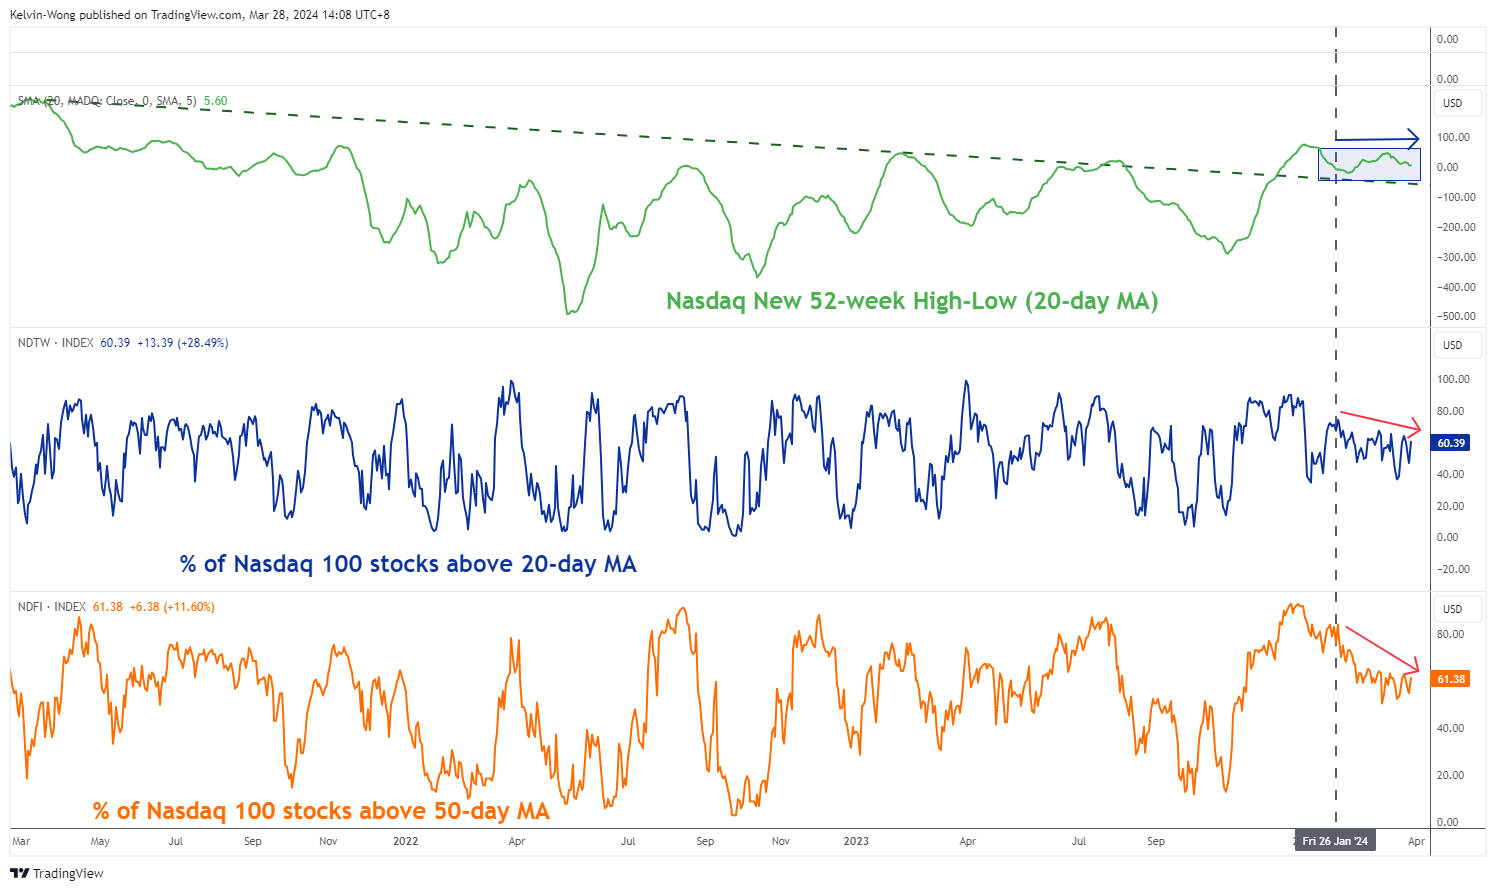
Fig 2: Market breadth indicators of Nasdaq Composite & Nasdaq 100 as of 27 Mar 2024 (Source: TradingView, click to enlarge chart)
On top of the over-concentration risk from Nvidia highlighted earlier, the market breadth of Nasdaq 100 has also deteriorated in the past month.
The new 52-week High/Low (20-day moving average) of the larger Nasdaq Composite has started to turn flat since 26 January 2024 which suggests that fewer component stocks within the Nasdaq Composite are making new 52-week highs as compared to new 52-week lows.
To add salt to this bearish technical element, the percentage of component stocks inside the Nasdaq 100 that are holding above their respective 20-day and 50-day moving averages has fallen over the same period with the most significant observation seen on the 50-day moving averages where the percentage of component stocks have fallen to 61% as of yesterday, 28 March from 76% printed previously on 26 January 2024.
A glaring bearish divergence condition remains intact on the Nasdaq 100
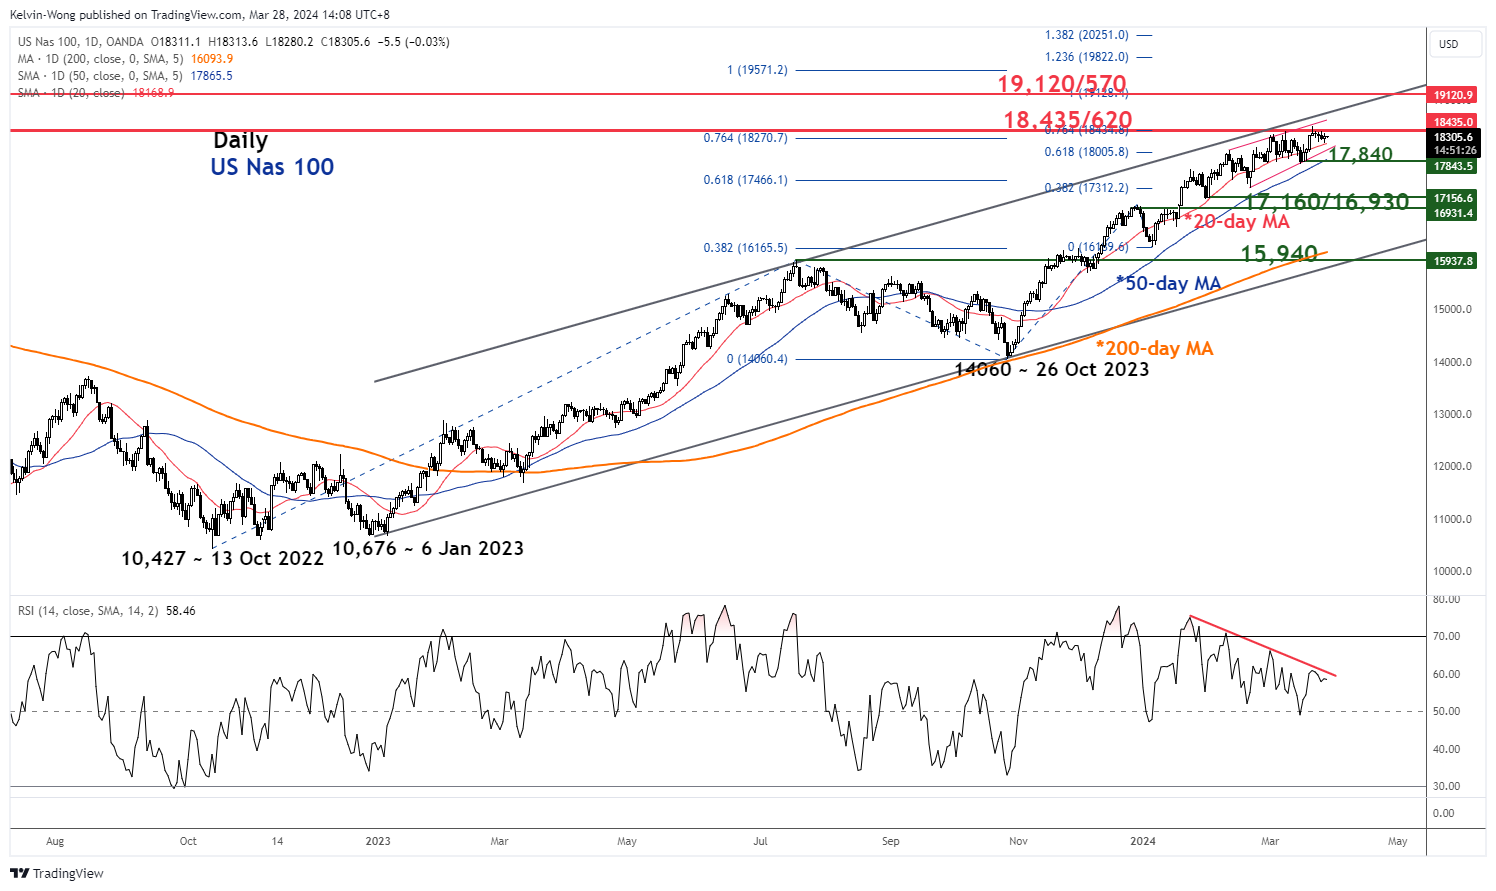
Fig 3: US Nas 100 medium-term & major trends as of 28 Mar 2024 (Source: TradingView, click to enlarge chart)
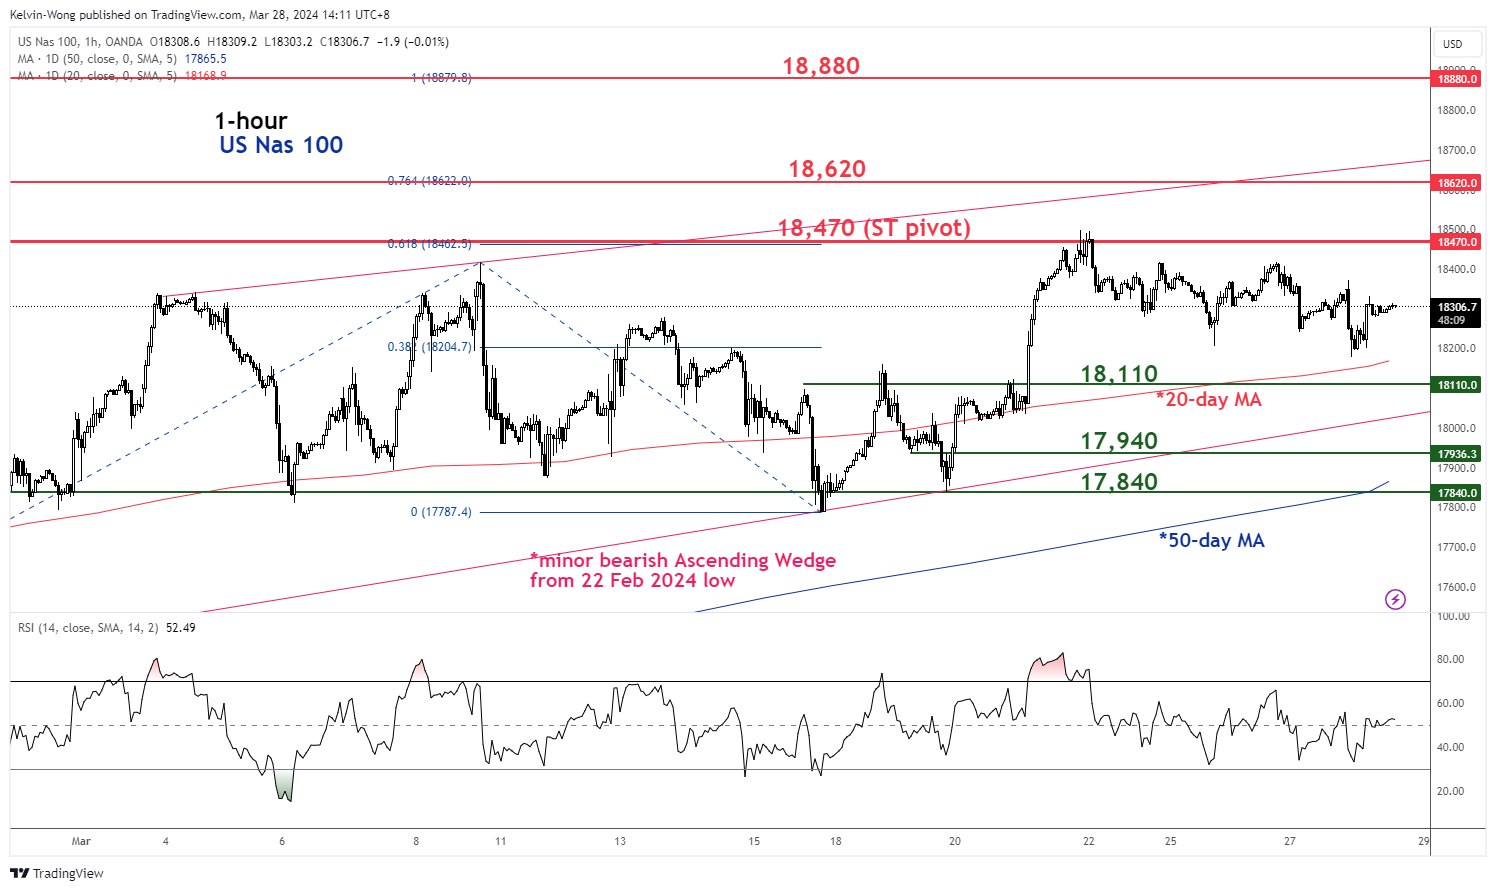
Fig 4: US Nas 100 short-term trend as of 28 Mar 2024 (Source: TradingView, click to enlarge chart)
In the lens of technical analysis, the major bullish trend of the US Nas 100 Index (a proxy of the Nasdaq 100 future) in place since the 26 October 2023 low of 14,060 is flashing out bearish conditions that increase the odds of at least an imminent multi-week corrective decline that may unfold next after a strong impulsive up move.
In the past week, its price actions have pushed up and hit the major resistance zone of 18,435/620 (also the upper boundary of a long-term secular ascending channel from the 6 January 2023 low). In conjunction, it has also formed a bearish “Ascending Wedge” configuration since 22 February 2024 coupled with a persistent bearish divergence seen in the daily RSI momentum indicator, a sign that medium-term upside momentum is waning (see Fig 3). A clear break with a daily close below the 17,840 support may trigger the start of the potential multi-week corrective decline with the next medium-term support zone to watch at 17,160/16,930.
On the shorter-term time horizon, as seen on the hourly chart, its price actions have turned choppy since 4 March 2023 as it has been “sandwiched” between 18,470 and 18,110 (close to the 20-day moving average) (see Fig 4).
In the interim, the key short-term pivotal resistance stands at 18,470 with key near-term support at 18,110. A break below 18,110 may expose the next intermediate supports of 17,940 and 17,840.
On the flip side, a clearance above 18,470 invalidates the bearish tone for a squeeze up toward the upper limit of the major resistance at 18,620.
EUR/USD Analysis: Price Today Has Set Its Minimum Since the Beginning of March
As the EUR/USD chart shows at the start of the European session today, the exchange rate has dropped below EUR 1.08 per US dollar.
Tuesday's news contributed to this. According to Nasdaq.com, on March 26, 2024, The Conference Board published a report for March, according to which the CB Consumer Confidence index of consumer confidence dropped sharply: fact = 104.7; forecast = 107.0; previous value = 106.7. Comments followed: “Consumers remain concerned about increased price levels, which dominates the responses. March written responses showed growing concerns about food and gasoline prices.”
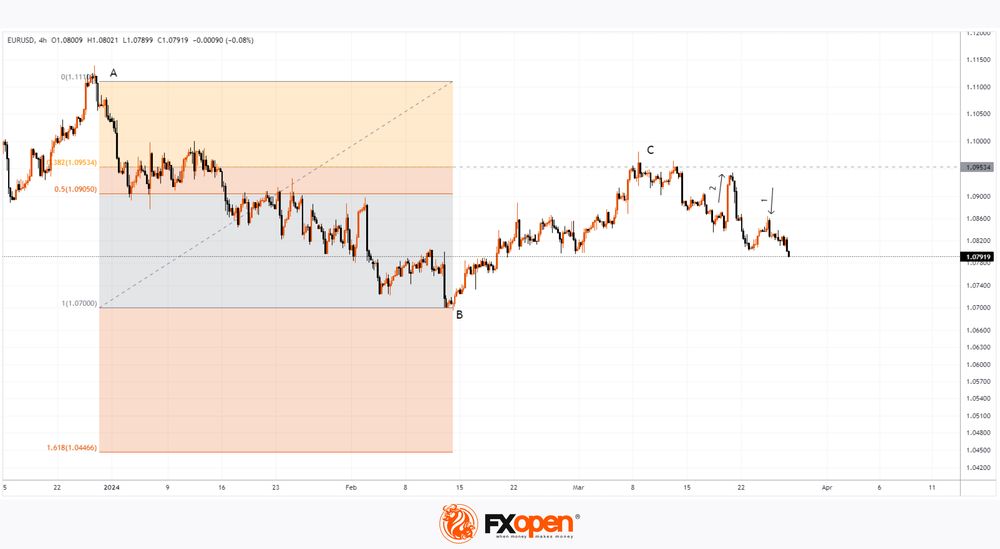
As a result, the US dollar strengthened (as shown by arrow No. 1). After all, if the published data give grounds to assess inflation as high, then the Fed’s tough policy may last longer.
Today's decline reflects a rebalancing in market sentiment.
Fed spokesman Christopher Waller added doubts about easing monetary policy yesterday, saying that the economy does not require a dramatic reduction in rates, so the Fed is in no hurry.
Could the US dollar strengthen further against the euro?
This prospect is supported by the assumption that medium-term traders who opened long positions on March 20 in response to the growth of EUR/USD (shown by arrow No. 2) are now actively closing positions, creating additional pressure.
Technical analysis of EUR/USD provides another argument: the increase in B→C stopped at the Fibonacci level of 0.382, formed from the decline in A→B. Thus, according to wave theory and Fibonacci proportions, the current decline may reach the level of 1.618, which approximately corresponds to the 2024 low.
Euro bulls have enough reasons to be cautious.
Trade over 50 forex markets 24 hours a day with FXOpen. Take advantage of low commissions, deep liquidity, and spreads from 0.0 pips. Open your FXOpen account now or learn more about trading forex with FXOpen.
This article represents the opinion of the Companies operating under the FXOpen brand only. It is not to be construed as an offer, solicitation, or recommendation with respect to products and services provided by the Companies operating under the FXOpen brand, nor is it to be considered financial advice.
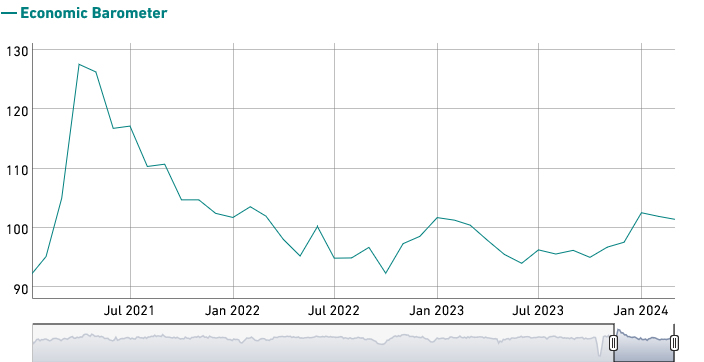
Swiss KOF falls to 101.5, yet outlook remains positive
Swiss KOF Economic Barometer fell from 102.0 to 101.5 in March, below expectation of 102.3. Despite this minor setback, the barometer continues to hover above its long-term average, indicating a positive outlook for the Swiss economy in the coming months.
The decline can primarily be attributed to weaker performances in the construction sector and private consumption. However, finance and insurance sector emerged as a bright spot, with indicators pointing to slight improvements.
A First Fed Rate Cut in June Seems Highly Premature
Markets
German Bunds outperformed US Treasuries yesterday on milder than expected Spanish CPI and soft comments from Italian ECB board member Cipollone. He suggested that the ECB might be able to reduce rates swiftly as the to give the economy a chance to recover as inflation eases. German yields declined between 5.8 bps (5 & 10-y) and 4.3 bps (2-y). US yields ceded between 2.3 bps (2-y) and 4.7 bps (30-y). A $43bn 7-y US Treasury action went smoothly. A further easing of financial conditions supported equities (Dow +1.22%). The dollar mostly succeded marginal gains (DXY close 104.34; EUR/USD 1.0828). USD/JPY 152 remains a potential line in the sand for BoJ interventions. The yen gained modestly to close at USD/JPY 151.33, but the picture remains fragile.
After US close, Fed Waller brought gave an update on his end of February “What’s The Rush” comments in a speech before the before the Economic Club of New York titled: “There’s Still No Rush”. Economic output and the labor market show continued strength, while progress in reducing inflation has slowed. Economic growth is slowing from elevated levels, but evidence of a significant slowdown is sparse. There are indications that the labour market is moving toward a better balance, but it is still adding jobs at a rapid pace. With respect to inflation, Waller analyses that 3 and 6 month annualized core measures were running at a 4.2% and 3.9% pace in February. These shorter-term inflation measures suggest that progress has slowed or even may have stalled. Waller wants ‘to see at least a couple months of better inflation data before I have enough confidence that beginning to cut rates will keep the economy on a path to 2 percent inflation.’. This hope for evidence de facto won’t be evident as base effects suggest a further upward drift in inflation in the next five months. A first Fed rate cut in June seems highly premature. US yields this morning add between 4 bps (2-y) and 0.5 bps (10-y).
Later today, the eco calendar contains US weekly jobless claims, the MNI Chicago PMI and pending home sales. German retail sales again disappointed (-1.9% M/M) this morning. Belgium and Portugal publish February inflation data. French, German, Italian and US PCE deflators are tomorrow on tap. Wallers’ comments might help to put a floor below (US and EMU) yields and benefit the dollar with EUR/USD closing in on the 1.08 big figure/support area.
News & Views
Rating agency S&P affirmed the US’ AA+ rating with a stable outlook. The decision is supported by the wealth, resilience, and diversity of its economy, its institutional strengths, extensive economic policy flexibility including proactive monetary policy and the unique status of the dollar as the world’s leading reserve currency. But comparatively weak fiscal indicators that continue to constrain the sovereign credit rating offset those strengths. The agency notes that (bipartisan) efforts to meaningfully lower deficits and tackle budgetary rigidities remain elusive. Deficits are projected to average 6% of GDP in the coming years, pushing the debt to GDP ratio from 94% in 2023 beyond 100% in 2026-2027. Due to a changed interest environment, S&P expects net general government interest to revenues to stick around the 2023 levels of 11%. GDP growth is seen at 2.5% this year before averaging to 1.7% in 2025-2027. Inflation should ease from 2.8% this year towards the 2% over the next couple of years.
Polish MPC member Maslowska in an interview with PAP newswire said it’s possible to think about rate cuts in the second half of 2025 or early 2026. She refers to the many uncertainties that could drive up inflation and the current projection of not hitting the target until 2026. Maslowska didn’t even want to rule out a hike this year should one or more of the upside risks materialize. On the zloty, which continues to trade around the multiyear highs of EUR/PLN at 4.3, she said there’s still room for appreciation that could be tolerated. Her colleague Iwona Duda sounded slightly less hawkish. While she saw no room for rate cuts this year, the discussion itself could start at the end of 2024..
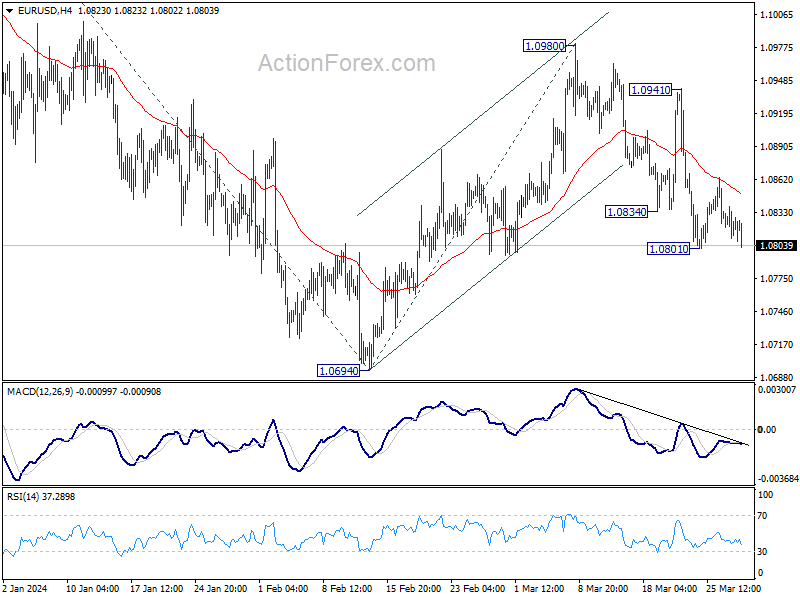
EUR/USD Daily Outlook
Daily Pivots: (S1) 1.0813; (P) 1.0826; (R1) 1.0841; More...
Intraday bias in EUR/SD remains neutral a this point. Risk will stay on the downside as long as 55 4H EMA (now at 1.0848) holds. Below 1.0801 will resume the fall from 1.0980 to retest 1.0694 first. Break there will resume the decline from 1.1138 and target 100% projection of 1.1138 to 1.0694 from 1.0980 at 1.0536.
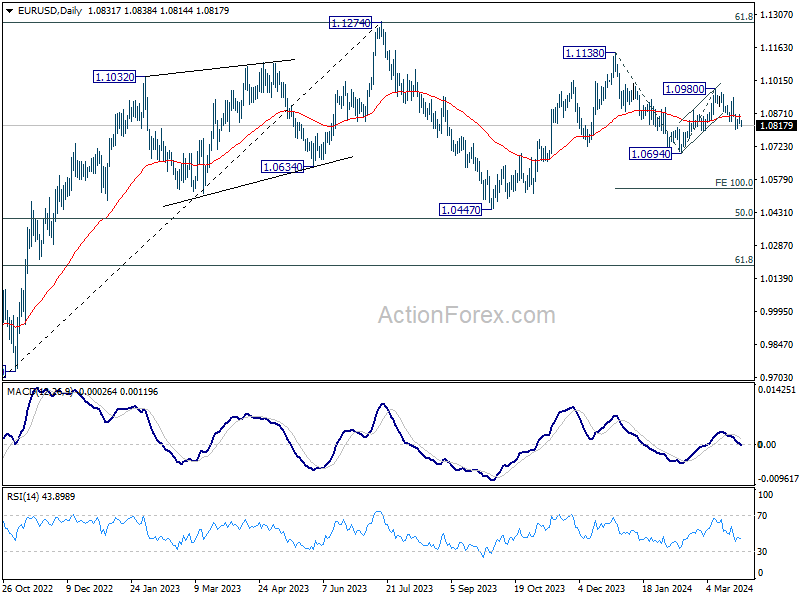
In the bigger picture, price actions from 1.1274 are viewed as a corrective pattern to rise from 0.9534 (2022 low). Rise from 1.0447 is seen as the second leg. While further rally could cannot be ruled out, upside should be limited by 1.1274 to bring the third leg of the pattern. Meanwhile, sustained break of 1.0694 support will argue that the third leg has already started for 1.0447 and possibly below.
GBP/USD Daily Outlook
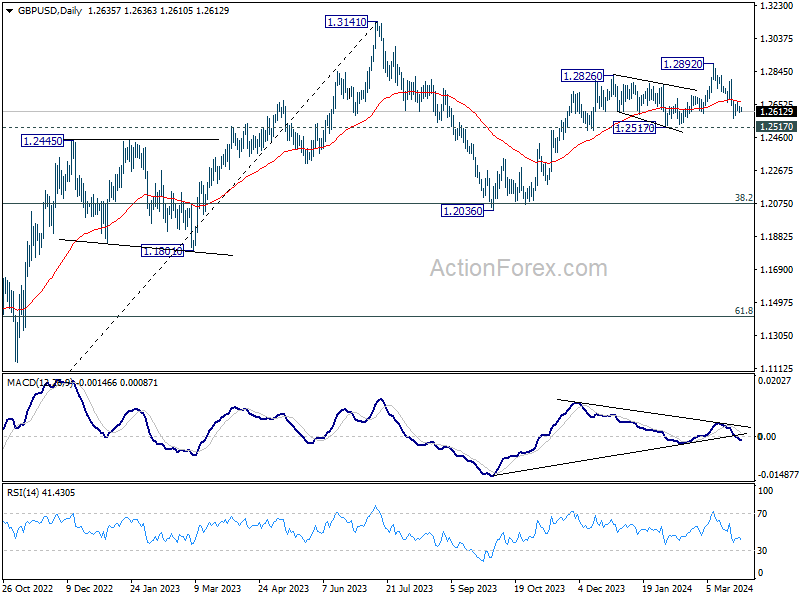
Daily Pivots: (S1) 1.2617; (P) 1.2629; (R1) 1.2653; More...
Intraday bias in GBP/USD remains neutral for the moment. Risk stays on the downside as long as 55 4H EMA (now at 1.2667) holds. Below 1.2574 will resume the fall from 1.2892 to 1.2517 structural support first. Decisive break there will suggest that rise from 1.2036 has completed at 1.2892 already, and turn near term outlook bearish.
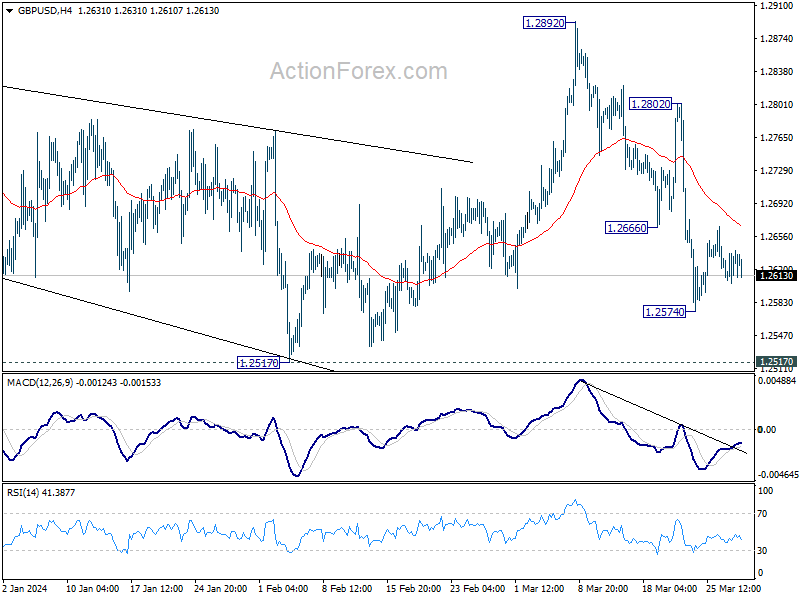
In the bigger picture, price actions from 1.3141 medium term top are seen as a corrective pattern to up trend from 1.0351 (2022 low). Rise from 1.2036 is seen as the second leg, which might still be in progress. But upside should be limited by 1.3141 to bring the third leg of the pattern. Meanwhile, break of 1.2517 support will argue that the third leg has already started for 38.2% retracement of 1.0351 (2022 low) to 1.3141 at 1.2075 again.