Sample Category Title
USD/JPY Could Consolidate Before Fresh Increase
Key Highlights
- USD/JPY climbed higher above the 150.50 and 151.20 resistance levels.
- A major bullish trend line is forming with support at 150.60 on the 4-hour chart.
- EUR/USD could gain bearish momentum below 1.0820.
- Crude oil prices are accelerating above the $82.50 resistance zone.
USD/JPY Technical Analysis
The US Dollar climbed further higher above the 149.20 resistance zone against the Japanese Yen. USD/JPY broke the 150.00 resistance to set the pace for more upsides.
Looking at the 4-hour chart, the pair even settled above the 150.50 level, the 100 simple moving average (red, 4-hour), and the 200 simple moving average (green, 4-hour). Finally, the pair broke the 151.80 level.
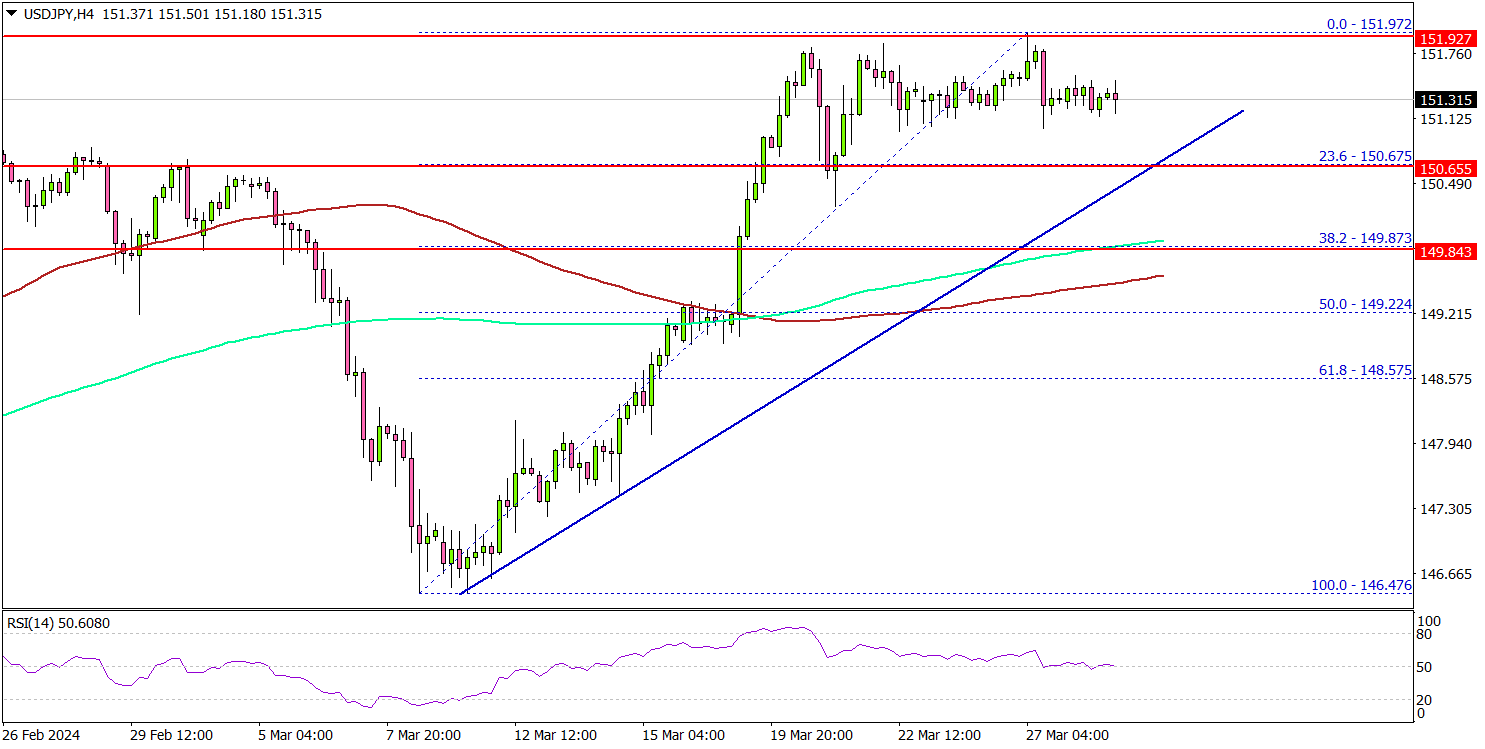
A high was formed at 151.97 and the pair is now consolidating gains. On the upside, the pair could face resistance near the 151.50 level. The first major resistance is now forming near 151.80. The main resistance is now forming near 152.00.
A close above the 152.00 zone could open the doors for more upsides. The next stop for the bulls might be 153.20. If not, the pair might continue to decline. Immediate support is near the 151.00 level.
The next major support is at 150.50. There is also a major bullish trend line forming with support at 150.60 on the same chart. If there is a downside break below the 150.50 support, the pair could decline toward the 150.00 support. Any more losses might send the pair toward the 148.40 level in the near term.
Looking at Oil, the bulls are active above the $82.50 resistance level and they might soon aim for more upsides toward the $85 level.
Economic Releases
- US Personal Income for Feb 2024 (MoM) - Forecast +0.4%, versus +1% previous.
Currency Pairs To Trade In April
Hello again my friends, it’s time for another episode of “What to Trade,” this time, for the month of April. As usual, I present to you some of my most anticipated trade ideas for the month of April, according to my technical analysis style. I therefore encourage you to do your due diligence, as always, and manage your risks appropriately.
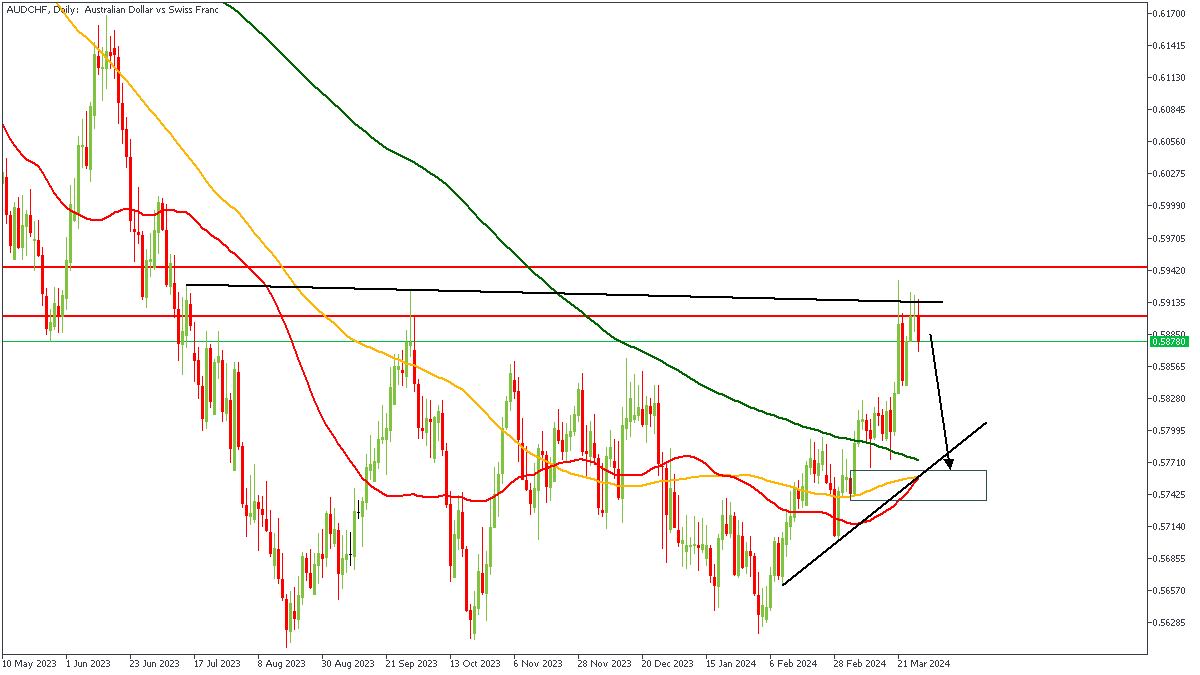
AUDCHF - D1 Timeframe
AUDCHF as seen in the daily timeframe chart above, has just bounced off the pivot zone, with a likely retest having been completed as well. Considering the bearish array of the moving averages and the supply zone within the pivot region, I am inclined to tilt my sentiment in favour of the bears in this case.
Analyst’s Expectations:
- Direction: Bearish
- Target: 0.57683
- Invalidation: 0.59481
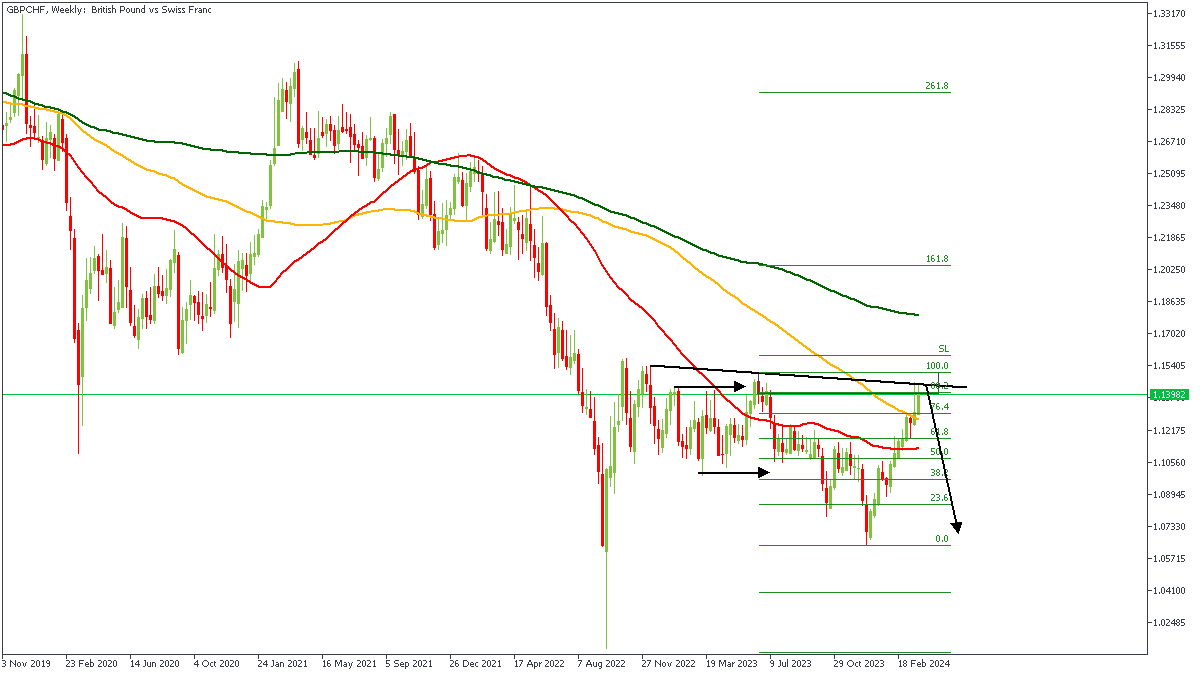
GBPCHF - W1 Timeframe
GBPCHF on the weekly timeframe seems to have printed a solid QMR pattern. We’ve seen an area of accumulation (bounded by the two horizontal arrows), as well as the distribution and now I believe the correction of the distribution is at its end. The confluences for this trade are; the bearish array of the moving averages, the 88% of the Fibonacci retracement level, trendline resistance, the QMR pattern, as well as the rally-base-drop supply zone.
Analyst’s Expectations:
- Direction: Bearish
- Target: 1.09891
- Invalidation: 1.15292
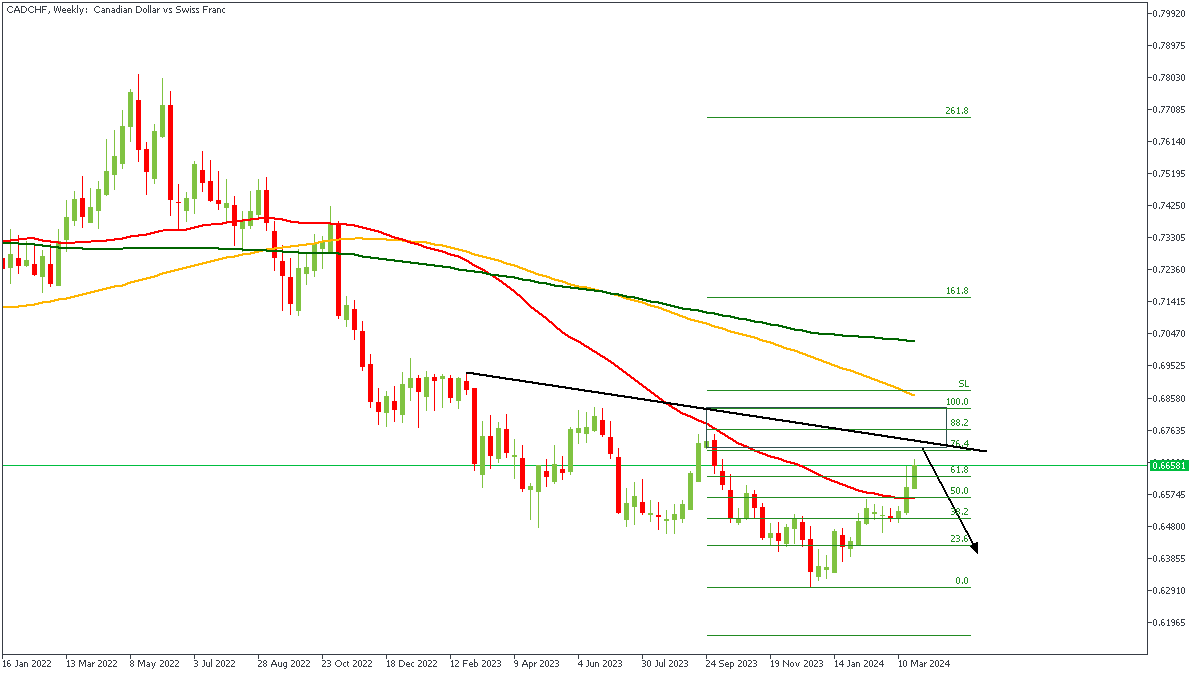
CADCHF - W1 Timeframe
The prevalent trend on CADCHF is quite clearly bearish. We can as well see the confluence of the trendline resistance and the rally-base-drop supply zone. The Fibonacci retracement level and the bearish array of the moving averages provide additional confirmation of a bearish sentiment.
Analyst’s Expectations:
- Direction: Bearish
- Target: 0.65454
- Invalidation: 0.68378
CONCLUSION
The trading of CFDs comes at a risk. Thus, to succeed, you have to manage risks properly. To avoid costly mistakes while you look to trade these opportunities, be sure to do your due diligence and manage your risk appropriately.
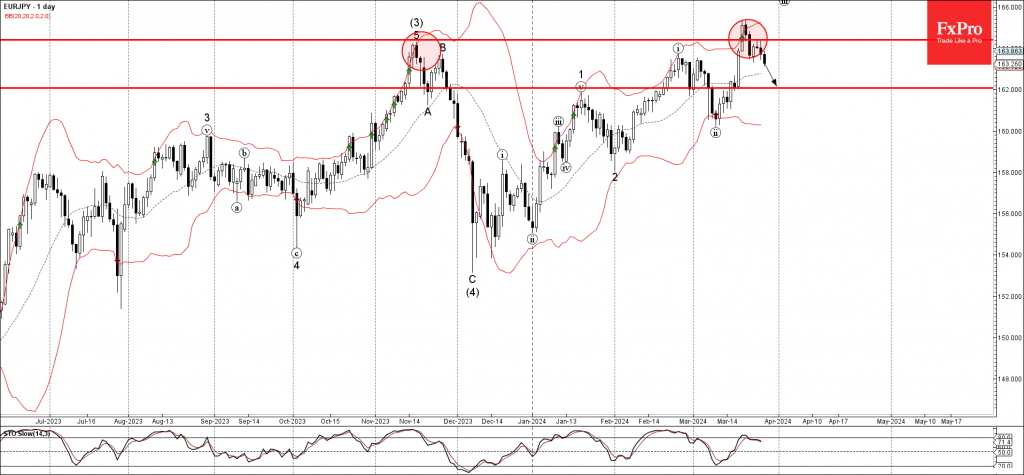
EURJPY Wave Analysis
- EURJPY reversed from key resistance level 164.40
- Likely to fall to support level 162.00
EURJPY currency pair recently reversed down after the price failed to hold the ground above the key resistance level 164.40 (which stopped the sharp uptrend in last November), standing close to the upper daily Bollinger Band.
The downward reversal from the resistance level 164.40 created the daily Japanese candlesticks reversal pattern Evening Star Doji.
Given the strength of the resistance level 164.40 and the bullish yen sentiment, EURJPY currency pair can be expected to fall further to the next support level 162.00.
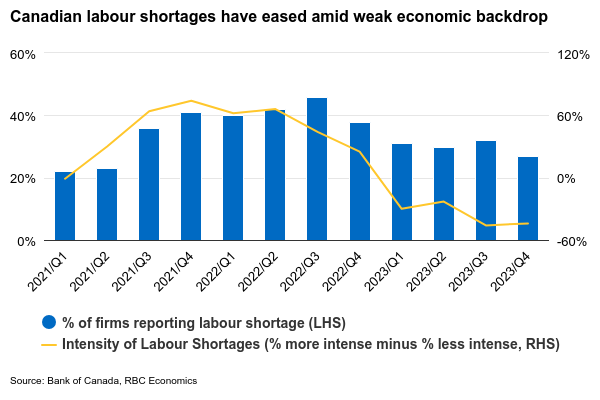
Canada’s Unemployment Rate Will Continue to Tick Higher Despite Job Gains
Next Friday’s employment data is expected to show job growth remained in positive territory (+25,000 from February), but again it will not be enough to keep up with surging growth in labour supply. Therefore, we forecast another tick higher in the unemployment rate to 5.9% from 5.8%—further above the 5% in January 2023.
So far, a large share of the unemployment rate increase has come from longer job search times for new job seekers (largely new graduates) rather than layoffs. But hiring demand has continued to slow—job openings are tracking 25% below year-ago levels. A spike higher in business insolvencies in early 2024 is also a reminder that there are still downside risks to the economic growth outlook. Wage growth, as measured by the monthly labour force survey, has remained resilient, but ticked down to 5% year-over-year in February. Other measures of wage growth have been lower. Average hourly earnings measured from separate surveys of business payrolls have been running about 2 percentage points below those levels by our count.
The Bank of Canada will be watching the March employment numbers, along with their own business and consumer surveys for further signs on how much the economic backdrop is deteriorating.
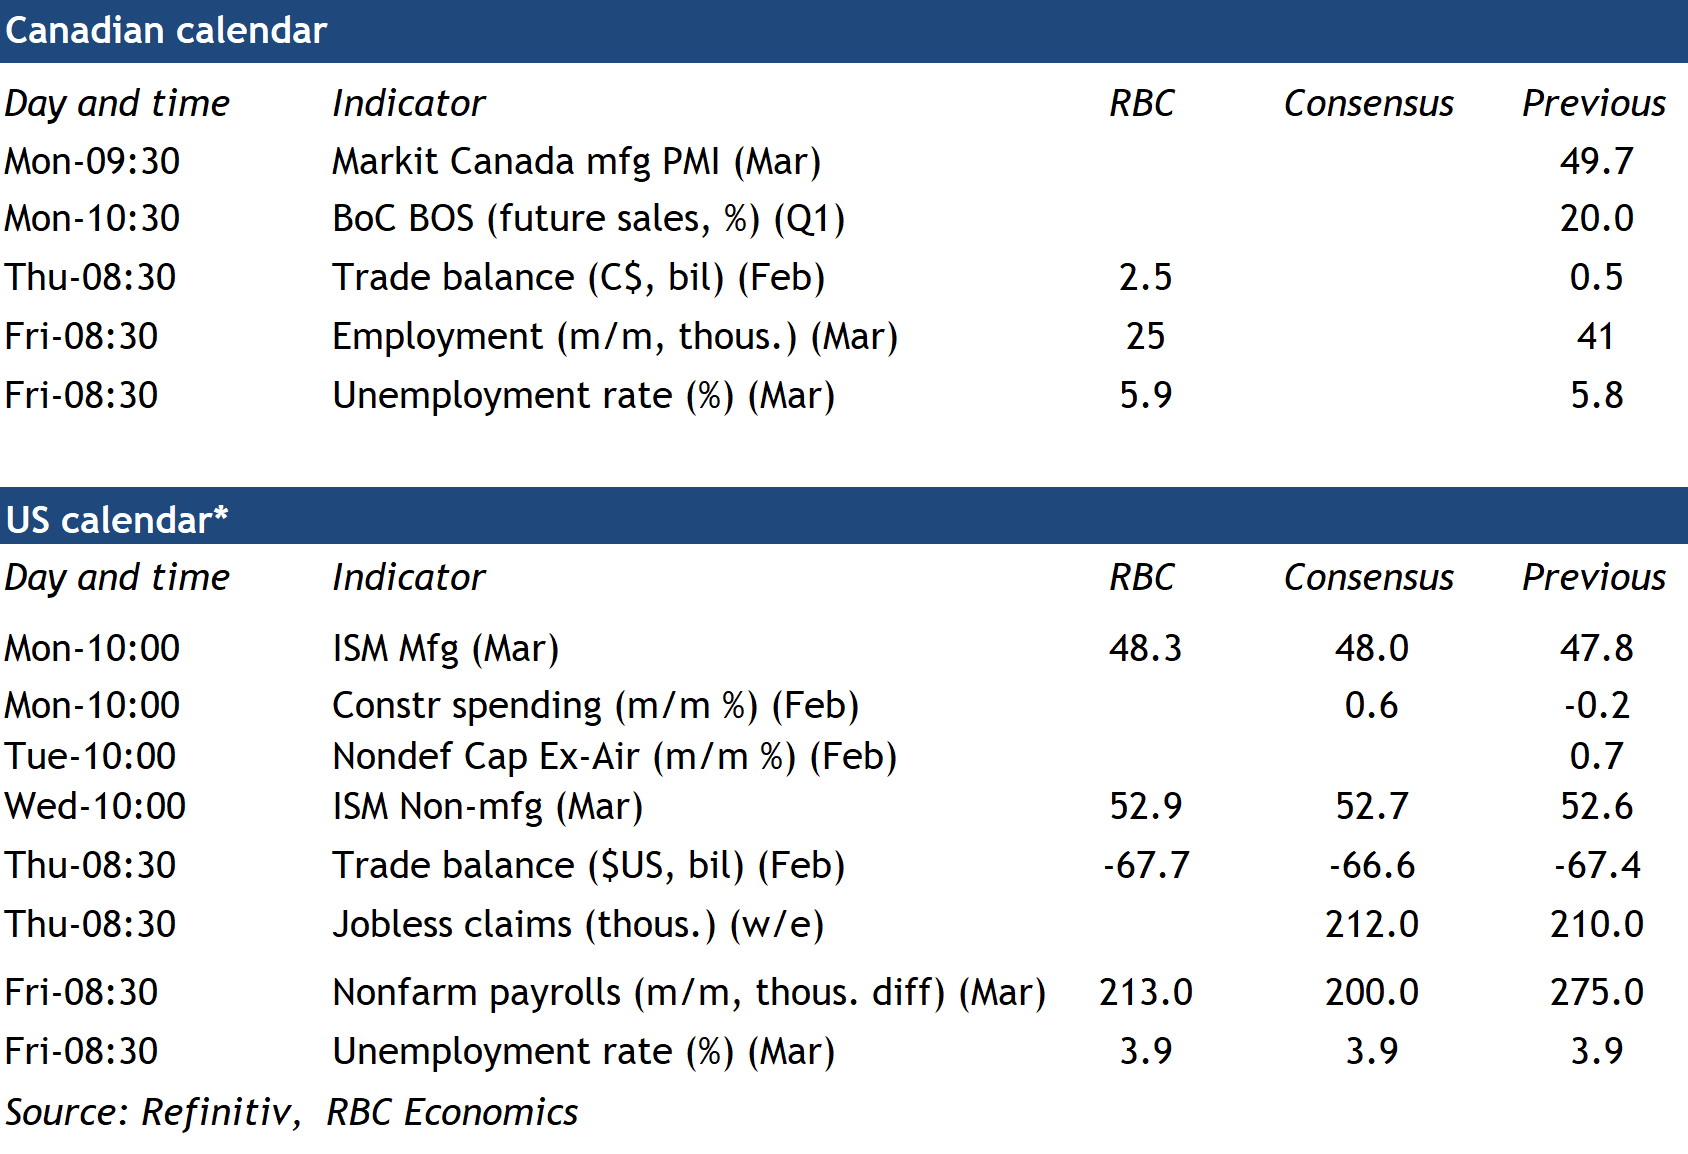
The focus for BoC’s Q1 Businesses Outlook Survey on Monday will again be centered on corporate price-setting behaviours and businesses’ wage and inflation expectations. In previous surveys, Canadian businesses have been reporting further “normalizing” in their pricing practices with smaller and less frequent price increases planned for the coming year. That trend should continue as input cost pressures keep easing broadly, and the consumer demand backdrop continues to deteriorate. Other key themes we expect from the survey include slower expectations for wage growth and inflation over the next year—in line with our and the BoC’s outlook for price pressures to keep receding. Depending on that outlook, we expect the BoC to start moving the overnight rate lower in June.
Week ahead data watch
Next Friday’s U.S. employment data is expected to show persistent strength in the labour market. Payroll employment is likely to post another large gain in March, following an average rate of 265,000 increase over the previous three months. The unemployment rate is expected to hold steady at 3.9% after having risen from 3.7% in January.
BTCUSD Advances Towards All-Time Highs
- BTCUSD pauses pullback and rotates higher
- Conquers 70,000 but encounters strong resistance
- Momentum indicators are tilted to the upside
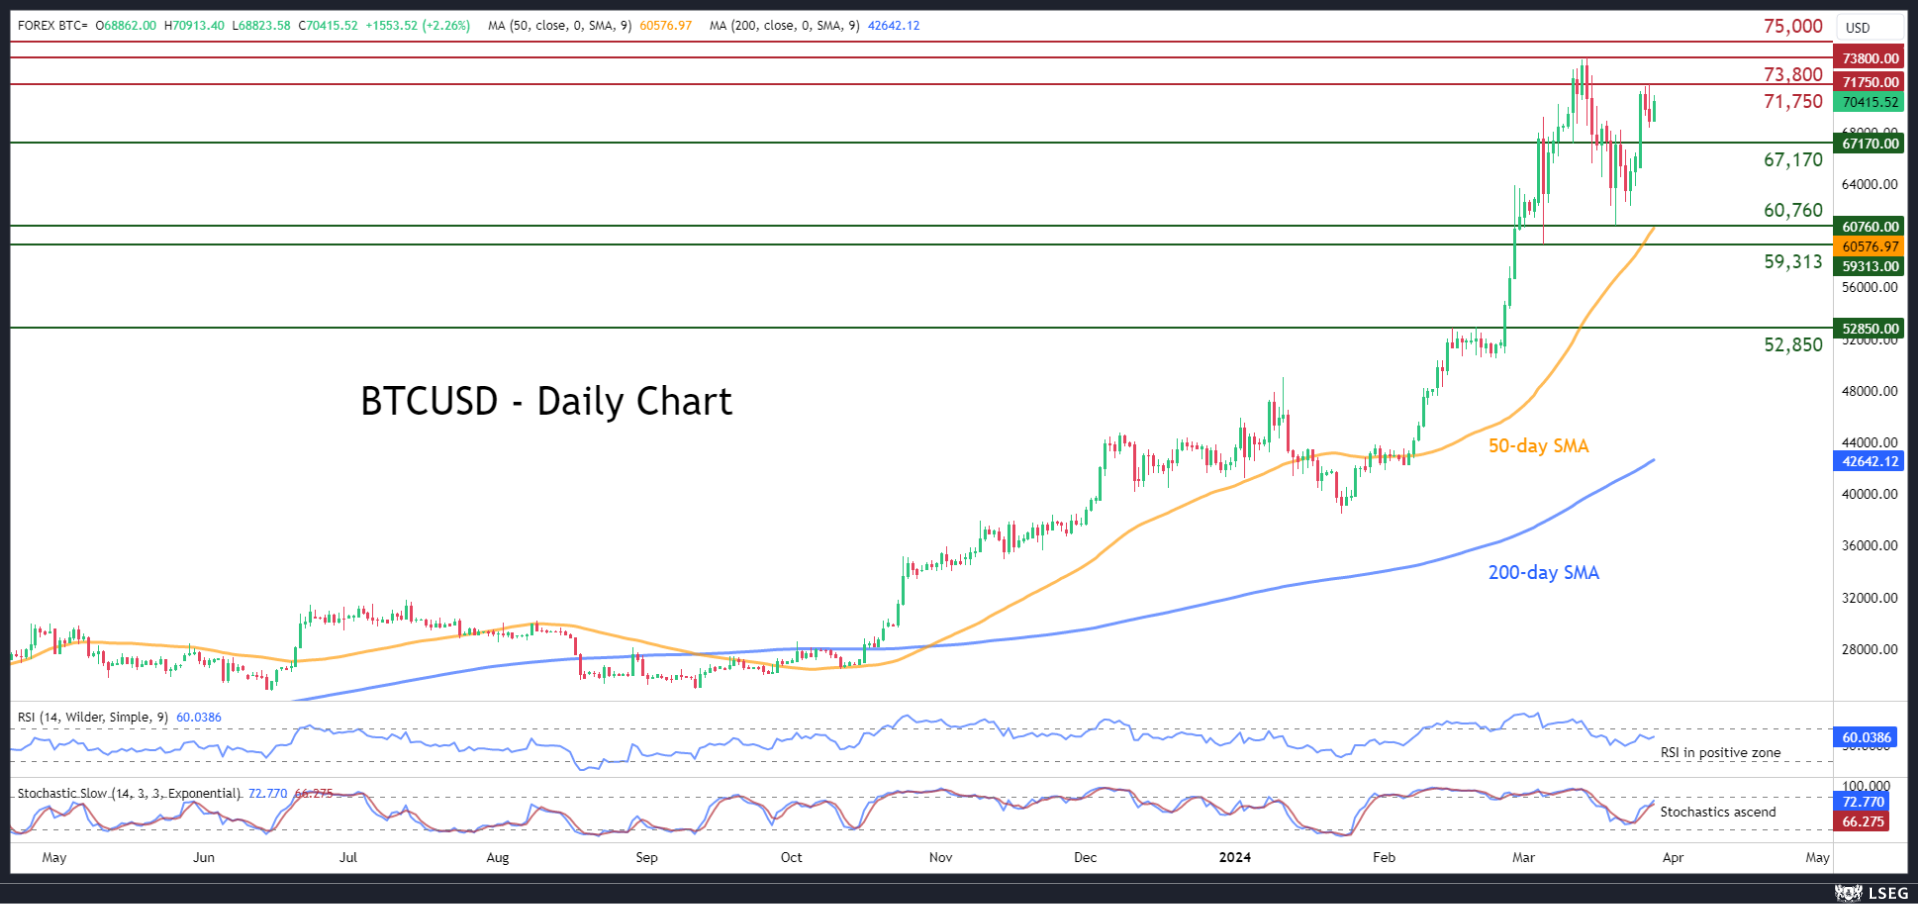
BTCUSD (Bitcoin) had been undergoing a strong pullback from its all-time highs, dropping to as low as 60,760 last week. However, the price quickly recovered significant ground, surpassing the 70,000 psychological mark and to trade within breathing distance from its all-time highs.
If bullish pressures persist, the recent resistance region of 71,750 could repel initial upside attempts. A break above that region could pave the way for the all-time peak of 73,800. Breaking above that zone, the price could enter uncharted waters, where the 75,000 round number might prove to be the next hurdle.
On the flipside, bearish actions could send the price lower towards the inside swing low of 67,170. Further declines could then cease at the recent deflection point of 60,760, which lies very close to the 50-day simple moving average (SMA). Even lower, the March bottom of 59,313 may act as the next line of defence.
In brief, BTCUSD seems to be in recovery mode despite encountering strong resistance in the last couple of sessions. Therefore, a break above the 71,750 barrier could bring the record high of 73,800 under scrutiny.
Bitcoin Doesn’t Fit the Downtrend Now
Market picture
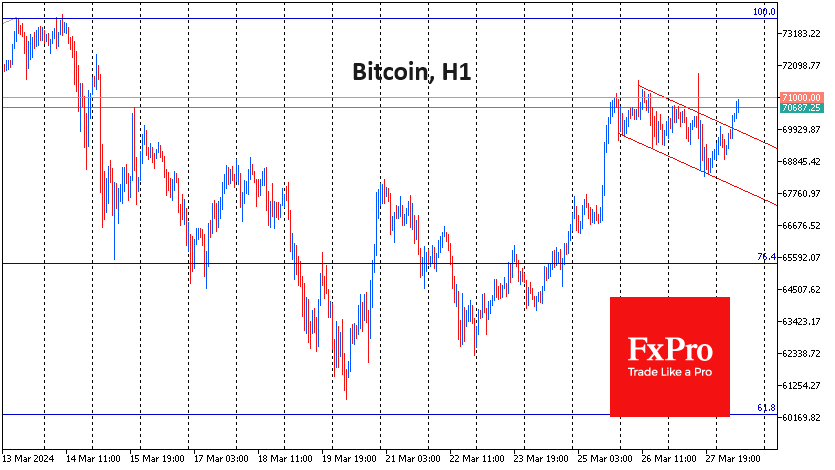
The crypto market capitalisation rose 1.4% in 24 hours to $2.66 trillion. Buyers stepped in the night before when Bitcoin touched $68.5K and pushed the price up to $70.7K at the start of active trading in Europe.
Bitcoin was rocked on Wednesday, first pushing the price above $71.8K and then dropping to $68.5K. This plunge initially confirmed the short-term downtrend, only to be broken a few hours later with the re-take of previous local highs.
For the bulls in Bitcoin, the short-term focus is on the ability to break above $71K. Traders with a slightly longer-term horizon may prefer to wait for the first cryptocurrency’s momentum to approach previous highs, where selling may intensify again.
News background
According to CryptoQuant, the Bitcoin supply crisis has already begun. Time is running out before demand for BTC exceeds supply.
A New York district court refused to recognise US crypto exchange Coinbase as a broker but found that the platform was involved in the offer and sale of unregistered securities.
According to Nansen, the outflow of funds from the KuCoin crypto exchange in the last 24 hours totalled around $800 million against the backdrop of new allegations by the US Department of Justice. According to media reports, KuCoin has been exploring the possibility of selling the business in 2023.
KuCoin is unlikely to repeat the fate of the collapsed FTX, according to CryptoQuant. Speculation about the possible bankruptcy of the exchange – amid legal problems and a partial outflow of retail funds – has no fundamental background.
Binance has joined the Global Travel Rule alliance. The trading platform has agreed to help combat financial crime, such as cross-border money laundering and terrorist financing.
MicroStrategy shares hit an all-time high. MicroStrategy’s market capitalisation has nearly tripled since the beginning of the year. Interest in the stock is being fuelled by the rally in the crypto market and the execution of the company’s bitcoin strategy.
Ethereum co-founder Vitalik Buterin admitted that the SHIB meme tokens, which he donated to charity, had risen in value against his predictions.
Sunset Market Commentary
Markets
“There’s still no rush”, Fed governor Waller’s sequel to February’s “What’s the rush”, resonated through Asian and early European dealings. The Fed’s minority leader wants to see at least a couple of months of additional evidence that inflation is sustainably descending to the 2% inflation target. The very low (CPI) comparison bases in March & May (0.1% M/M) and June & July (0.2% M/M) 2023 rather suggest a return of CPI inflation to 4% Y/Y instead of 2%. The minority block is building (9 out of 19) and will in our view get sufficient momentum to push a first 25 bps rate to September at the earliest. Apart from the hawkish wing, we don’t think that Fed Chair Powell will push through such pivotal decision earlier given the knife-edge split. US Treasuries underperform German Bunds with US yields currently 2.9 bps (2-yr) higher to flat (30-yr). The US 2-yr yield (yesterday) bounced off the downside of this year’s upward trend channel. Intraday gains had been somewhat larger, but we’ve seen some return action as the final US session of the quarter and ahead of the long Easter weekend got going. Both US eco data and rising oil prices (Brent crude $87/b) provided input for additional selling pressure but that thus didn’t materialize. Weekly jobless claims again stabilized (210k from 212k) at historically low levels while the final revision of US Q4 GDP printed at 3.4% Q/Qa from 3.2% thanks to a bump in personal consumption (3.3% Q/Qa from 3%). German Bund yields add 0.6 bps (30-yr) to 2 bps (2-yr) even as Bank of Italy governor Panetta joined his fellow countryman ECB (GC) Cippollone with some dovish comments. Portuguese and Belgian March inflation data didn’t change the market needle with German, French and Italian numbers up for release tomorrow and next week Tuesday and the overall EMU number next week Wednesday. The other thing to look forward to are Minutes of the March ECB policy meeting (Thursday).
The dollar initially profited with EUR/USD dipping below support around 1.08 to set an intraday low at 1.0775 (lowest since mid-February). As US Treasuries recovered, so did the FX pair which currently changes hands around 1.0810. Looking to the US side of the calendar, we have ADP employment, payrolls and ISM’s on tap next week. Fed Chair Powell seems to put his eggs in the basket of a weakening US labour market to warrant a faster rate cut (than suggested by the Waller camp). There are no signs of that to happen soon, suggesting that decent numbers could extend a more hawkish market repositioning.
News & Views
Belgian inflation rose by 0.5% M/M and 3.18% Y/Y (from 0.71% M/M and 3.2 % Y/Y in February). In a monthly perspective, the most significant price increases were registered for fruit (8.8%), natural gas (10.3%), the maintenance and repair of vehicles (1.5%), chocolate and confectionery (4.3%), clothes (1.1%), travels abroad (1.9%) and holiday villages (5.5%). Alcoholic beverages (-3.1%) and vegetables (-1.9%) had a decreasing effect on the index. In Y/Y terms, services inflation slightly increased to 5.04% from 4.92%. Inflation for rents decreased to 5.62% from 5.72%. Food inflation (including alcoholic beverages) now stands at 3.21% compared to 4.65% last month. Core inflation (excl. energy products and unprocessed food), decreased for the 10th month in a row and now stands at 3.85% Y/Y, compared to 4.25% last month and 4.70% in February.
The Swiss KOF economic barometer fell slightly in March, from 102 to 101.5. After recording repeated increases since mid-2023, the barometer now stabilizes above its long-term average. The outlook for the Swiss economy remains positive. The decline was primarily due to the construction sector. Indicators for the finance and insurance sector are sending slightly positive signals. In the goods producing sector (manufacturing and construction), indicators for the assessment of employment prospects and for order backlogs decline. At the same there was a strong positive signal from bundles covering intermediate goods. Within manufacturing, the textile industry, the metal industry and the wood, glass, stone and earth sector are mainly responsible for its positive development. By contrast, indicators for the vehicle and mechanical engineering are sending a slightly negative signal. After feeling selling pressure post last week’ SNB rate cut, the Swiss Franc today show signs of stabilization. EUR/CHF eased from the 0.9820 area yesterday to 0.977 currently.
GBP Consolidates Amid Concerns Over Economic Growth and Wage Trends
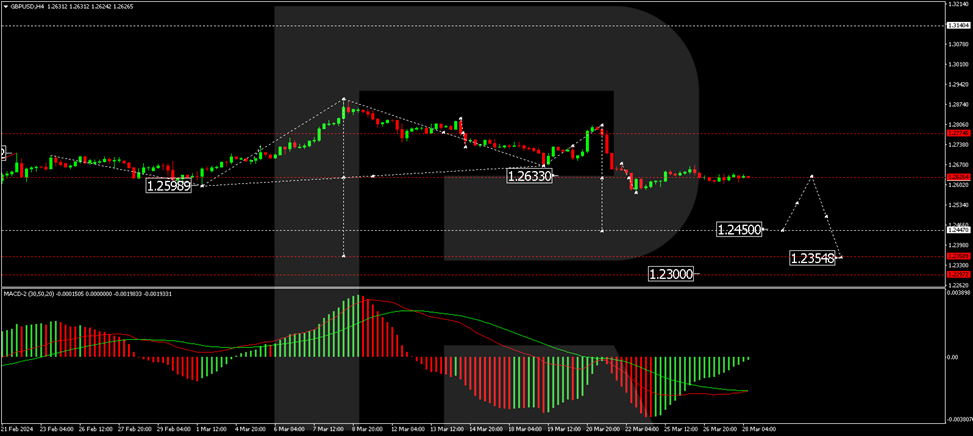
The GBP/USD pair is currently consolidating, hovering around the 1.2631 mark. This consolidation phase follows recent reports highlighting a slowdown in the expansion plans of British businesses for workforce and wage growth, raising concerns about future economic dynamics and inflationary pressures.
A key report from the Lloyds Bank Business Barometer indicates a noticeable dip in the hiring outlook among companies. The differential between firms looking to hire and those planning cuts fell to 27% from a peak of 36% in February. This level is only slightly above the long-term average of 22%. Moreover, there has also been a marginal decline in the proportion of businesses anticipating wage increases in the next year.
Despite these trends, Bank of England (BoE) data provides a somewhat optimistic outlook, showing that British borrowers manage the high-interest environment relatively well. The incidence of problematic debt remains significantly lower than levels seen following the 2008 financial crisis, underscoring the resilience of the UK's economic system and indicating signs of GDP recovery.
Catherine Mann, a member of the BoE's Monetary Policy Committee, has called for a more realistic assessment of monetary policy expectations, suggesting that market predictions for substantial interest rate cuts by the BoE might be overly optimistic. Current market sentiment suggests a high probability of a rate reduction at the BoE's August meeting.
Technical analysis of GBP/USD
The H4 chart analysis for GBP/USD shows ongoing consolidation around 1.2626. A breakout above this range could signal a potential corrective rise to 1.2700. Conversely, a move below this level may indicate a downward trend towards 1.2450 as an initial target. A potential correction to 1.2626 could follow, with a possible further decline to 1.2355. The MACD oscillator's position below zero supports the possibility of continued downward movement.
On the H1 chart, the pair is forming a consolidation range around 1.2626, with no definitive trend. An upward breakout might lead to a corrective move towards 1.2676, while a downward breakout could signal the continuation of a decline to 1.2545 and potentially to 1.2450. The Stochastic oscillator, currently below 80 and trending downwards, aligns with the likelihood of a continued decline.
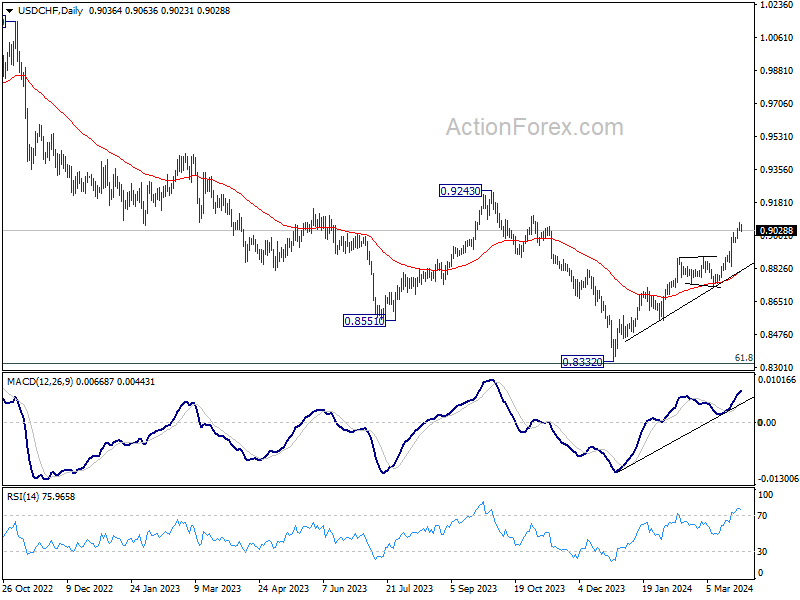
USD/CHF Mid-Day Outlook
Daily Pivots: (S1) 0.9019; (P) 0.9046; (R1) 0.9064; More....
Intraday bias in USD/CHF is turned neutral with current retreat and some consolidations could be seen. But further rally is expected as long as 0.8964 support holds. Firm break of 0.9070 will resume larger rise from 0.8332 towards 0.9243 key resistance next.
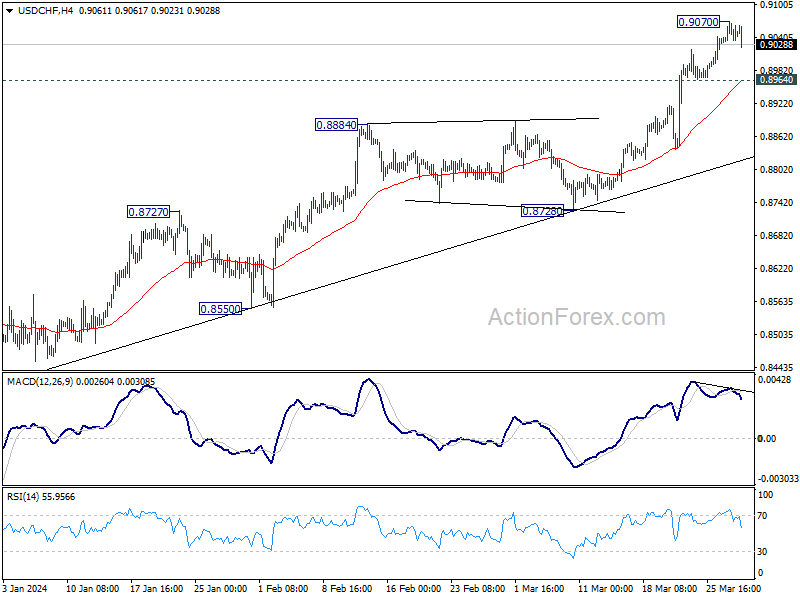
In the bigger picture, price actions from 0.8332 medium term bottom as tentatively seen as developing into a corrective pattern to the down trend from 1.0146 (2022 high). Further rise would be seen as long as 0.8728 support holds. But upside should be limited by 0.9243 resistance, at least on first attempt.