
Sample Category Title
EUR/CHF Daily Outlook
Daily Pivots: (S1) 0.9656; (P) 0.9672; (R1) 0.9703; More..
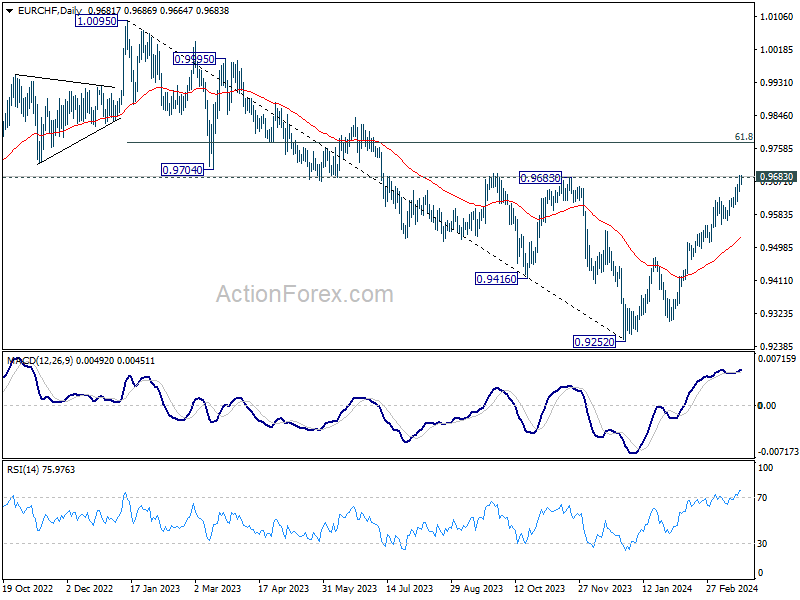
Intraday bias in EUR/CHF stays on the upside with focus on 0.9683 resistance. Sustained break there will carry larger bullish implication and target 0.9773 fibonacci resistance. On the downside, though, break of 0.9618 support will indicate short term topping. In this case, intraday bias will be back on the downside for 55 D EMA (now at 0.9527).
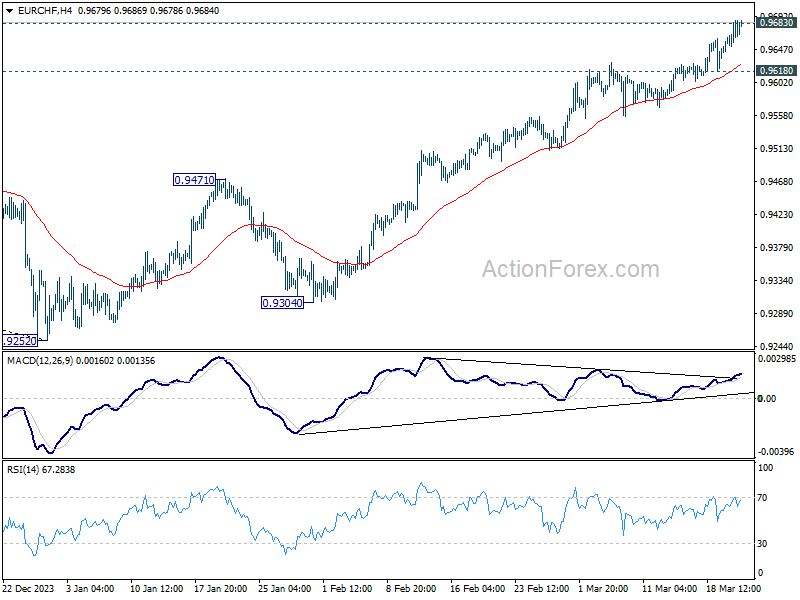
In the bigger picture, as long as 0.9683 resistance holds, rebound from 0.9252 are seen as a corrective move only. Larger down trend is expected to resume through 0.9252 after the correction completes. However, firm break of 0.9683 and sustained trading above 55 W EMA (now at 0.9620) will argue that 0.9252 is already a medium term bottom. Stronger rise would then be seen 61.8% retracement of 1.0095 to 0.9252 at 0.9773 and above.
EUR/USD Daily Outlook
Daily Pivots: (S1) 1.0864; (P) 1.0894; (R1) 1.0951; More...
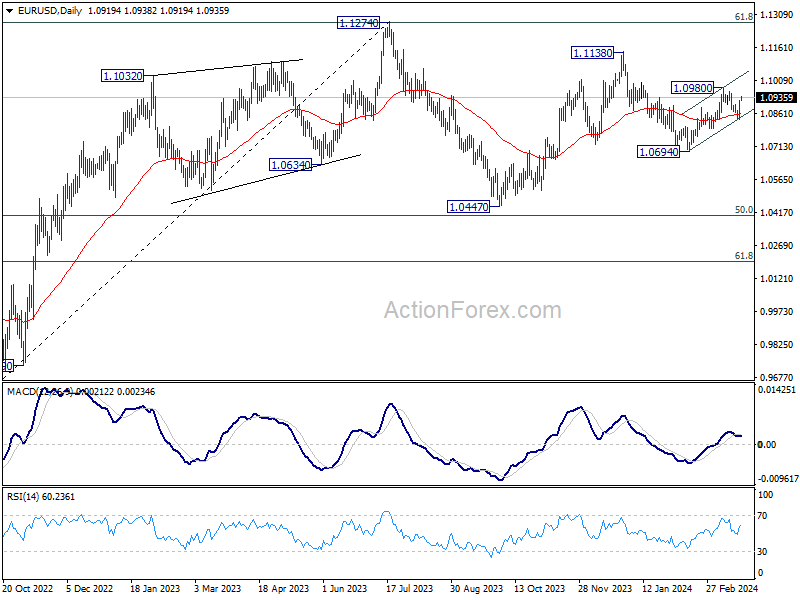
EUR/USD's strong rebound and break of 1.0905 resistance suggests that pull back from 1.0980 has completed at 1.0834, after drawing support from 55 D EMA. Intraday bias is back on the upside for retesting 1.0980 first. Firm break there will resume whole rise from 1.0694. On the downside, sustained trading below 55 D EMA (now at 1.0861) will argue that rebound from 1.0694 has completed and bring retest of this low.
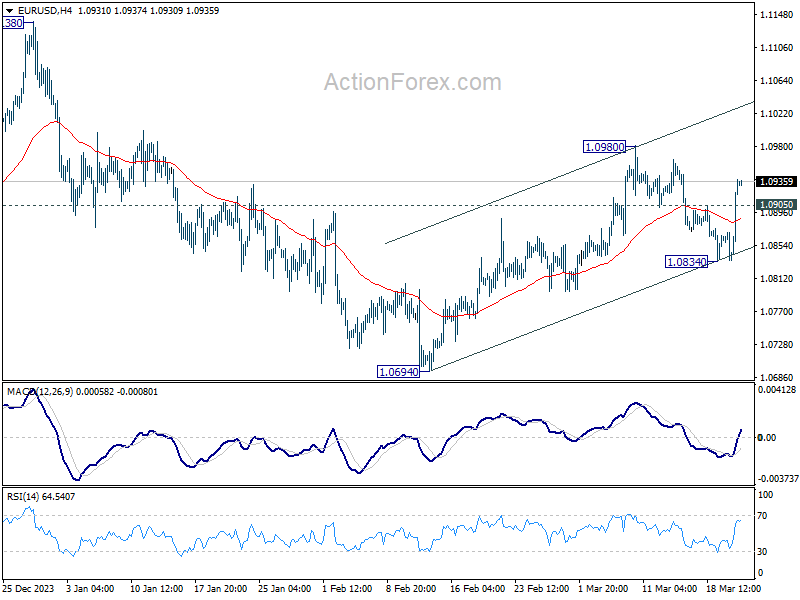
In the bigger picture, price actions from 1.1274 are viewed as a corrective pattern to rise from 0.9534 (2022 low). Rise from 1.0447 is seen as the second leg. While further rally could cannot be ruled out, upside should be limited by 1.1274 to bring the third leg of the pattern. Meanwhile, sustained break of 1.0694 support will argue that the third leg has already started for 1.0447 and possibly below.
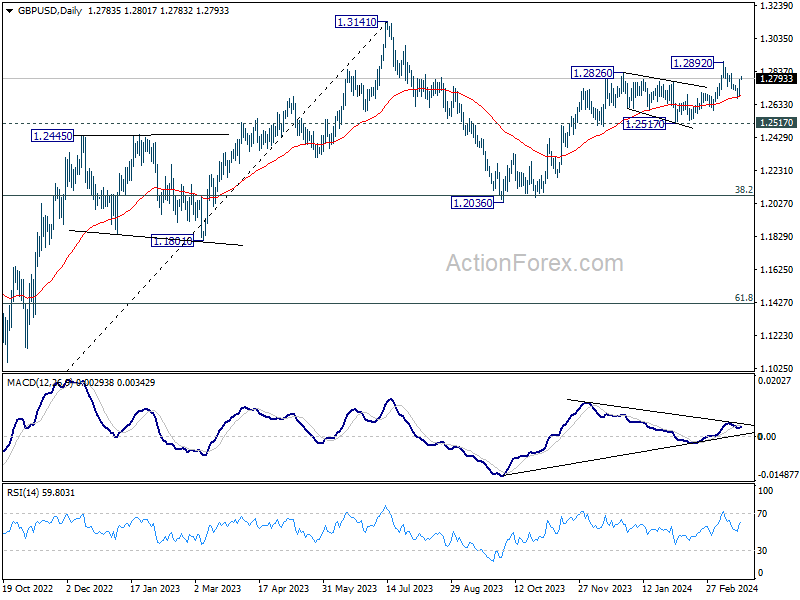
GBP/USD Daily Outlook
Daily Pivots: (S1) 1.2718; (P) 1.2753; (R1) 1.2820; More...
GBP/USD's rebound from 1.2666 extended higher but stays below 1.2822. Intraday bias remains neutral first. On the downside, break of 1.2666 support and sustained break of 55 D EMA (now at 1.2685) will target 1.2517 structural support next. However, break of 1.2822 will bring further rally to retest 1.2892 instead.
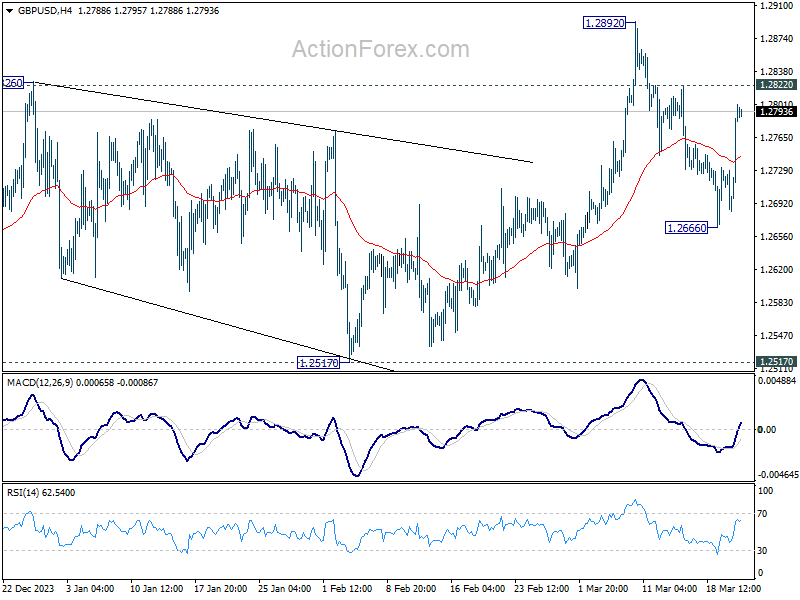
In the bigger picture, price actions from 1.3141 medium term top are seen as a corrective pattern to up trend from 1.0351 (2022 low). Rise from 1.2036 is seen as the second leg, which is still in progress. But upside should be limited by 1.3141 to bring the third leg of the pattern. Meanwhile, break of 1.2517 support will argue that the third leg has already started for 38.2% retracement of 1.0351 (2022 low) to 1.3141 at 1.2075 again.
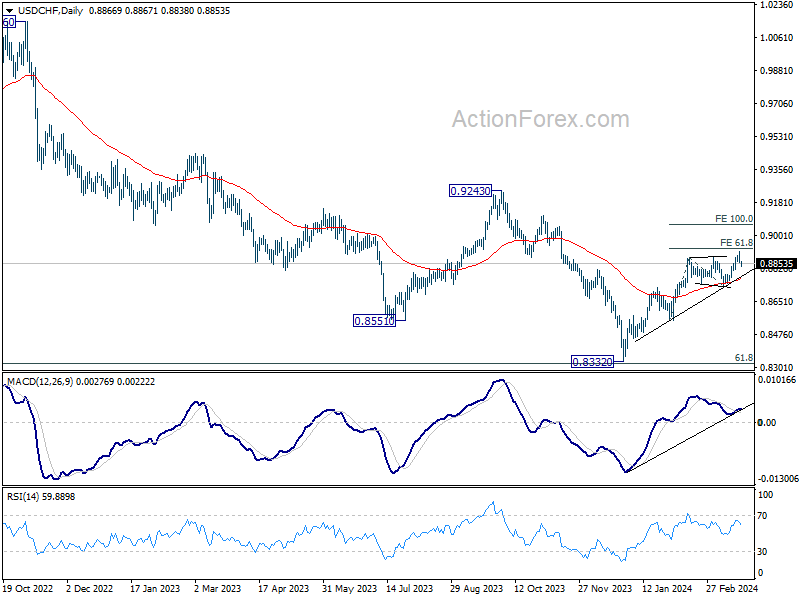
USD/CHF Daily Outlook
Daily Pivots: (S1) 0.8846; (P) 0.8882; (R1) 0.8905; More....
Intraday bias in USD/CHF is turned neutral first with current retreat. Some consolidations would be seen, but further rally is expected as long as 0.8728 support holds. On the upside, above 0.8917 will target 61.8% projection of 0.8550 to 0.8884 from 0.8728 at 0.8934. Firm break there will target 100% projection at 0.9062 next.
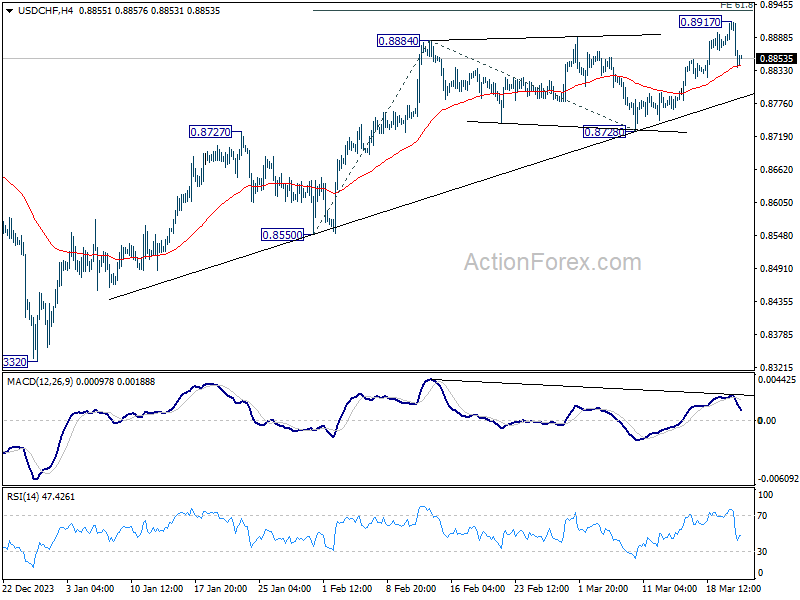
In the bigger picture, price actions from 0.8332 medium term bottom as seen as developing into a corrective pattern to the down trend from 1.0146 (2022 high). Further rise would be seen as long as 0.8555 support holds. But upside should be limited by 0.9243 resistance, at least on first attempt.
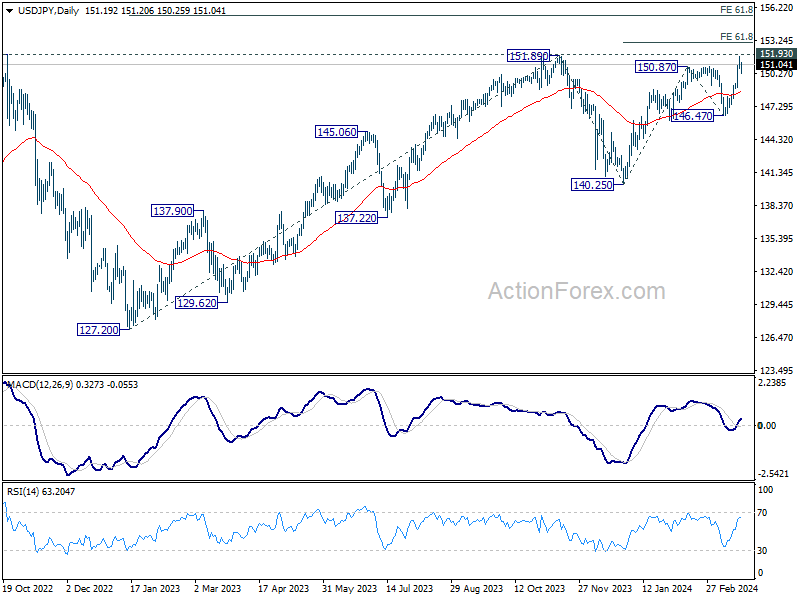
USD/JPY Daily Outlook
Daily Pivots: (S1) 150.71; (P) 151.26; (R1) 151.80; More...
Intraday bias in USD/JPY is turned neutral with current retreat, and some consolidations would be seen below 151.82. Further rise is expected as long as 55 4H EMA (now at 149.51) holds. On the upside, decisive break of 151.93 key resistance will confirm long term up trend resumption. Next near term target will be 61.8% projection of 140.25 to 150.87 from 146.47 at 153.03. However, sustained trading below 55 4H EMA will bring deeper fall back to 146.47 support instead.
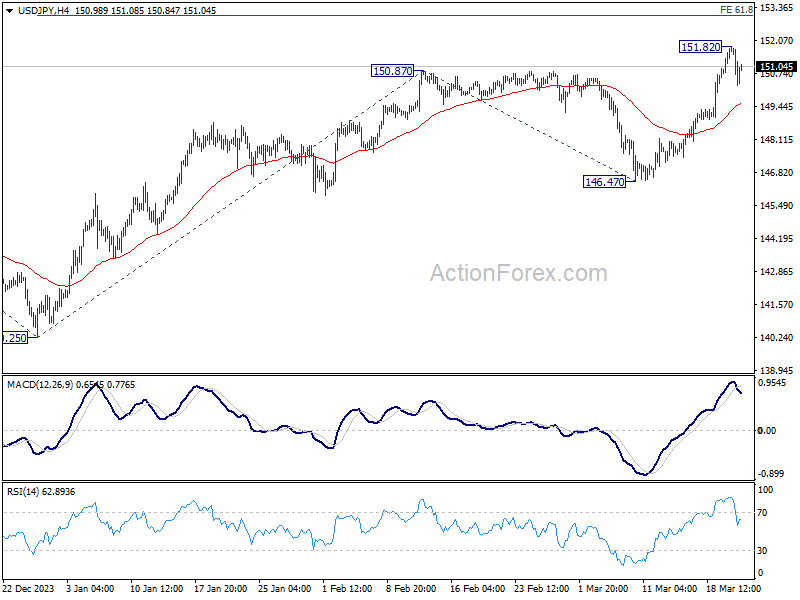
In the bigger picture, correction from 151.87 (2023) high could have completed at 140.25 already. Rise from 127.20 (2023 low), as part of the long term up trend, is probably ready to resume. Decisive break of 151.93 resistance (2022 high) will confirm this bullish case. Next medium term target will be 61.8% projection of 127.20 to 151.89 from 140.25 at 155.20. This will remain the favored case as long as 146.47 support holds, in case of another pullback.
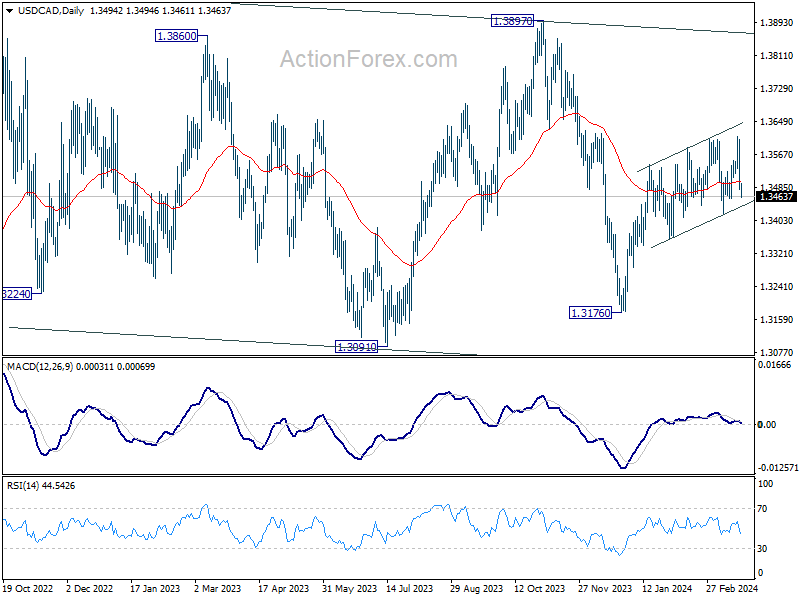
USD/CAD Daily Outlook
Daily Pivots: (S1) 1.3448; (P) 1.3527; (R1) 1.3572; More...
USD/CAD reversed after edging higher to 1.3612, but stays above 1.3419 support. Intraday bias remains neutral first. On the downside, firm break of 1.3419 support will argue that rebound from 1.3176 has completed. Near term outlook will be turned bearish for 1.3357 support first. On the upside, though, above 1.3612 will resume the rebound from 1.3176 instead.
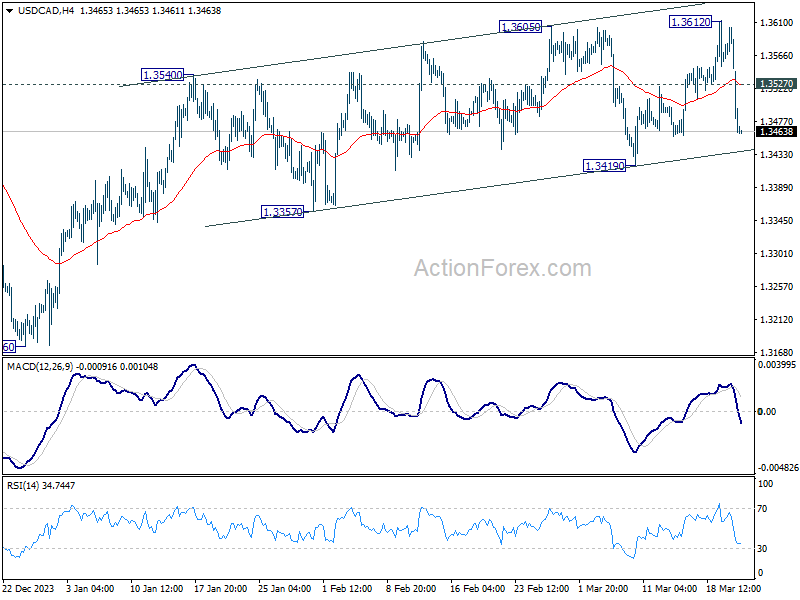
In the bigger picture, price actions from 1.3976 (2022 high) are viewed as a corrective pattern only. In case of another fall, strong support should emerge above 1.2947 resistance turned support to bring rebound. Overall, larger up trend from 1.2005 (2021 low) is still expected to resume through 1.3976 at a later stage.
AUD/USD Daily Report
Daily Pivots: (S1) 0.6537; (P) 0.6562; (R1) 0.6612; More...
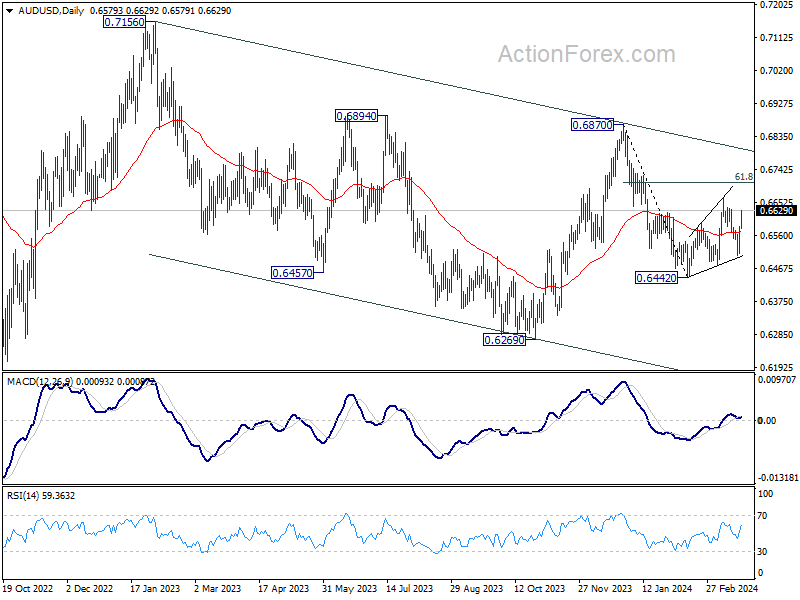
AUD/USD's strong rebound suggests that fall from 0.6666 has completed at 0.6503 already. But upside is kept below this resistance for now and intraday bias stays neutral. On the upside, break of 0.6666 will resume the rise from 0.6442 to 61.8% retracement of 0.6870 to 0.64420 at 0.6707. On the downside, break of 0.6503 will argue that fall from 0.6870 is ready to resume through 0.6442 low.
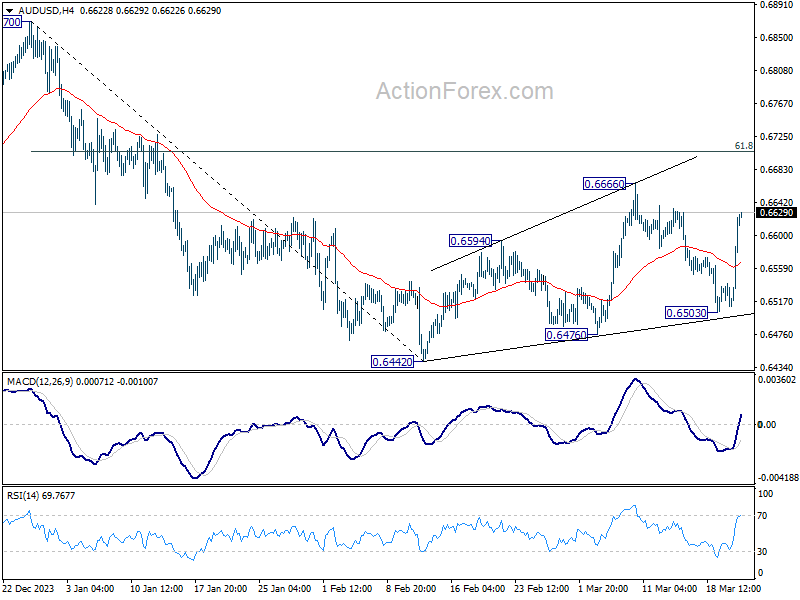
In the bigger picture, price actions from 0.6169 (2022 low) are seen as a medium term corrective pattern to the down trend from 0.8006 (2021 high). Fall from 0.7156 (2023 high) is seen as the second leg, which might still be in progress. Overall, sideway trading could continue in range of 0.6169/7156 for some more time. But as long as 0.7156 holds, an eventual downside breakout would be mildly in favor.
Dollar Wanes as Fed Sticks to Three Cuts Projection; Aussie Jumps; BoE and SNB Next
Dollar took a nosedive overnight as investors were apparently relieved that Fed is still on track to cut interest rates three times this year. The odds for a June cut as indicated by fed fund futures also jumped back to above 70%. The positive sentiment shoot major US stocks indexes to new record highs. The greenback's weakness persisted into Asian session, and it could continue face more downside pressure ahead.
In contrast, Australian Dollar staged a robust recovery, buoyed by exceptionally strong employment data. Additionally latest PMI figures Indicate both economic revival and heightened price pressures. These developments cast doubts on the likelihood of RBA cutting rates in the near future. Indeed, the possibility for another hike doesn't vanish, reaffirming RBA's "not ruling anything in or out" stance.
The spotlight now shifts to BoE and SNB as the week's central bank bonanza continues. No change in interest rate is expected from BoE, and the main focus is on voting. Last time, Jonathan Haskel and Catherine Mann voted for a hike while Swati Dhingra voted for a cut. Any hawkish or dovish tilt in the voting could trigger volatility in Pound.
Meanwhile, the Swiss Franc finds itself under pressure as the worst performer of the week at this point, partly due to speculation around an imminent SNB rate cut. Despite June being considered a more probable timeline for such a move, current market odds suggest a 30% chance of a cut taking place today. Additionally, SNB's stance on currency intervention, given recent vocal concerns from Swiss businesses about the economic impact of a strong Franc, adds another layer of intrigue to their upcoming policy announcement.
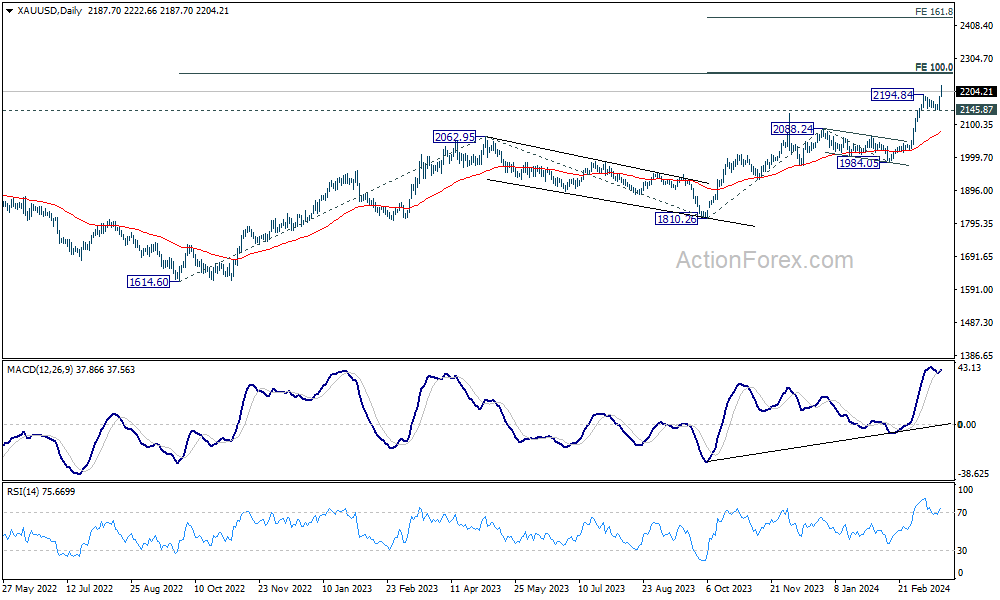
Technically, Gold's up trend resumed on the back of Dollar's selloff, and hits new record high above 2200 handle. Near term outlook will remain bullish as long as 2145.87 support holds, next target is cluster projection level at 2260 (100% projection of 1810.26 to 2088.24 from 1984.05 at 2262.03 and 100% projection of 1614.60 to 2062.95 from 1810.26 at 2259.15). Strong resistance could be seen there to limit upside, at least on first attempt, on overbought condition.
However, decisive break of this level will pave the way to (161.8% projection of 1810.26 to 2088.24 from 1984.05 at 2262.03 at 2433.82. If this bullish scenario realizes, that could mean Dollar's sell-off is also generally intensifying.
In Asia, at the time of writing, Nikkei is up 1.95% after hitting new record high. Hong Kong HSI is up 2.33%. China Shanghai SSe is up 0.06%. Singapore Strait Times is up 1.51%. Japan 10-year JGB yield is up 0.0127 at 0.744. Overnight, DOW rose 1.03%. S&P 500 rose 0.89%. NASDAQ rose 1.25%. 10-year yield fell -0.024 to 4.273.
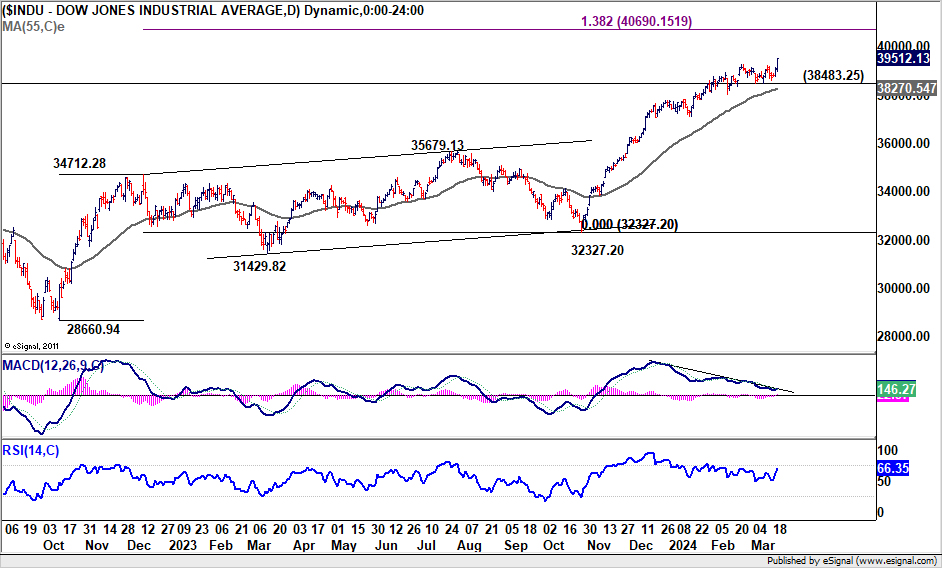
DOW hits new record as Fed holds course on three cuts, despite hawkish undertones
US stocks surged sharply higher overnight, with DOW and S&P 500 closing at new record highs. Market participants expressed relief and optimism as Fed's maintained forecast of three rate cuts for the year. Fed Chair Jerome Powell's remarks during the press conference further buoyed investor sentiment, emphasizing that the recent inflation data "haven't really changed the overall story". He affirmed that inflation is "moving down gradually", albeit via a "somewhat bumpy road."
Despite positive reactions from the stock markets, it's crucial to acknowledge that Fed's has shifted to a slightly more hawkish tone, in particular compared to December meeting. The updated dot plot revealed a narrower margin, with nine out of nineteen members now anticipating just two rate cuts for the year. Moreover, future easing path is envisioned to be more gradual than previously projected. Interest rate is expected to settle at 3.75-4.00% by the end of 2025—a slight increase from December's forecast of 3.50-3.75%. For the end of 2026, the projection was raised to 3.00-3.25%, up from the previous 2.75-3.00%.
Technically, DOW's up trend is now extending to 40k psychological level, and then 138.2% projection of 28660.94 to 34712.28 from 32327.20 at 40690.15. Outlook will stay bullish as long as 38483.25 support holds, in case of pullback.
BoJ's Ueda assures continued accommodative monetary stance following rate hike
Addressing the parliament today, BoJ Governor Kazuo Ueda articulated the rationale behind this week's exit from the long-standing negative interest rate policy and the subsequent rate hike. This move marks a significant shift for Japan's monetary policy, which had been entrenched in a negative interest rate environment for eight years.
Ueda pointed out, "We could have waited until inflation is completely at 2% for a long period of time. But if we did so, it's unclear whether inflation would have stayed at 2%. We might have seen a sharp increase in upside price risks," highlighting the preemptive nature of the BoJ's action.
The decision was influenced by recent trends in service prices and substantial wage increases resulting from annual wage negotiations, indicating a strengthening cycle of wage growth and inflation in Japan.
Despite this historical step, Ueda underscored that Japan's inflation expectations for the medium and long term are "still in the process of accelerating towards 2%". He assured that BoJ remains committed to supporting the economy and prices "by maintaining accommodative monetary conditions for the time being".
He also hinted at future adjustments, stating, "As we exit our massive stimulus program, we will gradually shrink the size of our balance sheet and at some point reduce the size of our government bond buying."
Japan's PMI composite rises to 52.3, strengthening activity and intensifying price pressures
Japan's PMI Manufacturing saw a modest increase from 47.2 to 48.2 in March, while PMI Services surged to from 52.9 to 54.9, its highest level since last May. Composite PMI, which combines both sectors, also climbed from 50.6 to 52.3, reaching its peak since last August.
Usamah Bhatti, Economist at S&P Global Market Intelligence, underscored the private sector's regained momentum at the end of Q1. The expansion was predominantly driven by service providers, while manufacturers experienced a continued, though less severe, contraction.
Alongside this economic revival, Japan is facing a "renewed intensification of price pressures," with the rate of input price inflation hitting a five-month high. This uptick was particularly pronounced among service providers, although manufacturers also reported "stubbornly high input prices". Many firms opted to pass these increased costs onto customers, leading to the highest output charge inflation since last August.
Australia employment surges 116.5k, unemployment rate dives to 3.7%
Australia employment grew strongly by 116.5k in February, well above expectation of 40.2k. Full-time jobs rose 78.2k while part-time jobs rose 38.3k.
Unemployment rate fell sharply from 4.1% to 3.7%, below expectation of 4.0%. Participation rate rose 0.1% to 66.7%. Monthly hours worked also rose 2.8% mom.
Australia PMI composite rises to 11-month, another blow to RBA rate cut expectations
Australia PMI Manufacturing PMI dropped to a 46-month low of 46.8. Conversely, PMI Services climbed to an 11-month peak of 53.5, with the Composite PMI also reaching an 11-month high at 52.4.
Warren Hogan, Chief Economic Advisor at Judo Bank, highlighted that Composite Output Index's increase for the fourth consecutive month signifies the economy's rebound from the cyclical slowdown experienced in 2023. Meanwhile However, inflation remains a concern, with service sector readings indicating persistently high producer and consumer prices.
Hogan noted that the results are "another blow to rate-cut expectations" for RBA. The rebound in economic activity, coupled with inflation exceeding targets, not only diminishes the likelihood of rate reductions, but also raises the possibility of further monetary tightening in 2024. This aligns with recent warnings from RBA.
New Zealand in technical recession as Q4 GDP contracts -0.1% qoq
New Zealand's economy has officially entered technical recession, with GDP contracting by -0.1% qoq in Q4, below expectation of 0.0% qoq. This decline follows -0.3% contraction in Q4, marking two consecutive quarters of negative growth.
GDP per capita declined decline of -0.7% qoq, while real gross national disposable income saw a -1.4% qoq drop.
The contraction was not uniformly felt across all sectors. Of the sixteen industries analyzed, eight experienced growth, notably the rental, hiring, and real estate services sector, alongside public administration, safety, and defense.
Looking ahead
SNB and BoE rate decisions are the main events in European session. Eurozone will release PMI s while ECB will publish monthly economic bulletin. UK will also release PMIs.
Later in the day, US will release jobless claims, Philly Fed surve, PMIs and existing home sales.
AUD/USD Daily Report
Daily Pivots: (S1) 0.6537; (P) 0.6562; (R1) 0.6612; More...
AUD/USD's strong rebound suggests that fall from 0.6666 has completed at 0.6503 already. But upside is kept below this resistance for now and intraday bias stays neutral. On the upside, break of 0.6666 will resume the rise from 0.6442 to 61.8% retracement of 0.6870 to 0.64420 at 0.6707. On the downside, break of 0.6503 will argue that fall from 0.6870 is ready to resume through 0.6442 low.
In the bigger picture, price actions from 0.6169 (2022 low) are seen as a medium term corrective pattern to the down trend from 0.8006 (2021 high). Fall from 0.7156 (2023 high) is seen as the second leg, which might still be in progress. Overall, sideway trading could continue in range of 0.6169/7156 for some more time. But as long as 0.7156 holds, an eventual downside breakout would be mildly in favor.
Economic Indicators Update
| GMT | Ccy | Events | Actual | Forecast | Previous | Revised |
|---|---|---|---|---|---|---|
| 21:45 | NZD | GDP Q/Q Q4 | -0.10% | 0.00% | -0.30% | |
| 22:00 | AUD | Manufacturing PMI Mar P | 46.8 | 47.8 | ||
| 22:00 | AUD | Services PMI Mar P | 53.5 | 53.1 | ||
| 23:50 | JPY | Trade Balance (JPY) Feb | -0.45T | -0.85T | 0.24T | 0.01T |
| 00:30 | JPY | Manufacturing PMI Mar P | 48.2 | 47.5 | 47.2 | |
| 00:30 | AUD | Employment Change Feb | 116.5K | 40.2K | 0.5K | 15.3K |
| 00:30 | AUD | Unemployment Rate Feb | 3.70% | 4.00% | 4.10% | |
| 07:00 | GBP | Public Sector Net Borrowing (GBP) Feb | 5.2B | -17.6B | ||
| 08:15 | EUR | France Manufacturing PMI Mar P | 47.3 | 47.1 | ||
| 08:15 | EUR | France Services PMI Mar P | 48.6 | 48.4 | ||
| 08:30 | EUR | Germany Manufacturing PMI Mar P | 43.5 | 42.5 | ||
| 08:30 | EUR | Germany Services PMI Mar P | 48.9 | 48.3 | ||
| 08:30 | CHF | SNB Interest Rate Decision | 1.75% | 1.75% | ||
| 09:00 | CHF | SNB Press Conference | ||||
| 09:00 | EUR | Eurozone Current Account (EUR) Jan | 32.3B | 31.9B | ||
| 09:00 | EUR | ECB Economic Bulletin | ||||
| 09:00 | EUR | Eurozone Manufacturing PMI Mar P | 47 | 46.5 | ||
| 09:00 | EUR | Eurozone Services PMI Mar P | 50.5 | 50.2 | ||
| 09:30 | GBP | Manufacturing PMI Mar P | 47.8 | 47.5 | ||
| 09:30 | GBP | Services PMI Mar P | 53.8 | 53.8 | ||
| 12:00 | GBP | BoE Interest Rate Decision | 5.25% | 5.25% | ||
| 12:00 | GBP | MPC Official Bank Rate Votes | 0--1--8 | 2--1--6 | ||
| 12:30 | CAD | New Housing Price Index M/M Feb | 0.10% | -0.10% | ||
| 12:30 | USD | Initial Jobless Claims (Mar 15) | 210K | 209K | ||
| 12:30 | USD | Philadelphia Fed Manufacturing Survey Mar | 0.2 | 5.2 | ||
| 12:30 | USD | Current Account (USD) Q4 | -209B | -200B | ||
| 13:45 | USD | Manufacturing PMI Mar P | 51.9 | 52.2 | ||
| 13:45 | USD | Services PMI Mar P | 52 | 52.3 | ||
| 14:00 | USD | Existing Home Sales Feb | 3.94M | 4.00M | ||
| 14:30 | USD | EIA Natural Gas Storage Change (Mar 15) | 5B | -9B |
Technical Outlook and Review
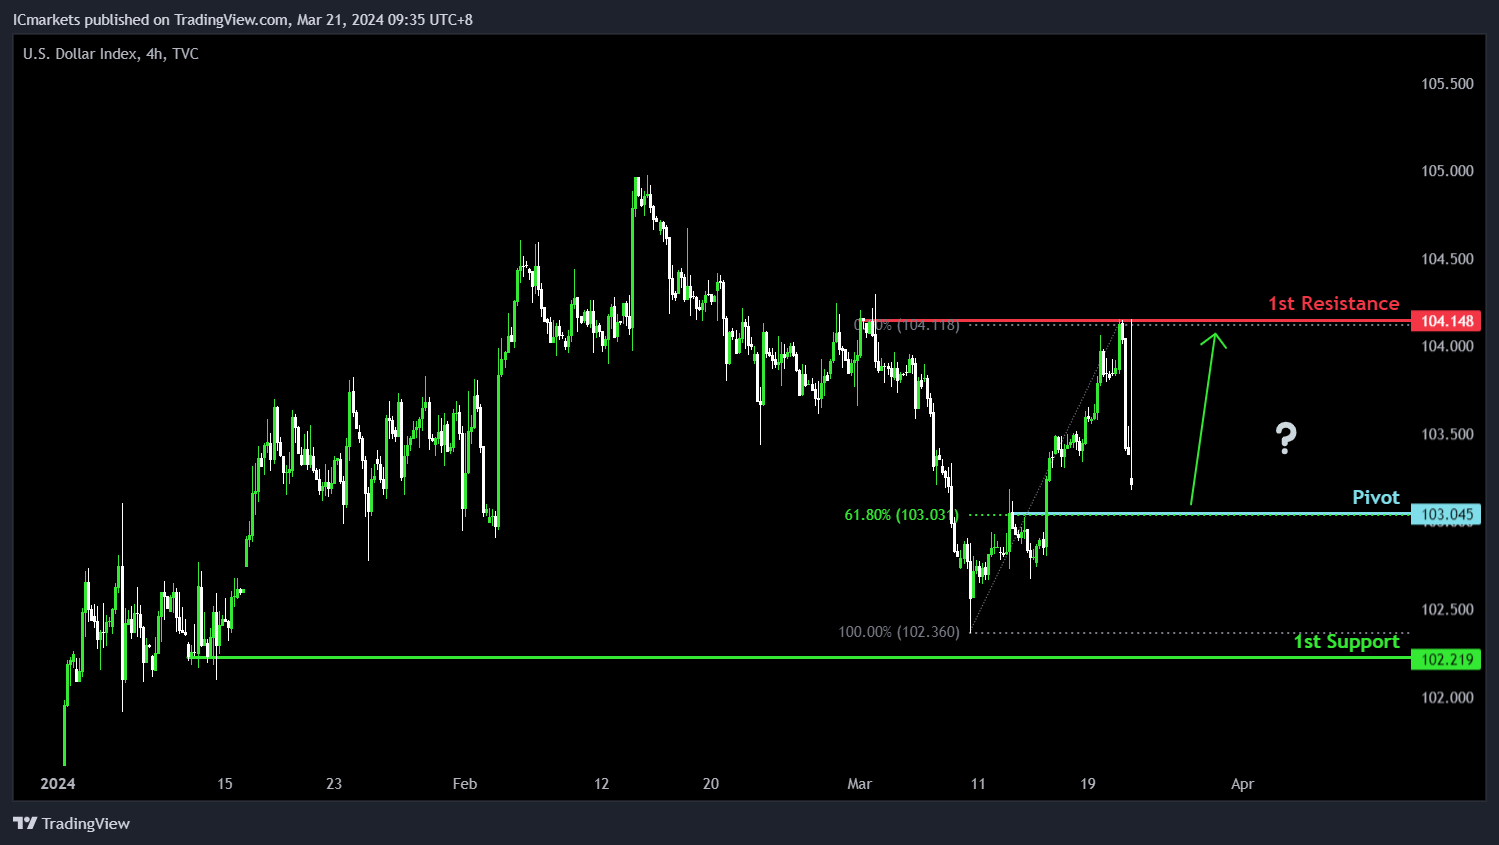
DXY:
For DXY, in alignment with the overall bullish momentum of the chart, there’s a potential scenario indicating a bullish bounce off the pivot level, possibly leading towards the 1st resistance.
The pivot at 103.04 serves as a significant pullback support, reinforced by the 61.80% Fibonacci Retracement, suggesting a level where buying interest may emerge, potentially driving the price higher.
Additionally, the 1st support at 102.21 acts as multi-swing low support, indicating historical significance as a level where buyers have intervened previously, further strengthening the bullish bias.
On the upside, the 1st resistance at 104.14 presents a barrier to further upward movement, supported by multi-swing high resistance.
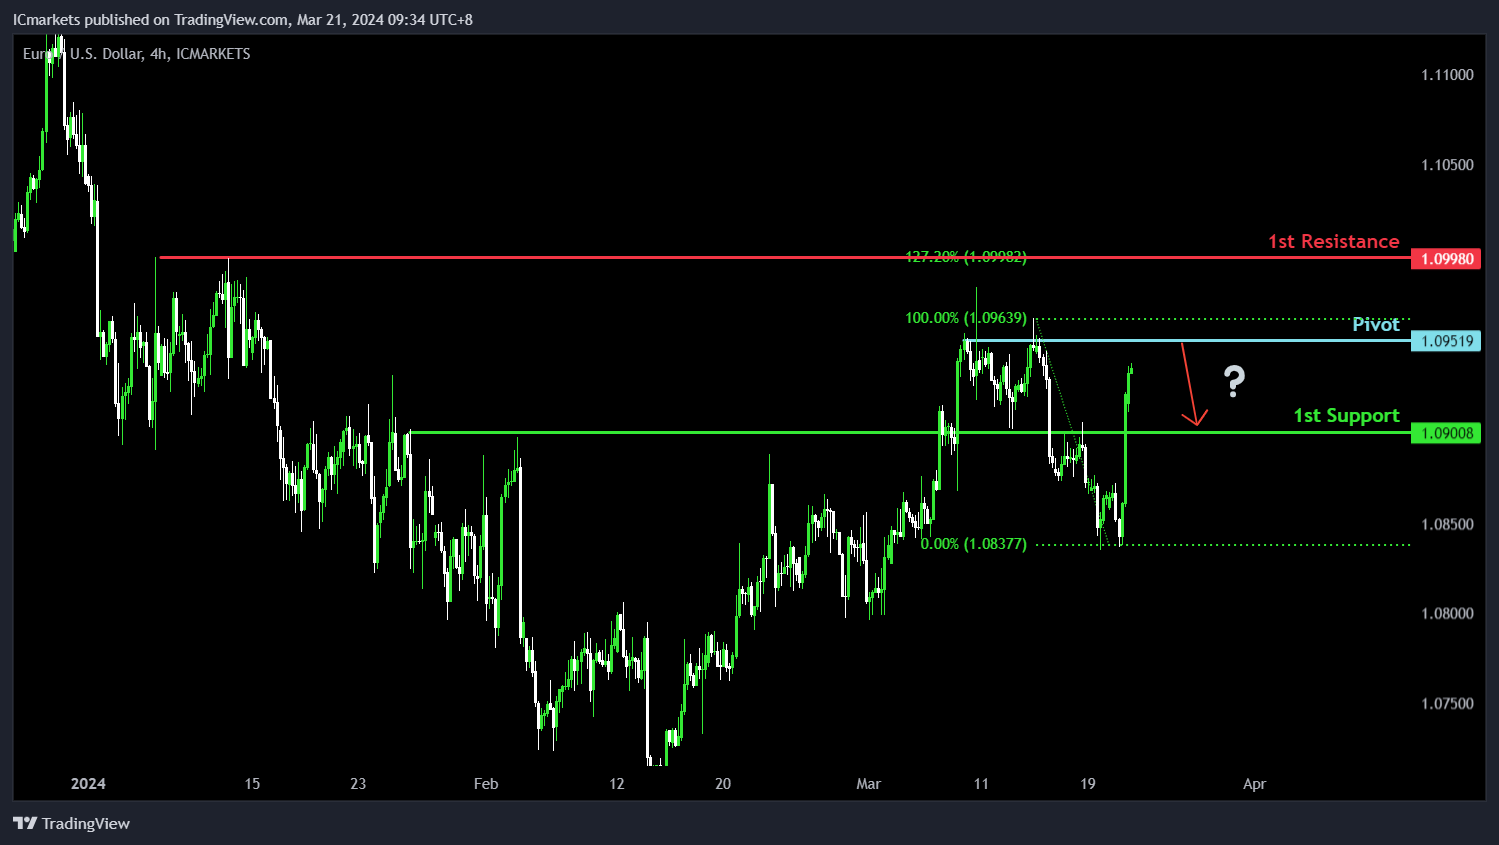
EUR/USD:
For EUR/USD, reflecting the prevailing bearish momentum, there’s a possibility of a bearish reaction from the pivot level, potentially leading to a decline towards the 1st support.
The pivot at 1.0951 indicates multi-swing high resistance, suggesting a significant level where selling pressure might intensify, potentially triggering a bearish move.
Supporting this view, the 1st support at 1.0900 serves as a pullback support, indicating a historical level where buying interest has emerged previously, potentially slowing down the downward momentum.
On the upside, the 1st resistance at 1.0998 forms multi-swing high resistance, reinforced by the 127.20% Fibonacci Extension, acting as a barrier to further upward movement.
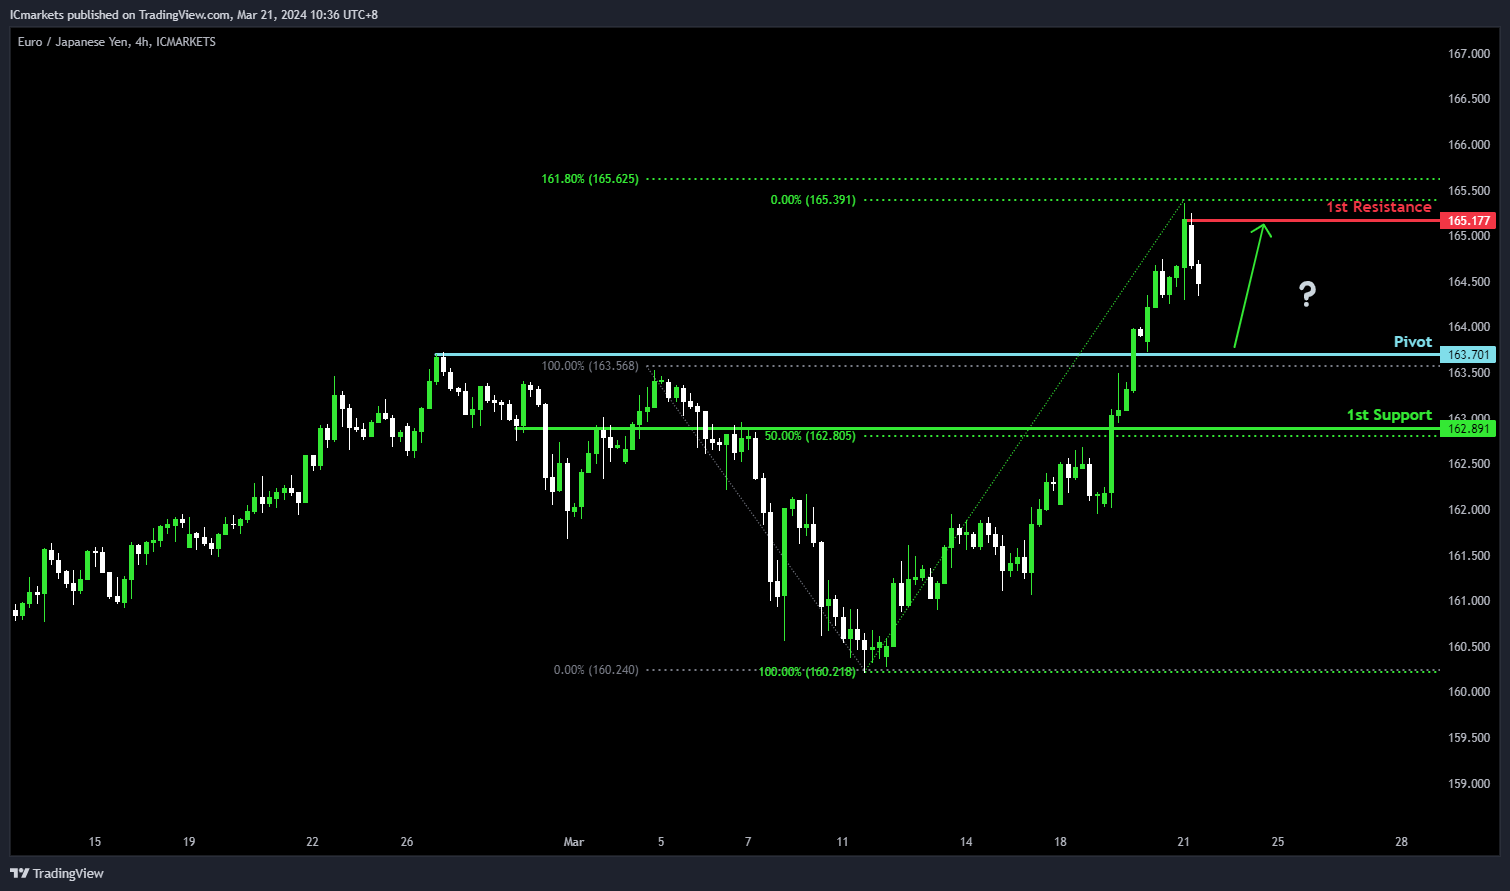
EUR/JPY:
For EUR/JPY, reflecting the prevailing bullish momentum, there’s a potential for a bullish bounce from the pivot level, indicating a move towards the 1st resistance.
The pivot at 163.70 serves as an overlap support, suggesting a significant level where buying interest may emerge, further bolstered by its historical significance.
Additionally, the 1st support at 162.89 acts as pullback support, coinciding with the 50% Fibonacci Retracement level, indicating a confluence of support factors that could attract buyers and potentially fuel upward movement.
Conversely, the 1st resistance at 165.17 forms a barrier to further upward movement, supported by swing high resistance, suggesting a level where selling pressure might intensify.
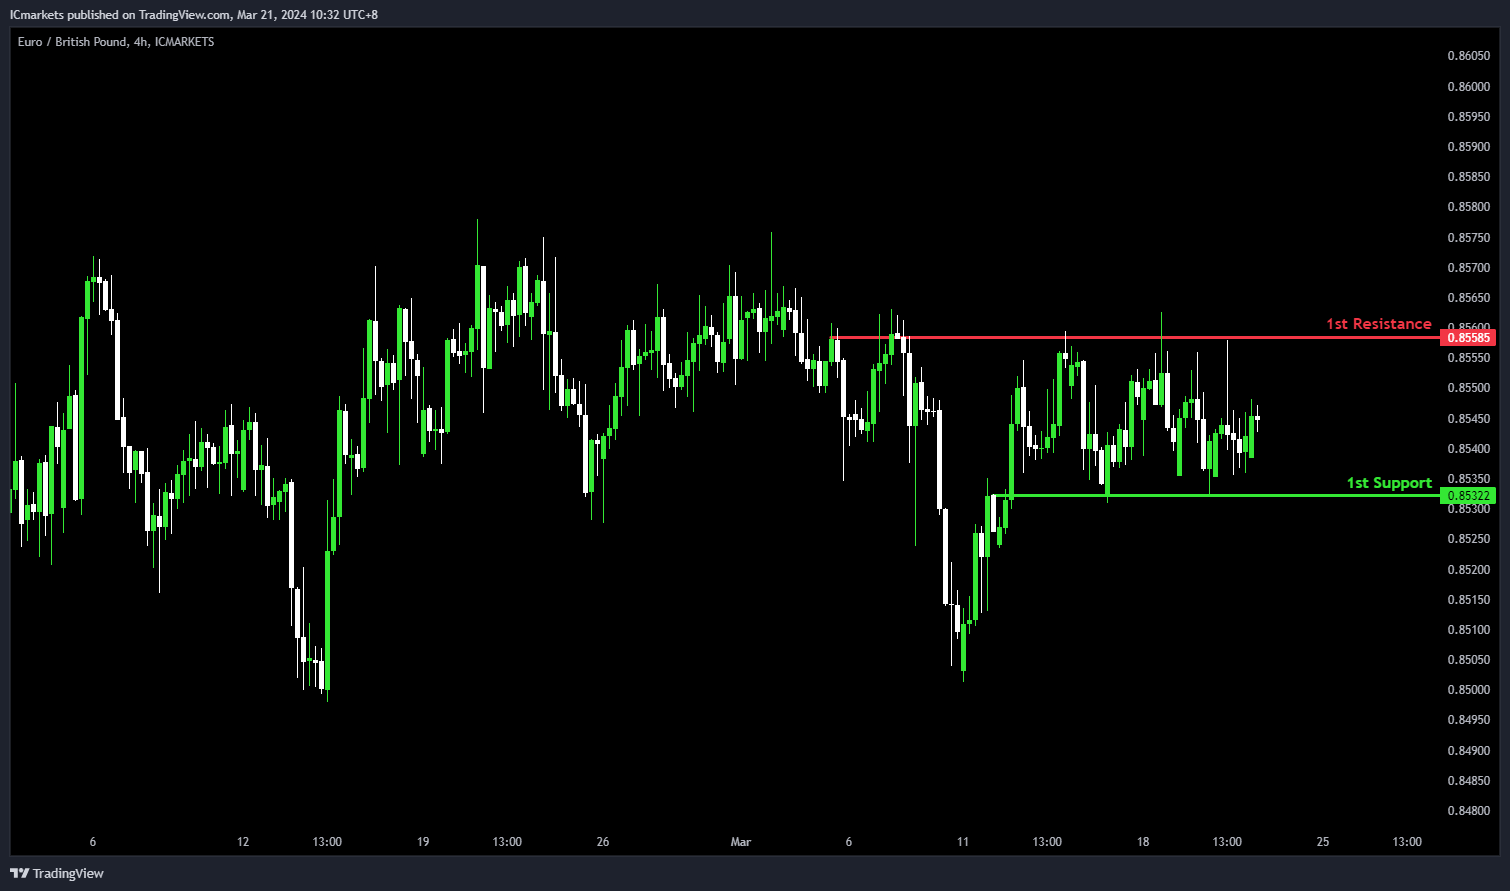
EUR/GBP:
For EUR/GBP, with the chart indicating neutral momentum, there’s a likelihood of price fluctuating between the 1st support and 1st resistance levels.
The 1st support at 0.8532 is significant, serving as an overlap support, indicating historical significance as a level where buying interest has intervened previously.
Conversely, the 1st resistance at 0.8558 acts as multi-swing high resistance, forming a barrier to upward movement.
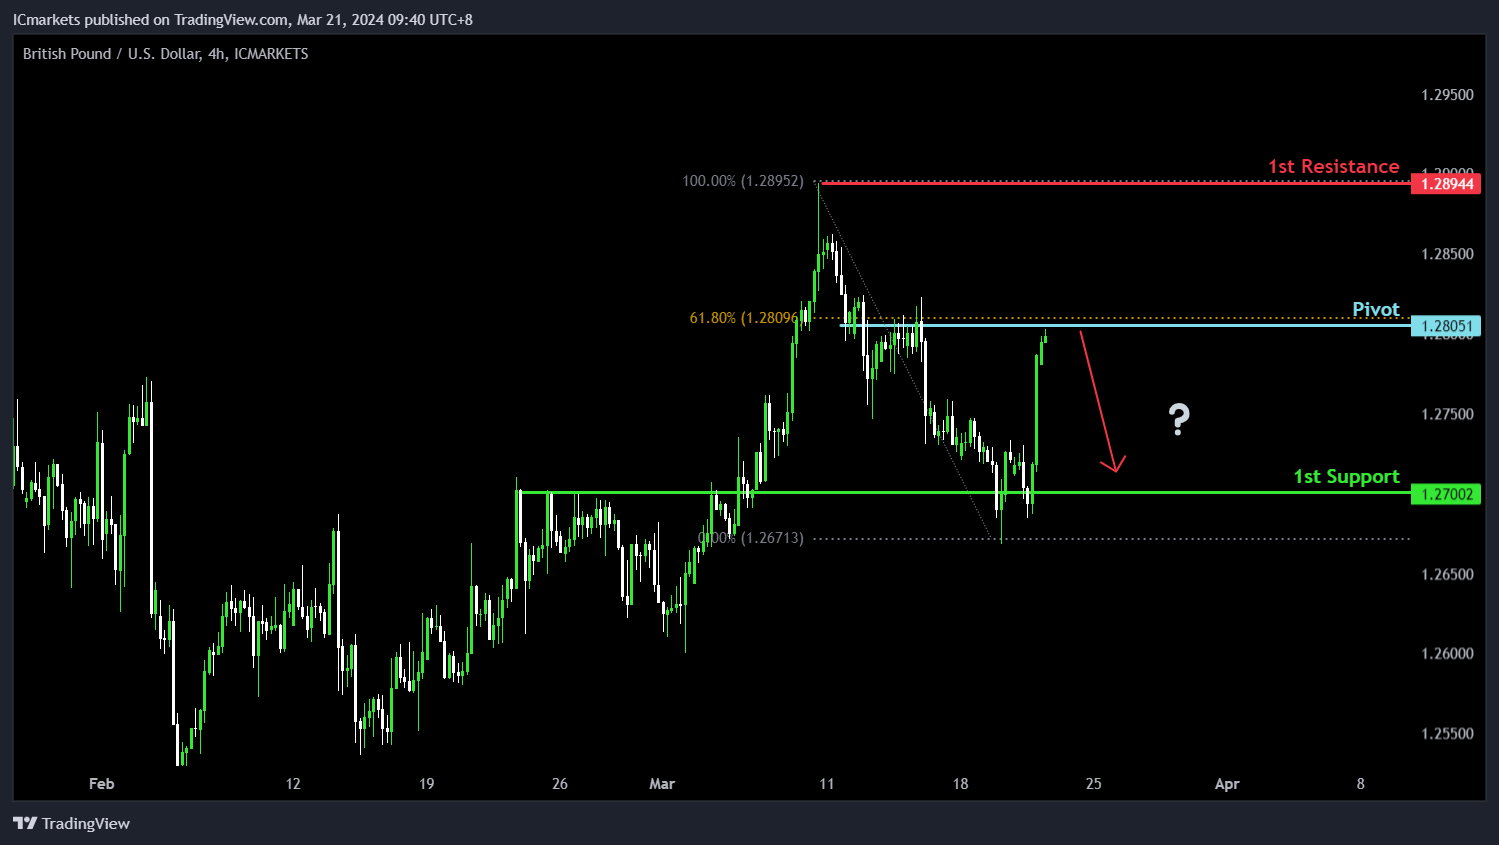
GBP/USD:
For GBP/USD, aligning with the bearish momentum, there’s a potential scenario indicating a bearish reaction from the pivot level, possibly leading to a decline towards the 1st support.
The pivot at 1.2805 signifies an overlap resistance, reinforced by the 61.80% Fibonacci Retracement, suggesting a significant level where selling pressure could strengthen.
Supporting this outlook, the 1st support at 1.2700 acts as an overlap support, indicating historical significance as a level where buying interest has emerged previously, potentially providing a floor for the price decline.
On the resistance side, the 1st resistance at 1.2894 serves as swing high resistance, suggesting a barrier to further upward movement.
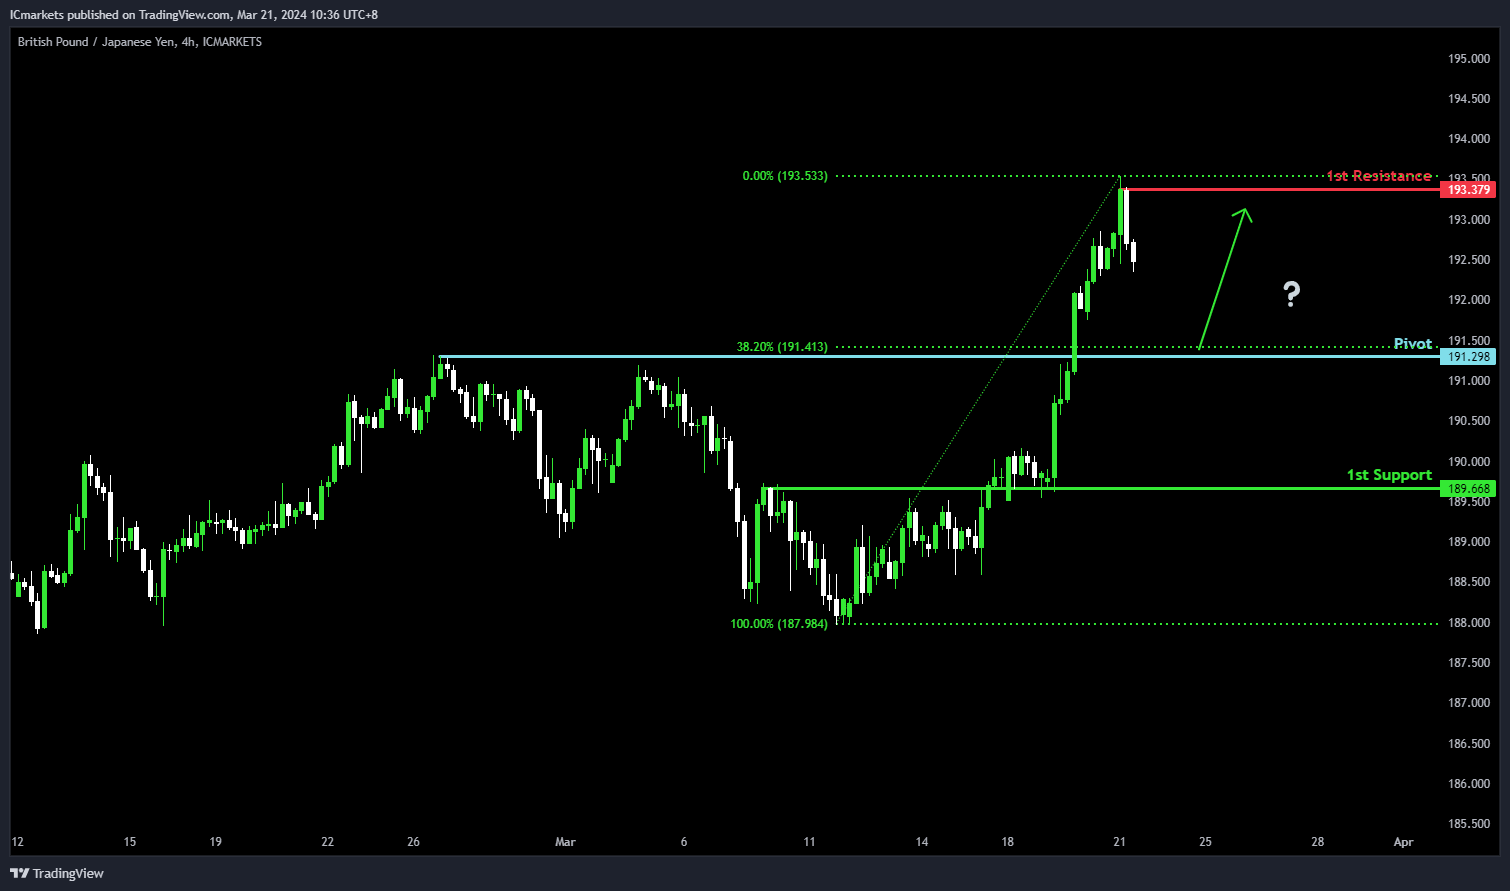
GBP/JPY:
For GBP/JPY, in line with the bullish momentum, there’s a potential scenario indicating a bullish bounce from the pivot level, possibly aiming towards the 1st resistance.
The pivot at 191.29 is significant, identified as pullback support, reinforced by the 38.20% Fibonacci Retracement, suggesting a pivotal level where buying interest might emerge. Additionally, the 1st support at 189.66 serves as overlap support, indicating historical significance as a level where buyers intervened.
On the resistance side, the 1st resistance at 193.37 presents a barrier to upward movement, supported by swing high resistance, potentially prompting profit-taking or selling pressure near this level.
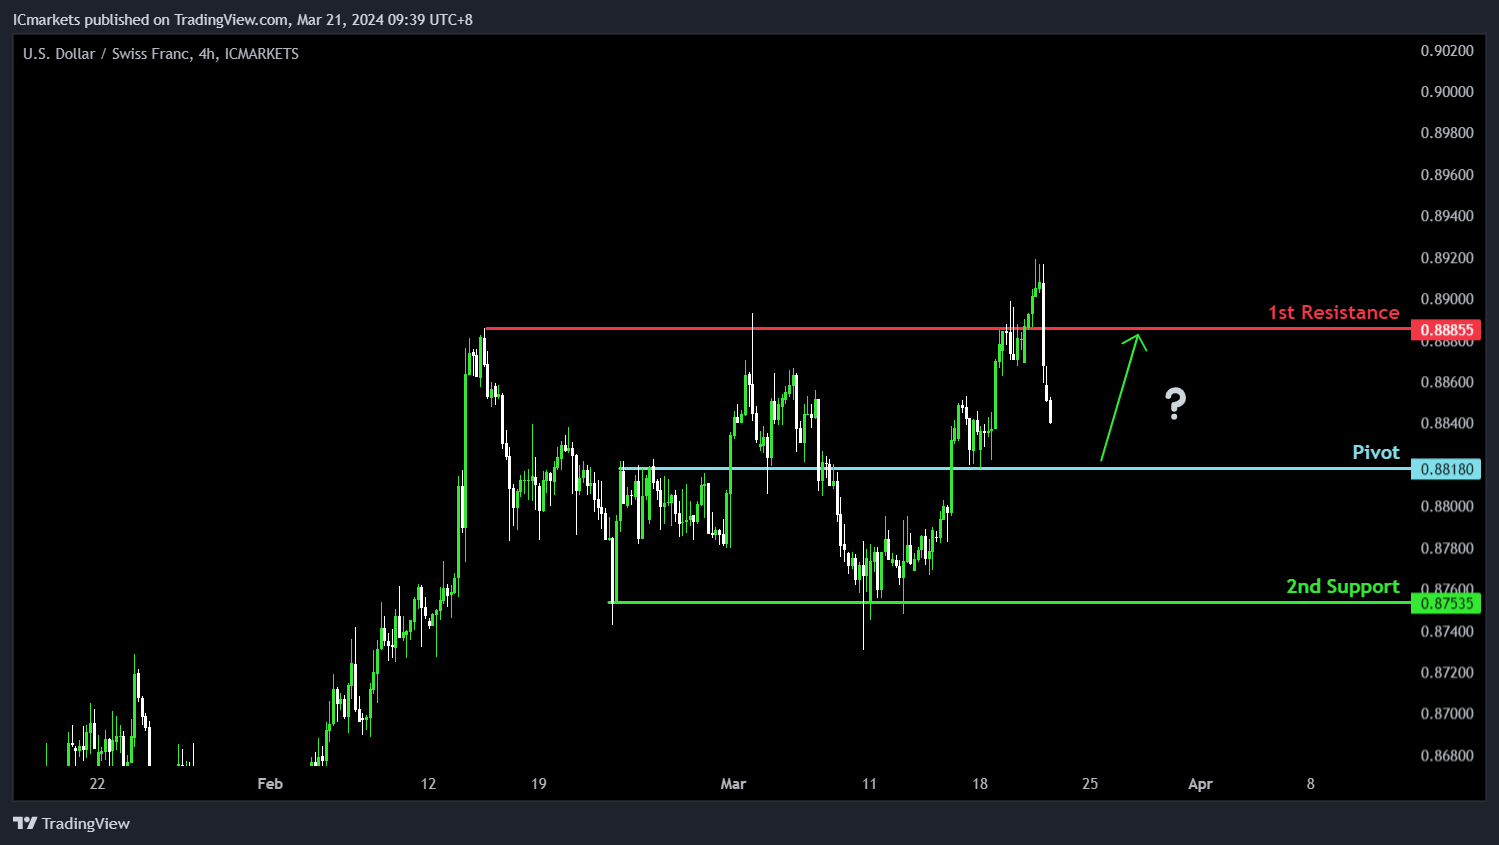
USD/CHF:
For USD/CHF, in line with the bullish momentum, there’s a potential scenario suggesting a bullish bounce from the pivot level, possibly leading to an advance towards the 1st resistance.
The pivot at 0.8818 signifies an overlap support, indicating a significant level where buying interest may emerge, potentially providing a foundation for a bullish move.
Supporting this outlook, the 1st support at 0.8753 acts as multi-swing low support, indicating historical significance as a level where buyers have previously intervened, further strengthening the potential for a bounce.
On the resistance side, the 1st resistance at 0.8885 is noted as pullback resistance, suggesting a barrier where selling pressure might increase, potentially limiting further upward movement.
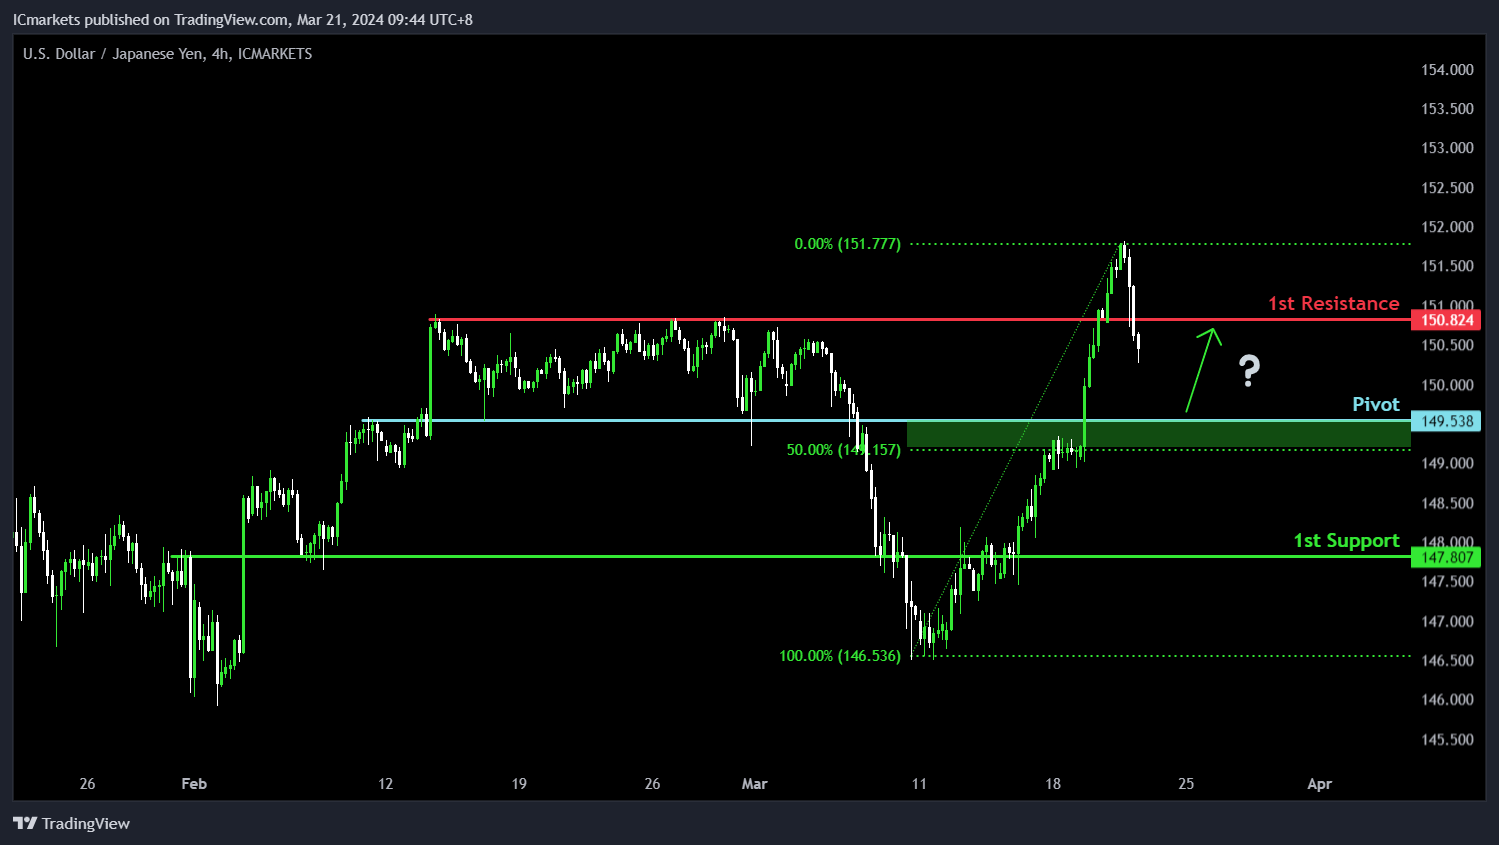
USD/JPY:
For USD/JPY, in alignment with the prevailing bullish momentum, there’s a potential for a bullish bounce from the pivot level, indicating a move towards the 1st resistance.
The pivot at 149.53 acts as pullback support, reinforced by the 50% Fibonacci Retracement, suggesting a significant level where buying interest may emerge.
Supporting this outlook, the 1st support at 147.80 serves as an overlap support, indicating historical significance as a level where buyers have intervened, potentially providing additional support for a bullish move.
On the resistance side, the 1st resistance at 150.82 acts as pullback resistance, suggesting a barrier where selling pressure could increase, potentially limiting further upward movement.
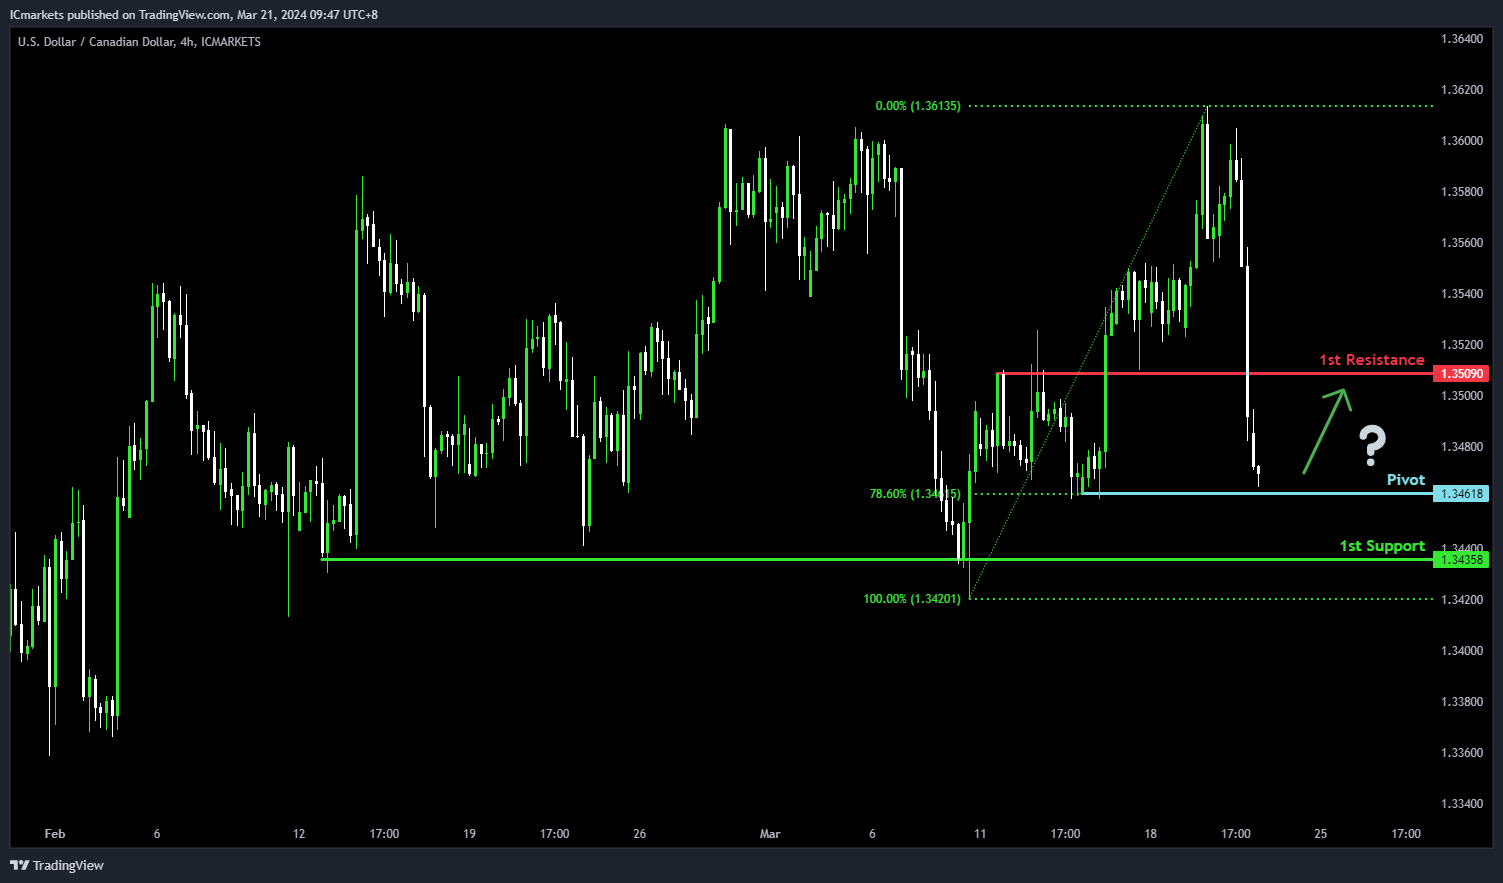
USD/CAD:
The USD/CAD chart currently demonstrates an overall bearish momentum. However, there is a potential scenario for price to make a weak bullish bounce off the pivot and rise towards the 1st resistance.
The pivot level at 1.3461 is identified as a pullback resistance that aligns with the 78.60% Fibonacci Retracement level where price could potentially make a weak bullish bounce and climb higher. The 1st resistance level at 1.3509 is noted as an overlap resistance, potentially limiting any further upward movement.
On the support side, the 1st support level at 1.3435 is marked as a multi-swing-low support, reinforcing its significance as a key support level.
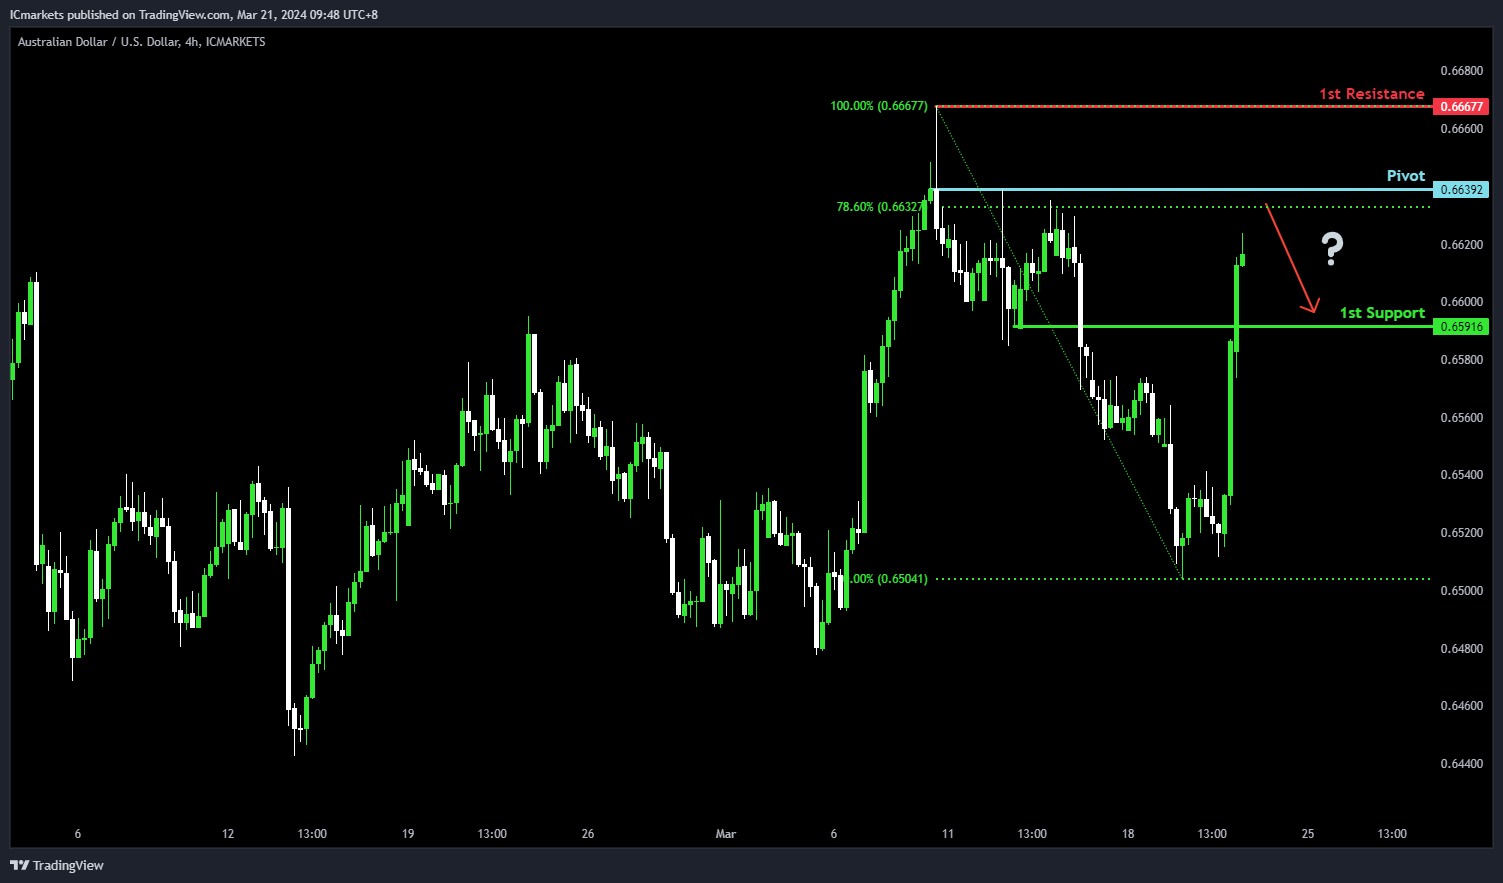
AUD/USD:
The AUD/USD chart currently demonstrates an overall bullish momentum. In this context, there is a potential scenario for price to rise towards the pivot before potentially making a bearish reaction and pull back towards the 1st support.
The pivot level at 0.6639 is identified as a pullback resistance that aligns close to the 78.60% Fibonacci Retracement level where price could potentially pull back from to drop lower. The 1st support level at 0.6591 is marked as a pullback support, reinforcing its significance as a key support level.
On the resistance side, the 1st resistance level at 0.6667 is noted as a swing-high resistance, potentially limiting any further upward movement.
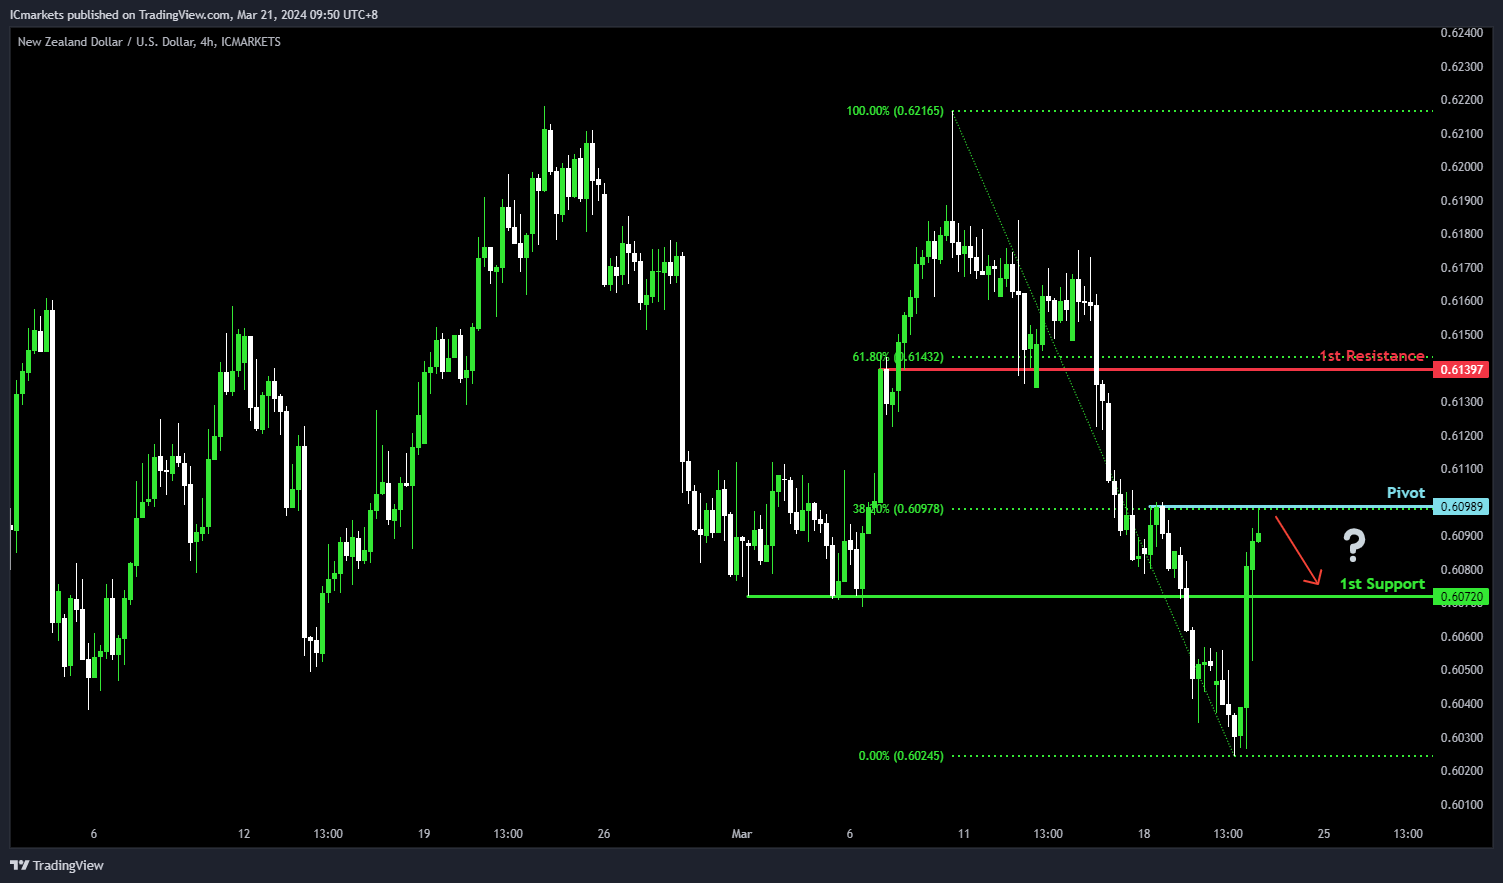
NZD/USD
The NZD/USD chart currently demonstrates an overall bearish momentum. However, there is a potential scenario for price to rise towards the pivot before reversing to fall towards the 1st support.
The pivot level at 0.6098 is identified as a pullback resistance that aligns close to the 38.20% Fibonacci Retracement level where price could potentially reverse from and drop lower. The 1st support level at 0.6072 is marked as a pullback support, reinforcing its significance as a key support level.
On the resistance side, the 1st resistance level at 0.6139 is noted as an overlap resistance that aligns close to the 61.80% Fibonacci Retracement level, potentially limiting any further upward movement.
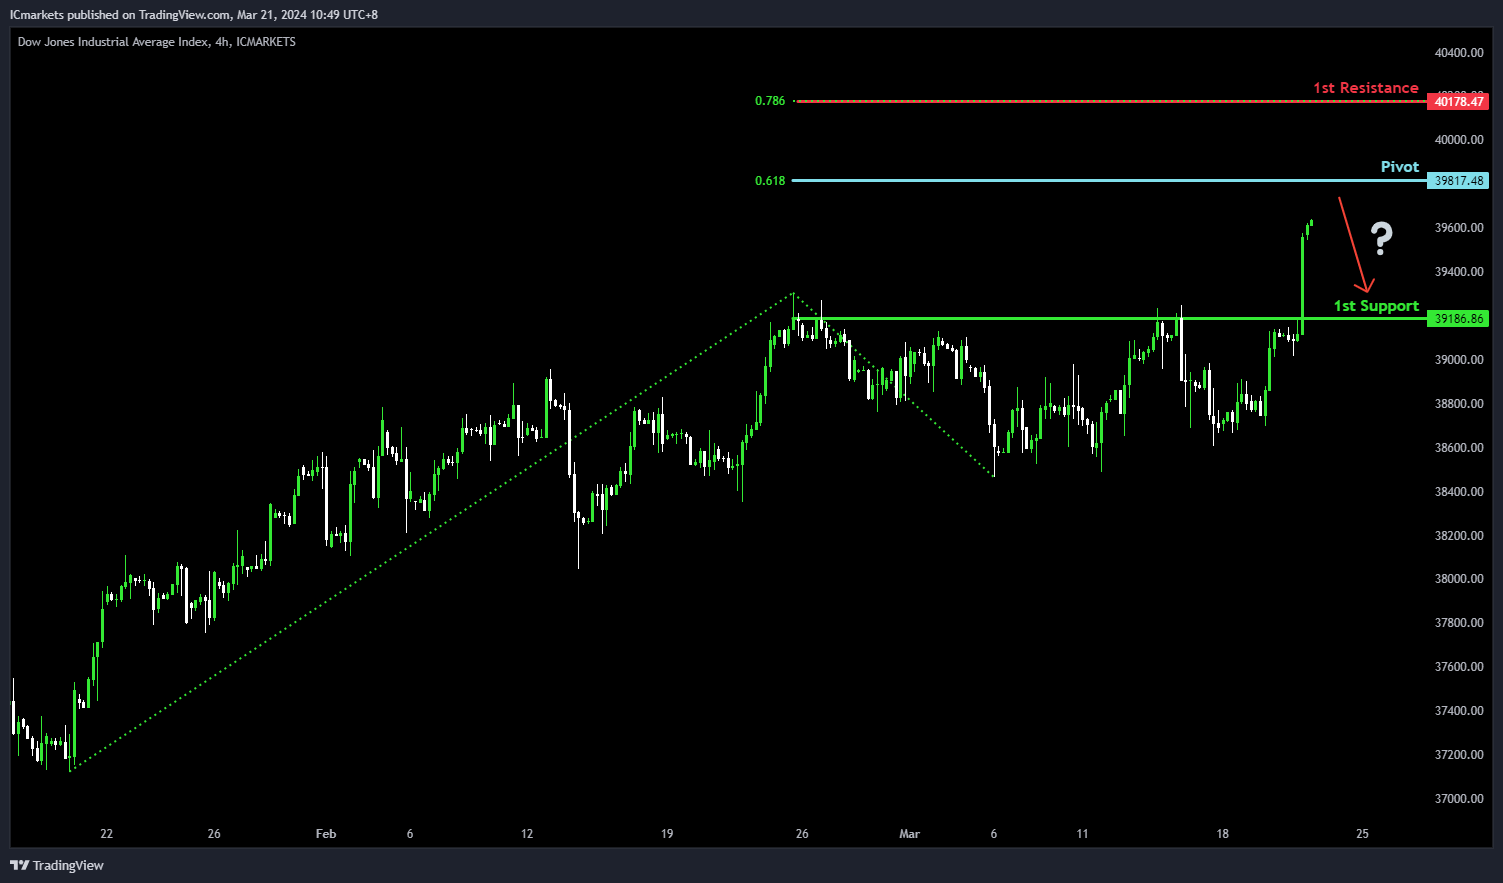
DJ30:
The Dow Jones chart (DJ30) currently demonstrates an overall bullish momentum. In this context, there is a potential scenario for price to rise towards the pivot and make a bearish reaction to pull back towards the 1st support.
The pivot level at 39,817.48 is identified as a resistance level that aligns with the 61.80% Fibonacci Projection level where price could potentially reverse from and drop lower. The 1st support level at 39,186.86 is marked as a pullback support, reinforcing its significance as a key support level.
The 1st resistance level at 40,178.47 is noted as a resistance level that aligns with the 78.60% Fibonacci Projection level, potentially impeding any further bullish movement.
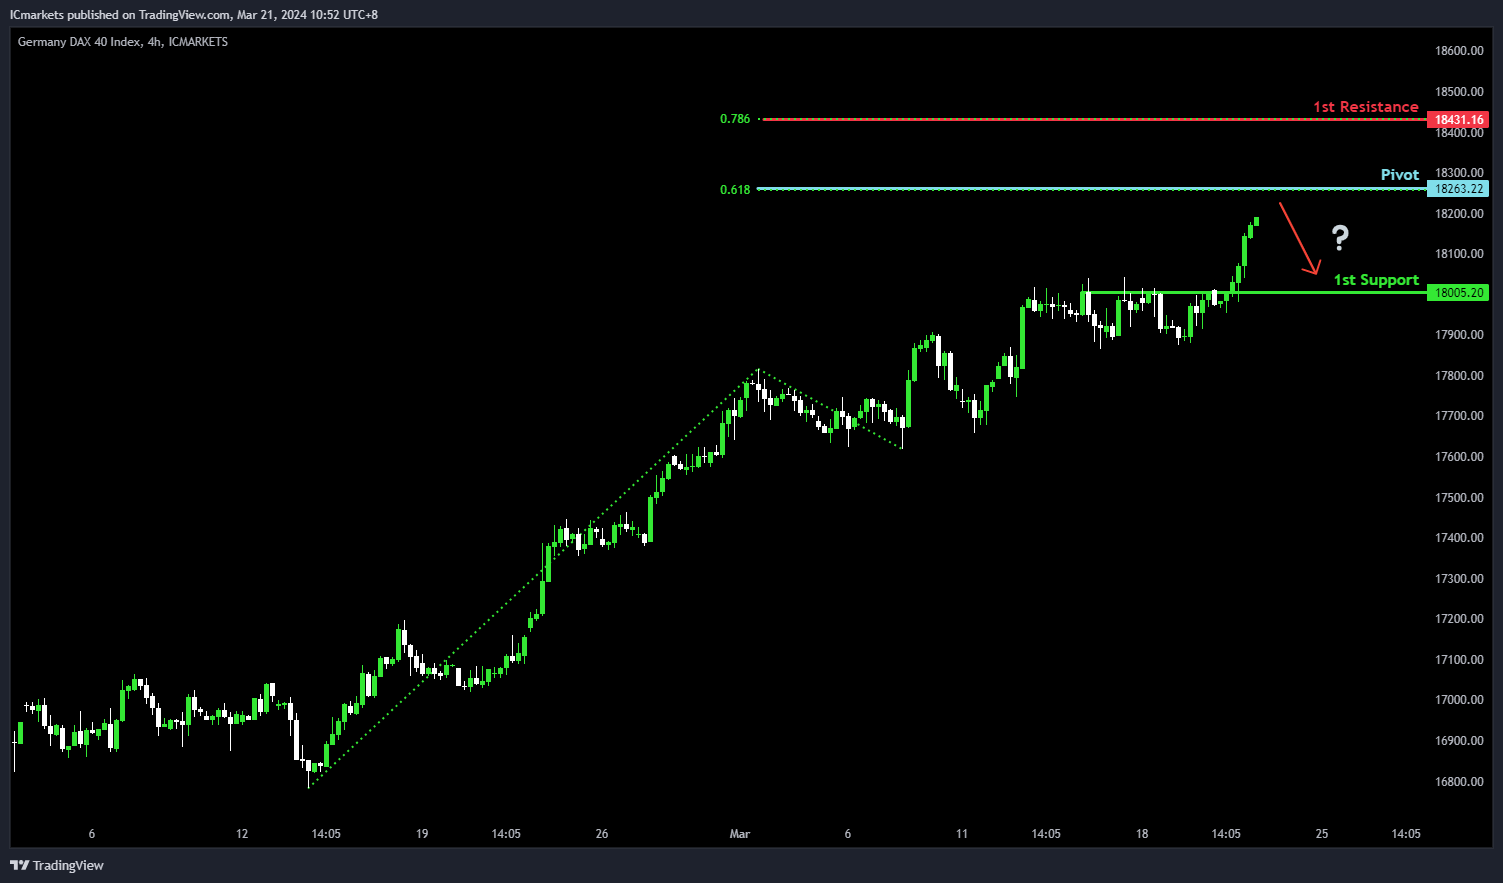
GER40:
The DAX chart (GER40) currently demonstrates an overall bullish momentum. In this context, there is a potential scenario for price to rise towards the pivot and make a bearish reaction to pull back towards the 1st support.
The pivot level at 18,263.22 is identified as a resistance level that aligns with the 61.80% Fibonacci Projection level where price could potentially reverse from and drop lower. The 1st support level at 18,005.20 is marked as a pullback support, reinforcing its significance as a key support level.
The 1st resistance level at 18,431.16 is noted as a resistance level that aligns with the 78.60% Fibonacci Projection level, potentially impeding any further bullish movement.
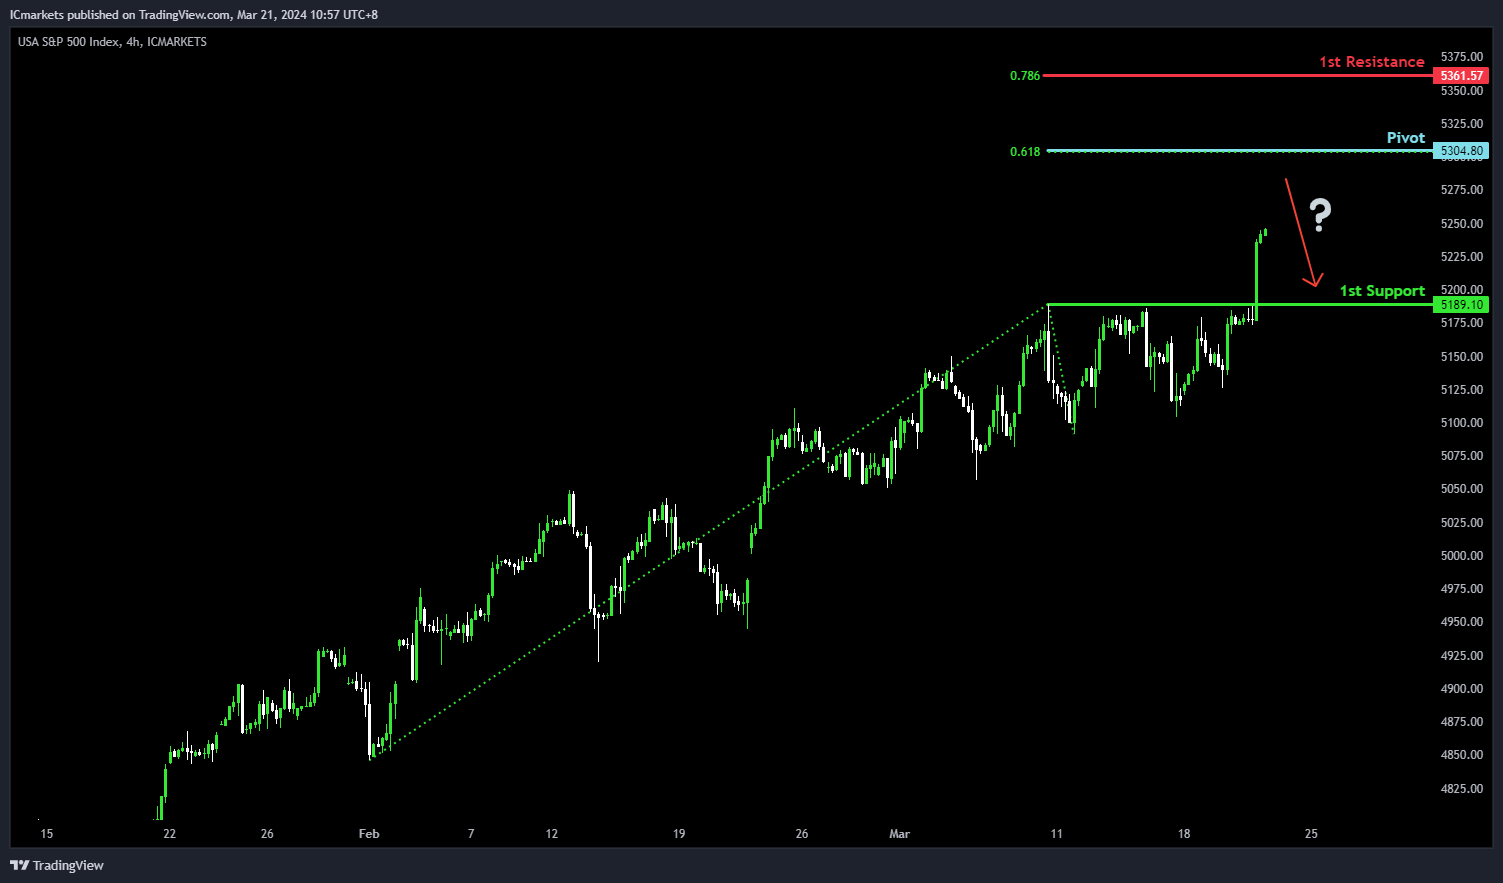
US500:
The S&P 500 chart (US500) currently demonstrates an overall bullish momentum. In this context, there is a potential scenario for price to rise towards the pivot and make a bearish reaction to pull back towards the 1st support.
The pivot level at 5,304.80 is identified as a resistance level that aligns with the 61.80% Fibonacci Projection level where price could potentially reverse from and drop lower. The 1st support level at 5,189.10 is marked as a pullback support, reinforcing its significance as a key support level.
The 1st resistance level at 5,361.57 is noted as a resistance level that aligns with the 78.60% Fibonacci Projection level, potentially impeding any further bullish movement.
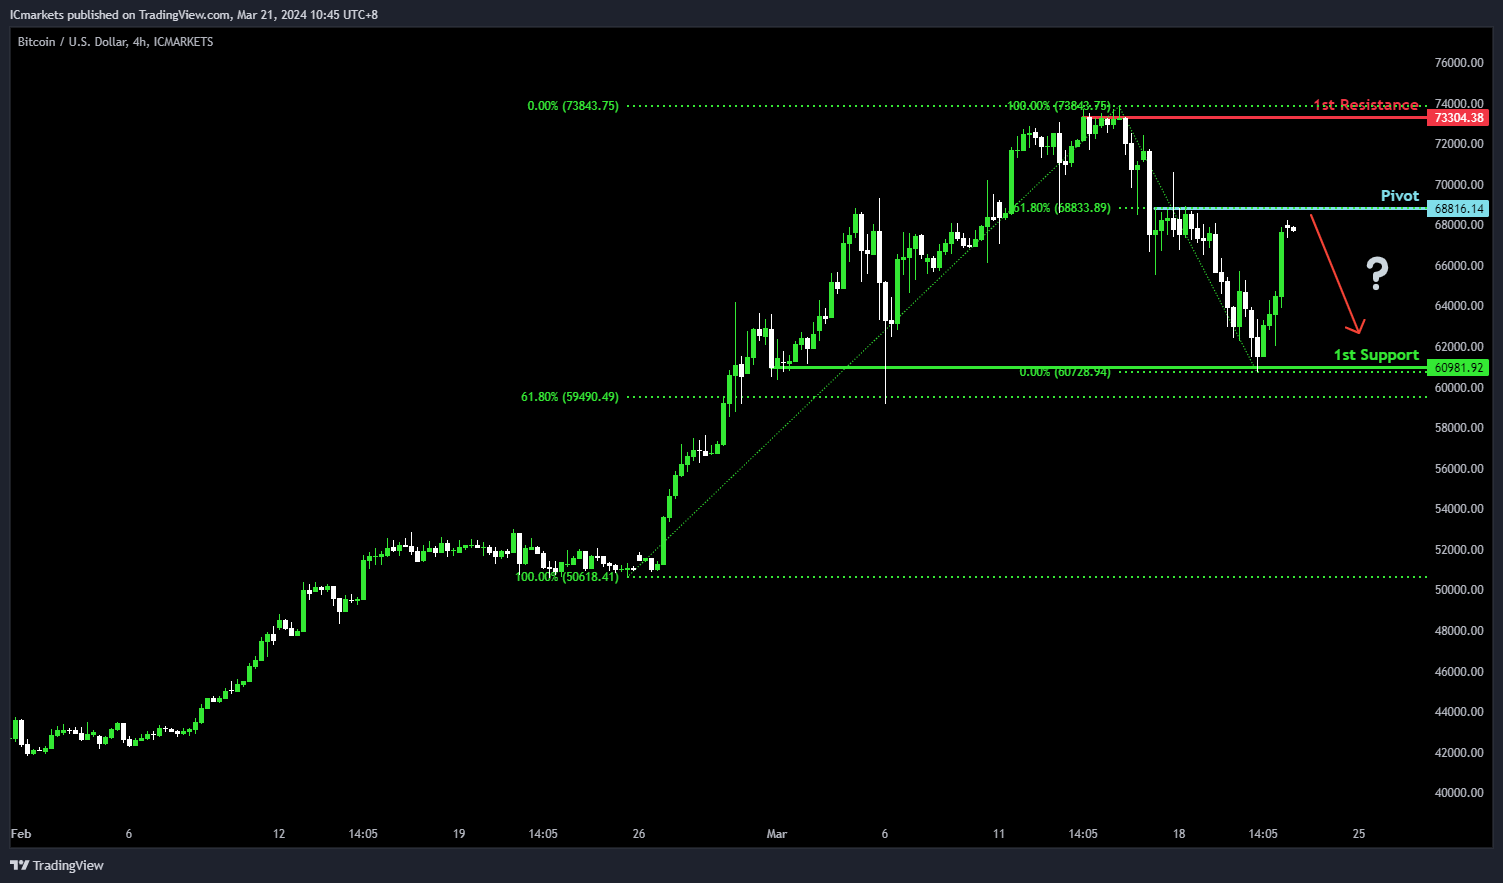
BTC/USD:
The Bitcoin chart (BTC/USD) currently demonstrates an overall bearish momentum. However, there is a potential scenario for price to rise towards the pivot and reverse to drop lower towards the 1st support.
The pivot level at 68,816.14 is identified as a pullback support that aligns with the 61.80% Fibonacci Retracement level where price could potentially make a bearish reversal and drop lower. The 1st support level at 60,981.92 is marked as a pullback support that aligns close to the 61.80% Fibonacci Retracement level, reinforcing its significance as a key support level.
To the upside, the 1st resistance level at 73,304.38 is noted as a swing-high resistance at the all-time high, further reinforcing its significance as a potential barrier to further bullish movement.
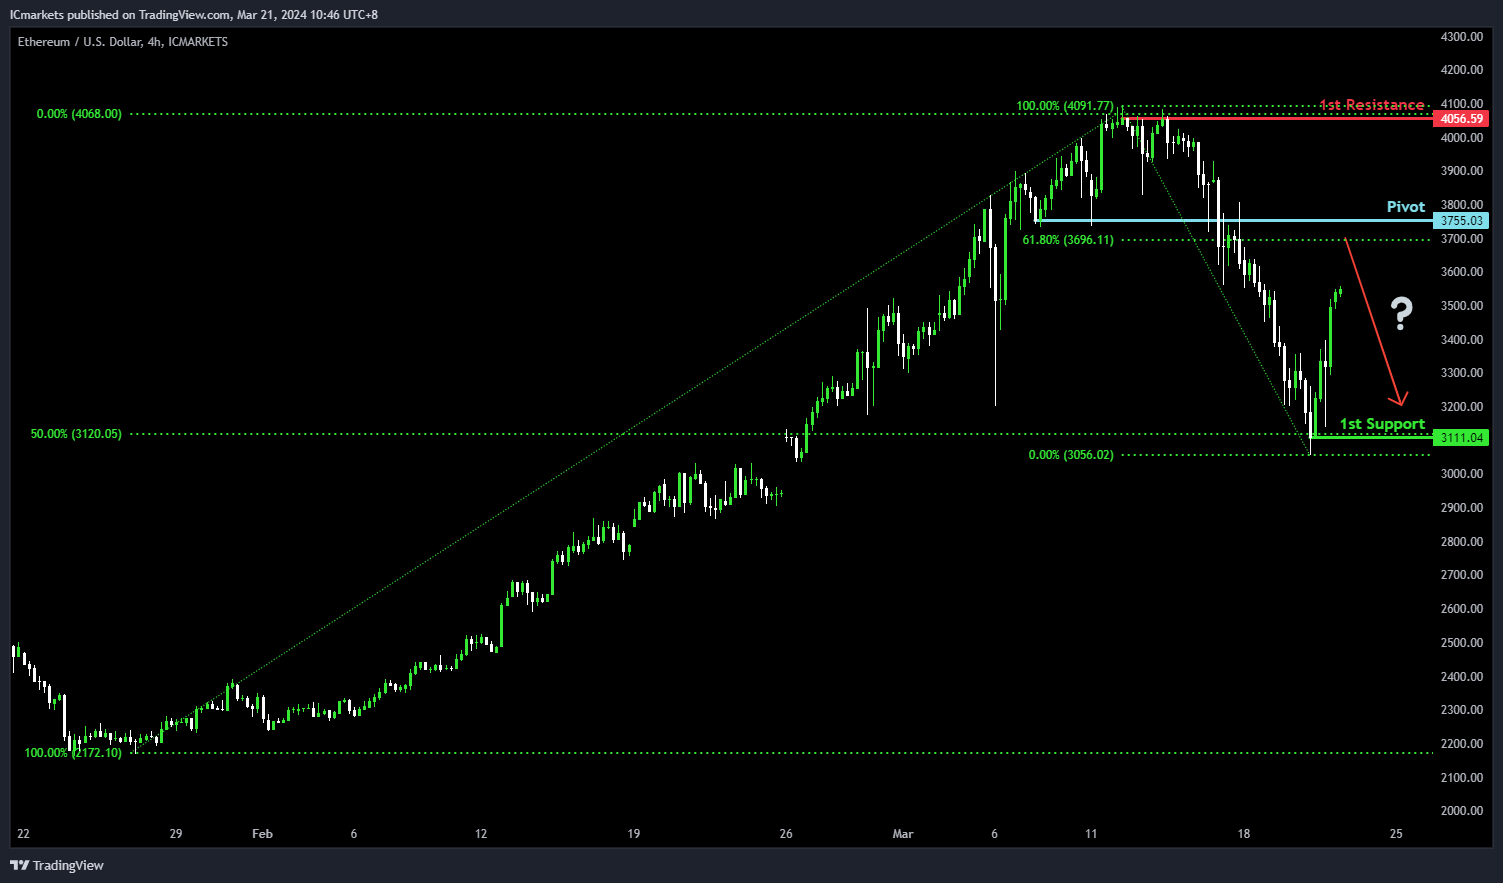
ETH/USD:
The Ethereum chart (ETH/USD) currently demonstrates an overall bearish momentum. However, there is a potential scenario for price to rise towards the pivot and reverse to drop lower towards the 1st support.
The pivot level at 3,755.03 is identified as a pullback support that aligns close to the 61.80% Fibonacci Retracement level where price could potentially make a bearish reversal and drop lower. The 1st support level at 3,111.04 is marked as a pullback support that aligns with the 50.00% Fibonacci Retracement level, reinforcing its significance as a key support level.
To the upside, the 1st resistance level at 4,056.59 is noted as a swing-high resistance, further reinforcing its significance as a potential barrier to further bullish movement.
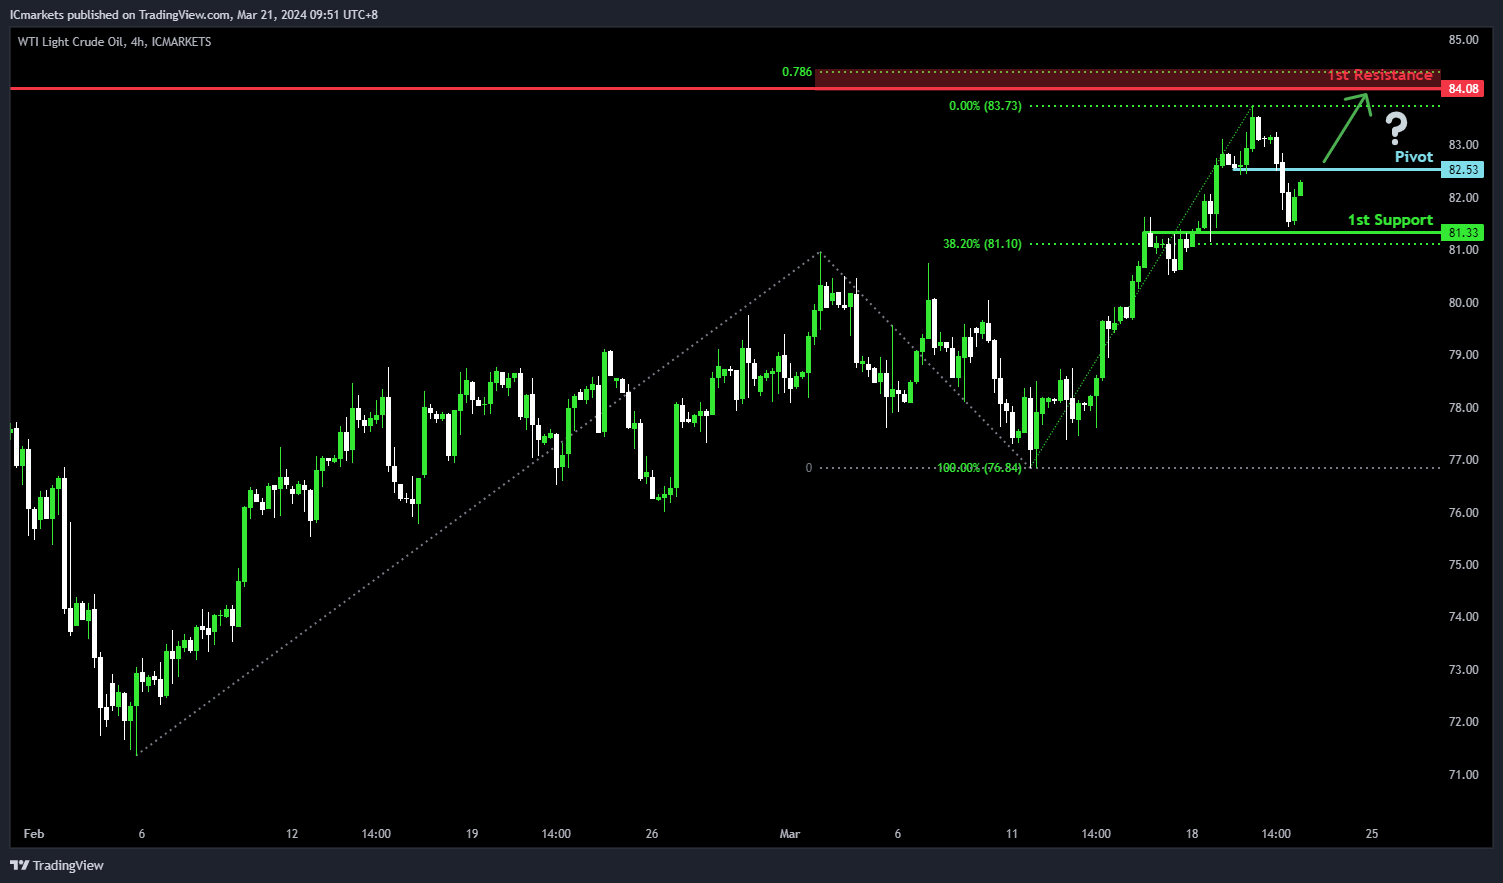
WTI/USD:
The WTI (West Texas Intermediate) oil chart currently demonstrates an overall bullish momentum. In this context, there is a potential scenario for price to rise towards the pivot and make a bullish breakout to rise towards the 1st resistance.
The pivot level at 82.53 is identified as a pullback resistance where price could potentially make a bullish breakout and climb higher. The 1st resistance level at 84.08 is noted as an overlap resistance that aligns close to the 78.60% Fibonacci Projection level, further reinforcing its significance as a potential barrier to further bullish movement.
To the downside, the 1st support level at 81.33 is marked as an overlap support that aligns close to the 38.20% Fibonacci Retracement level, reinforcing its significance as a key support level.
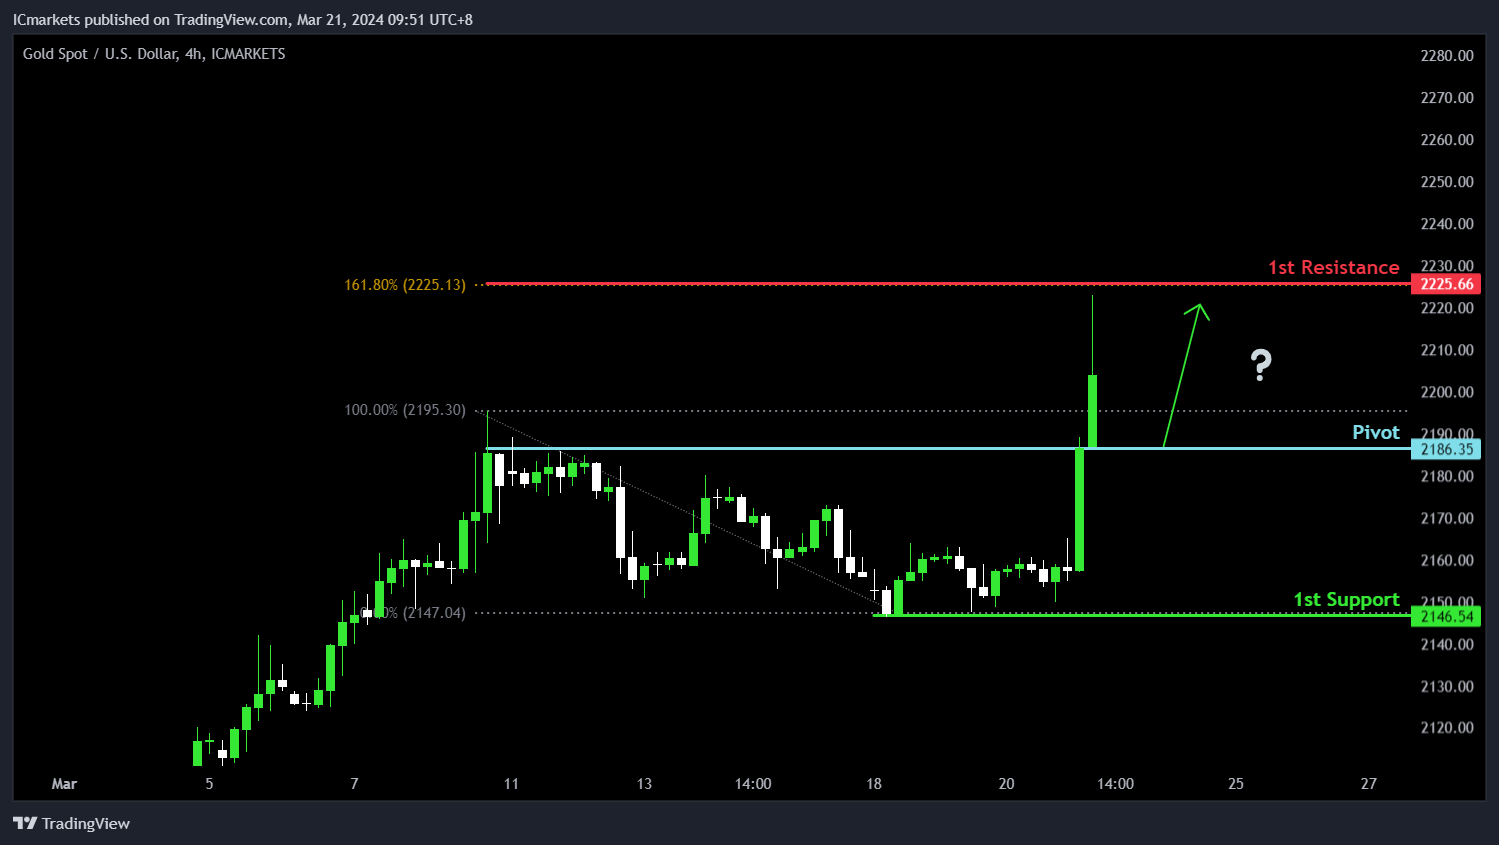
XAU/USD (GOLD):
For XAU/USD, in line with the bullish momentum, there’s a potential for a bullish bounce from the pivot level, indicating a move towards the 1st resistance.
The pivot at 2186.35 acts as pullback support, suggesting a significant level where buying interest may emerge. This level is further reinforced by its role as a pivot, indicating potential market sentiment shifts.
Supporting this, the 1st support at 2146.54 serves as multi-swing low support, highlighting its historical significance as a level where buyers have previously intervened, adding further credibility to the potential bullish move.
On the resistance side, the 1st resistance at 2225.66 is identified by the 161.80% Fibonacci Extension, suggesting a level where selling pressure might increase, potentially acting as a barrier to further upward movement.
BoJ’s Ueda assures continued accommodative monetary stance following rate hike
Addressing the parliament today, BoJ Governor Kazuo Ueda articulated the rationale behind this week's exit from the long-standing negative interest rate policy and the subsequent rate hike. This move marks a significant shift for Japan's monetary policy, which had been entrenched in a negative interest rate environment for eight years.
Ueda pointed out, "We could have waited until inflation is completely at 2% for a long period of time. But if we did so, it's unclear whether inflation would have stayed at 2%. We might have seen a sharp increase in upside price risks," highlighting the preemptive nature of the BoJ's action.
The decision was influenced by recent trends in service prices and substantial wage increases resulting from annual wage negotiations, indicating a strengthening cycle of wage growth and inflation in Japan.
Despite this historical step, Ueda underscored that Japan's inflation expectations for the medium and long term are "still in the process of accelerating towards 2%". He assured that BoJ remains committed to supporting the economy and prices "by maintaining accommodative monetary conditions for the time being".
He also hinted at future adjustments, stating, "As we exit our massive stimulus program, we will gradually shrink the size of our balance sheet and at some point reduce the size of our government bond buying."