
Sample Category Title
EUR/CHF Daily Outlook
Daily Pivots: (S1) 0.9606; (P) 0.9619; (R1) 0.9631; More...
Range trading continues in EUR/CHF and intraday bias stays neutral. Another dip cannot be ruled out, but outlook will stay bullish as long as 0.9510 support holds. On the upside, break of 0.9630 will resume the rise from 0.9252 and target 161.8% projection of 0.9252 to 0.9471 from 0.9304 at 0.9658 next. However, considering bearish divergence condition in 4H MACD, firm break of 0.9510 will turn bias back to the downside for deeper fall.
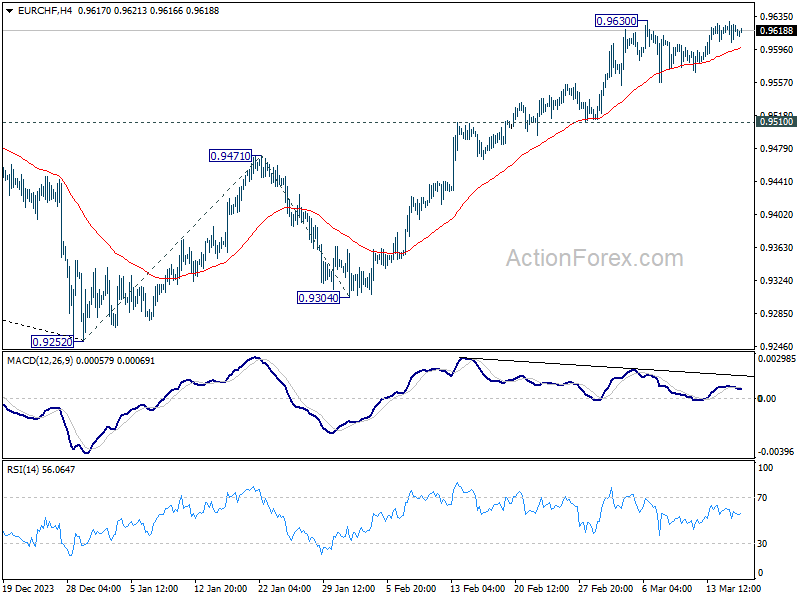
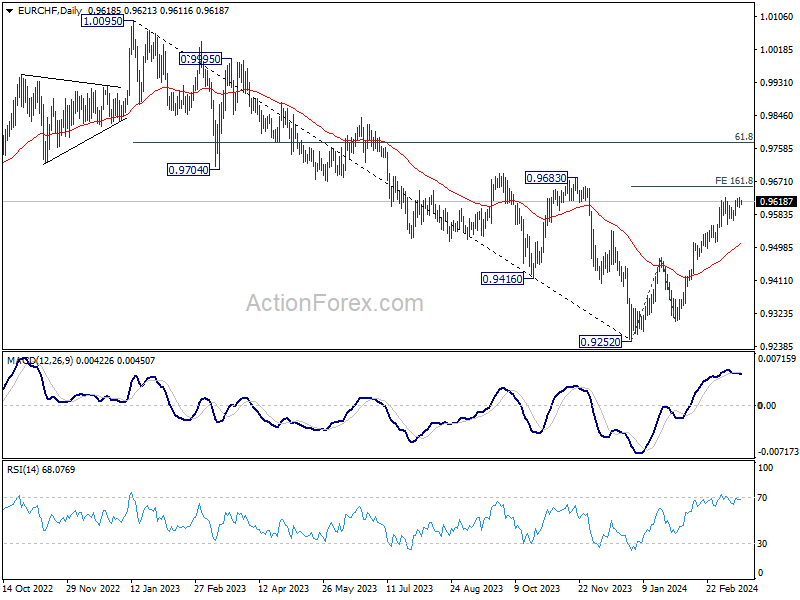
In the bigger picture, as long as 0.9683 resistance holds, rebound from 0.9252 are seen as a corrective move only. Larger down trend is expected to resume through 0.9252 after the correction completes. However, firm break of 0.9683 and sustained trading above 55 W EMA (now at 0.9620) will argue that 0.9252 is already a medium term bottom. Stronger rise would then be seen 61.8% retracement of 1.0095 to 0.9252 at 0.9773 and above.
EUR/USD Daily Outlook
Daily Pivots: (S1) 1.0873; (P) 1.0887; (R1) 1.0900; More...
Intraday bias in EUR/USD remains on the downside for the moment. Fall from 1.0980 short term top would target 55 D EMA (now at 1.0856). Sustained break there will argue that rebound from 1.0694 has completed and bring retest of this low. For now, risk will stay on the downside as long as 1.0980 resistance holds, in case of recovery.
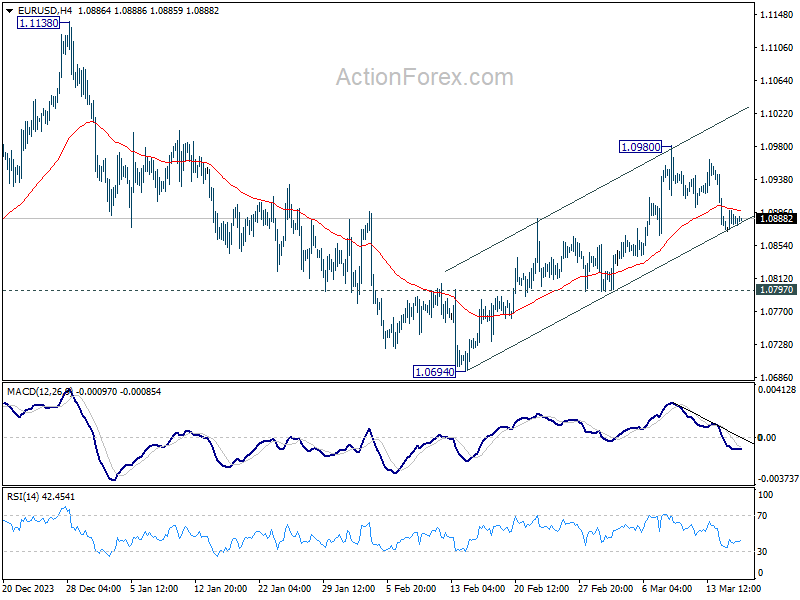
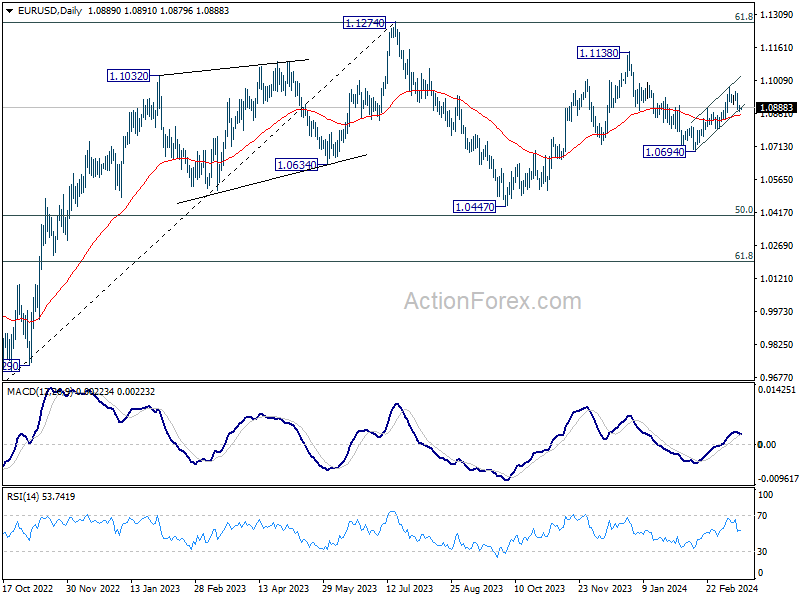
In the bigger picture, price actions from 1.1274 are viewed as a corrective pattern to rise from 0.9534 (2022 low). Rise from 1.0447 is seen as the second leg. While further rally could cannot be ruled out, upside should be limited by 1.1274 to bring the third leg of the pattern. Meanwhile, sustained break of 1.0694 support will argue that the third leg has already started for 1.0447 and possibly below.
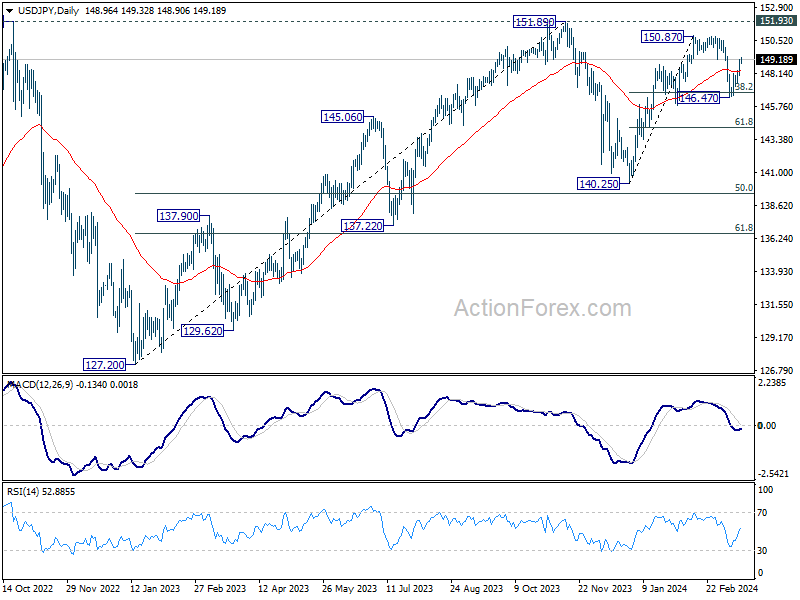
USD/JPY Daily Outlook
Daily Pivots: (S1) 148.34; (P) 148.75; (R1) 149.47; More...
Intraday bias in USD/JPY remains on the upside for the moment. Corrective fall from 150.87 should have completed at 146.47, after drawing support from 38.2% retracement of 140.25 to 150.87 at 146.81. Further rally should be seen to 150.87/89 key resistance zone. Nevertheless, on the downside, below 148.02 minor support will turn intraday bias neutral first.
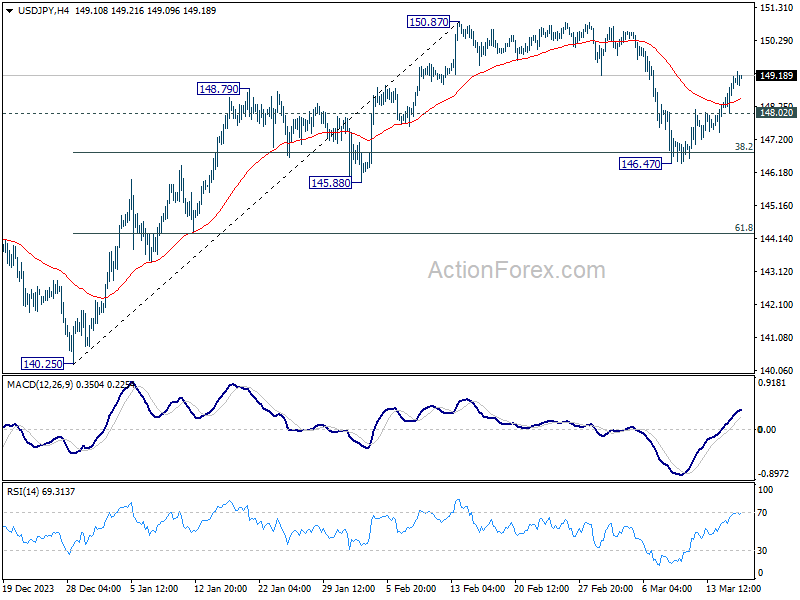
In the bigger picture, no change in the view that price action from 151.89 (2023 high) are correction to up trend from 127.20 (2023 low). The question is whether this correction has completed at 140.25, or extending with fall from 150.87 as the third leg. Sustained break of above mentioned 146.81 fibonacci level will favor the latter case. But even so, downside should be contained by 50% retracement of 127.20 to 151.89 at 139.54
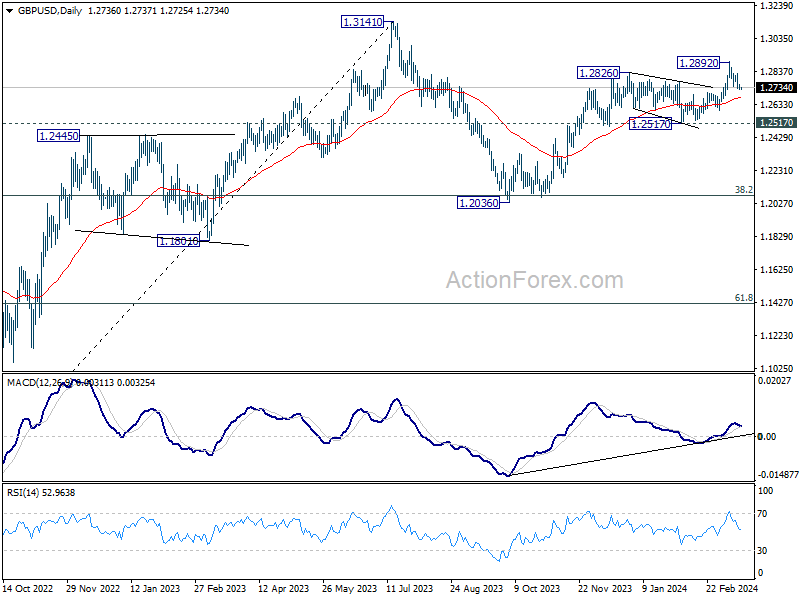
GBP/USD Daily Outlook
Daily Pivots: (S1) 1.2721; (P) 1.2741; (R1) 1.2755; More...
Intraday bias in GBP/USD remains mildly on the downside at this point. Fall from 1.2892 short term top should target 55 D EMA (now at 1.2673). Firm break there will bring deeper fall to 1.2517 structural support. For now, risk will stay mildly on the downside as long as 1.2822 minor resistance holds, in case of recovery.
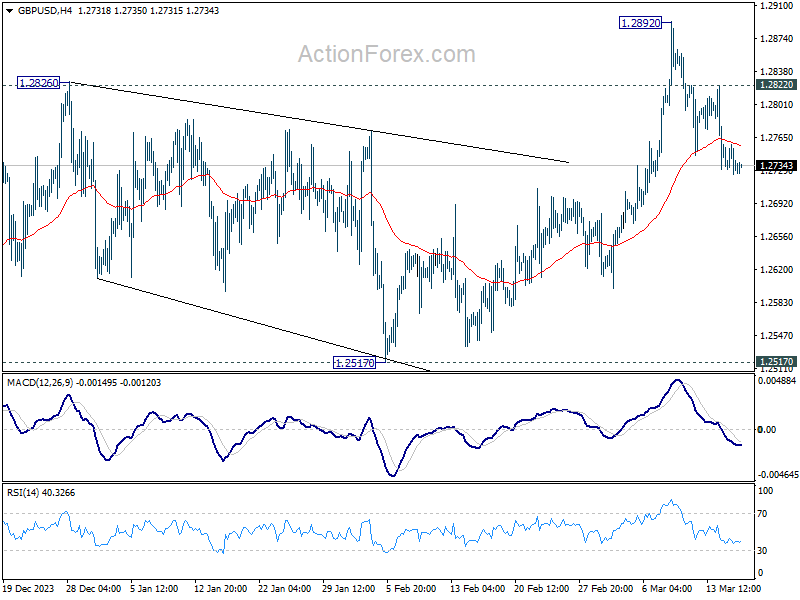
In the bigger picture, price actions from 1.3141 medium term top are seen as a corrective pattern to up trend from 1.0351 (2022 low). Rise from 1.2036 is seen as the second leg, which is still in progress. But upside should be limited by 1.3141 to bring the third leg of the pattern. Meanwhile, break of 1.2517 support will argue that the third leg has already started for 38.2% retracement of 1.0351 (2022 low) to 1.3141 at 1.2075 again.
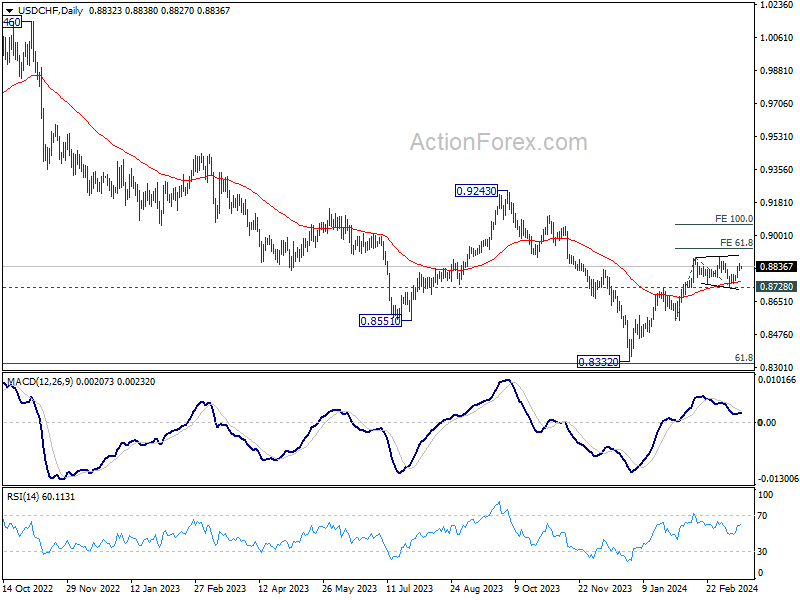
USD/CHF Daily Outlook
Daily Pivots: (S1) 0.8818; (P) 0.8836; (R1) 0.8852; More....
Intraday bias in USD/CHF stays mildly on the upside at this point. Consolidation from 0.8884 should have completed with three waves to 0.8728. Further rally should be seen to retest 0.8891 resistance first. Firm break there will resume whole rally from 0.8332. Next target is 61.8% projection of 0.8550 to 0.8884 from 0.8728 at 0.8934. For now, this will remain the favored case as long as 0.8728 support holds, in case of retreat.
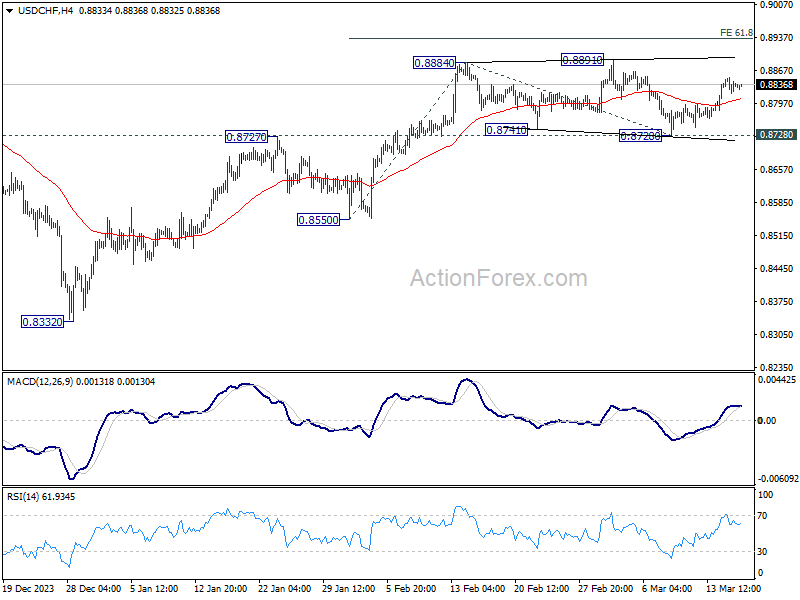
In the bigger picture, price actions from 0.8332 medium term bottom as seen as developing into a corrective pattern to the down trend from 1.0146 (2022 high). Further rise would be seen as long as 0.8555 support holds. But upside should be limited by 0.9243 resistance, at least on first attempt.
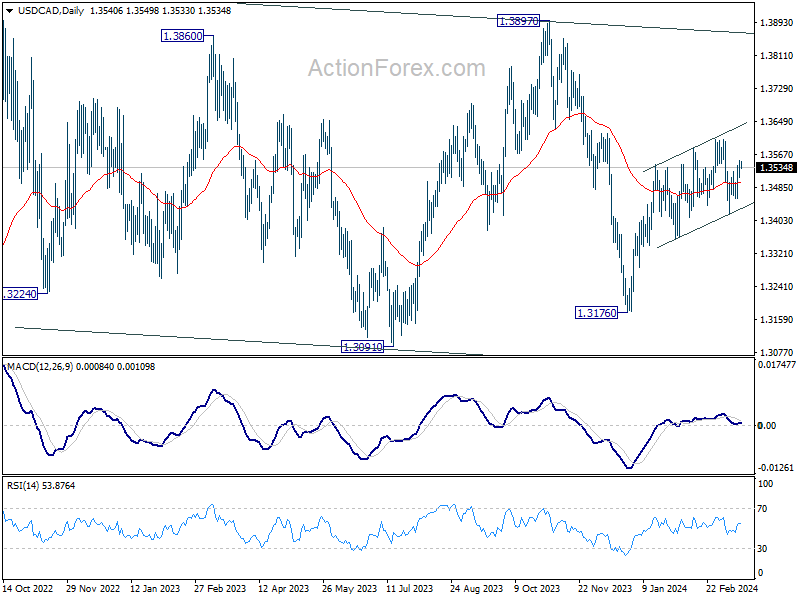
USD/CAD Daily Outlook
Daily Pivots: (S1) 1.3518; (P) 1.3535; (R1) 1.3560; More...
Intraday bias in USD/CAD remains mildly on the upside at this point. Further rise should be seen to retest 1.3605 resistance first. Firm break there will resume whole rally from 1.3176. On the downside, however, break of 1.3458 minor support will turn bias back to the downside or 1.3419 instead.
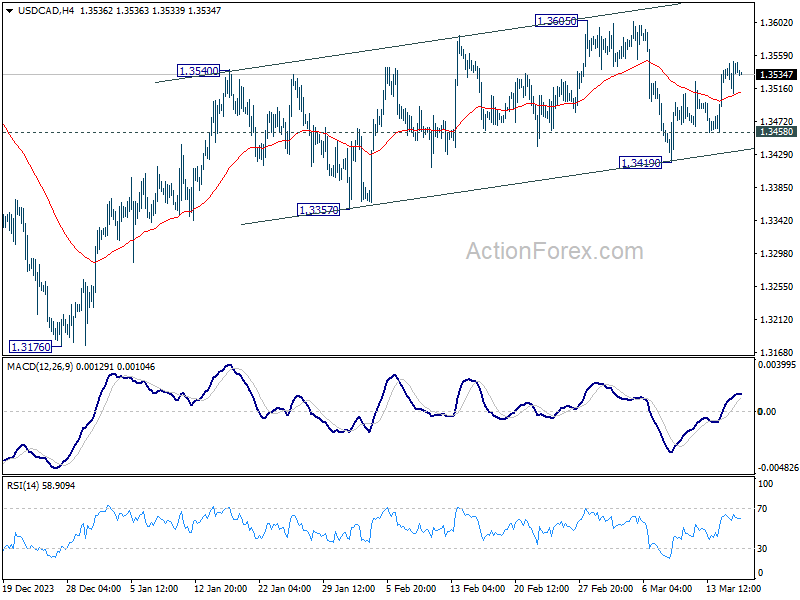
In the bigger picture, price actions from 1.3976 (2022 high) are viewed as a corrective pattern only. In case of another fall, strong support should emerge above 1.2947 resistance turned support to bring rebound. Overall, larger up trend from 1.2005 (2021 low) is still expected to resume through 1.3976 at a later stage.
Technical Outlook and Review
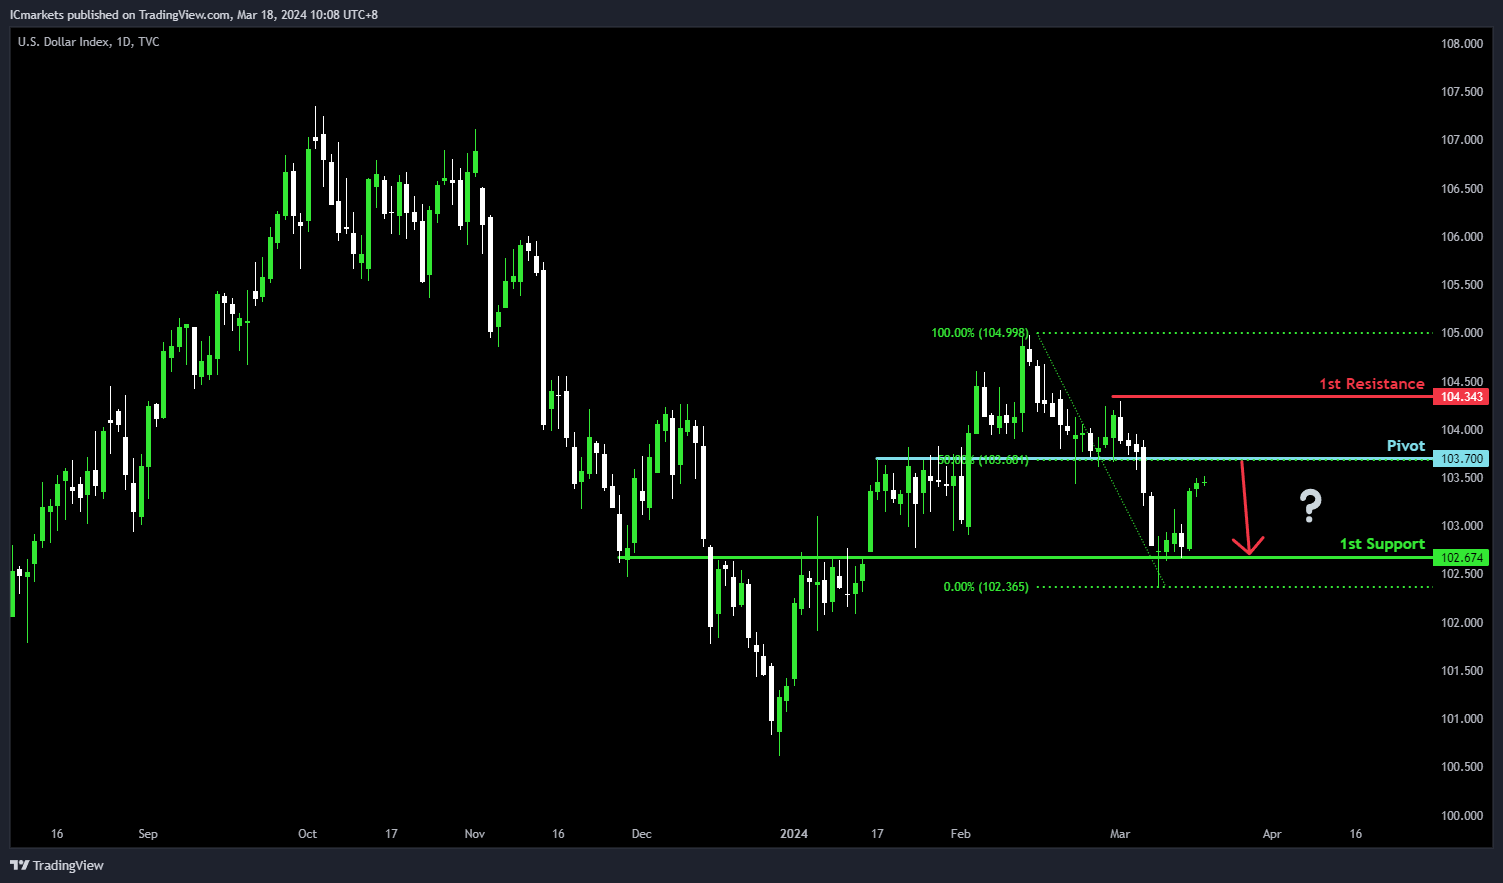
DXY:
For DXY, the potential direction is bearish, despite the overall bullish momentum of the chart. There’s a chance of a bearish reaction off the pivot level, leading to a drop towards the 1st support.
The pivot at 103.70 acts as pullback support, coinciding with the 50% Fibonacci Retracement, indicating its significance as a level where buying interest may emerge. Additionally, the 1st support at 102.67 serves as overlap support, historically important for providing a floor to price declines.
On the resistance side, the 1st resistance at 104.34 presents a significant barrier, marked by swing high resistance, potentially limiting further upward movement.
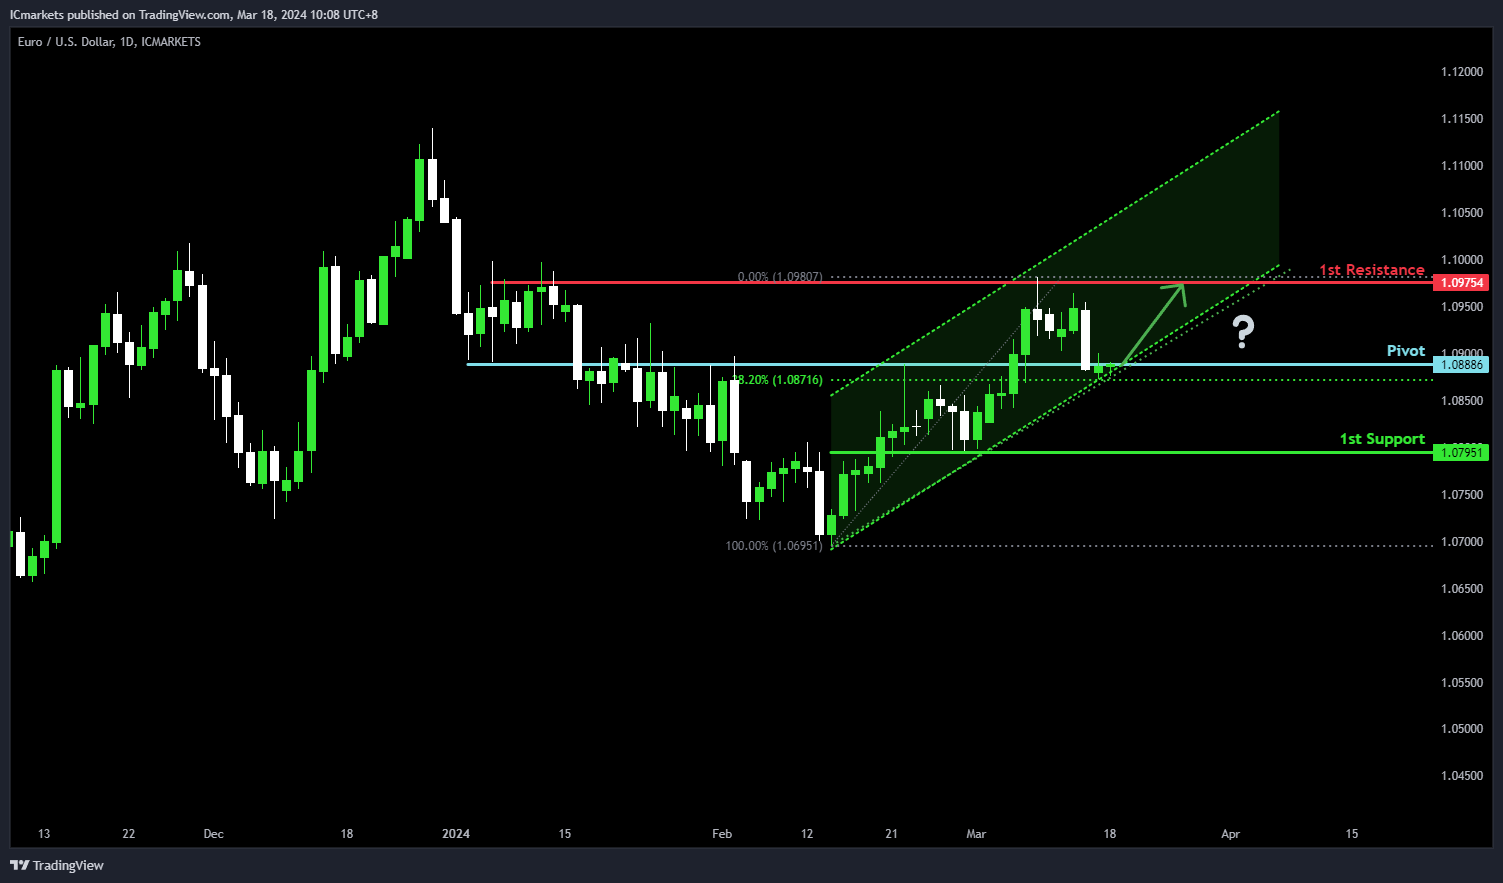
EUR/USD:
For EUR/USD, the potential direction is bullish, aligning with the overall bullish momentum of the chart. There’s a likelihood of a bullish bounce off the pivot level, indicating a move towards the 1st resistance.
The pivot at 1.0888 is identified as overlap support, coinciding with the 38.20% Fibonacci Retracement, suggesting a significant level where buying interest may emerge. Additionally, the 1st support at 1.0795 acts as multi-swing low support, historically significant for providing a floor to price declines.
On the resistance side, the 1st resistance at 1.0975 presents a formidable barrier, marked by multi-swing high resistance, potentially limiting further upward movement.
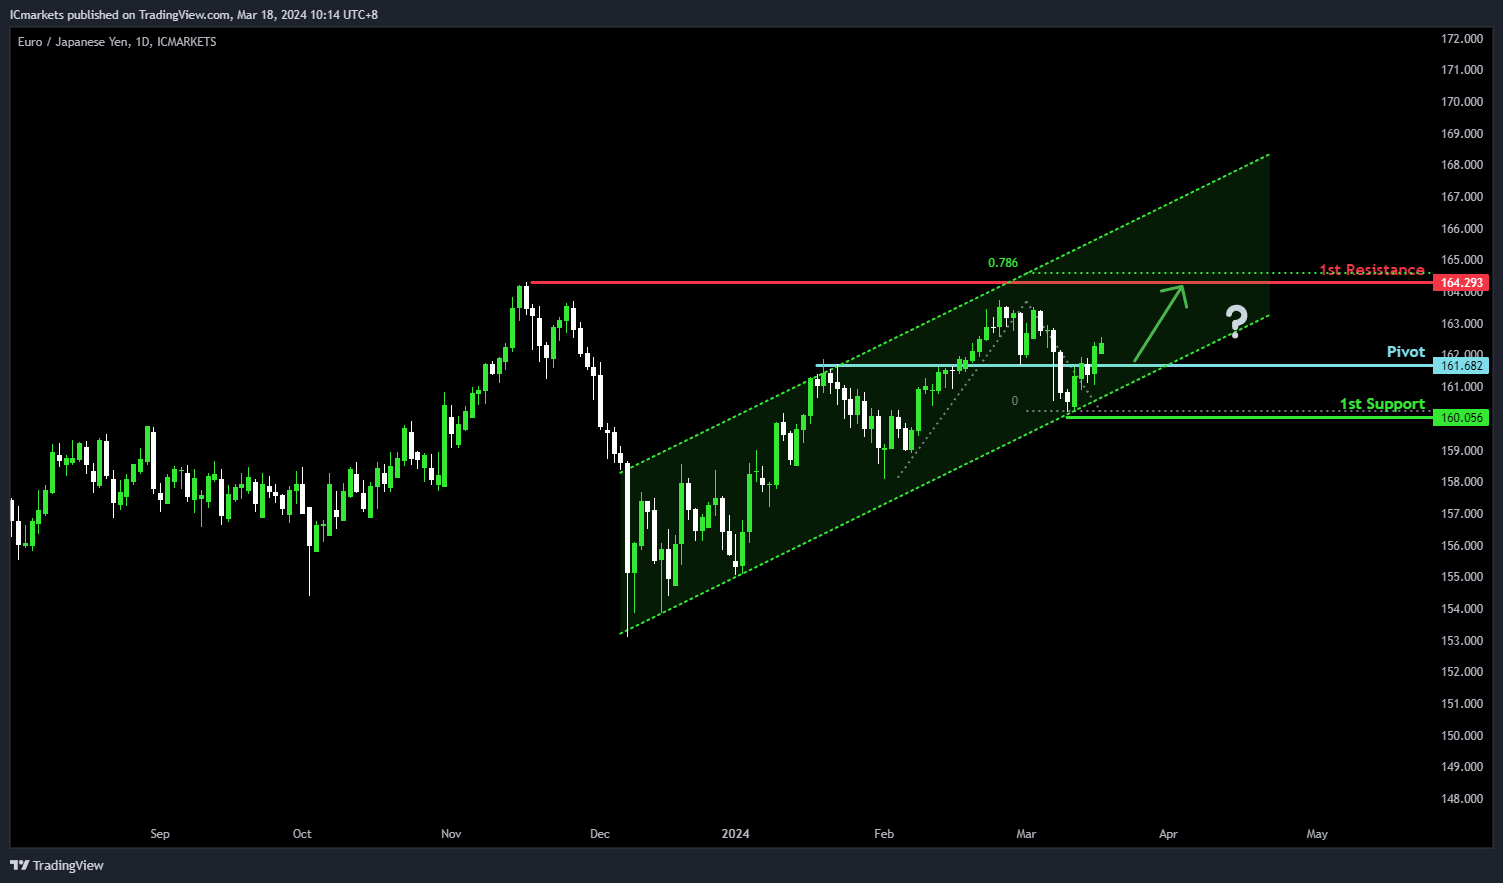
EUR/JPY:
For EUR/JPY, the potential direction is bullish, consistent with the overall bullish momentum of the chart. The price is currently within a bullish ascending channel, contributing to the upward momentum.
There’s a likelihood of a bullish bounce off the pivot level, indicating a move towards the 1st resistance. The pivot at 161.68 is identified as pullback support, suggesting a significant level where buying interest may emerge.
The 1st support at 160.05 acts as swing low support, further reinforcing its importance as a level where buyers have previously intervened.
On the resistance side, the 1st resistance at 164.29 forms a barrier, supported by the 78.60% Fibonacci Projection.
EUR/GBP:
For EUR/GBP, the potential direction is neutral, aligning with the overall neutral momentum of the chart. There’s a possibility of price fluctuating between the 1st resistance and 1st support levels.
The pivot at 0.85 is identified as multi-swing low support, indicating a significant level where buying interest might emerge. Additionally, the 1st support at 0.85 acts as swing low support, further reinforcing its importance as a level where buyers have previously intervened.
On the resistance side, the 1st resistance at 0.86 forms a barrier, supported by multi-swing high resistance. This level may attract selling pressure, potentially limiting further upward movement in the price.
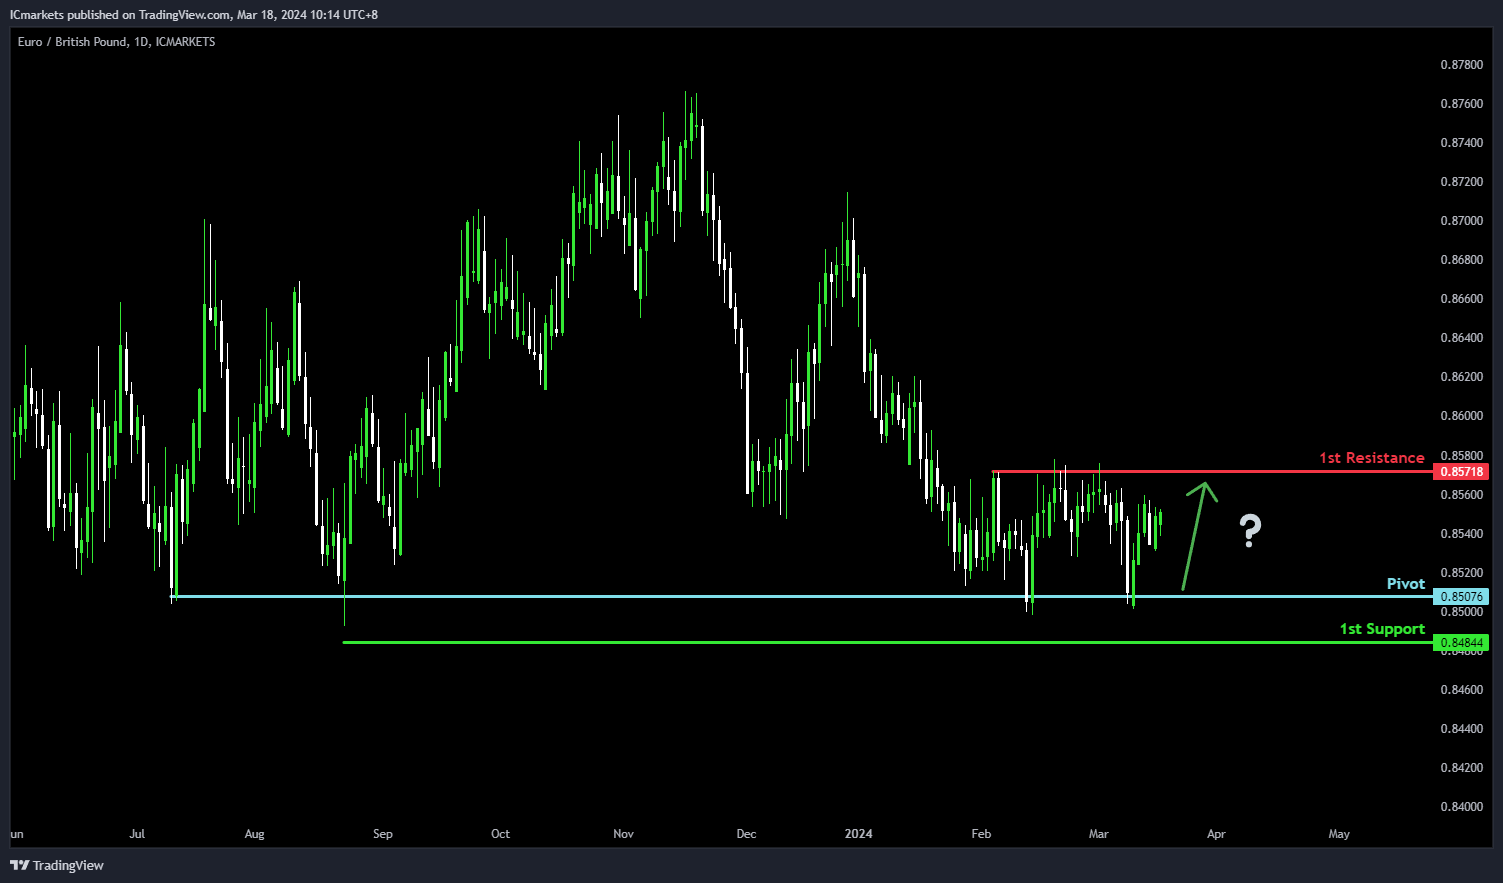
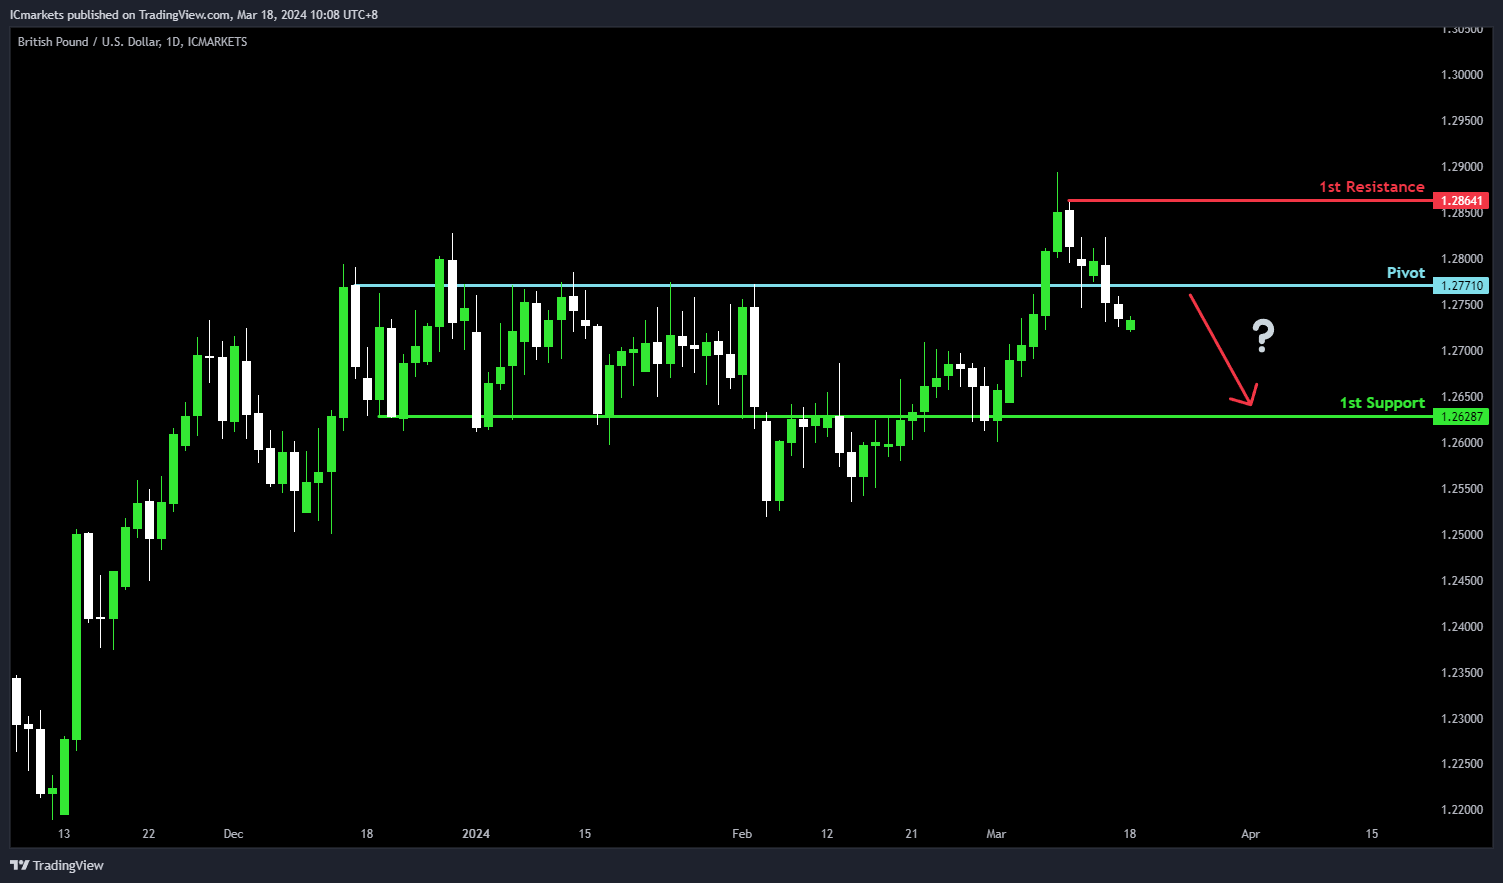
GBP/USD:
GBP/USD, the potential direction is bearish, although the overall momentum of the chart remains bullish. There’s a possibility of a bearish continuation towards the 1st support level.
The pivot at 1.2771 serves as pullback support, indicating a level where buyers might intervene to support the price, potentially halting the downward movement. Additionally, the 1st support at 1.2628 acts as overlap support, historically significant for providing a floor to price declines.
On the resistance side, the 1st resistance at 1.2864 presents a formidable barrier, marked by swing high resistance, potentially impeding further upward movement.
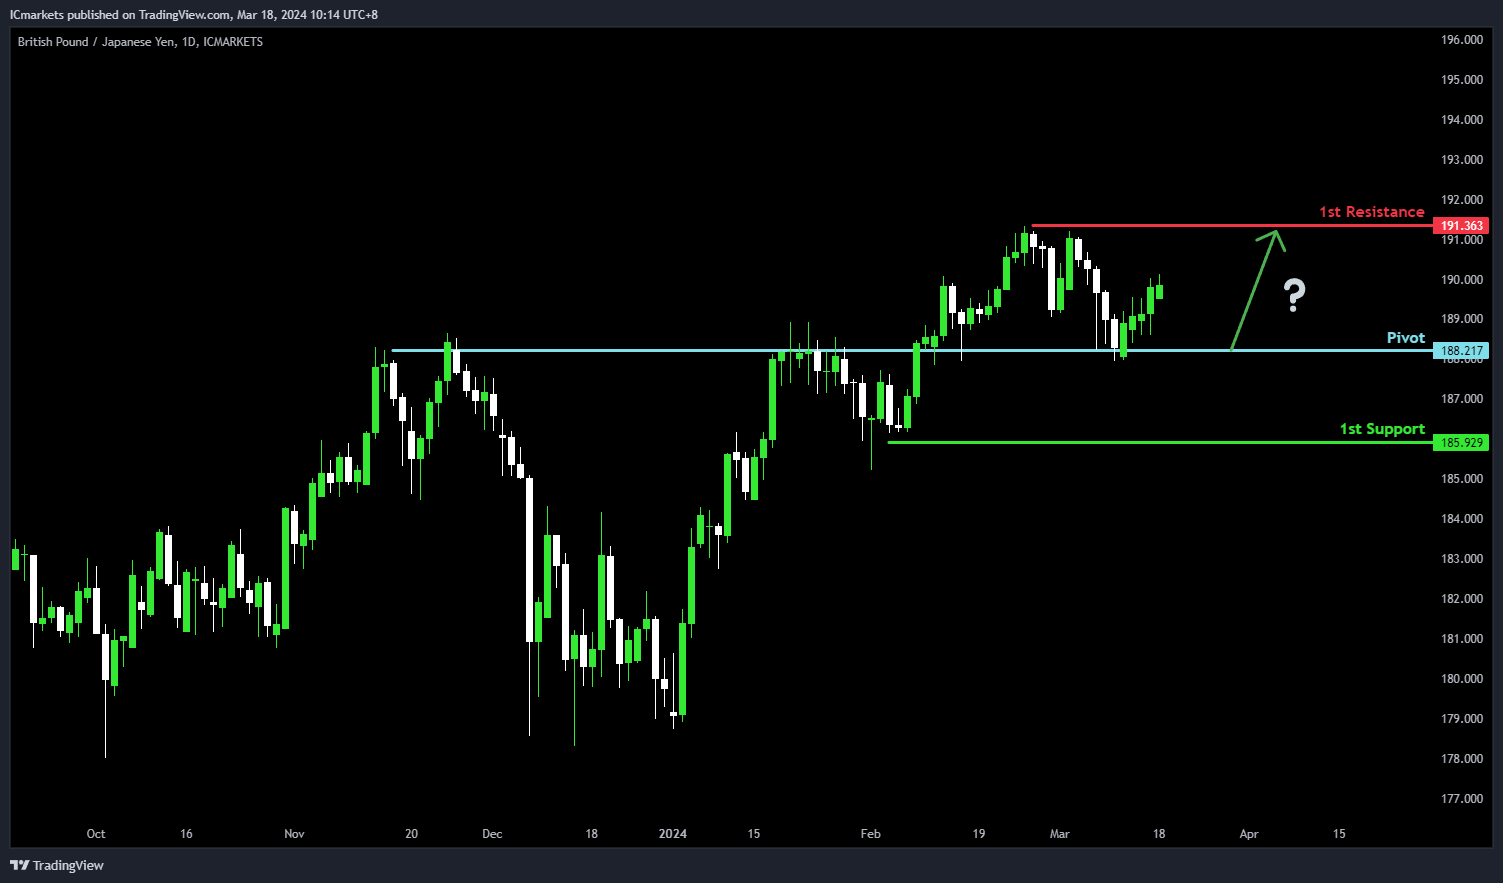
GBP/JPY:
For GBP/JPY, the potential direction is bullish, in line with the overall bullish momentum of the chart. There’s a possibility of a bullish continuation towards the 1st resistance.
The pivot at 188.21 is significant, acting as an overlap support level, indicating historical significance.
Additionally, the 1st support at 185.92 serves as swing low support, reinforcing its importance as a level where buying interest has been observed in the past.
On the resistance side, the 1st resistance at 191.36 forms a barrier, supported by multi-swing high resistance. This level may attract selling pressure, potentially limiting further upward movement in the price.
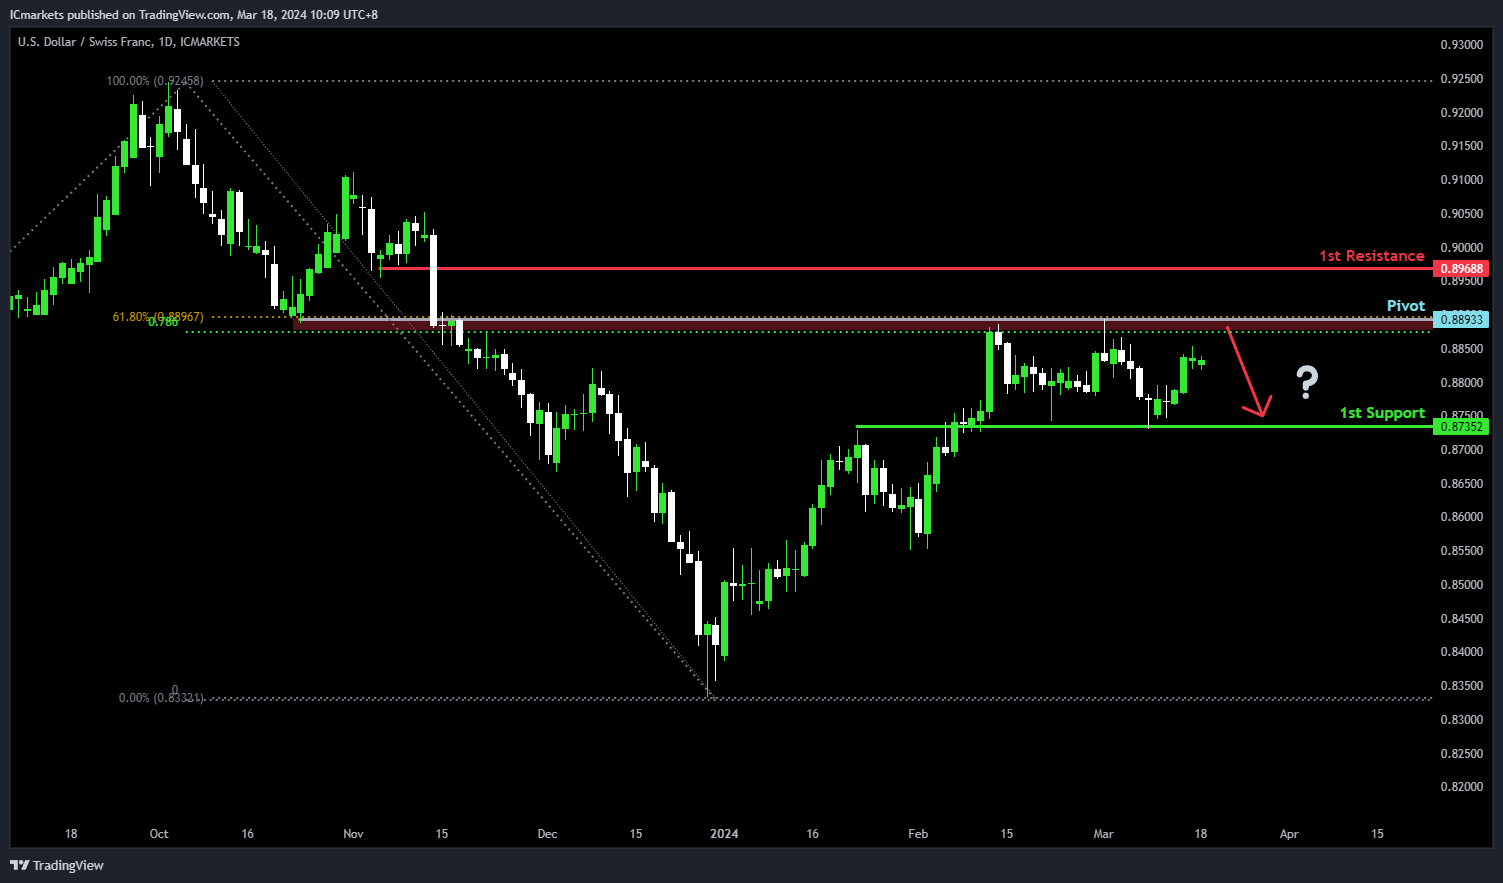
USD/CHF:
For USD/CHF, the potential direction is neutral, reflecting the overall neutral momentum of the chart. There’s a possibility of price fluctuation between the 1st resistance and 1st support levels.
The pivot at 0.8893 is marked by overlap resistance, reinforced by both the 61.80% Fibonacci Retracement and the 78.60% Fibonacci Projection, indicating a zone where selling pressure may intensify. This level could serve as a point of reference for potential resistance.
The 1st support at 0.8735 acts as overlap support, suggesting historical significance as a level where buying interest has been notable, potentially providing a floor to price declines.
Conversely, the 1st resistance at 0.8968 is identified as pullback resistance, indicating a potential barrier where selling pressure may increase, potentially limiting further upward movement in the price.
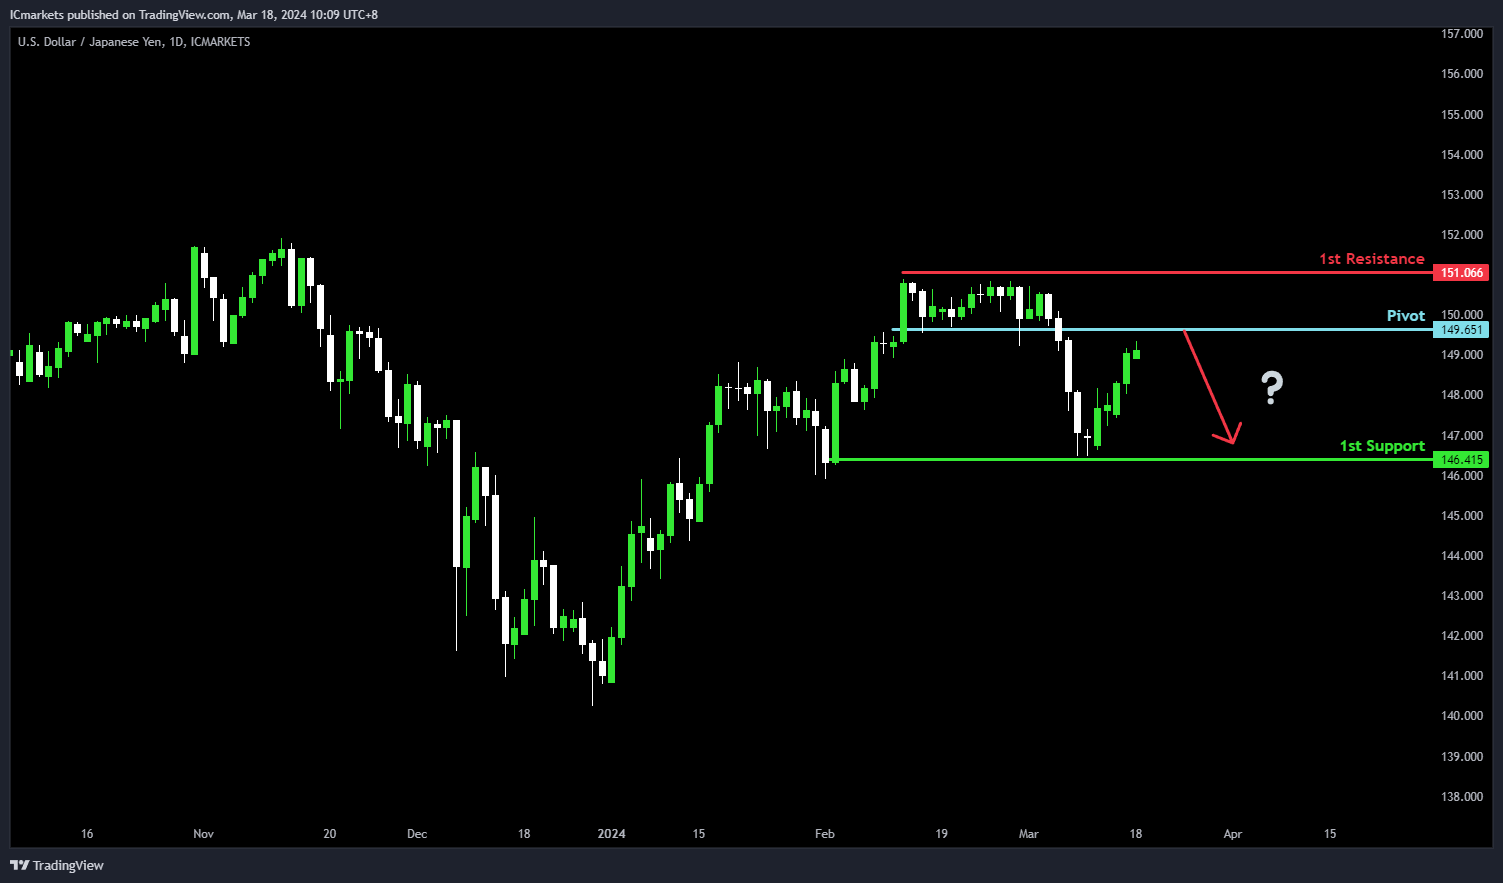
USD/JPY:
For USD/JPY, the potential direction remains bearish, aligned with the overall bearish momentum of the chart. There’s a likelihood of a bearish reaction from the pivot level, potentially leading to a drop towards the 1st support.
The pivot at 149.65 serves as significant pullback resistance, indicating a level where selling pressure could escalate. This level is reinforced by the presence of multi-swing high resistance.
Conversely, the 1st support at 146.41 is crucial, acting as multi-swing low support. This historical significance suggests a level where buying interest has been observed in the past.
On the resistance side, the 1st resistance at 151.06 forms a barrier, supported by multi-swing high resistance.
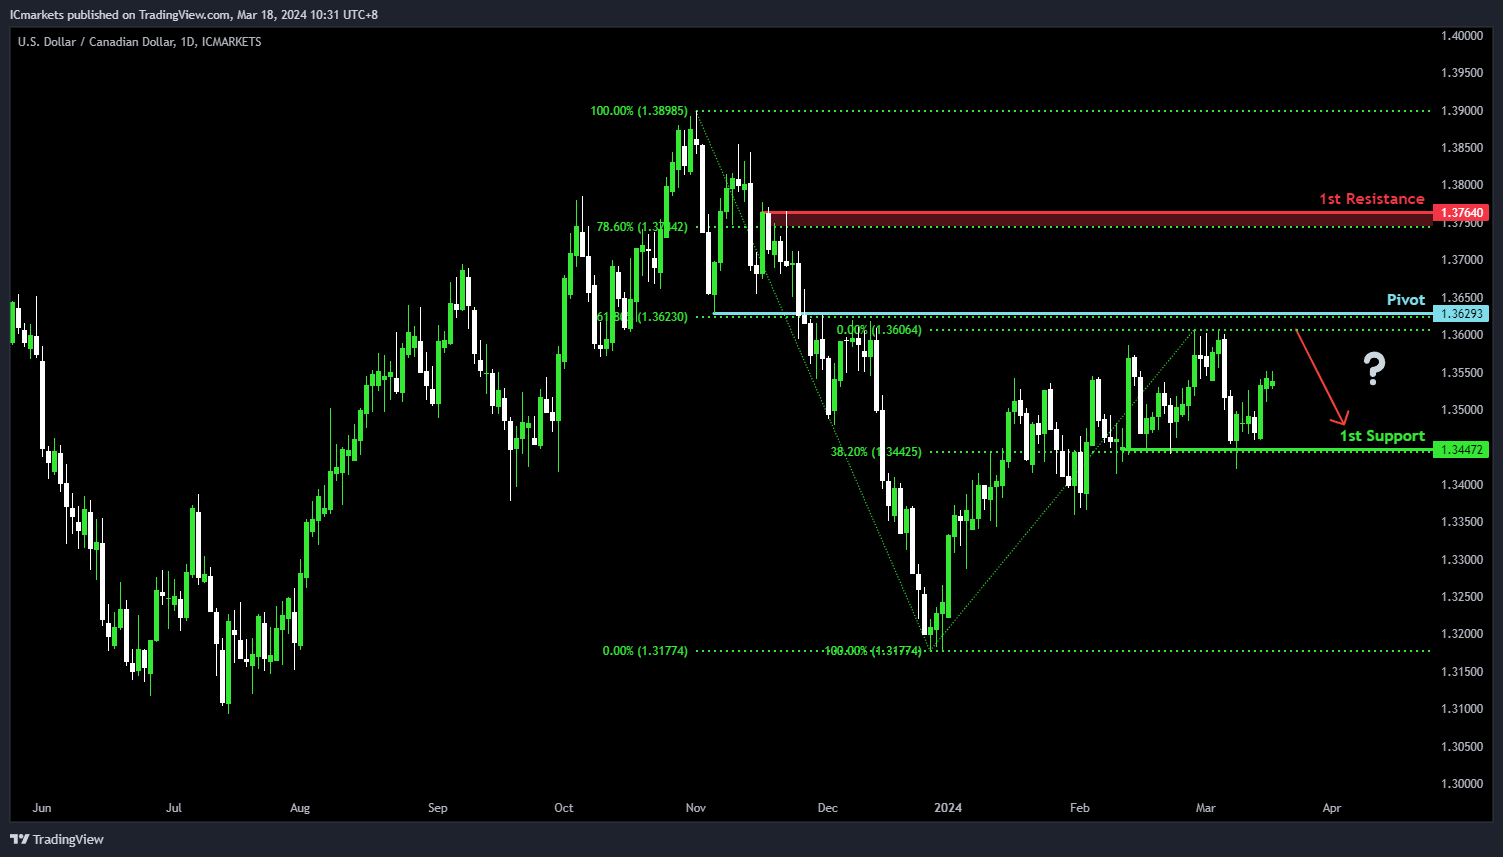
USD/CAD:
The USD/CAD chart currently demonstrates an overall bullish momentum. In this context, there is a potential scenario for price to rise towards the pivot and make a weak bearish reaction off this level.
The pivot level at 1.3629 is identified as an overlap resistance that aligns with the 61.80% Fibonacci Retracement level where price could potentially make a bearish reaction and drop lower. The 1st resistance level at 1.3764 is noted as a pullback resistance that aligns close to the 78.60% Fibonacci Retracement level, further highlighting its importance as a potential resistance zone.
To the downside, the 1st support level at 1.3447 is marked as a pullback support that aligns with the 38.20% Fibonacci Retracement level, reinforcing its significance as a key support level.
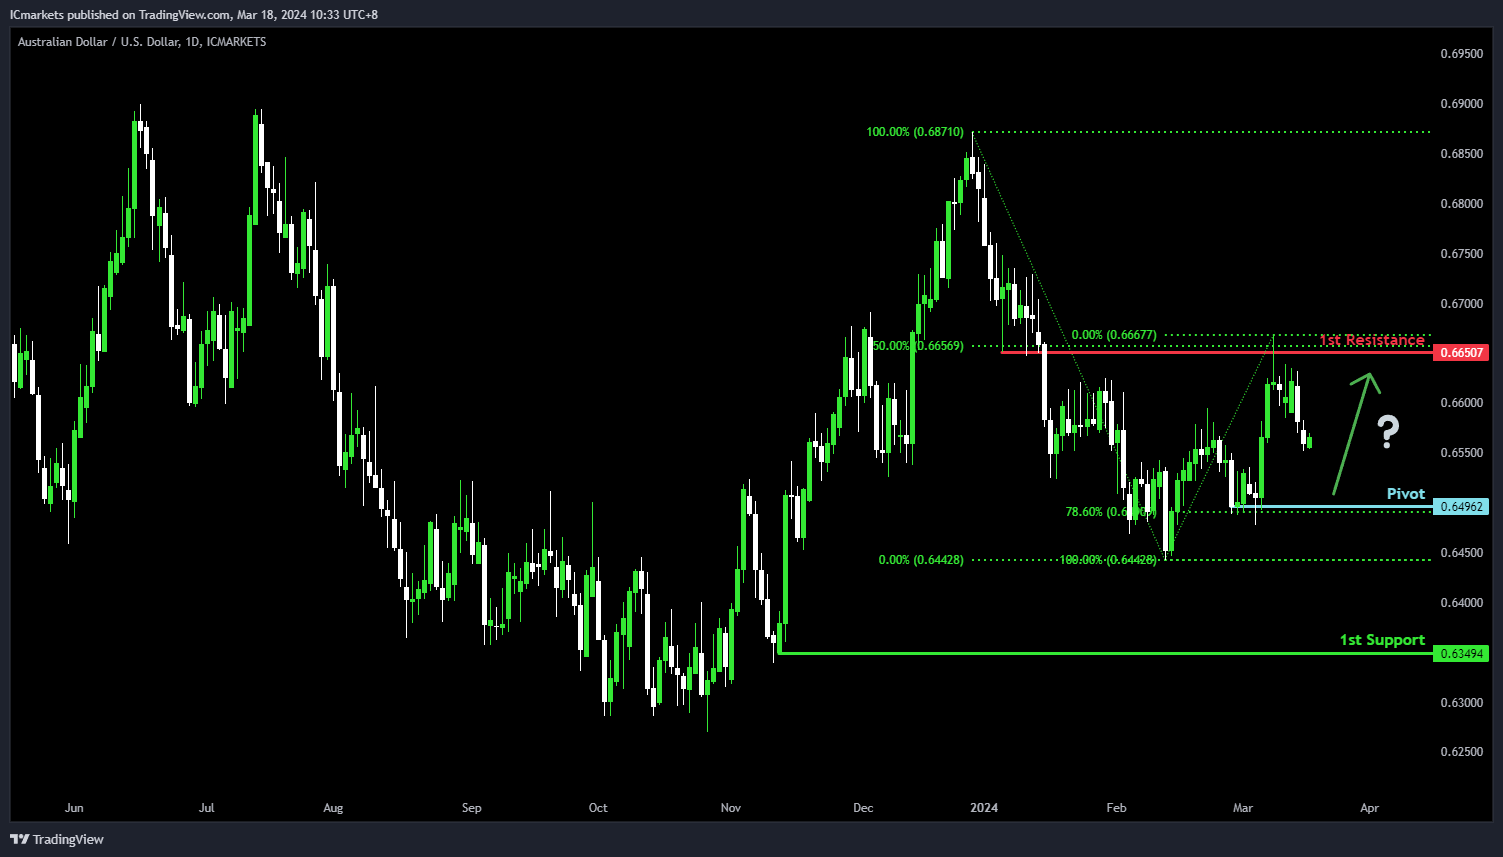
AUD/USD:
The AUD/USD chart currently demonstrates an overall bearish momentum. In this context, there is a potential scenario for price to drop towards the pivot and potentially make a weak bullish bounce towards the 1st resistance.
The pivot level at 0.6496 is identified as a pullback support that aligns with the 78.60% Fibonacci Retracement level where price could potentially reverse from to climb higher. The 1st resistance level at 0.6650 is noted as an overlap resistance that aligns with the 50.00% Fibonacci Retracement level, potentially limiting any further upward movement.
On the support side, the 1st support level at 0.6349 is marked as a pullback support, reinforcing its significance as a key support level.
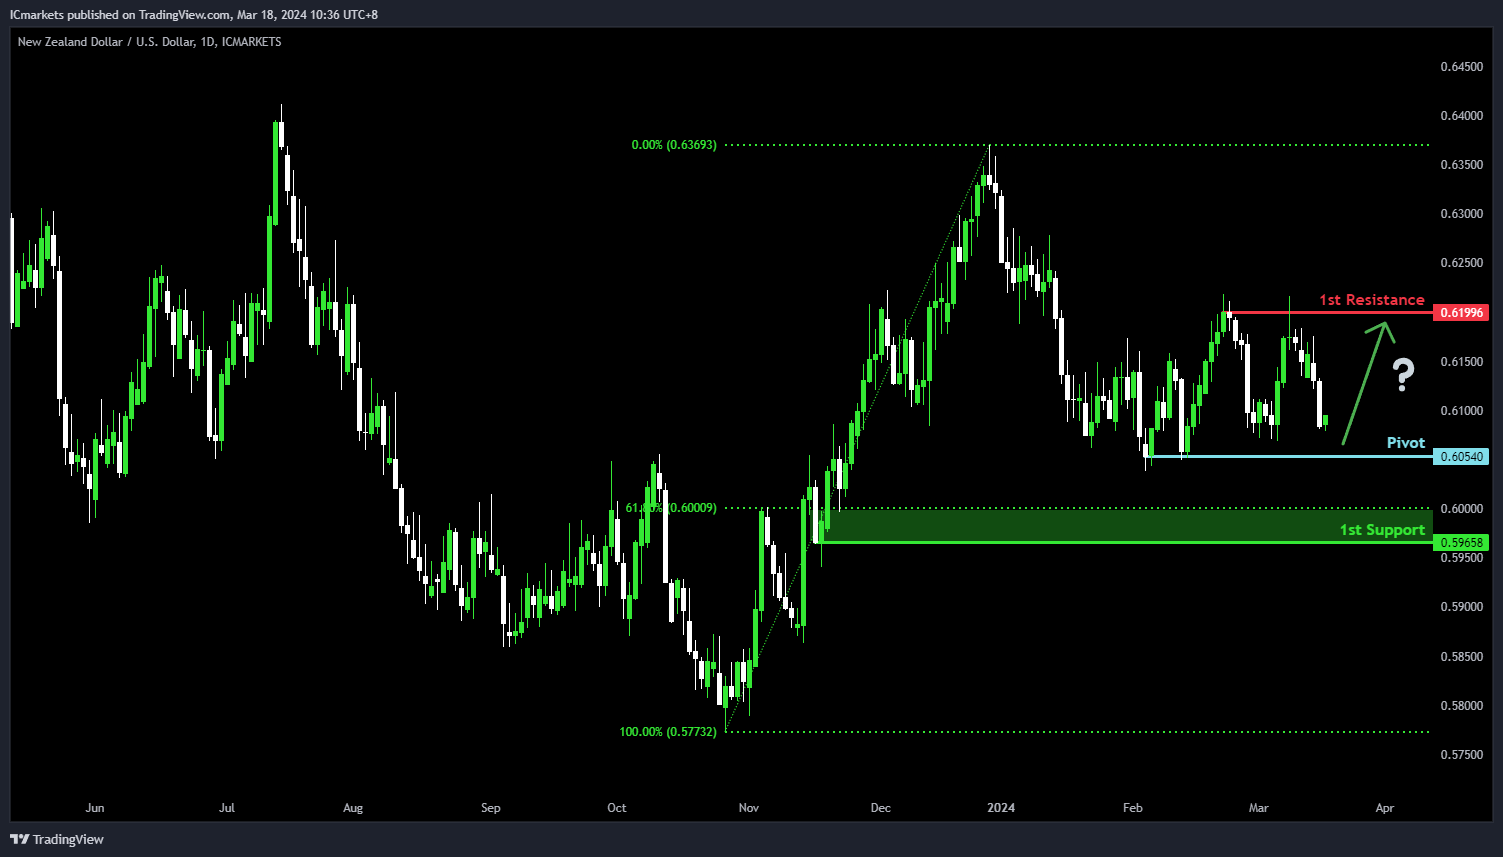
NZD/USD
The NZD/USD chart currently demonstrates an overall bearish momentum. In this context, there is a potential scenario for price to drop towards the pivot and potentially make a weak bullish bounce towards the 1st resistance.
The pivot level at 0.6054 is identified as a pullback support where price could potentially reverse from to climb higher. The 1st resistance level at 0.6199 is noted as a pullback resistance, potentially limiting any further upward movement.
On the support side, the 1st support level at 0.5965 is marked as a pullback support that aligns close to the 61.80% Fibonacci Retracement level, reinforcing its significance as a key support level.
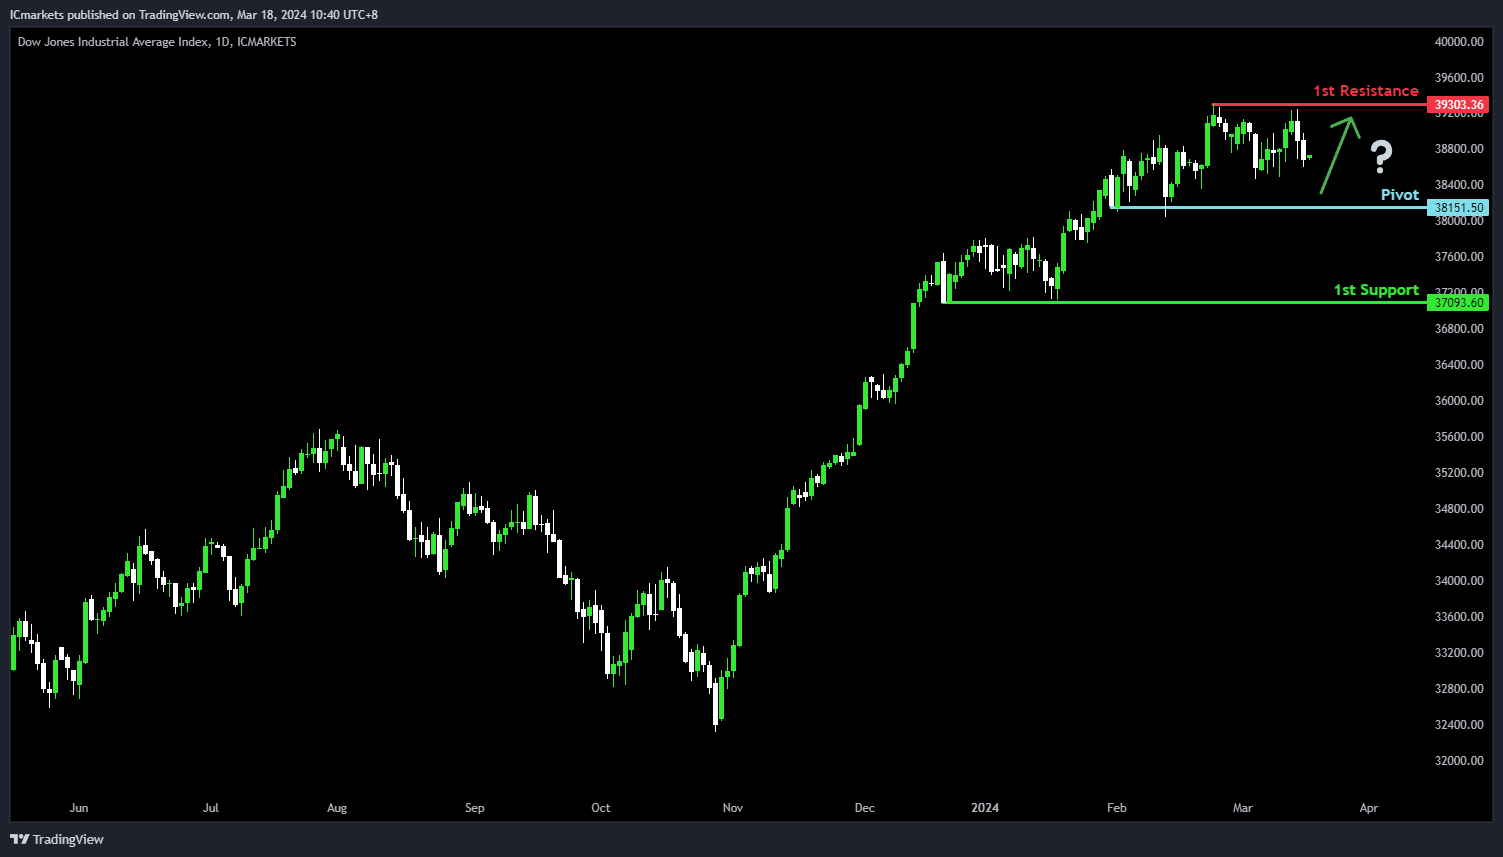
DJ30:
The DJ30 chart currently demonstrates an overall bullish momentum. In this context, there is a potential scenario for price to make a bullish bounce off the pivot and rise towards the 1st resistance.
The pivot level at 38,151.50 is identified as a pullback support where price could potentially make a bullish bounce and climb higher. The 1st resistance level at 39,303.36 is noted as a pullback resistance at the all-time high, further highlighting its importance as a potential resistance zone.
To the downside, the 1st support level at 37,093.60 is marked as a pullback support, reinforcing its significance as a key support level.
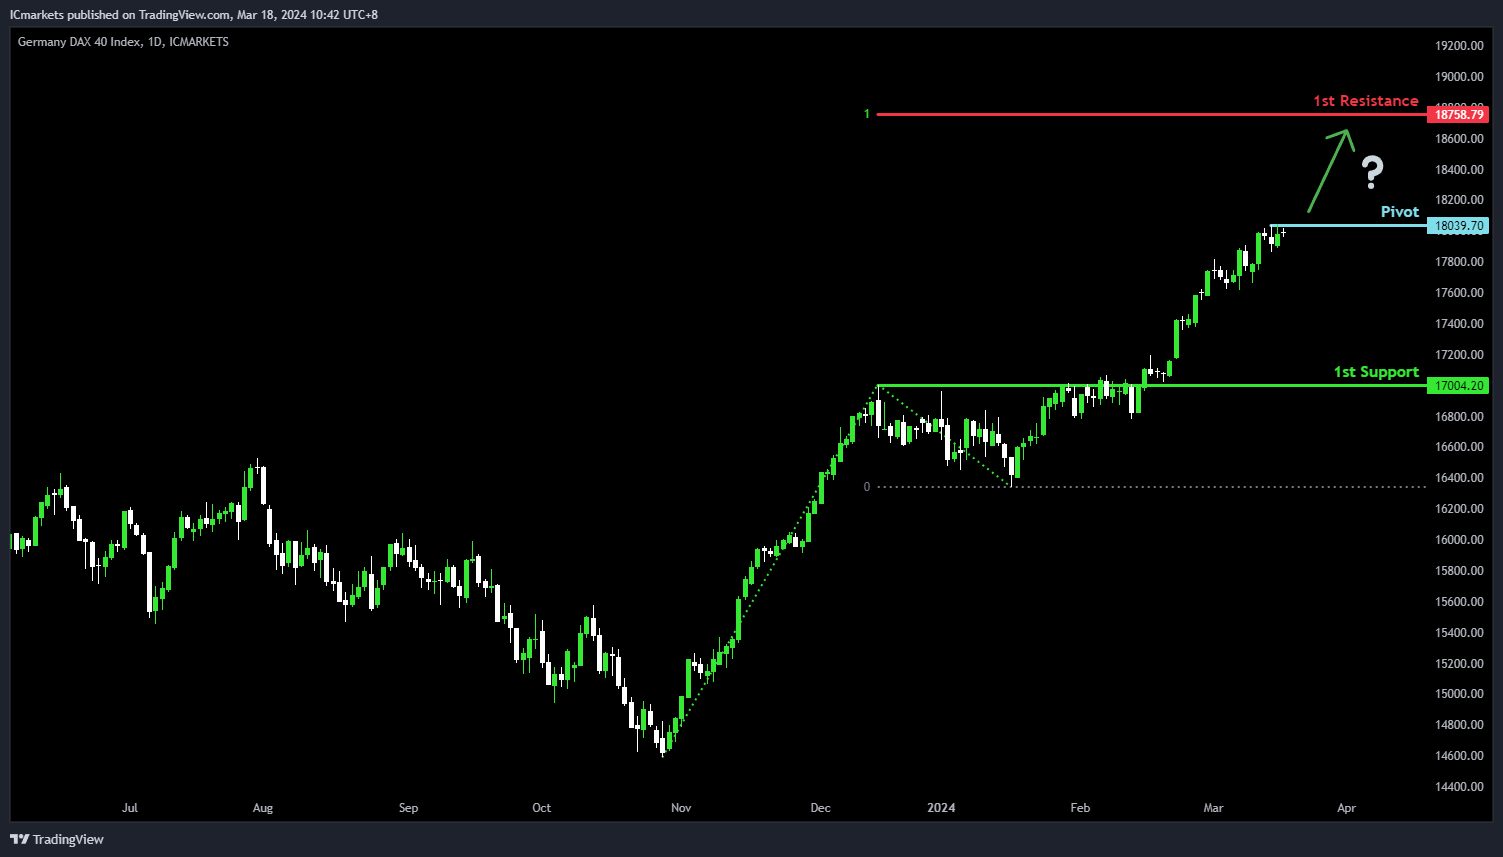
GER40:
The GER40 chart currently demonstrates an overall bullish momentum. In this context, there is a potential scenario for price to make a bullish break above the pivot and rise towards the 1st resistance.
The pivot level at 18,039.70 is identified as a pullback resistance where price could potentially make a bullish breakout and climb higher. The 1st resistance level at 18,758.749 is noted as a resistance that aligns with the 100.00% Fibonacci Projection level, further highlighting its importance as a potential resistance zone.
To the downside, the 1st support level at 17,004.20 is marked as an overlap support, reinforcing its significance as a key support level.
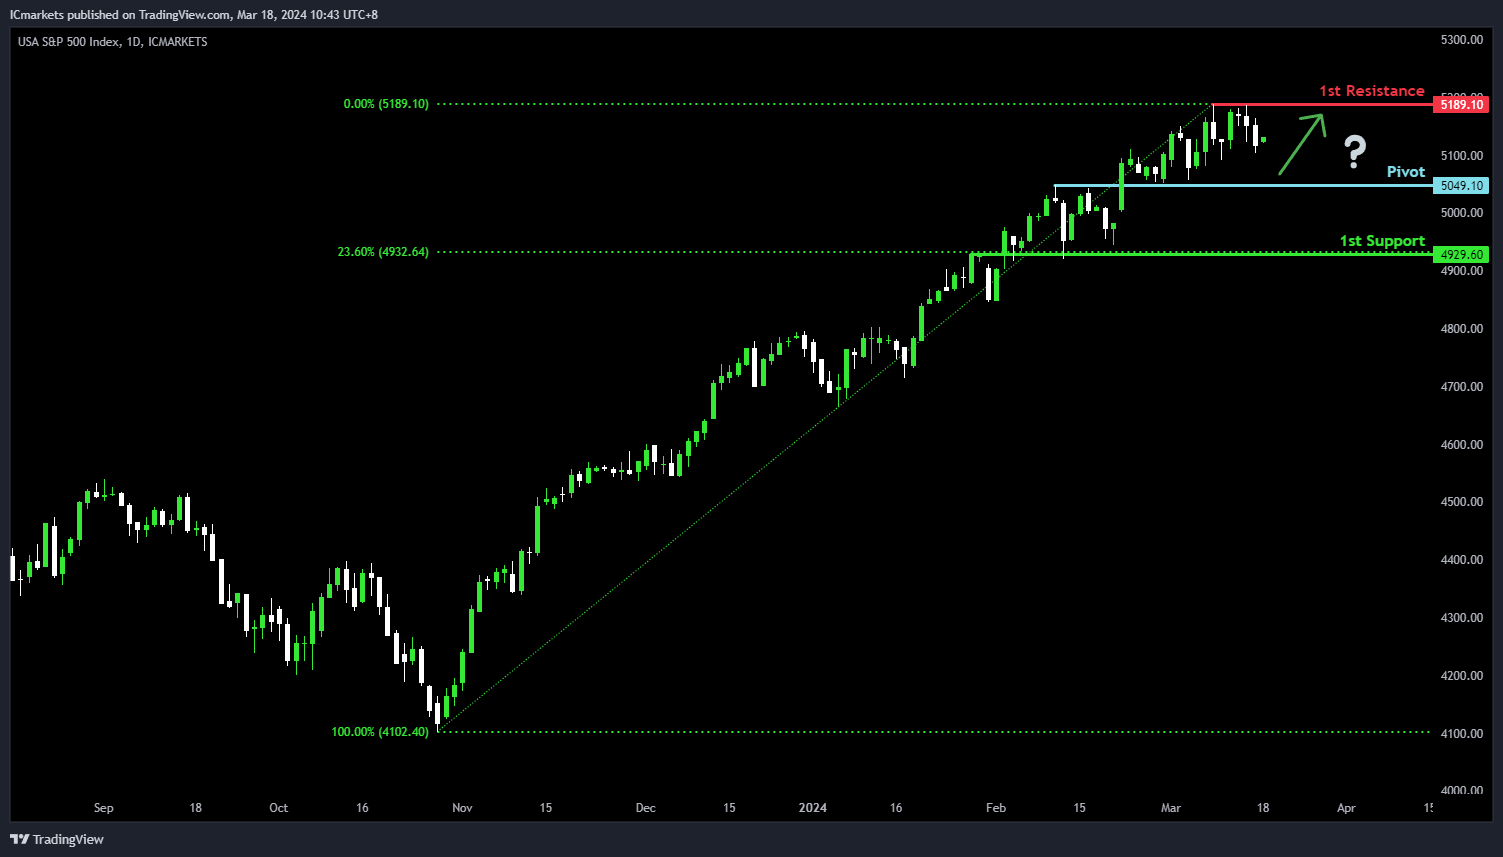
US500:
The US500 chart currently demonstrates an overall bullish momentum. In this context, there is a potential scenario for price to make a bullish bounce off the pivot and rise towards the 1st resistance.
The pivot level at 5,049.10 is identified as an overlap support where price could potentially make a bullish bounce and climb higher. The 1st resistance level at 5,189.10 is noted as a pullback resistance at the all-time high, further highlighting its importance as a potential resistance zone.
To the downside, the 1st support level at 4,929.60 is marked as an overlap support that aligns with the 23.60% Fibonacci Retracement level, reinforcing its significance as a key support level.
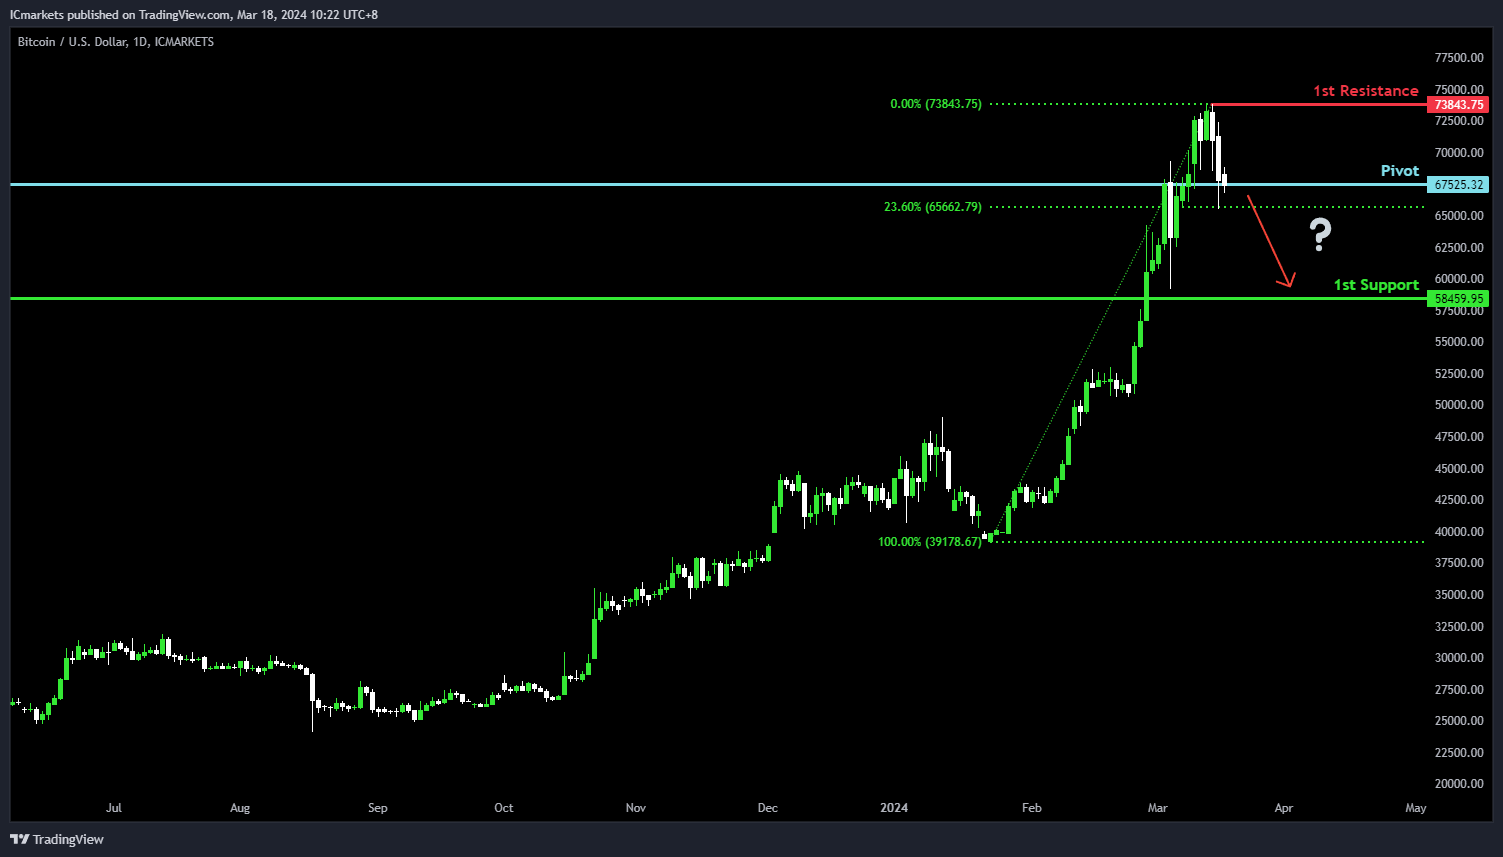
BTC/USD:
The BTC/USD chart currently demonstrates an overall bearish momentum. In this context, there is a potential scenario for price to break below the pivot and drop towards the 1st support.
The pivot level at 67,525.32 is identified as an overlap support that aligns close to the 23.60% Fibonacci Retracement level where price could potentially make a bearish breakout. The 1st support level at 58,459.95 is also marked as an overlap support, reinforcing its significance as a key support level.
To the upside, The 1st resistance level at 73,843.75 is noted as a pullback resistance at the all-time high, further reinforcing its significance as a potential barrier to further bullish movement.
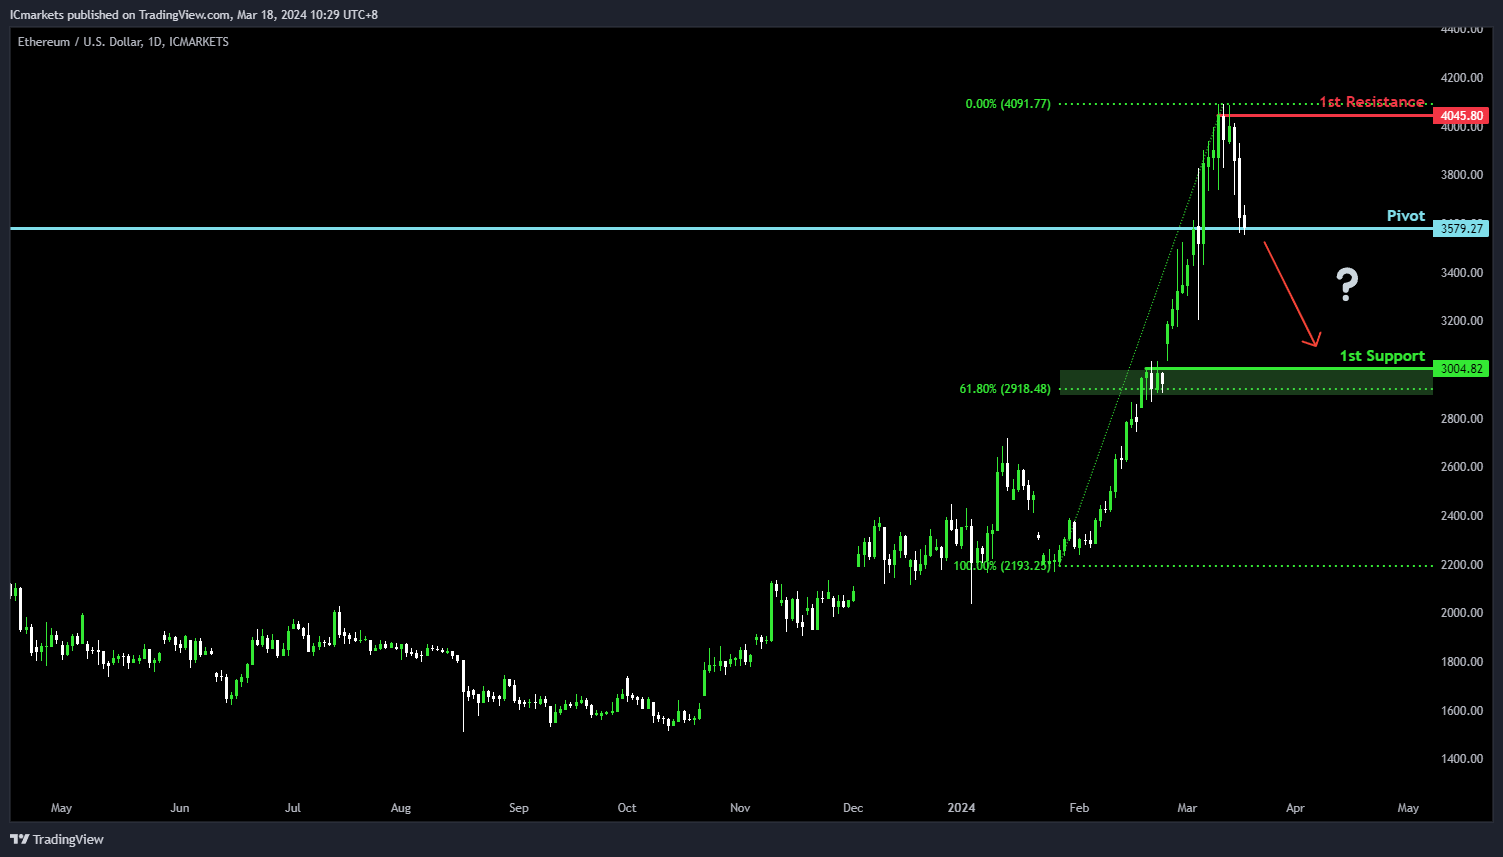
ETH/USD:
The ETH/USD chart currently demonstrates an overall bearish momentum. In this context, there is a potential scenario for price to break below the pivot and drop towards the 1st support.
The pivot level at 3,579.27 is identified as an overlap support where price could potentially make a bearish breakout. The 1st support level at 3,004.82 is marked as a pullback support that aligns close to the 61.80% Fibonacci Retracement level, reinforcing its significance as a key support level.
To the upside, The 1st resistance level at 4,045.80 is noted as a pullback resistance, further reinforcing its significance as a potential barrier to further bullish movement.
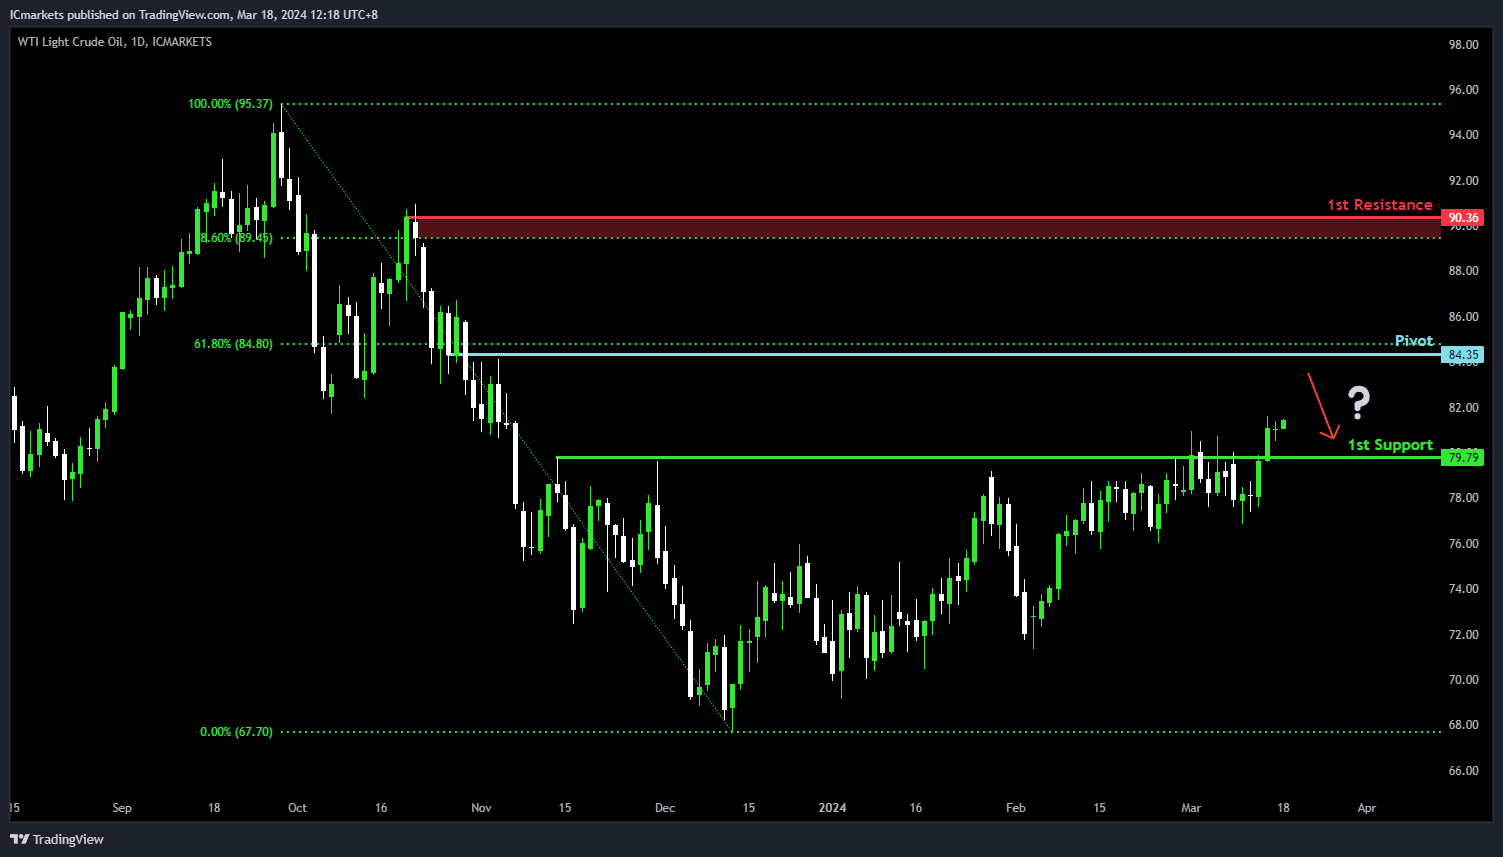
WTI/USD:
The WTI (West Texas Intermediate) chart currently demonstrates an overall bullish momentum. In this context, there is a potential scenario for price to rise towards the pivot and make a weak bearish reaction off this level.
The pivot level at 84.35 is identified as an overlap resistance that aligns with the 61.8% Fibonacci Retracement level where price could potentially make a weak bearish reaction. The 1st resistance level at 90.36 is noted as a pullback resistance that aligns close to the 78.60% Fibonacci Retracement level, further reinforcing its significance as a potential barrier to further bullish movement.
To the downside, the 1st support level at 79.79 is marked as a pullback support, reinforcing its significance as a key support level.
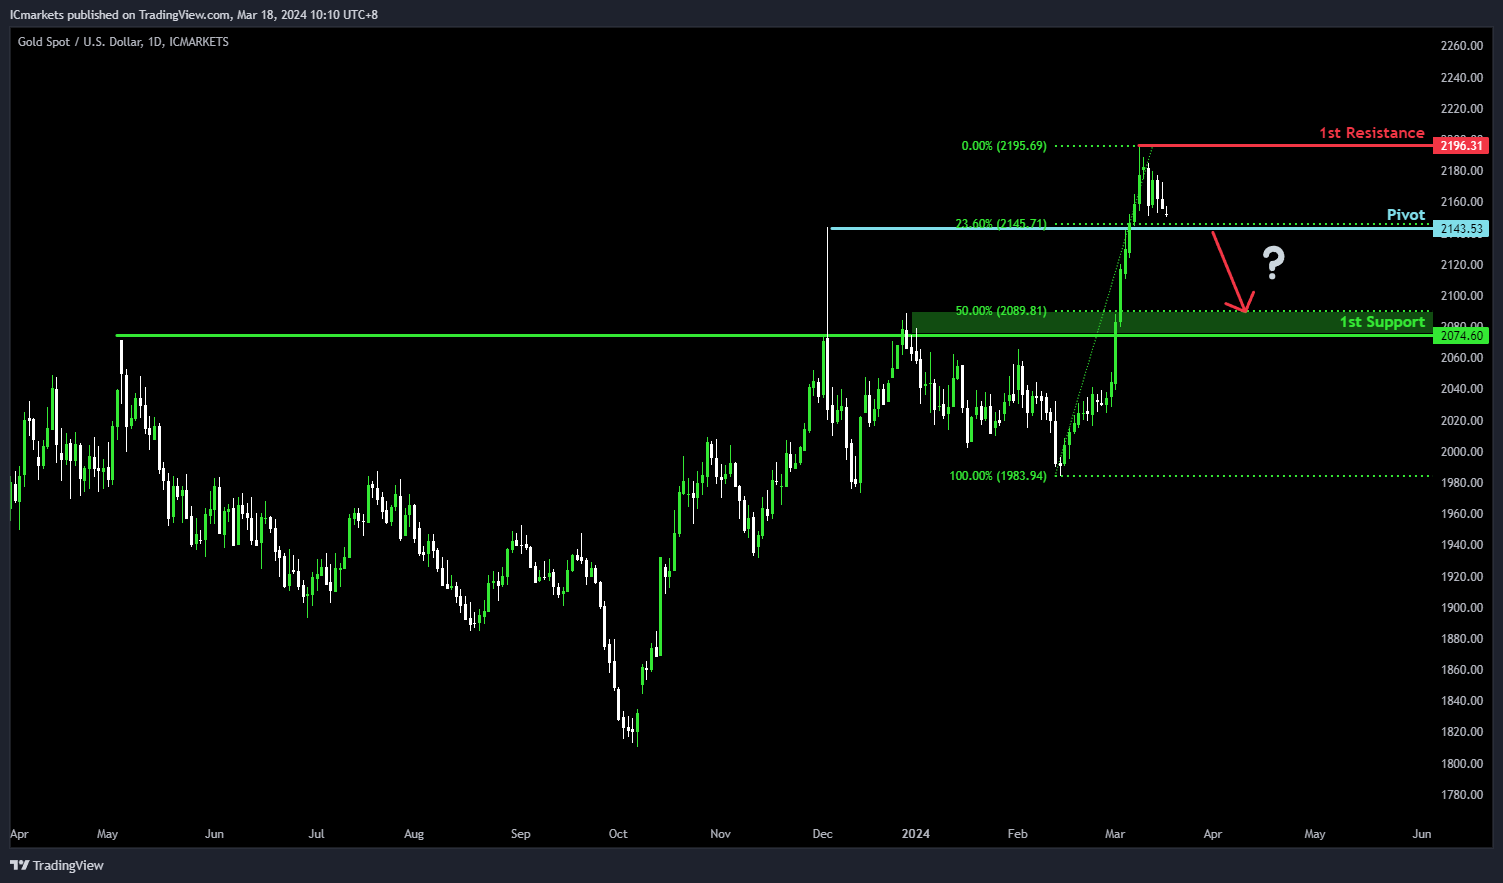
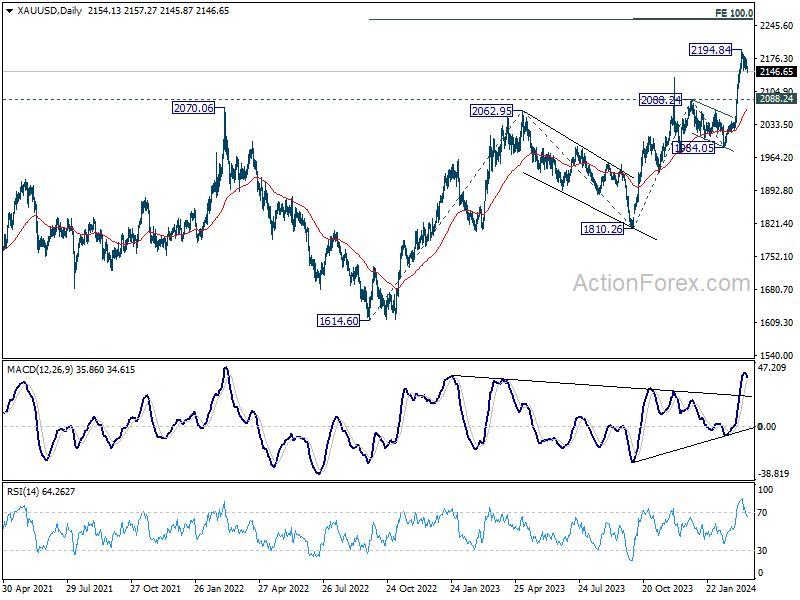
XAU/USD (GOLD):
For XAU/USD, despite the overall bullish momentum of the chart, there’s a potential scenario where the price could exhibit a bearish break off the pivot level, leading to a drop towards the 1st support.
The pivot at 2143.53 is crucial, acting as pullback support and coinciding with the 23.60% Fibonacci Retracement. This suggests a significant level where buying interest might emerge.
However, the 1st support at 2074.60 is also notable, serving as pullback support and aligning with the 50% Fibonacci Retracement. This further reinforces its significance as a level where buyers could intervene.
On the resistance side, the 1st resistance at 2196.31 forms a barrier, supported by swing high resistance. This level may attract selling pressure, potentially limiting further upward movement in the price.
AUD/USD Daily Report
Daily Pivots: (S1) 0.6546; (P) 0.6566; (R1) 0.6579; More...
Intraday bias in AUD/USD stays on the downside as fall from 0.6666 short term top is in progress. Deeper decline would be seen to 0.6476 support first. Break there will argue that decline from 0.6870 is ready to resume through 0.6442 low. On the upside, break of 0.6629 minor resistance will turn bias back to the upside to extend the rebound from 0.6442 instead.
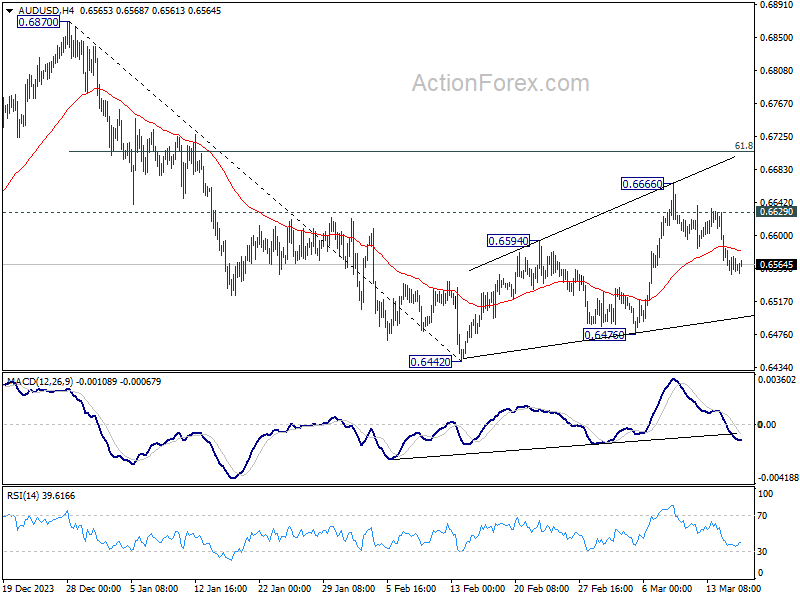
In the bigger picture, price actions from 0.6169 (2022 low) are seen as a medium term corrective pattern to the down trend from 0.8006 (2021 high). Fall from 0.7156 (2023 high) is seen as the second leg, which might still be in progress. Overall, sideway trading could continue in range of 0.6169/7156 for some more time. But as long as 0.7156 holds, an eventual downside breakout would be mildly in favor.
Caution Prevails as Markets Brace for Central Bank Frenzy and Economic Data
Yen softened slightly in Asian session today, influenced by a robust rebound in strong rebound in Nikkei. Meanwhile, New Zealand Dollar received a modest boost, buoyed by an upturn in the country's services data. This was mirrored by the Australian Dollar, which, along with the Kiwi, found support in the latest batch of Chinese economic indicators. These revealed an encouraging improvement in China's industrial sector as the year commenced, painting a brighter outlook for the region. However, movements across these currencies, as well as the broader forex markets, remain subdued at the moment.
The atmosphere of caution among traders is palpable, as the financial markets gear up for a week laden with five major central bank meetings and a slew of critical global economic data covering inflation, activity, sentiment, retail sales, and employment. BoJ is set to start this central bank bonanza on Tuesday, with RBA following suit. FOMC will then take center stage on Wednesday, with SNB and BoE concluding the week's meetings on Thursday. Each of these gatherings carries some surprise elements that could significantly impact the markets.
Technically, Gold should have formed a short term top at 2194.84, and more consolidation should be seen in the near term. There is prospect of deeper pull back, in particular if Dollar strengthens after FOMC. But downside should be contained by 2088.24 resistance turned support to bring up trend resumption.
The impending global monetary easing this year and next, coupled with escalating geopolitical risks, presents a favorable backdrop for Gold. The precious metal should target cluster projection level around 2260 before topping (100% projection of 1810.26 to 2088.24 from 1984.05 at 2262.03 and 100% projection of 1614.60 to 2062.95 from 1810.26 at 2259.15).
In Asia, at the time of writing, Nikkei is up 2.37%. Hong Kong HSI is up 0.11%. China Shanghai SSE is up 0.52%. Singapore Strait Times is flat. Japan 10-year JGB yield is down -0.026 at 0.767.
NZ BNZ services rises to 53.0, signs of early and strong growth emerge
New Zealand's BusinessNZ Performance of Services Index climbed from 52.2 to 53.0 in February, marking its highest point since March 2023.
A closer examination of the index's components reveals a generally positive picture. Activity and sales maintained steady pace, inching slightly up from 53.0 to 53.1. Employment saw modest increase, moving closer to the expansionary threshold by rising from 48.3 to 49.1. Notably, new orders and business surged significantly from 52.4 to 56.0, the highest level recorded since December 2022.
The feedback from businesses highlighted persistent concerns, with the proportion of negative comments standing at 57.3% in February, a slight improvement from December's 58.7% but an increase from January's 53.0%. Businesses continue to identify the cost of living as the primary factor influencing activity, alongside the difficulties posed by the overall economic conditions.
BNZ's Head of Research Stephen Toplis said that "when we combine the PMI and PSI together to get an indicator of activity, there is a strong suggestion of growth returning later this year. The turnaround occurs a little stronger and earlier than we are forecasting but, whatever the case, it is a heartening sign".
China's industrial production expand 7% yoy, retail sales up 5.5% yoy
China's industrial production grew 7.0% yoy in the January-February period , above expectation of 5.3% yoy. During the same period, retail sales rose 5.5% yoy, below expectation 5.6% yoy.
Fixed asset investment rose 4.2% yoy, above expectation of 3.2% yoy. Investment into real estate fell by -9% yoy. Investment in infrastructure rose by 6.3% yoy while that in manufacturing increased by 9.4% yoy.
"The economy kept rebounding and improving in January and February with various policies taking effect. But we also need to see that the external environment is increasingly complex, grim and uncertain, and the problem of insufficient domestic demand still remains. The foundation for the economy's rebound needs to be further solidified," NBS said.
Five central bank decisions and economic data galore
The upcoming week promises to be a whirlwind for financial markets worldwide, one of the most anticipated periods in the financial calendar for the year, packed with five major central bank meetings and a deluge of significant economic data releases globally.
Central bank marathon: Key things to watch
BoJ kicks off this central bank marathon on Tuesday, with market participants keenly awaiting its decision on whether to exit its negative interest rate policy. This follows encouraging results from recent wage negotiations in Japan. Yet, the central bank could also opt for a delay to act in April. On the same day, RBA is expected to hold its interest rate steady at 4.35%, and focus is on whether the central bank would finally drop hawkish bias.
The spotlight then shifts to FOMC meeting on Wednesday. While interest rates are anticipated to remain at 5.25-5.50%, all eyes will be on Fed's new economic projections. The key question is whether the updated dot plot will still signal three rate cuts for the year, especially in light of recent data that underscore the persistent nature of inflation, or less.
Thursday sees decisions from both SNB and BoE. Expectations for SNB lean towards holding rates at 1.75%, though there's a notable minority predicting a rate cut — the first among major central banks. Additionally, SNB's commentary on Franc's strength, a growing concern for the Swiss economy, will be closely scrutinized.
BoE, on the other hand, is expected to maintain interest rates at 5.25%, reiterate that it's in no hurry to cut interest rates. The outcome of the vote split, given the diverse opinions among BoE members, will be particularly telling. Last time, Jonathan Haskel and Catherine Mann voted for a 25 bps hike while Swati Dhingra voted for a cut, with others voted for a hold.
Beyond these decisions, BoC is slated to release summary of deliberations. ECB will also contribute to the week's insights by publishing monthly economic bulletin.
Economic data deluge
On the data front, PMIs from Australia, Japan, Eurozone, UK, and US are set to be released, offering a snapshot of business conditions, price pressures and employment situation. CPI figures from Japan, UK, and Canada will be closely watched, as will sentiment indicators from Germany (ZEW and Ifo). Retail sales data from UK and Canada, Australian employment, New Zealand's GDP, and a suite of data from China, including industrial production, retail sales, and fixed asset investment, will round out a week rich in potential market-moving information.
Here are some highlights for the week:
- Monday: New Zealand BNZ services; Japan machine orders; China industrial production, retail sales, fixed asset investment; Eurozone CPI final, trade balance; Canada IPPI, RMPI; US NAHB housing index.
- Tuesday: BoJ rate decision; RBA rate decision; Swiss Trade balance, SECO economic forecasts; Germany ZEW; Canada CPI; US building permits and housing starts.
- Wednesday: Germany PPI; UK CPI, PPI; Eurozone consumer confidence; BoC summary of deliberations; FOMC rate decisions.
- Thursday: New Zealand GDP; Australia PMIs, employment: Japan trade balance, PMIs; Eurozone PMIs, ECB monthly bulletin; SNB rate decision; UK PMIs, BoE rate decision; Canada new housing price index; US jobless claims, Philly Fed survey, PMIs, existing home sales.
- Friday: New Zealand trade balance; UK Gfk consumer sentiment, retail sales; Germany import price, Ifo Canada retail sales.
AUD/USD Daily Report
Daily Pivots: (S1) 0.6546; (P) 0.6566; (R1) 0.6579; More...
Intraday bias in AUD/USD stays on the downside as fall from 0.6666 short term top is in progress. Deeper decline would be seen to 0.6476 support first. Break there will argue that decline from 0.6870 is ready to resume through 0.6442 low. On the upside, break of 0.6629 minor resistance will turn bias back to the upside to extend the rebound from 0.6442 instead.
In the bigger picture, price actions from 0.6169 (2022 low) are seen as a medium term corrective pattern to the down trend from 0.8006 (2021 high). Fall from 0.7156 (2023 high) is seen as the second leg, which might still be in progress. Overall, sideway trading could continue in range of 0.6169/7156 for some more time. But as long as 0.7156 holds, an eventual downside breakout would be mildly in favor.
Economic Indicators Update
| GMT | Ccy | Events | Actual | Forecast | Previous | Revised |
|---|---|---|---|---|---|---|
| 21:30 | NZD | Business NZ PSI Feb | 53 | 52.1 | 52.2 | |
| 23:50 | JPY | Machinery Orders M/M Jan | -1.70% | -0.70% | 2.70% | |
| 02:00 | CNY | Industrial Production Y/Y Feb | 7.00% | 5.30% | 6.80% | |
| 02:00 | CNY | Retail Sales Y/Y Feb | 5.50% | 5.60% | 7.40% | |
| 02:00 | CNY | Fixed Asset Investment YTD Y/Y Feb | 4.20% | 3.20% | 3.00% | |
| 10:00 | EUR | Eurozone Trade Balance (EUR) Jan | 14.2B | 13.0B | ||
| 10:00 | EUR | Eurozone CPI Y/Y Feb F | 2.60% | 2.60% | ||
| 10:00 | EUR | Eurozone CPI Core Y/Y Feb F | 3.10% | 3.10% | ||
| 12:30 | CAD | Industrial Product Price M/M Feb | 0.00% | -0.10% | ||
| 12:30 | CAD | Raw Material Price Index Feb | 0.80% | 1.20% | ||
| 14:00 | USD | NAHB Housing Index Mar | 48 | 48 |
EUR/USD Hits Support, Can It Bounce Back?
Key Highlights
- EUR/USD started a downside correction from the 1.0980 zone.
- A connecting bullish trend line is forming with support at 1.0885 on the 4-hour chart.
- GBP/USD slipped below the 1.2800 support zone and tested 1.2735.
- The Euro Zone CPI could increase 2.6% in Feb 2024 (YoY).
EUR/USD Technical Analysis
The Euro failed to continue higher above the 1.0980 resistance against the US Dollar. EUR/USD started a downside correction and traded below the 1.0920 support.
Looking at the 4-hour chart, the pair traded below the 1.0900 support, but the bulls are active above the 1.0880 level and the 100 simple moving average (red, 4-hour). The pair traded as low as 1.0872 and is currently well above the 200 simple moving average (green, 4-hour).
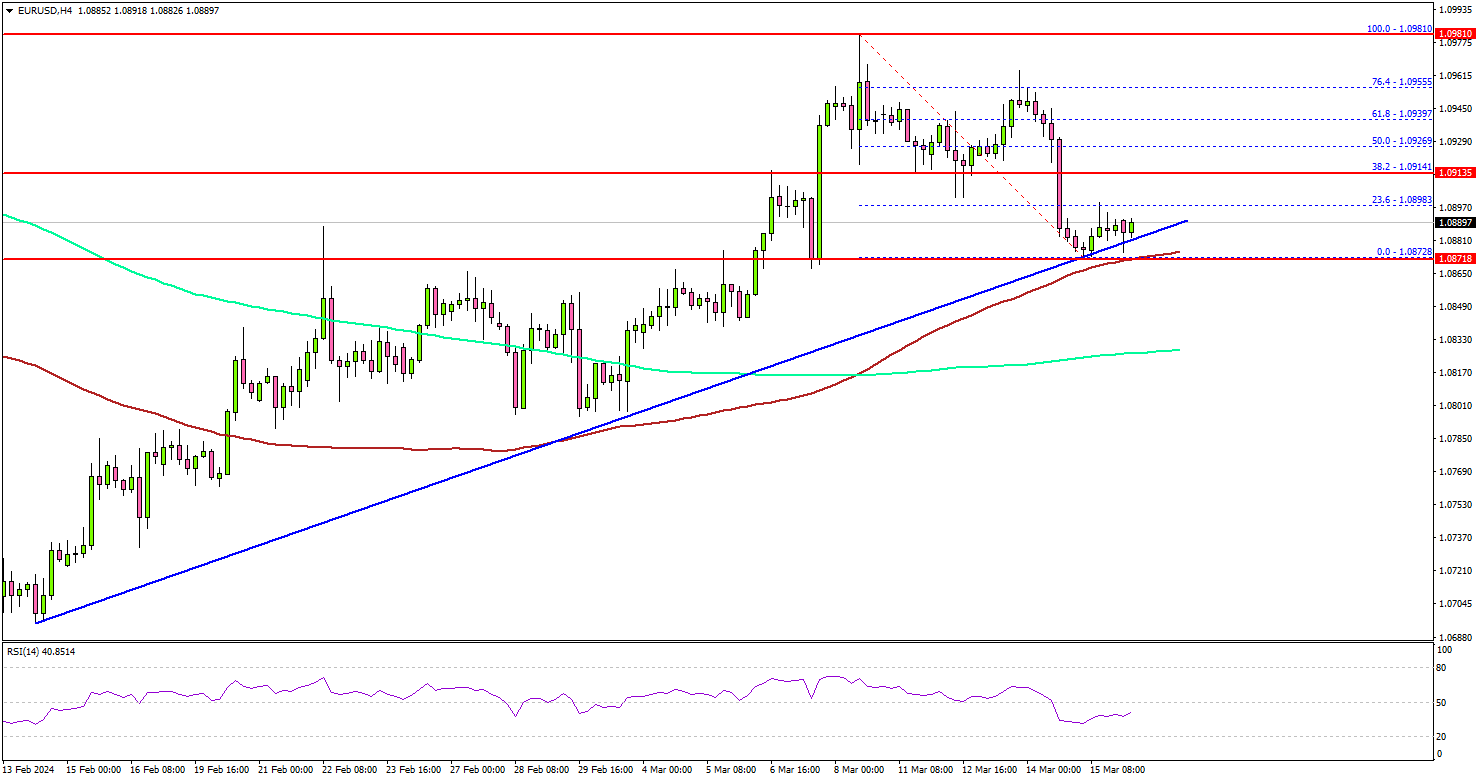
There is also a connecting bullish trend line forming with support at 1.0885 on the same chart. On the upside, the pair could face resistance near the 1.0900 level.
The first major resistance is now forming near 1.0915. The main resistance is near 1.0920. A close above the 1.0920 zone could open the doors for more upsides. The next stop for the bulls might be 1.0980.
Immediate support is near the 1.0885 level and the trend line. The next major support is at 1.0820. If there is a downside break below the 1.0820 support, the pair could decline toward the 1.0750 support.
Looking at GBP/USD, the pair declined below the 1.2800 support and now there is a risk of more downsides in the near term.
Economic Releases
- Euro Zone CPI for Feb 2024 (YoY) - Forecast +2.6%, versus +2.6% previous.
- Euro Zone Core CPI for Feb 2024 (YoY) - Forecast +3.1%, versus +3.1% previous.