
Sample Category Title
China’s industrial production expand 7% yoy, retail sales up 5.5% yoy
China's industrial production grew 7.0% yoy in the January-February period , above expectation of 5.3% yoy During the same period, retail sales rose 5.5% yoy, below expectation 5.6% yoy.
Fixed asset investment rose 4.2% yoy, above expectation of 3.2% yoy. Investment into real estate fell by -9% yoy. Investment in infrastructure rose by 6.3% yoy while that in manufacturing increased by 9.4% yoy.
"The economy kept rebounding and improving in January and February with various policies taking effect. But we also need to see that the external environment is increasingly complex, grim and uncertain, and the problem of insufficient domestic demand still remains. The foundation for the economy's rebound needs to be further solidified," NBS said.
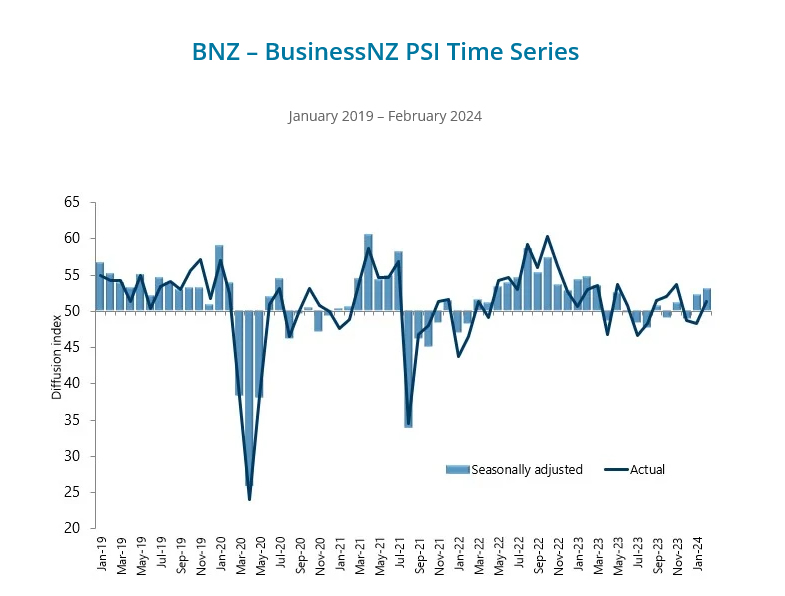
NZ BNZ services rises to 53.0, signs of early and strong growth emerge
New Zealand's BusinessNZ Performance of Services Index climbed from 52.2 to 53.0 in February, marking its highest point since March 2023.
A closer examination of the index's components reveals a generally positive picture. Activity and sales maintained steady pace, inching slightly up from 53.0 to 53.1. Employment saw modest increase, moving closer to the expansionary threshold by rising from 48.3 to 49.1. Notably, new orders and business surged significantly from 52.4 to 56.0, the highest level recorded since December 2022.
The feedback from businesses highlighted persistent concerns, with the proportion of negative comments standing at 57.3% in February, a slight improvement from December's 58.7% but an increase from January's 53.0%. Businesses continue to identify the cost of living as the primary factor influencing activity, alongside the difficulties posed by the overall economic conditions.
BNZ's Head of Research Stephen Toplis said that "when we combine the PMI and PSI together to get an indicator of activity, there is a strong suggestion of growth returning later this year. The turnaround occurs a little stronger and earlier than we are forecasting but, whatever the case, it is a heartening sign".
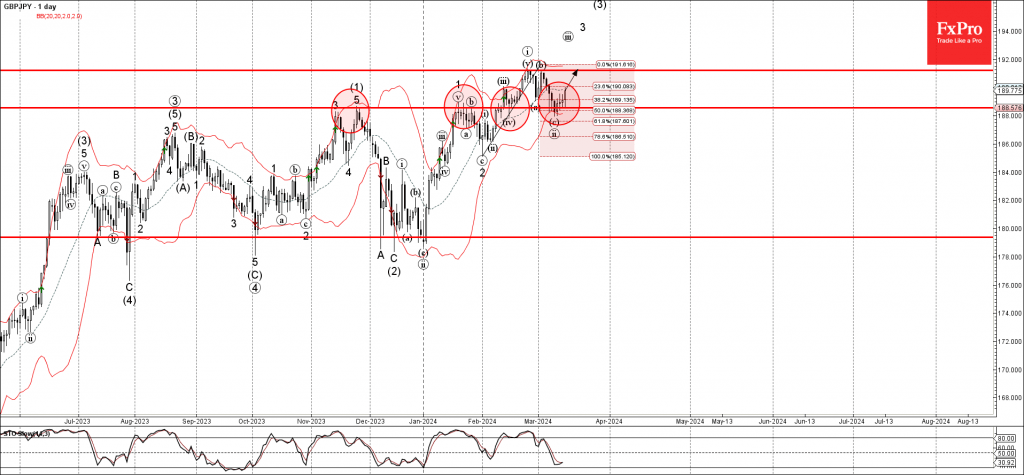
GBPJPY Wave Analysis
- GBPJPY reversed from key support level 188.50
- Likely to rise to resistance level 191.20
GBPJPY currency pair recently reversed up from the key support level 188.50 (former monthly high from November and January).
The support level 188.50 was strengthened by the lower daily Bollinger Band and by the 50% Fibonacci correction of the upward impulse from December.
Given the clear daily uptrend, GBPJPY currency pair can be expected to rise further toward the next resistance level 191.20 (top of the previous waves i and b).
Forex and Cryptocurrencies Forecast
EUR/USD: Stubborn Inflation Refuses to Back Down
Market participants last week were keenly focused on inflation data from the US. The FOMC (Federal Open Market Committee) meeting of the Federal Reserve is scheduled for Wednesday, 20 March, and these figures will undoubtedly influence the Committee's decision on interest rates. Federal Reserve Chairman Jerome Powell recently stated that more evidence of a sustainable slowdown in inflation would be necessary to start cutting rates. However, it appears that such evidence is lacking. Data released on Tuesday, 12 March, showed that prices, instead of decreasing, have been on the rise.
The Consumer Price Index (CPI), excluding food and energy, was expected to increase by 0.3% but actually rose by 0.4% month-on-month. Year-on-year, inflation in February increased by 3.8%, slightly above the forecast of 3.7%. The overall CPI showed a monthly increase of 0.4% and an annual rise of 3.2%. Thus, the overall CPI has increased by 4.2% on an annual basis over the last three months, marking the highest level since June of the previous year. Certainly, this surge in inflation is not a cause for panic, but it is too early to declare a complete victory over it, for which the Fed raised rates to the highest level in 40 years.
Additional arguments for the Federal Reserve to refrain from hastily cutting rates emerged on Thursday, 14 March. It was found that industrial inflation, measured by the Producer Price Index (PPI), increased from 0.3% to 0.6% month-on-month, against market expectations of 0.3%. Against this backdrop, the yield on 10-year US Treasury bonds sharply increased, providing support to the dollar.
Beyond CPI and PPI, there's a third argument in favour of maintaining the Federal Reserve's tight monetary policy: the labour market, which remains relatively robust. Despite the highest unemployment rate increase in two years (from 3.7% to 3.9%), the number of new jobs created outside of the agricultural sector (NonFarm Payrolls) reached 275K, significantly exceeding both the previous figure of 229K and the forecast of 198K. Additionally, real wages continued to grow year-on-year in February.
Against the backdrop mentioned above, the euro faced pressure last week. Moderately dovish statements from officials at the European Central Bank (ECB) did not provide any relief. On Thursday, the bank's chief economist, Philip Lane, in an interview with CNBC, stated that wages are moving in the right direction. However, he added, the EU's monetary authorities avoid giving clear forecasts regarding further steps and must make decisions at each specific meeting.
According to Peter Kazimir, a member of the ECB's Governing Council and head of the National Bank of Slovakia, it would be wise to wait until June for the first rate cut. "Rushing this step is unwise and disadvantageous," he said. "Upside risks to inflation are alive and well. More convincing data on inflation prospects are needed. [And] only in June will we reach the threshold of confidence in this matter." "But the discussion on easing should start now," added the head of the National Bank of Slovakia.
Olli Rehn, a member of the ECB's Governing Council and head of the Bank of Finland, spoke similarly. He confirmed the start of discussions on reducing the restrictive aspect of the bank's monetary policy. When asked about the appropriate time to begin rate cuts, he carefully replied, "If inflation continues to decline, it would be possible to gradually start lifting the foot off the monetary policy brake pedal."
The preliminary Michigan Consumer Sentiment Index, published on 15 March, showed a slight decrease to 76.5 from the previous value and forecast of 76.9. Following this, EUR/USD ended the working week at 1.0886. As for the near-term outlook, as of the evening of Friday, 15 March, 75% of experts voted for a strengthening dollar and a decline in the pair, with 15% siding with the euro and 10% taking a neutral stance. Oscillator readings on the D1 are evenly distributed: one-third are coloured green, one-third red, and one-third neutral grey. Trend indicators' force ratio is such: 35% recommend selling the pair, while 65% recommend buying it. The nearest support for the pair is located in the zone of 1.0845-1.0865, followed by 1.0800, then 1.0725, 1.0680-1.0695, 1.0620, 1.0495-1.0515, and 1.0450. Resistance zones are found at 1.0920, 1.0965-1.0980, 1.1015, 1.1050, 1.1100-1.1140, and 1.1230-1.1275.
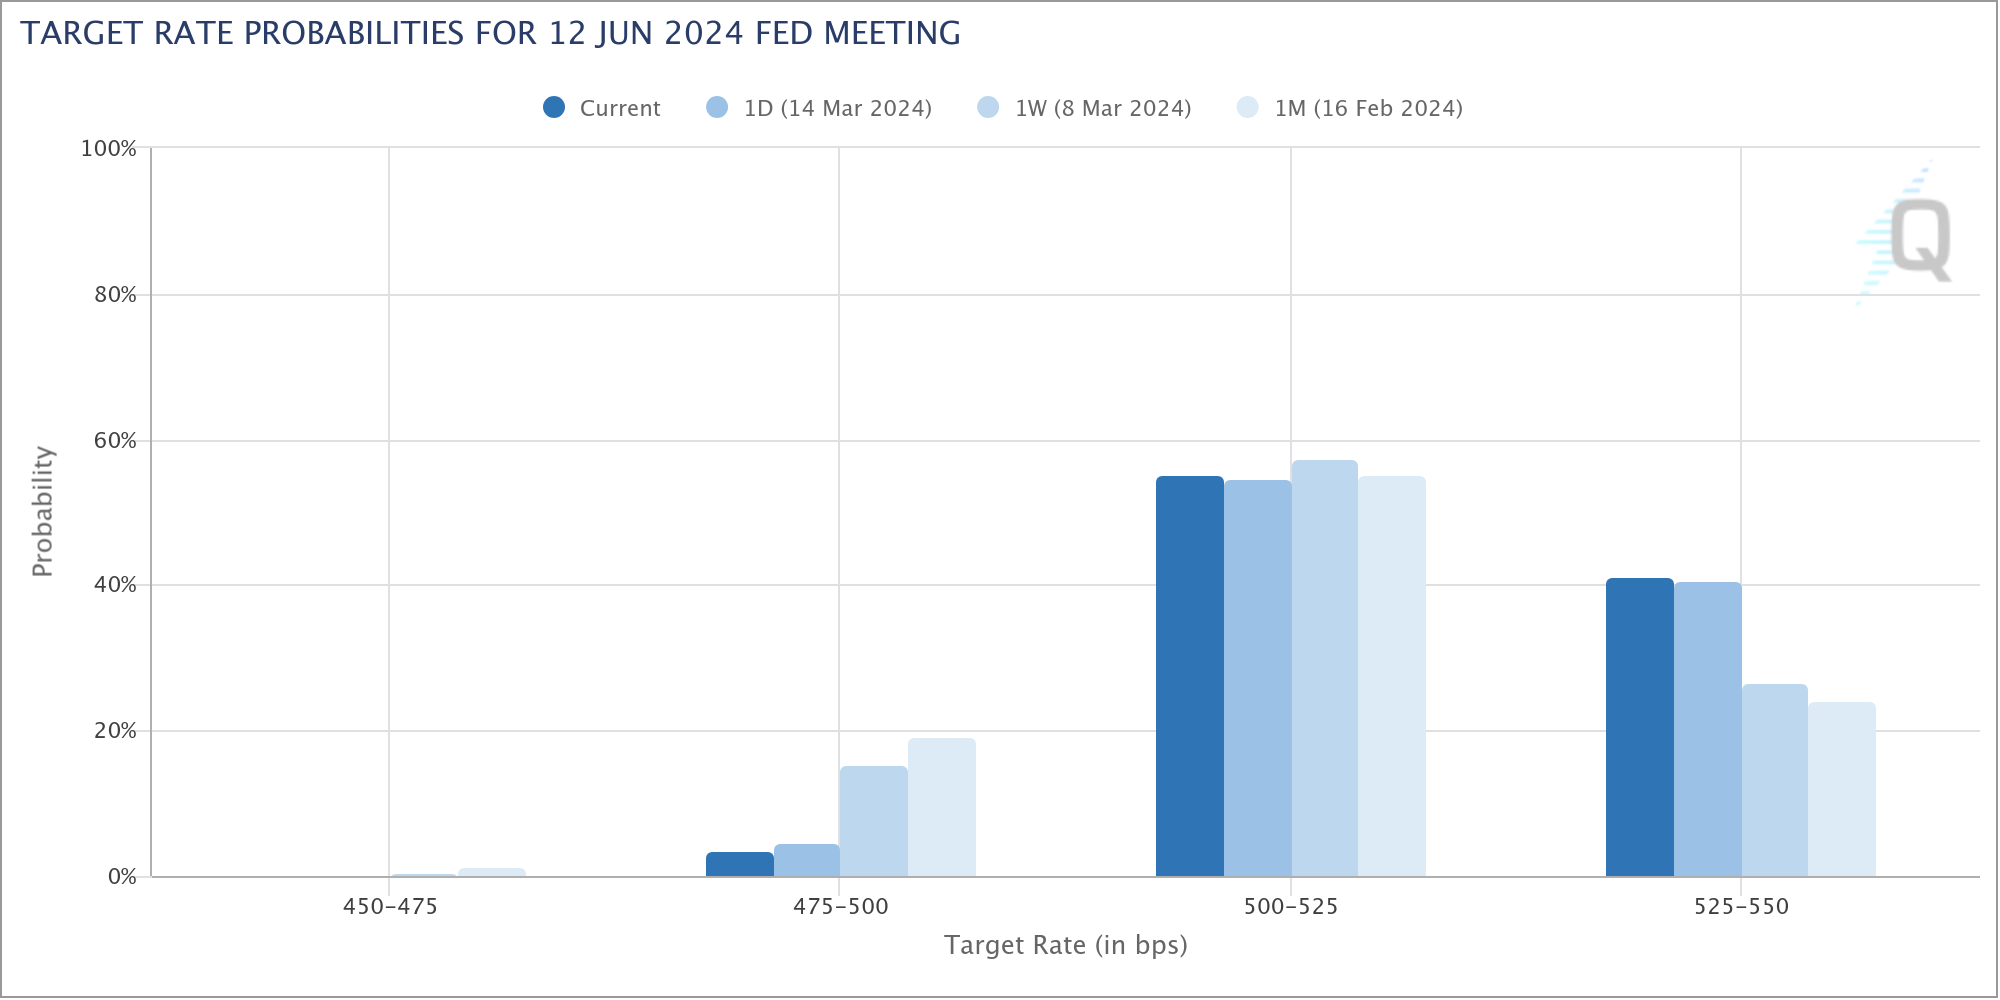
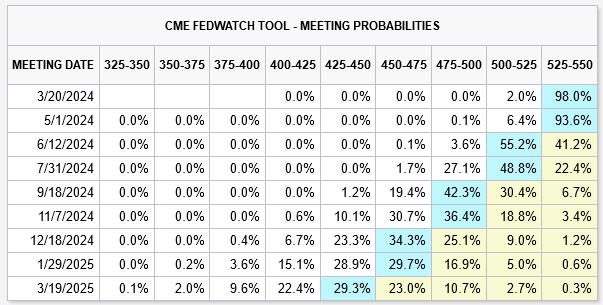
In the coming week, the Consumer Price Index (CPI) value for the Eurozone will be released on Monday, 18 March. However, as the ECB meeting has already taken place, this indicator is unlikely to provoke a strong market reaction. The main event of the week, as mentioned, will be the Federal Reserve's FOMC meeting on Wednesday, 20 March. It is expected to be the fifth consecutive meeting where the federal funds rate remains unchanged at 5.50%. The greatest interest for economists and investors will likely lie in the subsequent Federal Reserve leadership press conference, where they hope to hear hints about the start date for monetary policy easing. Currently, according to CME FedWatch, there is a 40% chance that the reduction will begin in June.
Apart from these events, a comprehensive package of data on business activity (PMI) across various sectors of the economy in the US, Germany, and the Eurozone, set to be released on Thursday, 21 March, also presents interest. On the same day, traditional data on the number of initial unemployment claims in the US will be published.
GBP/USD: More Negatives than Positives for the Pound
Last week, the dollar was recovering from the losses it suffered in the first ten days of March. On one hand, GBP/USD was pressured by rising inflation in the US, and on the other hand, by weak macroeconomic statistics from the United Kingdom. Data published on Tuesday, 12 March, confirmed the cooling of the country's labour market. In January, employment decreased by 21K (against a forecasted increase of 10K), and the unemployment rate rose from 3.8% to 3.9% (forecasted at 3.8%). Additionally, the number of claims for unemployment benefits sharply increased from 3.1K in January to 16.8K in February. Meanwhile, the wage growth of UK workers slowed down, marking the slowest pace since 2022.
Market participants' pessimism increased on Wednesday, 13 March. It was revealed that although the country's GDP grew by 0.2% in January, industrial production fell from +0.6% to -0.2% month-on-month and from +0.6% to +0.5% year-on-year. The manufacturing sector saw an even sharper decline, from +0.8% to 0.0% month-on-month and from +2.3% to +2.0% year-on-year.
All these data strengthen the likelihood of the Bank of England (BoE) soon shifting to a more dovish monetary policy. Some estimates suggest this could happen as early as May. If data from the United Kingdom continue to worsen, the probability of a pound interest rate cut in the coming months will only increase, pushing GBP/USD further down.
"GBP/USD could fall as the UK continues to stagnate and the Bank of England finally begins to cut rates," analysts at the French bank Societe Generale believe. Economists at the Dutch Rabobank also see potential for significant strengthening of the dollar against the British currency over a 1 to 3-month horizon. However, Rabobank forecasts that the interest rate differential, signs of improvement in the UK's economic outlook, combined with the prospect of uneventful elections in the country and a relatively stable political backdrop, should provide moderate support to the pound. "We believe," the bank's economists write, "that over a 12-month perspective, GBP/USD will recover to the 1.3000 area.".
The pair closed the week at 1.2734. Analyst opinions on its near-term direction were divided as follows: a majority (65%) voted for a decline, 20% for an increase, and 15% remained neutral. Among the D1 oscillators, 40% point north, only 10% south, and 50% east. Trend indicators have 65% looking upwards and 35% in the opposite direction. Should the pair move southward, it will encounter support levels and zones at 1.2695-1.2710, 1.2575-1.2610, 1.2500-1.2535, 1.2450, 1.2375, and 1.2330. In the event of an upward move, resistance will be met at levels 1.2755, 1.2820, 1.2880-1.2900, 1.2940, 1.3000, and 1.3140.
In addition to the Federal Reserve's FOMC meeting, the upcoming week will also feature a meeting of the Bank of England, scheduled for Thursday, 21 March. The day before, we will learn about the inflation situation (CPI) in the United Kingdom, and just before the BoE meeting, preliminary data on business activity (PMI) in the country will be released. The workweek will conclude with the publication of retail sales data in the United Kingdom.
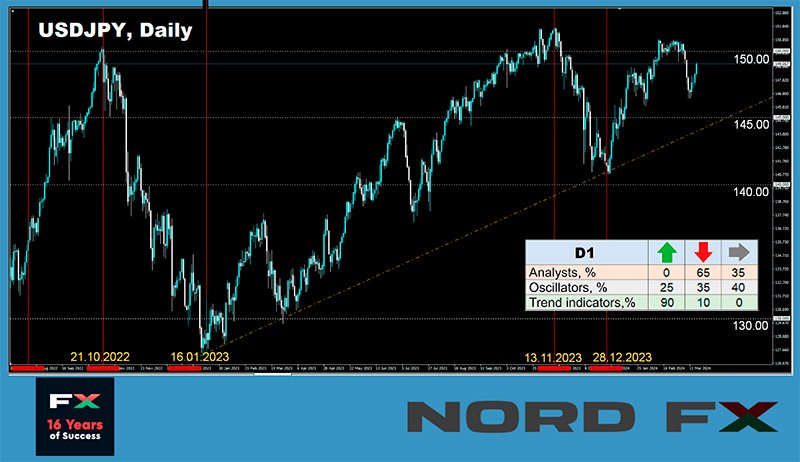
USD/JPY: What to Expect from the Bank of Japan
The upcoming week, on Tuesday, 19 March, will also see a meeting of the Bank of Japan (BoJ). Consequently, speculation regarding an imminent shift in the regulator's monetary policy is mounting. Analysts at TD Securities have shifted their forecast for a yen rate hike from April to March. "Following a positive round of wage negotiations, we believe the Bank of Japan has the necessary information to raise the rate at next week's meeting," they write. TD Securities expects that if the rate is increased, such a move away from NIRP could easily push USD/JPY to 145.00. However, if the BoJ does not do so but attempts to sound hawkish, hinting at the possibility of a policy reversal in April, the pair might rise, but only slightly – to 150.00.
Rabobank analysts also discussed the potential tone of the Bank of Japan's statements. "If the Bank of Japan exits its negative interest rate policy on 19 March, it is likely that rates will only be raised by 10 or 15 basis points (bps)," the Rabobank experts believe. "Furthermore, at best, the Bank of Japan's guidance next week will be cautiously optimistic. It is important to note that even after the negative rate is relegated to economic history, Japan's monetary policy settings will likely remain accommodative." Rabobank does not rule out that a very cautious tone from the BoJ regarding further changes may increase the risk of a "sell the fact" reaction post-19 March. "Nevertheless, despite the risk of a short-term increase in the pair, we continue to see the possibility of USD/JPY declining to 146.00 in a three-month perspective," conclude the Rabobank economists.
Strategists at Standard Chartered echo similar sentiments. Like many of their peers, they anticipate that the Bank of Japan will end its ultra-loose policy in March rather than April. However, in their view, the expected policy adjustment is unlikely to signal the start of an aggressive rate-hiking cycle. The abolition of the negative interest rate policy (NIRP) will not alter the negative yield differential with other countries. Nonetheless, the potential cessation of yield curve control (YCC) should ultimately be positive for the yen, especially if the Federal Reserve and the ECB start cutting rates from June. In this scenario, Standard Chartered strategists believe that by the end of Q2 2024, USD/JPY could fall to 145.00.
Economists at ING, the largest banking group in the Netherlands, have repeatedly emphasized that a sustainable rally in the yen is more dependent on cuts in the Federal Reserve's rates than on rate hikes by the Bank of Japan. "We still believe that it will be difficult for the yen to sustainably strengthen beyond the volatility surrounding the rate hike until rates in the US are reduced. This remains our base scenario for this year," they write.
Societe Generale analysts are notably optimistic about the Japanese yen in their forecasts. They believe the yen is the only G7 currency likely to significantly appreciate against the US dollar this year. Even if the Bank of Japan's steps away from negative interest rates and yield curve control on 19 March are fairly symbolic, the yen is still expected to strengthen, as it is currently considered undervalued.
Throughout the past week, USD/JPY, buoyed by a strengthening dollar, rose and concluded at 149.05. Looking ahead, whereas a majority of analysts sided with the dollar in EUR/USD and GBP/USD, the situation here is reversed – in anticipation of a historic move by the Bank of Japan, 65% of experts leaned towards the bearish side for the pair, with 35% remaining undecided. No votes were cast in favour of the American currency. Technical analysis tools seem unaware of the Bank of Japan's meeting, which is why only 35% of D1 oscillators favoured the yen, 25% favoured the dollar, and 40% remained neutral. Trend indicators show a clear advantage for the dollar – 90% are coloured green, and only 10% red. The nearest support levels are located at 148.40, 147.60, 146.50, 145.90, 144.90-145.30, 143.40-143.75, 142.20, 140.25-140.60. Resistance levels and zones are at 150.00, 150.85, 151.55-152.00, 153.15.
Apart from the Bank of Japan meeting, no other significant events related to the Japanese economy are scheduled for the coming days. Traders should also note that Wednesday, 20 March, is a public holiday in Japan: the country observes the Vernal Equinox Day.
CRYPTOCURRENCIES: Riding the Wave of FOMO to New Historical Highs
FOMO (Fear of Missing Out) is currently the dominant sentiment in the market, driving the leading cryptocurrency to new heights. Another record was set on Thursday, 14 March, when BTC/USD reached $73,743.
Following the approval of spot bitcoin ETFs in the US earlier this year, demand for the flagship crypto asset has significantly outstripped the daily supply of bitcoin mined by miners. The halving, scheduled for the third decade of April, will only intensify this imbalance. Despite these two drivers remaining on the agenda, their endless discussion has started to weary market participants. As a result, the focus has shifted towards issues of the global economy, the Federal Reserve's monetary policy, and the upcoming presidential elections in the US.
Starting with the potential Presidents of the United States, specifically what could happen if the White House is won by one of the two main contenders. Former US President and Republican Party leader Donald Trump emphasized the importance of the American national currency in a CNBC interview, comparing a departure from the dollar standard to defeat. At the same time, he stated he would not interfere with the use of bitcoin or other cryptocurrencies if he wins the elections in November. "If you think about it, it's an additional form of currency," Trump said. "[Bitcoin] is widely used, and I'm not sure I'd want to give it up right now," the politician added. However, when asked by the host if he himself invests in cryptocurrency, the former (and potentially future) president answered negatively.
Regarding the current White House occupant, a study conducted by Pierre Rochard, Vice President of Riot, is of interest. He assessed the US budget for 2025, proposed by Joe Biden's team, and concluded that Democrats are expecting BTC to reach $250,000 over a decade – by 2034-2035. This is suggested by the taxes laid out by the White House in the budget. However, the expert clarified that the document, of course, does not contain direct indications of this price. Conclusions are made based on the assessment of potential profit from taxes and regulation of the cryptocurrency market.
Discussing the US economy, former Coinbase CTO and a16z general partner Balaji Srinivasan writes, "We are in the phase of looting the treasury amidst the collapse of an empire. Bitcoin is the only available salvation from inflation and potential asset confiscation in the US, which could occur due to the unsustainable trajectory of government spending." According to Srinivasan's calculations, the US national debt has reached a record $34.5 trillion, increasing by 25% since 2020, and continues to grow by $1 trillion every 90 days. The US government spends $10 billion more daily than it receives. Given this, the former Coinbase CTO did not rule out that as the "financial reckoning" for such behaviour approaches, the "insatiable state" might consider the possibility of confiscating private assets.
"Private property will not be protected by the state in a bankrupt blue [Democratic] America. Any blockchain under Washington's control is vulnerable. Fortunately, we have digital gold. It is independent of the state and cannot be confiscated. Bitcoin maximalism will win. It will save us from state budgeting," believes the former CTO of Coinbase. He declined to specify when the "reckoning" would occur but reminded that Ray Dalio, Elon Musk, Larry Fink, and Stanley Druckenmiller have previously announced the inevitability of such a scenario.
Analysts at Matrixport, sharing Balaji Srinivasan's optimism about the global future of bitcoin, also suggest that a risk-reward analysis indicates that the coin's quotes may soon undergo a correction. "This bull market still has legs," Matrixport believes, "but the divergence between the decreasing RSI and high BTC prices could signal that bitcoin needs to consolidate before it can start rising in price again."
Investor and founder of MN Trading, Michael Van De Poppe, believes a market pullback of 20-30% is quite possible in the near term. He also noted that he has high expectations for altcoins, which have yet to reach record highs.
Raoul Pal, the founder of the investment company Real Vision, predicted the potential performance of bitcoin, ETH, and SOL. He suggested that the target mark for bitcoin in the foreseeable future is $250,000 per coin. The first cryptocurrency may exceed this projected level due to high demand for spot bitcoin ETFs. The upcoming April halving is also expected to increase demand for this cryptocurrency.
Raoul Pal is also bullish on Ethereum. Thanks to the utility of smart contracts, the value of this altcoin could rise to $17,000-$20,000. Currently, ETH is trading around $4,000, but unlike bitcoin, it has not yet surpassed its record – in November 2021, Ethereum reached a level of $4,856. The Real Vision founder believes that the altcoin's growth could be influenced by a strong correlation with bitcoin, anticipation of the launch of spot ETH ETFs, and the Dencun update.
The specialist forecasts that the price of Solana could range from $700 to $1,000, as the high performance of the blockchain will increase demand for this coin. In early November 2021, SOL reached a peak mark of $260, and the coin still has plenty of growth opportunities.
Last week, much attention was also paid to miners, not just individually, but in conjunction with the American economy. Bill Ackman, CEO of Pershing Square Capital, called bitcoin mining one of the reasons for inflation and the fall of the US dollar. "The rise in bitcoin prices leads to an increase in mining and energy consumption, raising the latter's cost and causing inflation and the dollar's decline. This stimulates demand for bitcoin, its mining, and energy consumption. The cycle continues, bitcoin goes into infinity, energy prices skyrocket, the economy collapses," the billionaire described his scenario, adding that this relationship "works both ways."
Taking an opposite viewpoint was another influencer – the aforementioned Pierre Rochard from Riot. He believes that the mining industry could experience exponential 10-fold growth, thanks to the active development of the US market and the country's surplus of electricity. His scenario does not foresee an economic collapse and sky-high energy prices.
Time will tell which of these experts is correct. However, according to analysts at Bernstein, mining company stocks remain the best proxy investments in bitcoin as the cryptocurrency moves towards the target mark of $150,000. In a note to clients, they point out that historically, miners' quotes have almost always outperformed bitcoin in terms of growth rate during a bull market. Since we are in the middle of the current cycle, every "weakness window" for digital gold miners is, in the experts' opinion, an opportunity to buy their stocks.
Bernstein claims that retail investors currently dominate this segment, while institutional investors largely avoid "bitcoin-proxy" investments, as they remain sceptical about cryptocurrencies. However, as the asset grows to new highs, analysts expect this category of investors' interest in miners' stocks to awaken and grow.
At the beginning of spring, bitcoin surpassed the Russian rouble in market capitalization and occupied the 14th position in the overall ranking of the largest currencies. Just a few days later, on 11 March 2024, bitcoin made another leap – rising above $72,000 per coin, it surpassed silver in market capitalization. The first cryptocurrency moved to the eighth spot in the ranking of the largest assets by this measure, crossing the $1.4 trillion mark.
As of the writing of this review, on the evening of Friday, 15 March, after traders took profits, BTC/USD is trading around $68,200. The total market capitalization of the crypto market stands at $2.58 trillion ($2.60 trillion a week ago). The Crypto Fear & Greed Index has risen from 81 to 83 points and is in the Extreme Greed zone. (It's worth noting that the historical maximum for this index was recorded at 95 points during the Bull Rally at the end of 2020).
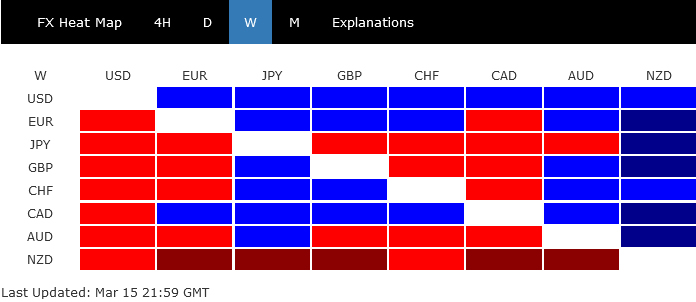
Dollar Rises on Fed Reassessment, But Reversal Pending Confirmation
Dollar ended the week as the strongest currency, boosted by the fresh round of inflation data that led markets to reassess expectations around Fed's rate cuts. This recalibration was also marked a pronounced rebound in treasury yields and a notably cautious sentiment pervading the stock market. Despite this rally, Dollar remained confined within the previous week's range against its major counterparts, suggesting that a clear directional shift is still pending confirmation.
On the other hand, Yen and New Zealand Dollar found themselves at the lower end of the performance spectrum. In Japan, positive outcomes from wage negotiations have seemingly paved the way for a much-anticipated BoJ rate hike. Yet, market participants remain divided on whether BoJ will act in its next meeting on Tuesday or opt for a rate adjustment in April. Meanwhile, Kiwi faced downward pressure following remarks from New Zealand's Finance Minister, which painted a grim picture of the economic outlook and fueled speculation about an earlier rate cut by RBNZ.
In other parts of the currency market, Canadian Dollar and Euro trailed behind the greenback as the second and third strongest currencies, respectively. Australian Dollar was positioned as the third weakest, while Sterling and Swiss Franc were mixed in the middle. It's important to note, however, that the currency landscape could be significantly reshaped in the coming week, as a series of central bank meetings—including those of BoJ, RBA, Fed, SNB, and BoE—are on the horizon.
Inflation Realities Prompt Shift in Market Expectations for Fed Rate Cuts
The central theme of the financial markets last week was the increased uncertainty regarding Fed's policy loosening path, primarily stirred by fresh inflation data. The release of February's CPI and PPI reports not only confirmed that inflation battle in the US is far from over but also triggered notable response across asset classes. Treasury yields staged a significant leap, taking Dollar higher alongside. At the same time, major stock indexes showed sign of fatigue after recent record runs and appeared to be losing momentum as investors turned cautious.
The discourse in the markets is now centering around three critical facets of Fed's monetary easing path: the timing of the initial rate cut, the total number of cuts within the year, and the final stance of this cycle.
The persistent nature of inflation has led to reassessment among traders, who are increasingly betting on a delay in the first rate reduction. The possible move from June to July would allow more time for the current interest rates to impact exert their intended dampening effect on demand and inflation. This adjustment in expectations is reflected in Fed fund futures, where the likelihood of a June rate cut has decreased from nearly 75% to less than 60% in just a week's time. Interest-rate swaps also pushed bets on the timing of the full first quarter-point rate cut to the July.
The prospects for three rate cuts within the year, as previously indicated in the December dot plot, are also being reconsidered. Current pricing in the Fed fund futures suggests only about 65% chance of federal funds rate at 4.50-4.75% (down from current 5.25-5.50%,) by the end of the year, a marked shift from expectations following the December meeting. Swaps pricing is also showing less than 75 bps of easing priced this year.
Discussions around the terminal rate of the Fed's current cycle introduce another layer of complexity. Some economists argued that with stronger productivity growth in the US comparing to other regions, neutral rate, where monetary policy neither stimulates nor restrains economic growth, might be higher than initially thought. This speculation suggests that the terminal interest rate could lean closer to 4% rather than 3% mark.
Fortunately, there is less than a week when Fed will publish its new economic forecasts and dot plot. They should provide some clarify to these questions.
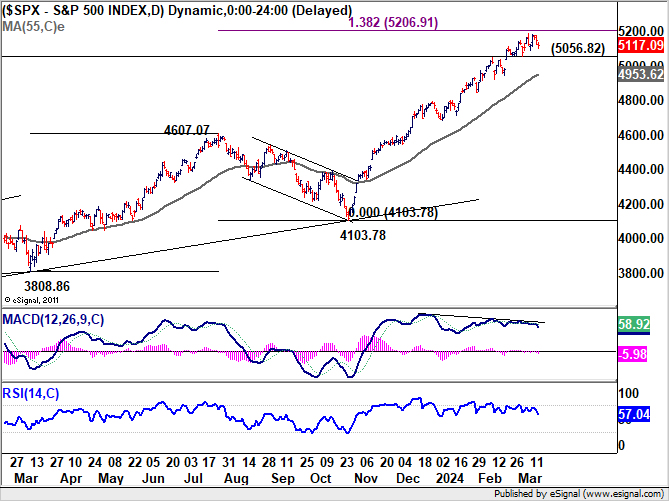
As for the markets, S&P 500 continued to lose upside momentum as seen in D MACD. There is prospect of a near term correction, subject to reactions to FOMC projections. Break of 5056.82 support will indicate short term topping, just ahead of 138.2% projection of 3808.86 to 4607.07 from 4103.78 at 5206.91. In this case, deeper pull back would be seen back to 55 D EMA (now at 4953.62).
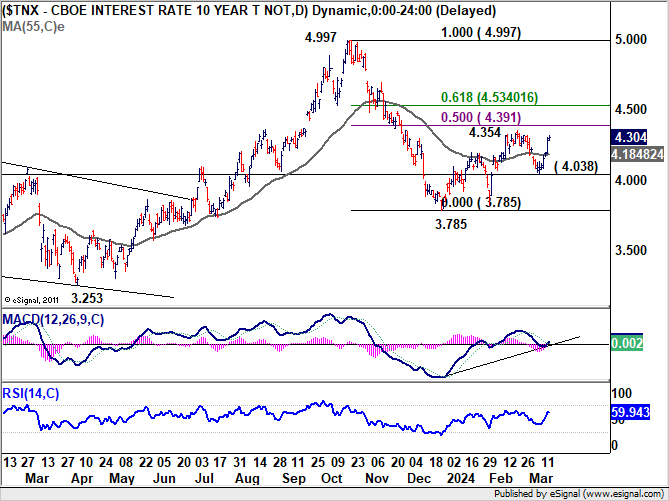
10-year yield's strong rally last week was a surprise to us. The development suggests that corrective rebound from 3.785 is still in progress. Further rise is now in favor as long as 4.038 support holds and break of 4.354 resistance could be seen. But strong resistance is expected between 4.391 and 4.534 (50% and 61.8% retracement of 4.997 to 3.785) to limit upside. Nevertheless, in an unlikely scenario that 4.534 is taken out decisively, there should be some drastic underlying changes.
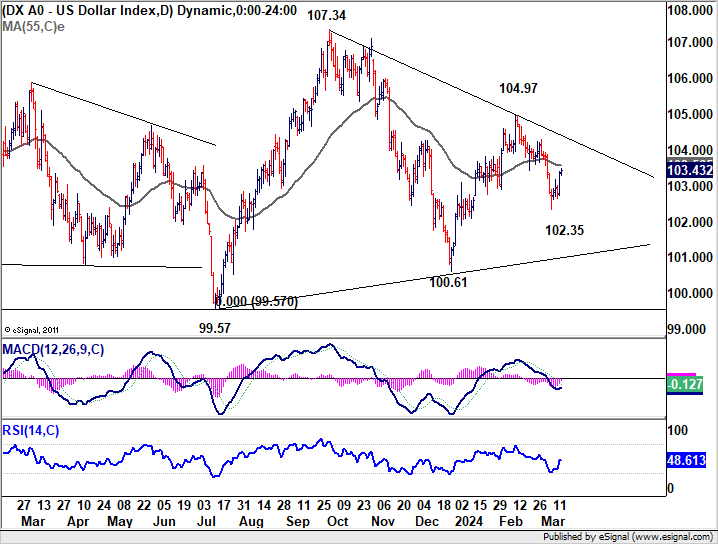
Dollar index's recovery last week indicates short term bottoming at 102.35. But upside is capped below 55 D EMA (now at 103.56). Near term outlook is turned mixed for now. The more certain view is that medium term corrective pattern form 99.57 (2023 low) is extending. But it's usually very hard to pinpoint the movements in the middle of a corrective pattern.
In the bearish case, rejection by 55 D EMA, followed by break of 102.35, will argue that fall from 104.97 is the third leg of the decline from 107.34. Deeper decline should be seen to 100.61 support and possibly below. But break of 99.57 is not envisaged.
In the bullish case, sustained trading above 55 D EMA will argue that rise from 100.61 is the third leg of the pattern from 99.57 and is still in progress. Further break of 104.97 will target 107.34 resistance.
DAX and Nikkei React to ECB and BoJ Expectations
ECB's policy outlook appears significantly clearer compared to Fed's, with Eurozone grappling with a weaker economy but more controlled inflation. In Governing Council member Martins Kazaks's words, "The dragon of inflation is pinned to the ground, a little more and it will be defeated." There is broad consensus within ECB for initiating rate cuts come spring. The preference leans towards June for these cuts, pending the Q1 wages data expected in May, despite some dovish voices advocating for an earlier start in April.
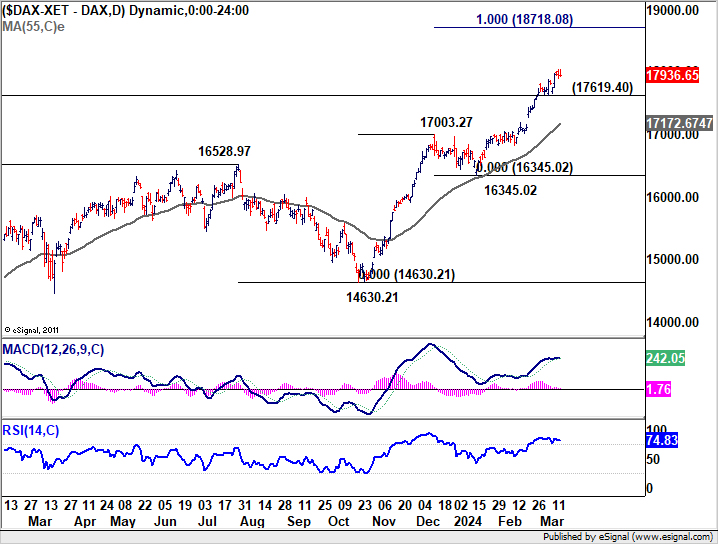
DAX continued to make new record highs last week and up trend continued. Near term outlook will stay bullish as long as 17619.40 support holds. Next target is 100% projection of 14630.21 to 17003.27 from 16345.02.
Conversely, in Japan, the encouraging developments from this year's Shunto wage negotiations strengthened the case for a near-term BoJ rate hike. However, the market remains uncertain about the timing, with some analysts suggesting BoJ might delay until April to coincide with new economic projections.
Yet, Nikkei newspaper reported on Saturday that an imminent end to the negative interest rate policy could come the upcoming Tuesday, marking the first hike in 17 years. The significant wage increases this year, according to a BoJ source, is viewed as sufficient even by the most cautious reflationists to warrant a change in policy.
Despite weak signals in Japan's economy, the turn of real wages growth into positive territory and the anticipation of continued wage increases are expected to bolster consumption significantly. This prospective uplift in spending could help mitigate the impacts of the anticipated policy change.
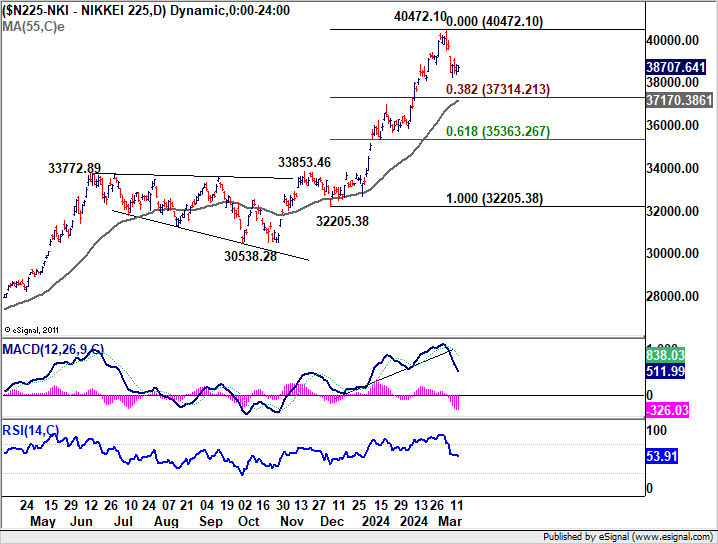
As investors brace for the BoJ's expected action, the Nikkei index experienced a notable decline last week, suggesting a short-term peak has been reached. Yet, strong support is anticipated from the 38.2% retracement level, closely aligned with the 55 D EMA, likely to contain further downside and set the stage for consolidation ahead of another potential surge.
NZD's Sharp Decline: Economic Pessimism and RBNZ Speculations
New Zealand Dollar tumbled sharply on Friday and ended the week as the worst performer. NZD/USD was indeed to top mover of the week, losing -1.51%.
This sharp decline was triggered by disappointing manufacturing data, but the tone was further darkened by pessimistic remarks from New Zealand Finance Minister Nicola Willis. Addressing business leaders, Willis set a somber tone for the upcoming Budget Policy Statement due on March 27, indicating that it "won't make happy reading."
Finance Minister Willis elaborated on the challenges ahead, noting that due to "factors outside the government's control", the Treasury's growth outlook has darkened considerably. "Growth over the next few years is likely to be significantly slower than it had previously thought," she added
Although RBNZ's baseline scenario remains to keep interest rates steady until 2025, deteriorating economic outlook has fueled speculations of sooner than anticipated rate cut.
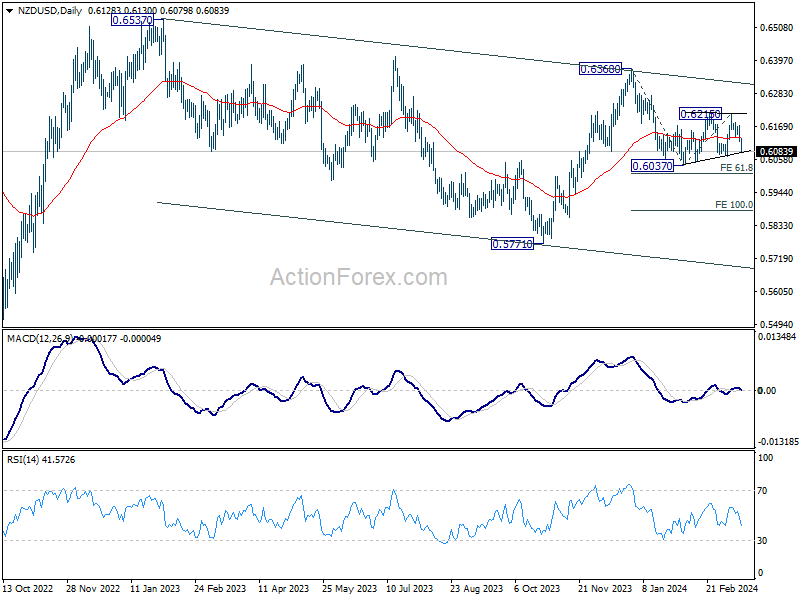
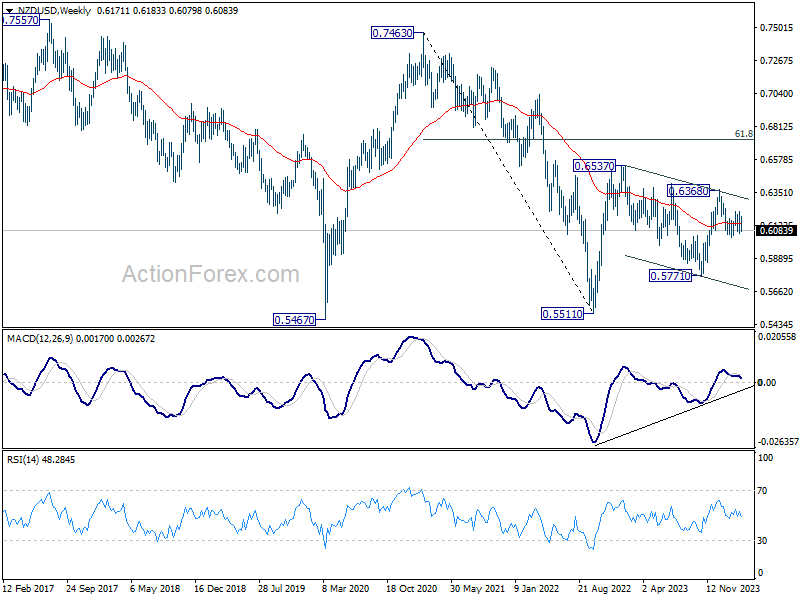
Technically, NZD/USD should be on the verge of resume recent decline from 0.6368. Firm break of 0.6037 support will target 61.8% projection of 0.6368 to 0.6037 from 0.6125 at 0.6010 first. Firm break there could prompt downside acceleration to 100% projection at 0.5884 next.
Also, the fall from 0.6368 is seen as the third leg of the corrective pattern from 0.6537 (2023 high). Break of 0.5771 support (2023 low) could be seen before NZD/USD forms a medium term bottom.
USD/CHF Weekly Outlook
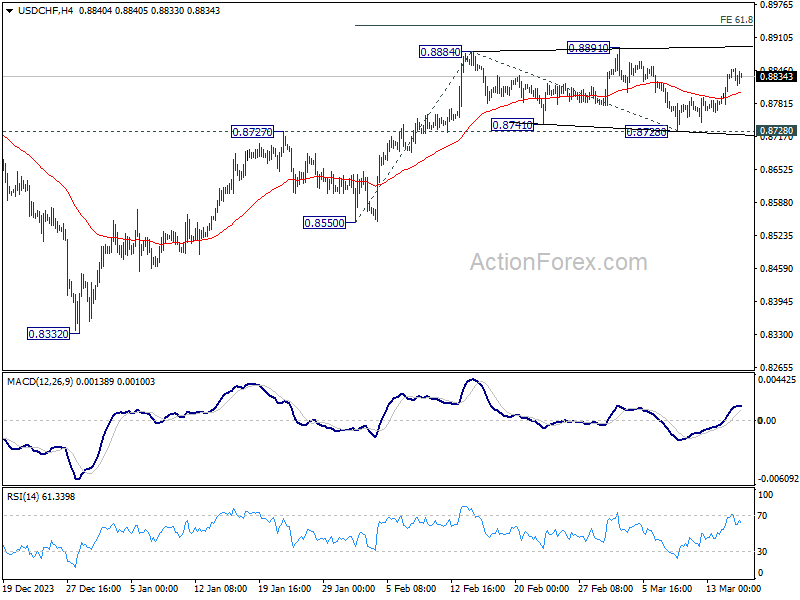
USD/CHF's strong rebound last week suggests that consolidation from 0.8884 has completed with three waves to 0.8728. Initial bias stays mildly on the upside this week for retesting 0.8891 resistance first. Firm break there will resume whole rally from 0.8332. Next target is 61.8% projection of 0.8550 to 0.8884 from 0.8728 at 0.8934. For now, this will remain the favored case as long as 0.8728 support holds, in case of retreat.
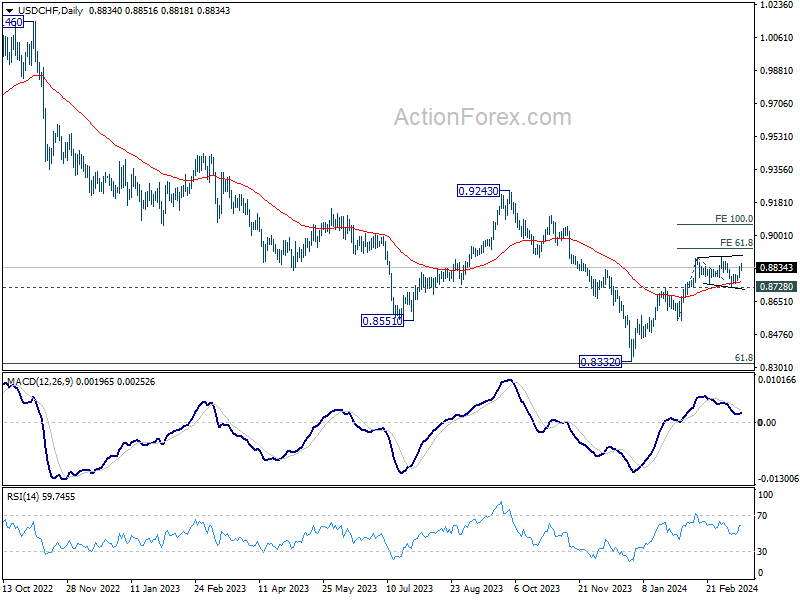
In the bigger picture, price actions from 0.8332 medium term bottom as seen as developing into a corrective pattern to the down trend from 1.0146 (2022 high). Further rise would be seen as long as 0.8555 support holds. But upside should be limited by 0.9243 resistance, at least on first attempt.
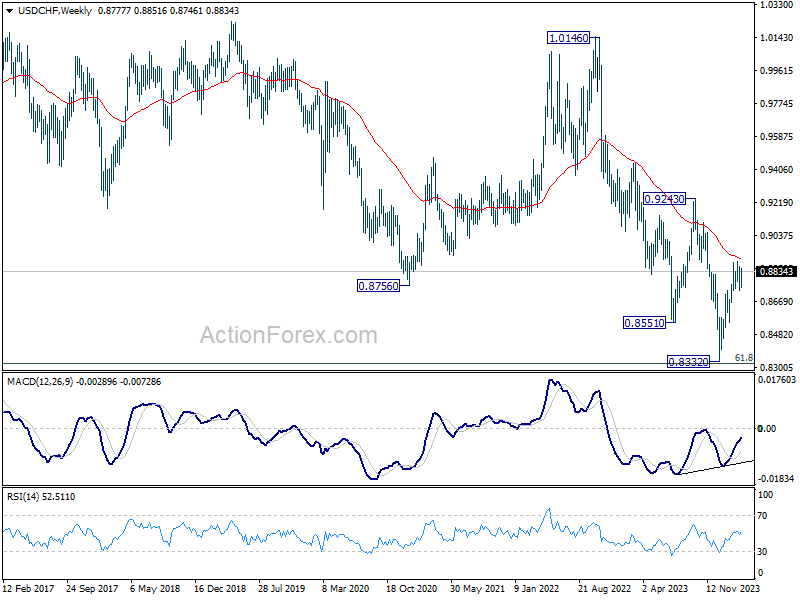
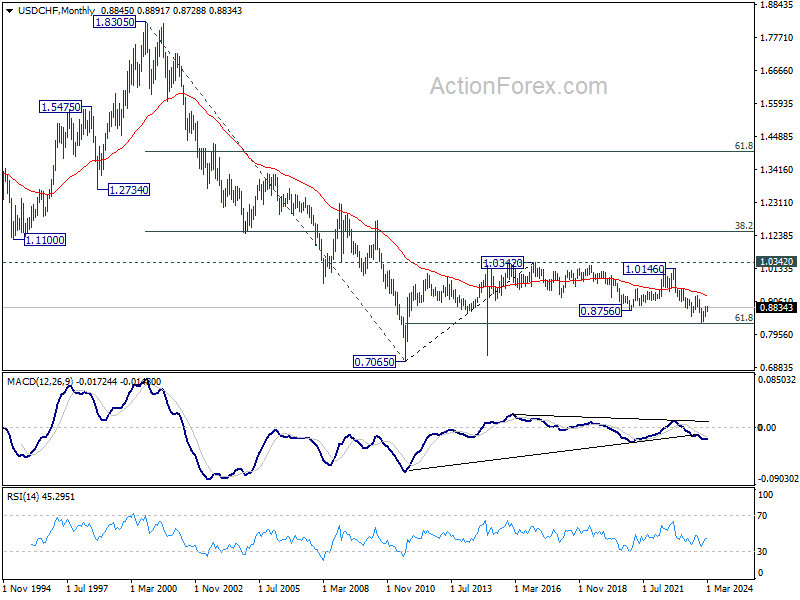
In the long term picture, price action from 0.7065 (2011 high) are seen as a corrective pattern to the multi-decade down trend from 1.8305 (2000 high). Strong rebound from 61.8% retracement of 0.7065 to 1.0342 (2016 high) will start the third leg as a medium term rally. But there will be no sign of long term reversal until firm break of 38.2% retracement of 1.8305 to 0.7065 at 1.1359.
EUR/USD Weekly Outlook
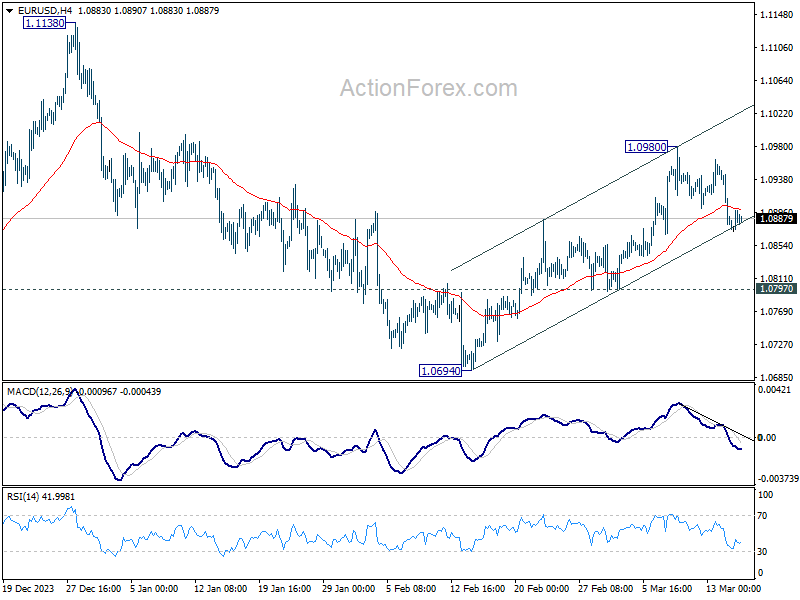
EUR/USD's fall last week indicates short term topping at 1.0980. Initial bias stays on the downside this week for 55 D EMA (now at 1.0853). Sustained break there will argue that rebound from 1.0694 has completed and bring retest of this low. For now, risk will stay on the downside as long as 1.0980 resistance holds, in case of recovery.
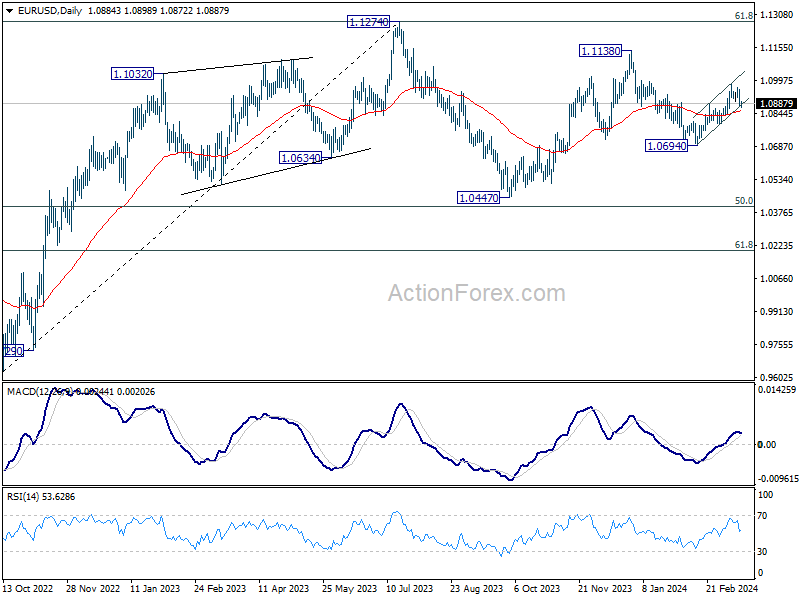
In the bigger picture, price actions from 1.1274 are viewed as a corrective pattern to rise from 0.9534 (2022 low). Rise from 1.0447 is seen as the second leg. While further rally could cannot be ruled out, upside should be limited by 1.1274 to bring the third leg of the pattern. Meanwhile, sustained break of 1.0694 support will argue that the third leg has already started for 1.0447 and possibly below.
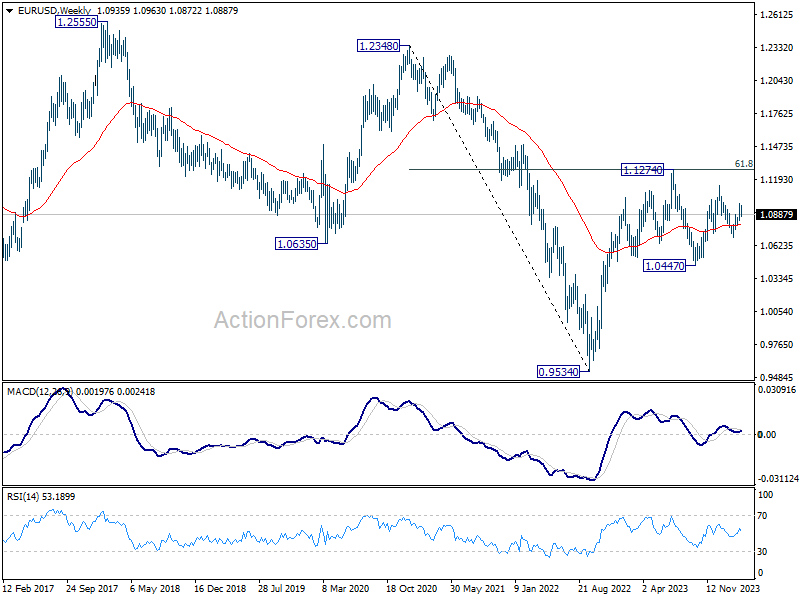
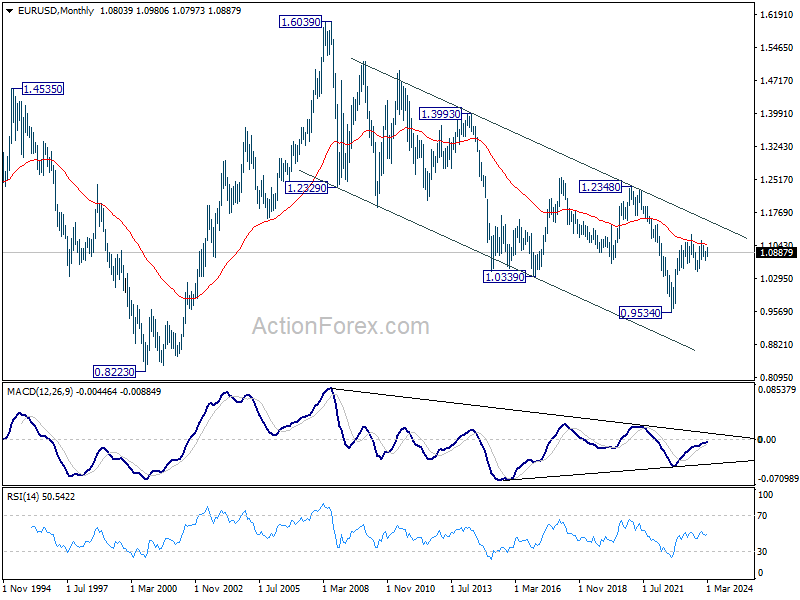
In the long term picture, a long term bottom is in place at 0.9534 on bullish convergence condition in M MACD. It's still early to call for bullish trend reversal with the pair staying inside falling channel in the monthly chart. Nevertheless, sustained trading above 55 M EMA (now at 1.1053) and break of 1.1274 resistance will raise the chance of reversal and target 1.2348 resistance for confirmation.
USD/JPY Weekly Outlook
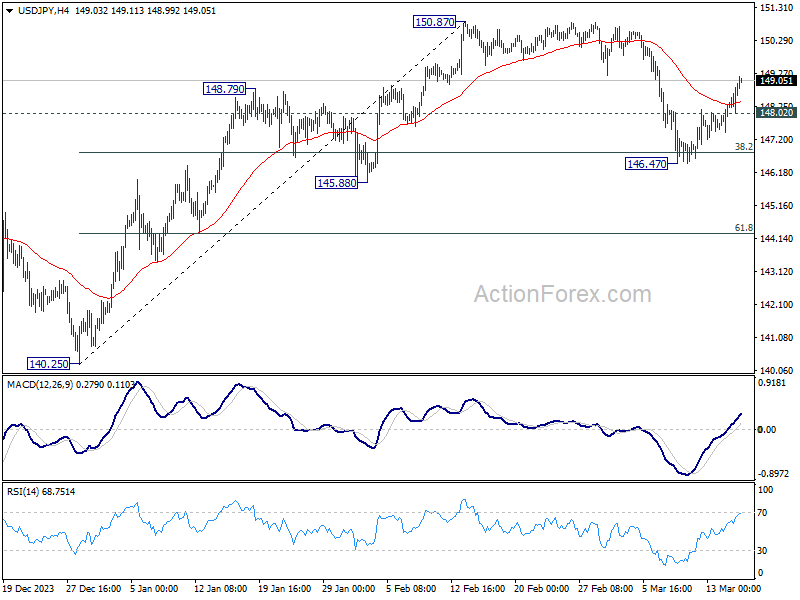
USD/JPY's strong rebound last week suggests that corrective fall from 150.87 has completed at 146.47, after drawing support from 38.2% retracement of 140.25 to 150.87 at 146.81. Initial bias remains on the upside this week for retesting 150.87/89 key resistance zone. Nevertheless, on the downside, below 148.02 minor support will turn intraday bias neutral first.
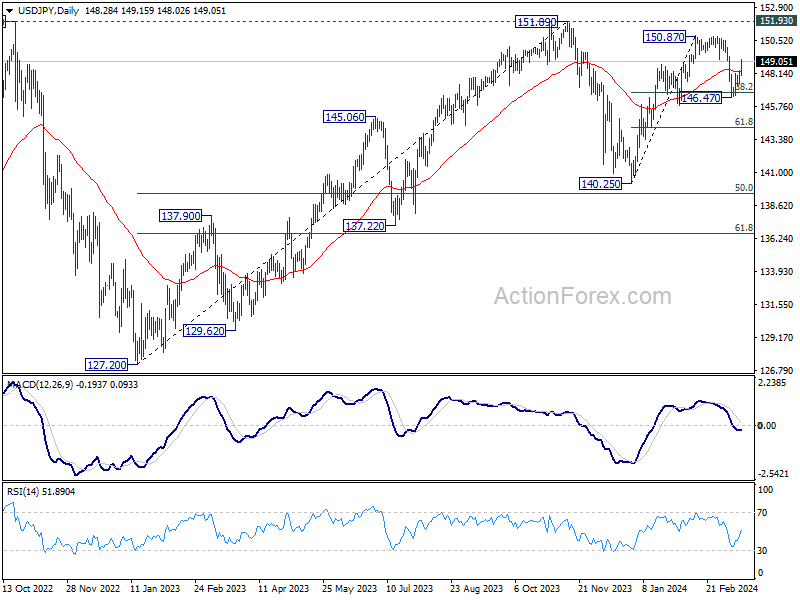
In the bigger picture, no change in the view that price action from 151.89 (2023 high) are correction to up trend from 127.20 (2023 low). The question is whether this correction has completed at 140.25, or extending with fall from 150.87 as the third leg. Sustained break of above mentioned 146.81 fibonacci level will favor the latter case. But even so, downside should be contained by 50% retracement of 127.20 to 151.89 at 139.54
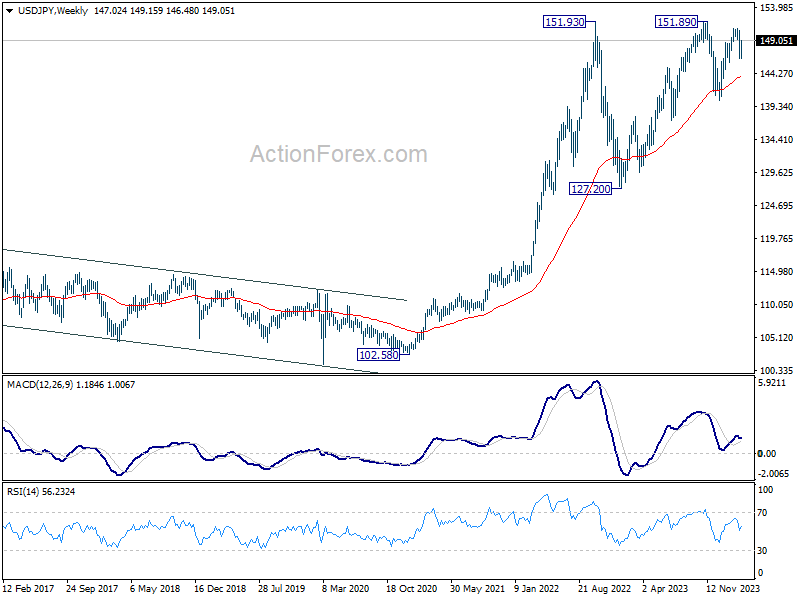
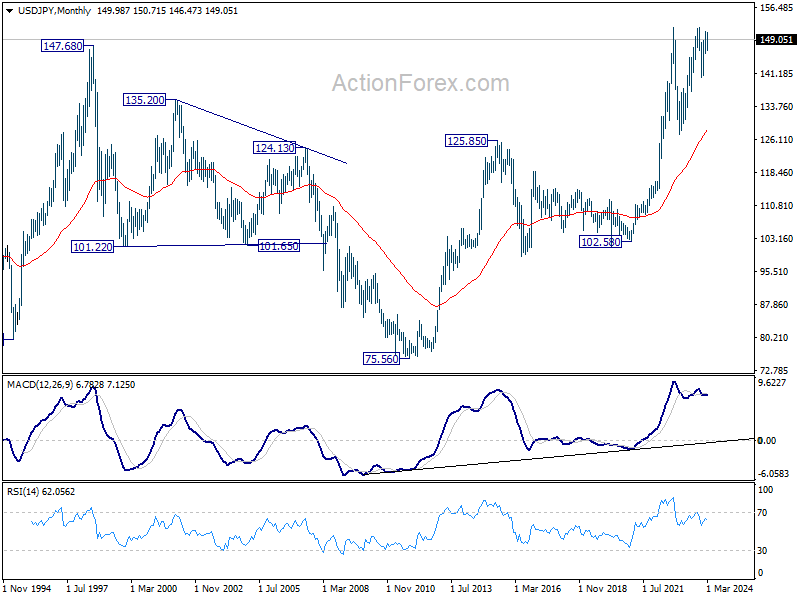
In the long term picture, as long as 125.85 resistance turned support holds (2015 high), up trend from 75.56 (2011 low) is still in favor to continue through 151.93 (2022 high) at a later stage.
GBP/USD Weekly Outlook
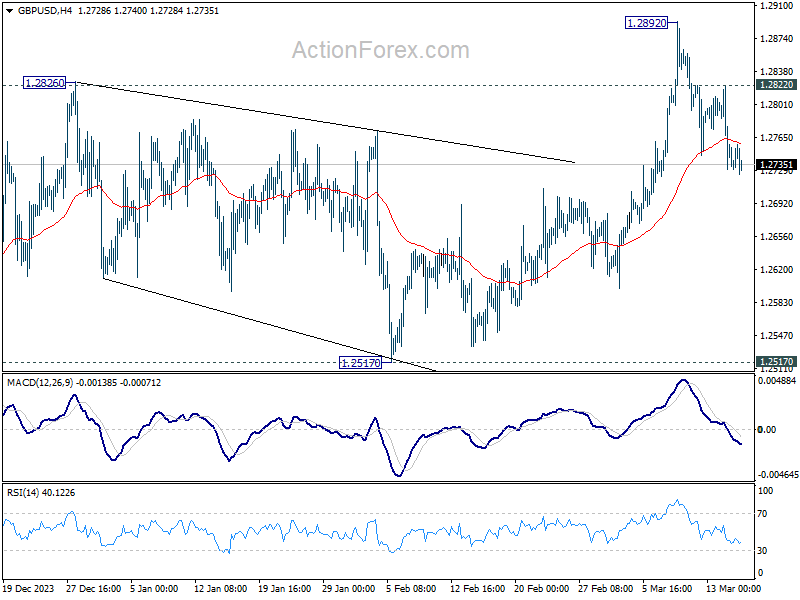
GBP/USD's decline last week indicates short term topping at 1.2892. Initial bias remains mildly on the downside this week for 55 D EMA (now at 1.2673). Firm break there will bring deeper fall to 1.2517 structural support. For now, risk will stay mildly on the downside as long as 1.2822 minor resistance holds, in case of recovery.
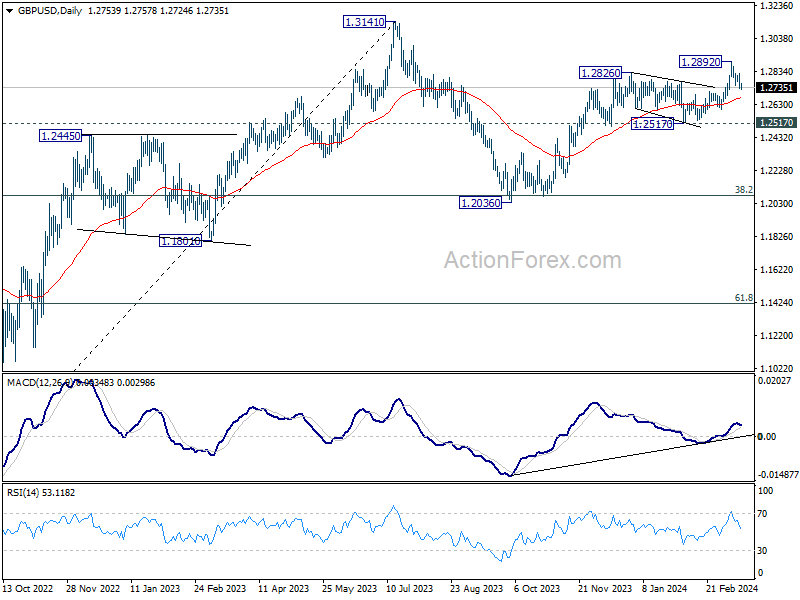
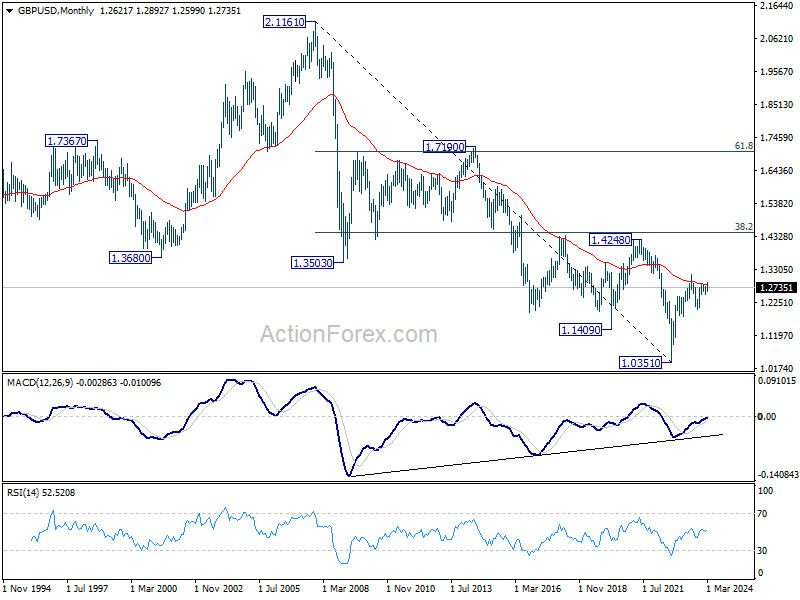
In the bigger picture, price actions from 1.3141 medium term top are seen as a corrective pattern to up trend from 1.0351 (2022 low). Rise from 1.2036 is seen as the second leg, which is still in progress. But upside should be limited by 1.3141 to bring the third leg of the pattern. Meanwhile, break of 1.2517 support will argue that the third leg has already started for 38.2% retracement of 1.0351 (2022 low) to 1.3141 at 1.2075 again.
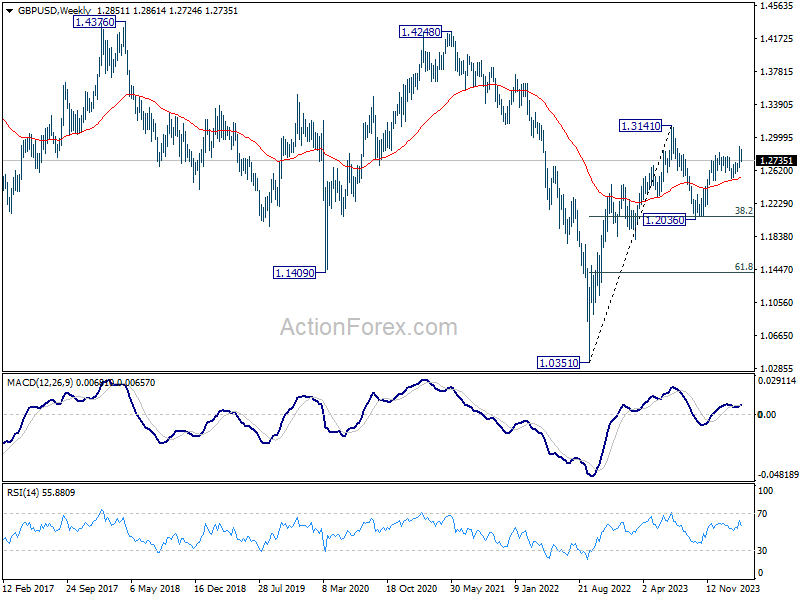
In the long term picture, a long term bottom should be in place at 1.0351 on bullish convergence condition in M MACD. But momentum of the rebound from 1.3051 argues GBP/USD is merely in consolidation, rather than trend reversal. Range trading is likely between 1.0351/4248 for some more time.
USD/CHF Weekly Outlook
USD/CHF's strong rebound last week suggests that consolidation from 0.8884 has completed with three waves to 0.8728. Initial bias stays mildly on the upside this week for retesting 0.8891 resistance first. Firm break there will resume whole rally from 0.8332. Next target is 61.8% projection of 0.8550 to 0.8884 from 0.8728 at 0.8934. For now, this will remain the favored case as long as 0.8728 support holds, in case of retreat.
In the bigger picture, price actions from 0.8332 medium term bottom as seen as developing into a corrective pattern to the down trend from 1.0146 (2022 high). Further rise would be seen as long as 0.8555 support holds. But upside should be limited by 0.9243 resistance, at least on first attempt.
In the long term picture, price action from 0.7065 (2011 high) are seen as a corrective pattern to the multi-decade down trend from 1.8305 (2000 high). Strong rebound from 61.8% retracement of 0.7065 to 1.0342 (2016 high) will start the third leg as a medium term rally. But there will be no sign of long term reversal until firm break of 38.2% retracement of 1.8305 to 0.7065 at 1.1359.