
Sample Category Title
USD/CHF Mid-Day Outlook
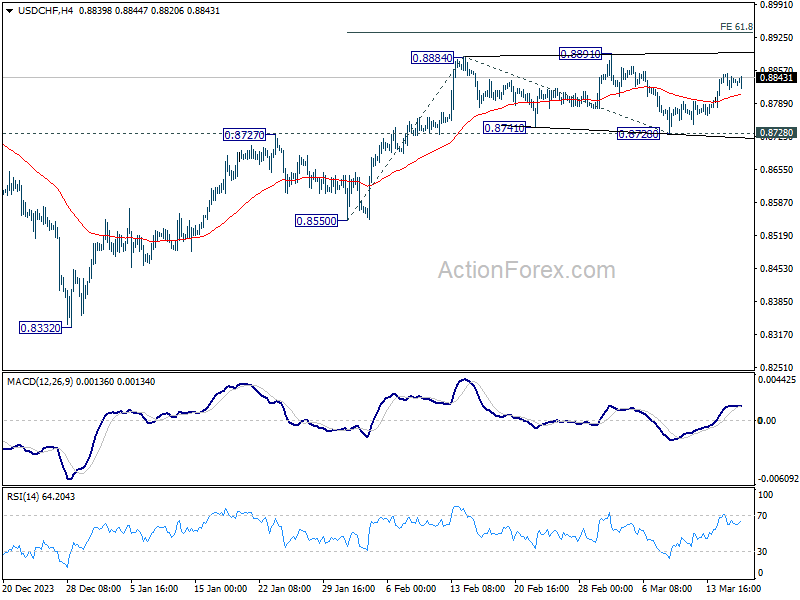
Daily Pivots: (S1) 0.8818; (P) 0.8836; (R1) 0.8852; More....
No change in USD/CHF's outlook and intraday bias stays mildly on the upside. As noted before, consolidation from 0.8884 should have completed with three waves to 0.8728. Further rally should be seen to retest 0.8891 resistance first. Firm break there will resume whole rally from 0.8332. Next target is 61.8% projection of 0.8550 to 0.8884 from 0.8728 at 0.8934. For now, this will remain the favored case as long as 0.8728 support holds, in case of retreat.
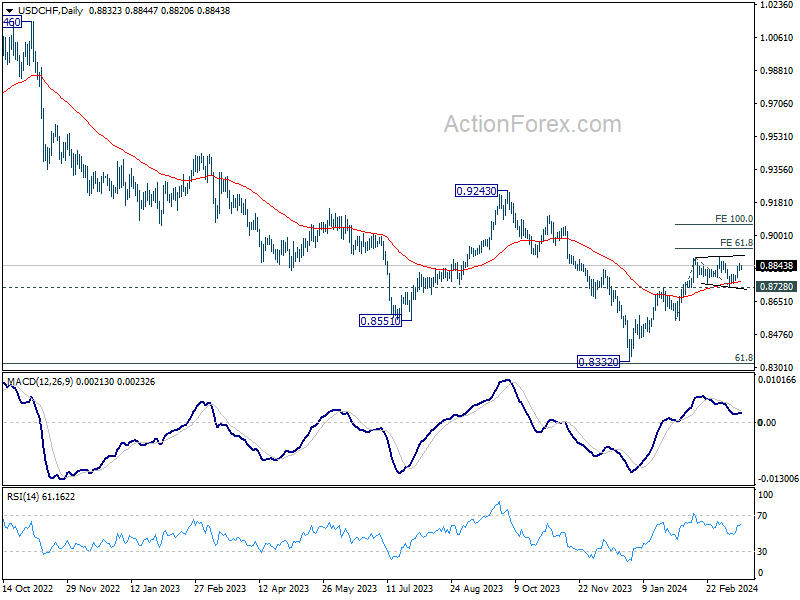
In the bigger picture, price actions from 0.8332 medium term bottom as seen as developing into a corrective pattern to the down trend from 1.0146 (2022 high). Further rise would be seen as long as 0.8555 support holds. But upside should be limited by 0.9243 resistance, at least on first attempt.
USD/JPY Mid-Day Outlook
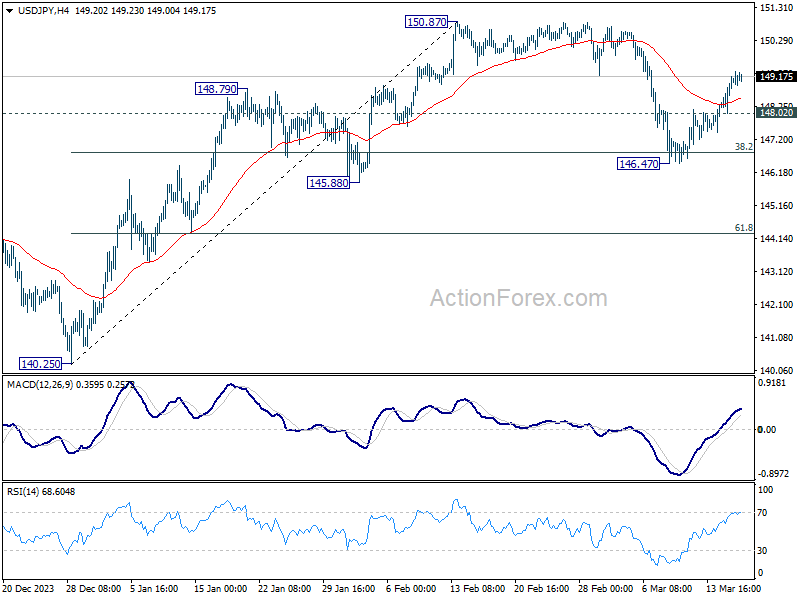
Daily Pivots: (S1) 148.34; (P) 148.75; (R1) 149.47; More...
USD/JPY's rebound from 146.47 is still in progress and intraday bias stays on the upside. Corrective fall from 150.87 should have completed at 146.47, after drawing support from 38.2% retracement of 140.25 to 150.87 at 146.81. Further rally should be seen to 150.87/89 key resistance zone. Nevertheless, on the downside, below 148.02 minor support will turn intraday bias neutral first.
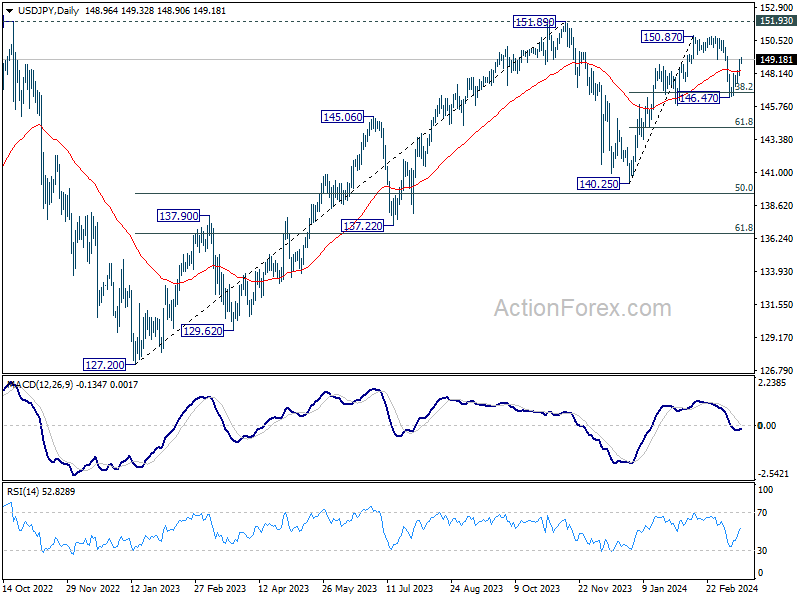
In the bigger picture, no change in the view that price action from 151.89 (2023 high) are correction to up trend from 127.20 (2023 low). The question is whether this correction has completed at 140.25, or extending with fall from 150.87 as the third leg. Sustained break of above mentioned 146.81 fibonacci level will favor the latter case. But even so, downside should be contained by 50% retracement of 127.20 to 151.89 at 139.54
Yen on the Brink as Markets Await BoJ
Yen's continued weakness persists in today's subdued market, despite growing expectations for a BoJ rate hike in the upcoming Asian session—a move anticipated to conclude its longstanding negative rates policy. Although the anticipated adjustment from -0.10% to 0.00% may seem minor, its symbolic significance for the Japanese economy is profound, as it heralds a new era of monetary policy.
Recent reports underscore the momentum building towards this policy shift. A Reuters article highlighted a source's comments on the robust wage increases by large enterprises, setting a positive precedent for smaller companies. Recent wages increase is seen as a catalyst for boosting consumption, stimulating demand and prices, suggesting BoJ might not need to defer action until April.
Conversations with CEOs, as reported by Bloomberg TV, reveal a readiness for an interest rate hike, regardless of whether it occurs in March or April, signifying a widespread acceptance of the impending policy change. Retailers also anticipate benefits from a stronger Yen, viewing it as a vital step towards normalizing inflation and the broader economy.
Yet, predicting BoJ's moves remains challenging, with the central bank known for its unpredictability. Thus, any surprises in the upcoming announcement would align with its historical pattern of unexpected decisions.
In the broader currency markets, Australian Dollar is the relatively stronger performer of the day, with New Zealand Dollar and Euro also showing mild strength. Dollar lags behind, positioned just ahead of Yen, followed closely by Swiss Franc. Sterling and the Canadian Dollar find themselves in a middle ground.
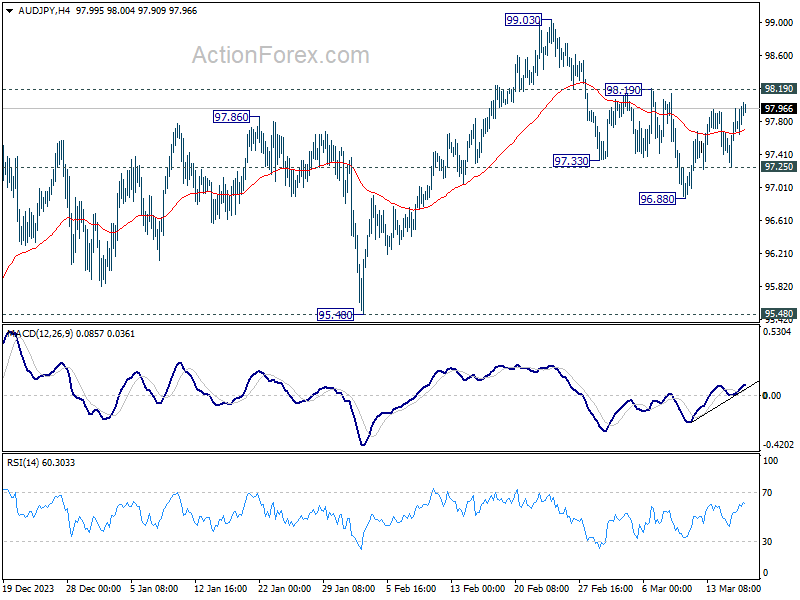
Technically, a main question is whether AUD/JPY's correction from 99.03 has completed with three waves down to 96.88 already. Decisive break of 98.19 will affirm this bullish case, and target 99.03 high next. However, break of 97.25 will indicate that fall from 99.03 is resuming through 96.88, towards 95.48 key support level. With BoJ and RBA poised to announce their rate decisions shortly, clarity on this technical query is imminent.
In Europe, at the time of writing, FTSE is up 0.19%. DAX is up 0.14%. CAC is up 0.05%. UK 10-year yield is down -0.0025 at 4.200. Germany 10-year yield is up 0.029 at 2.472. Earlier in Asia, Nikkei rose 2.67%. Hong Kong HSI rose 0.10%. China Shanghai SSE rose 0.99%. Singapore Strait Times fell -0.03%. Japan 10-year JGB yield fell -0.030 to 0.763.
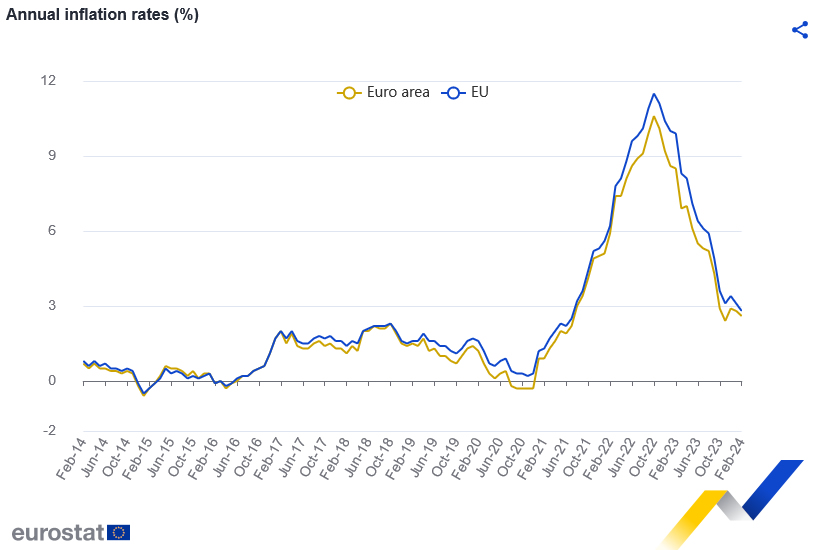
Eurozone CPI finalized at 2.6% in Feb, core CPI at 3.1%
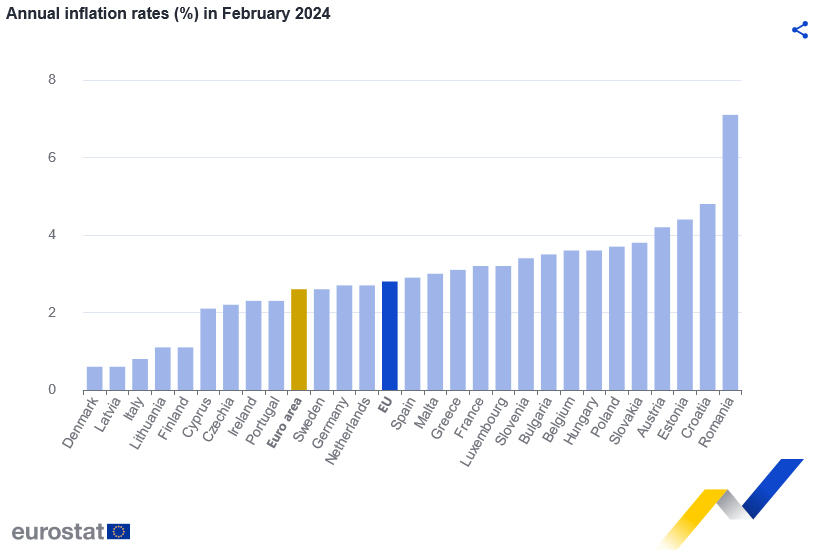
Eurozone CPI was finalized at 2.6% yoy in February, down from 2.8% yoy in January. CPI core (excluding energy, food, alcohol & tobacco) was finalized at 3.1% yoy, down from prior month's 3.3% yoy.
The highest contribution to the annual Eurozone inflation rate came from services (+1.73 percentage points, pp), followed by food, alcohol & tobacco (+0.79 pp), non-energy industrial goods (+0.42 pp) and energy (-0.36 pp).
EU CPI was finalized at 2.8% yoy. The lowest annual rates were registered in Latvia, Denmark (both 0.6%) and Italy (0.8%). The highest annual rates were recorded in Romania (7.1%), Croatia (4.8%) and Estonia (4.4%). Compared with January, annual inflation fell in twenty Member States, remained stable in five and rose in two.
NZ BNZ services rises to 53.0, signs of early and strong growth emerge
New Zealand's BusinessNZ Performance of Services Index climbed from 52.2 to 53.0 in February, marking its highest point since March 2023.
A closer examination of the index's components reveals a generally positive picture. Activity and sales maintained steady pace, inching slightly up from 53.0 to 53.1. Employment saw modest increase, moving closer to the expansionary threshold by rising from 48.3 to 49.1. Notably, new orders and business surged significantly from 52.4 to 56.0, the highest level recorded since December 2022.
The feedback from businesses highlighted persistent concerns, with the proportion of negative comments standing at 57.3% in February, a slight improvement from December's 58.7% but an increase from January's 53.0%. Businesses continue to identify the cost of living as the primary factor influencing activity, alongside the difficulties posed by the overall economic conditions.
BNZ's Head of Research Stephen Toplis said that "when we combine the PMI and PSI together to get an indicator of activity, there is a strong suggestion of growth returning later this year. The turnaround occurs a little stronger and earlier than we are forecasting but, whatever the case, it is a heartening sign".
China's industrial production expand 7% yoy, retail sales up 5.5% yoy
China's industrial production grew 7.0% yoy in the January-February period, above expectation of 5.3% yoy. During the same period, retail sales rose 5.5% yoy, below expectation 5.6% yoy.
Fixed asset investment rose 4.2% yoy, above expectation of 3.2% yoy. Investment into real estate fell by -9% yoy. Investment in infrastructure rose by 6.3% yoy while that in manufacturing increased by 9.4% yoy.
"The economy kept rebounding and improving in January and February with various policies taking effect. But we also need to see that the external environment is increasingly complex, grim and uncertain, and the problem of insufficient domestic demand still remains. The foundation for the economy's rebound needs to be further solidified," NBS said.
USD/JPY Mid-Day Outlook
Daily Pivots: (S1) 148.34; (P) 148.75; (R1) 149.47; More...
USD/JPY's rebound from 146.47 is still in progress and intraday bias stays on the upside. Corrective fall from 150.87 should have completed at 146.47, after drawing support from 38.2% retracement of 140.25 to 150.87 at 146.81. Further rally should be seen to 150.87/89 key resistance zone. Nevertheless, on the downside, below 148.02 minor support will turn intraday bias neutral first.
In the bigger picture, no change in the view that price action from 151.89 (2023 high) are correction to up trend from 127.20 (2023 low). The question is whether this correction has completed at 140.25, or extending with fall from 150.87 as the third leg. Sustained break of above mentioned 146.81 fibonacci level will favor the latter case. But even so, downside should be contained by 50% retracement of 127.20 to 151.89 at 139.54
Economic Indicators Update
| GMT | Ccy | Events | Actual | Forecast | Previous | Revised |
|---|---|---|---|---|---|---|
| 21:30 | NZD | Business NZ PSI Feb | 53 | 52.1 | 52.2 | |
| 23:50 | JPY | Machinery Orders M/M Jan | -1.70% | -0.70% | 2.70% | |
| 02:00 | CNY | Industrial Production Y/Y Feb | 7.00% | 5.30% | 6.80% | |
| 02:00 | CNY | Retail Sales Y/Y Feb | 5.50% | 5.60% | 7.40% | |
| 02:00 | CNY | Fixed Asset Investment YTD Y/Y Feb | 4.20% | 3.20% | 3.00% | |
| 10:00 | EUR | Eurozone Trade Balance (EUR) Jan | 14.2B | 13.0B | ||
| 10:00 | EUR | Eurozone CPI Y/Y Feb F | 2.60% | 2.60% | ||
| 10:00 | EUR | Eurozone CPI Core Y/Y Feb F | 3.10% | 3.10% | ||
| 12:30 | CAD | Industrial Product Price M/M Feb | 0.00% | -0.10% | ||
| 12:30 | CAD | Raw Material Price Index Feb | 0.80% | 1.20% | ||
| 14:00 | USD | NAHB Housing Index Mar | 48 | 48 |
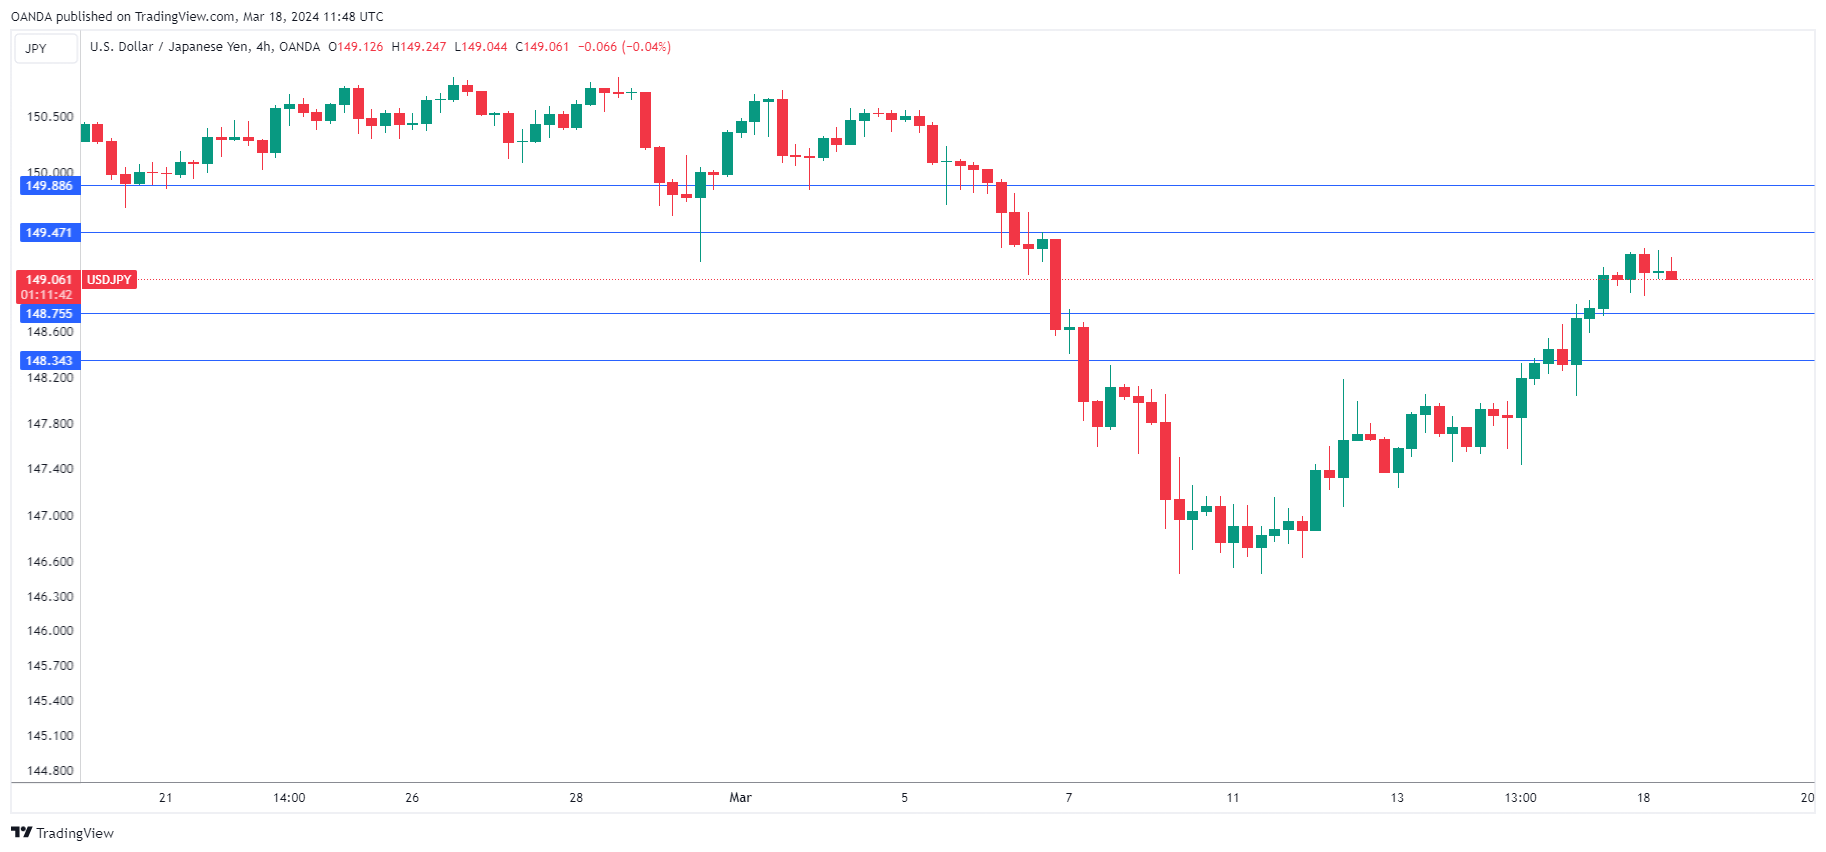
USD/JPY in Holding Pattern Ahead of Key BoJ Meeting
The Japanese yen is showing limited movement to start off the week. In the European session, USD/JPY is trading is almost unchanged at 149.07.
Will the BoJ raise rates on Tuesday?
The Bank of Japan will make its rate announcement on Tuesday and there is a strong possibility that the BoJ will lift interest rates out of negative territory. This would mark a sea-change in policy as the last rate hike occurred in 2007.
Japan is experiencing inflation after years of deflation, and speculation has been rising that the BoJ will pivot after years of an ultra-accommodative monetary policy. Governor Ueda has repeatedly stressed that the BoJ will not tighten until wage growth rises, as that would be evidence that inflation is sustainable.
The annual wage negotiations indicate a massive victory for workers, with wages set to rise as much as 5.2%. This could well be the signal that Ueda needs to hit the rate-hike trigger. The key question is whether the BoJ will raise rates on Tuesday or wait until April, which would provide the central bank with more data before making such a critical decision.
It’s a close call as to whether the BoJ will make the move on Tuesday or wait until April. Goldman Sachs is expecting that the BoJ will raise rates and also abolish its yield curve control policy which it uses to target interest rates levels.
If the BoJ raises rates, the yen will likely move higher. Even if the central bank stands pat, with expectations of a possible move at a fever pitch, we can expect volatility from the yen after the meeting.
Hold tight for what should be a busy Tuesday.
USD/JPY Technical
- USD/JPY put pressure on resistance at 149.47 earlier. Above, there is resistance at 149.88
- 148.75 and 148.34 are providing support
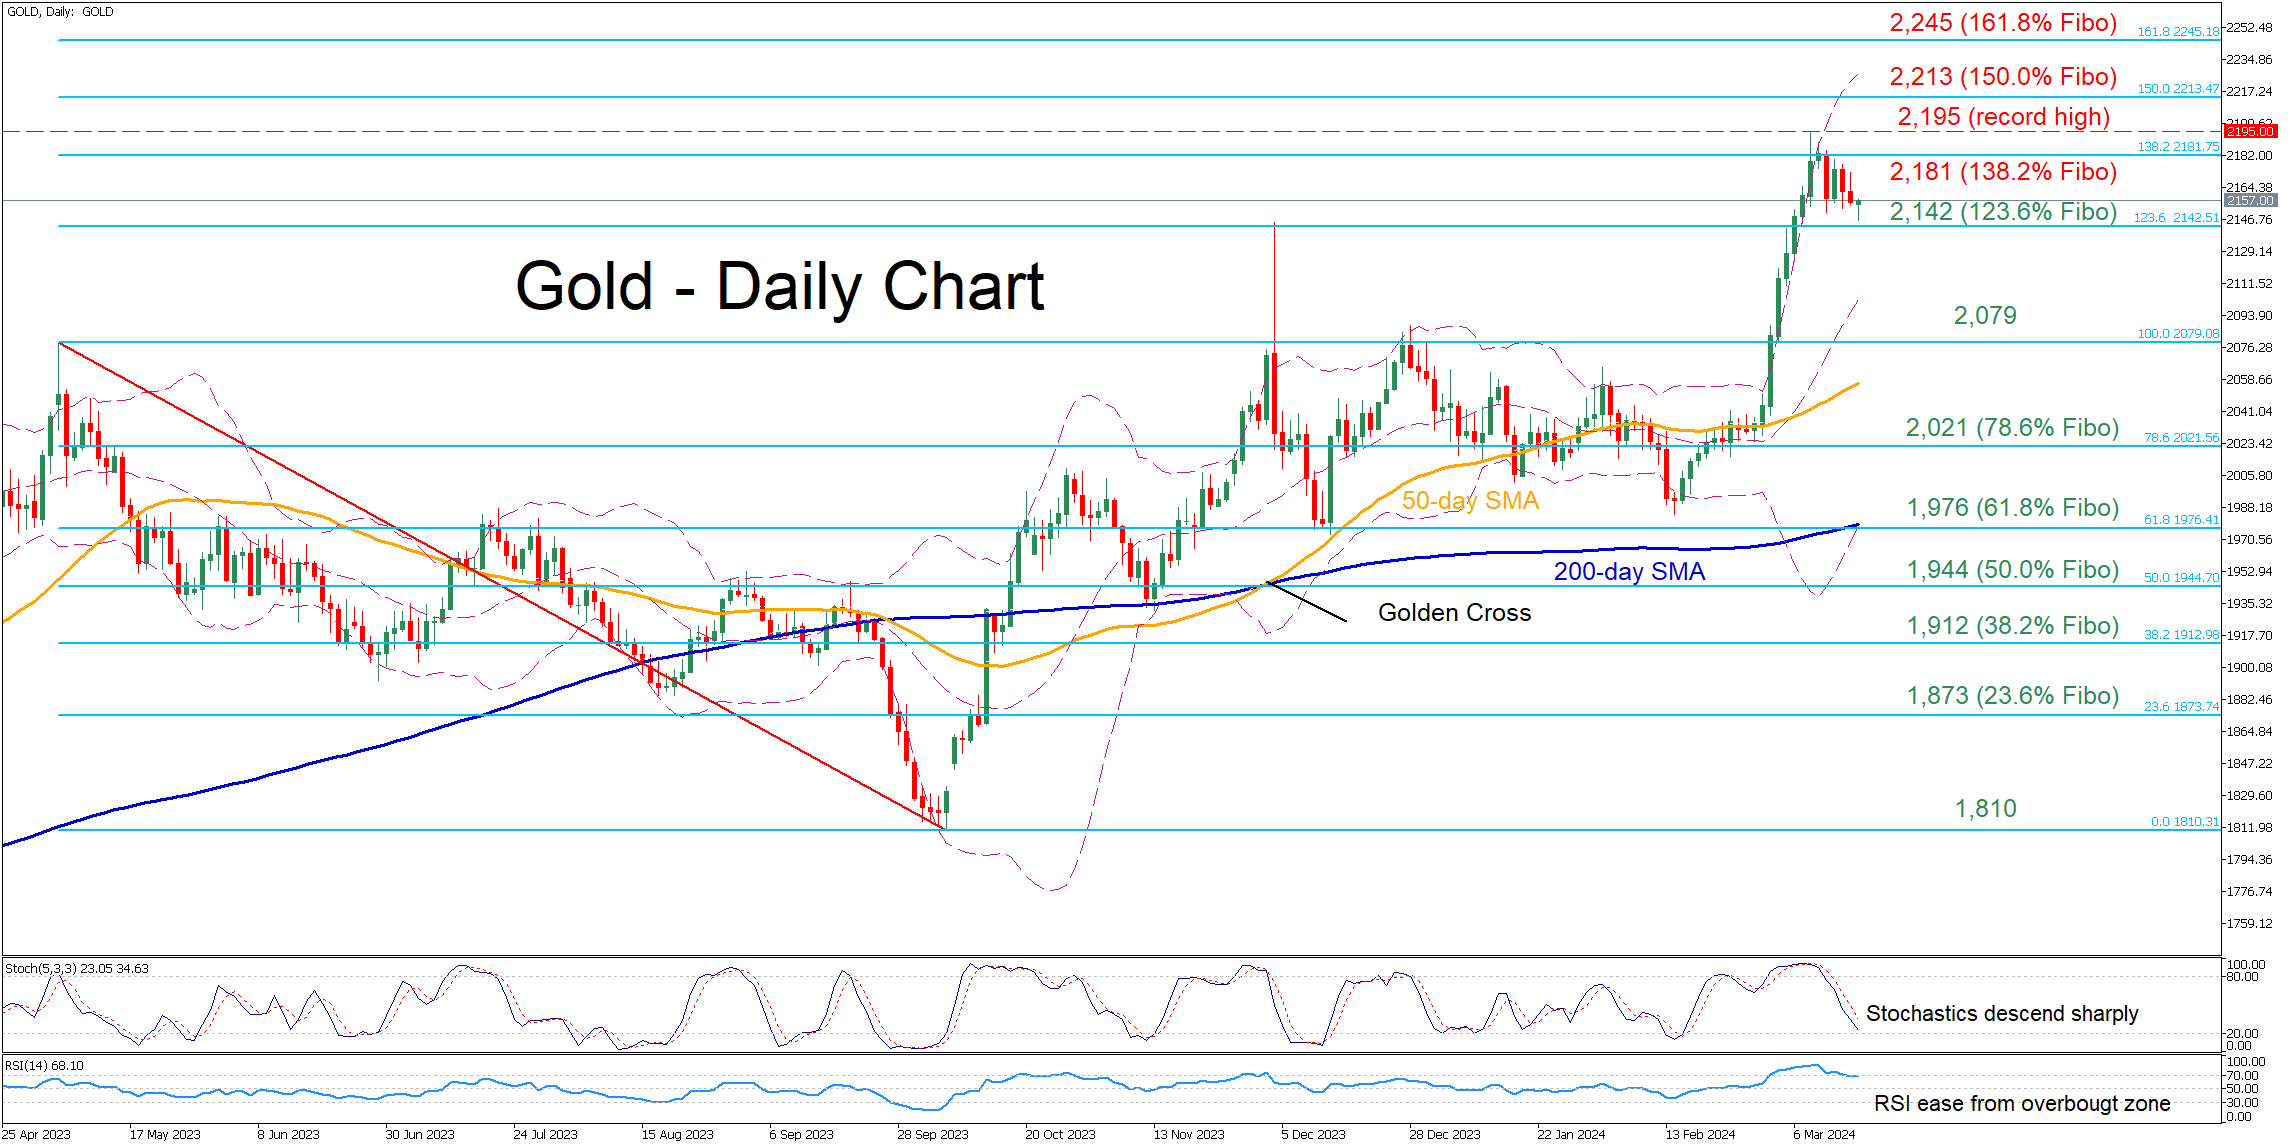
Gold Retreats from All-Time High
- Gold pulls back from its recent record peak
- Momentum indicators exit overbought conditions
Gold experienced a massive surge following its profound break above the 50-day simple moving average (SMA), posting a fresh all-time high of 2,195 on March 8. However, bullion has been undergoing a minor downside correction since then as it had approached extremely overbought conditions.
Should the pullback extend, the November peak of 2,142, which coincides with the 123.6% Fibonacci extension of the 2,079-1,810 downleg, could act as the first line of defence. Further declines could then come to a halt at 2,079, a region that provided resistance both in April and December 2023. Even lower, the 78.6% Fibo of 2,021 might provide downside protection.
On the flipside, if the price erases its recent setback and marches higher, initial resistance could be found at the 138.2% Fibo of 2,181 ahead of the all-time peak of 2,195. A violation of that zone could pave the way for the 150.0% Fibo of 2,213.
In brief, gold has been experiencing a pullback from its record high after reaching extremely overbought conditions. Should the price break below the 123.6% Fibo of 2,142, the decline could accelerate as there is no prominent support until the 2,080 region.
Eurozone CPI finalized at 2.6% in Feb, core CPI at 3.1%
Eurozone CPI was finalized at 2.6% yoy in February, down from 2.8% yoy in January. CPI core (excluding energy, food, alcohol & tobacco) was finalized at 3.1% yoy, down from prior month's 3.3% yoy.
The highest contribution to the annual Eurozone inflation rate came from services (+1.73 percentage points, pp), followed by food, alcohol & tobacco (+0.79 pp), non-energy industrial goods (+0.42 pp) and energy (-0.36 pp).
EU CPI was finalized at 2.8% yoy. The lowest annual rates were registered in Latvia, Denmark (both 0.6%) and Italy (0.8%). The highest annual rates were recorded in Romania (7.1%), Croatia (4.8%) and Estonia (4.4%). Compared with January, annual inflation fell in twenty Member States, remained stable in five and rose in two.
EURUSD Trades Sideways After Sharp DFrop
- EURUSD rotates lower after its advance gets rejected
- Trades flat in past few sessions within the Ichimoku cloud
- Momentum indicators weaken but remain positive
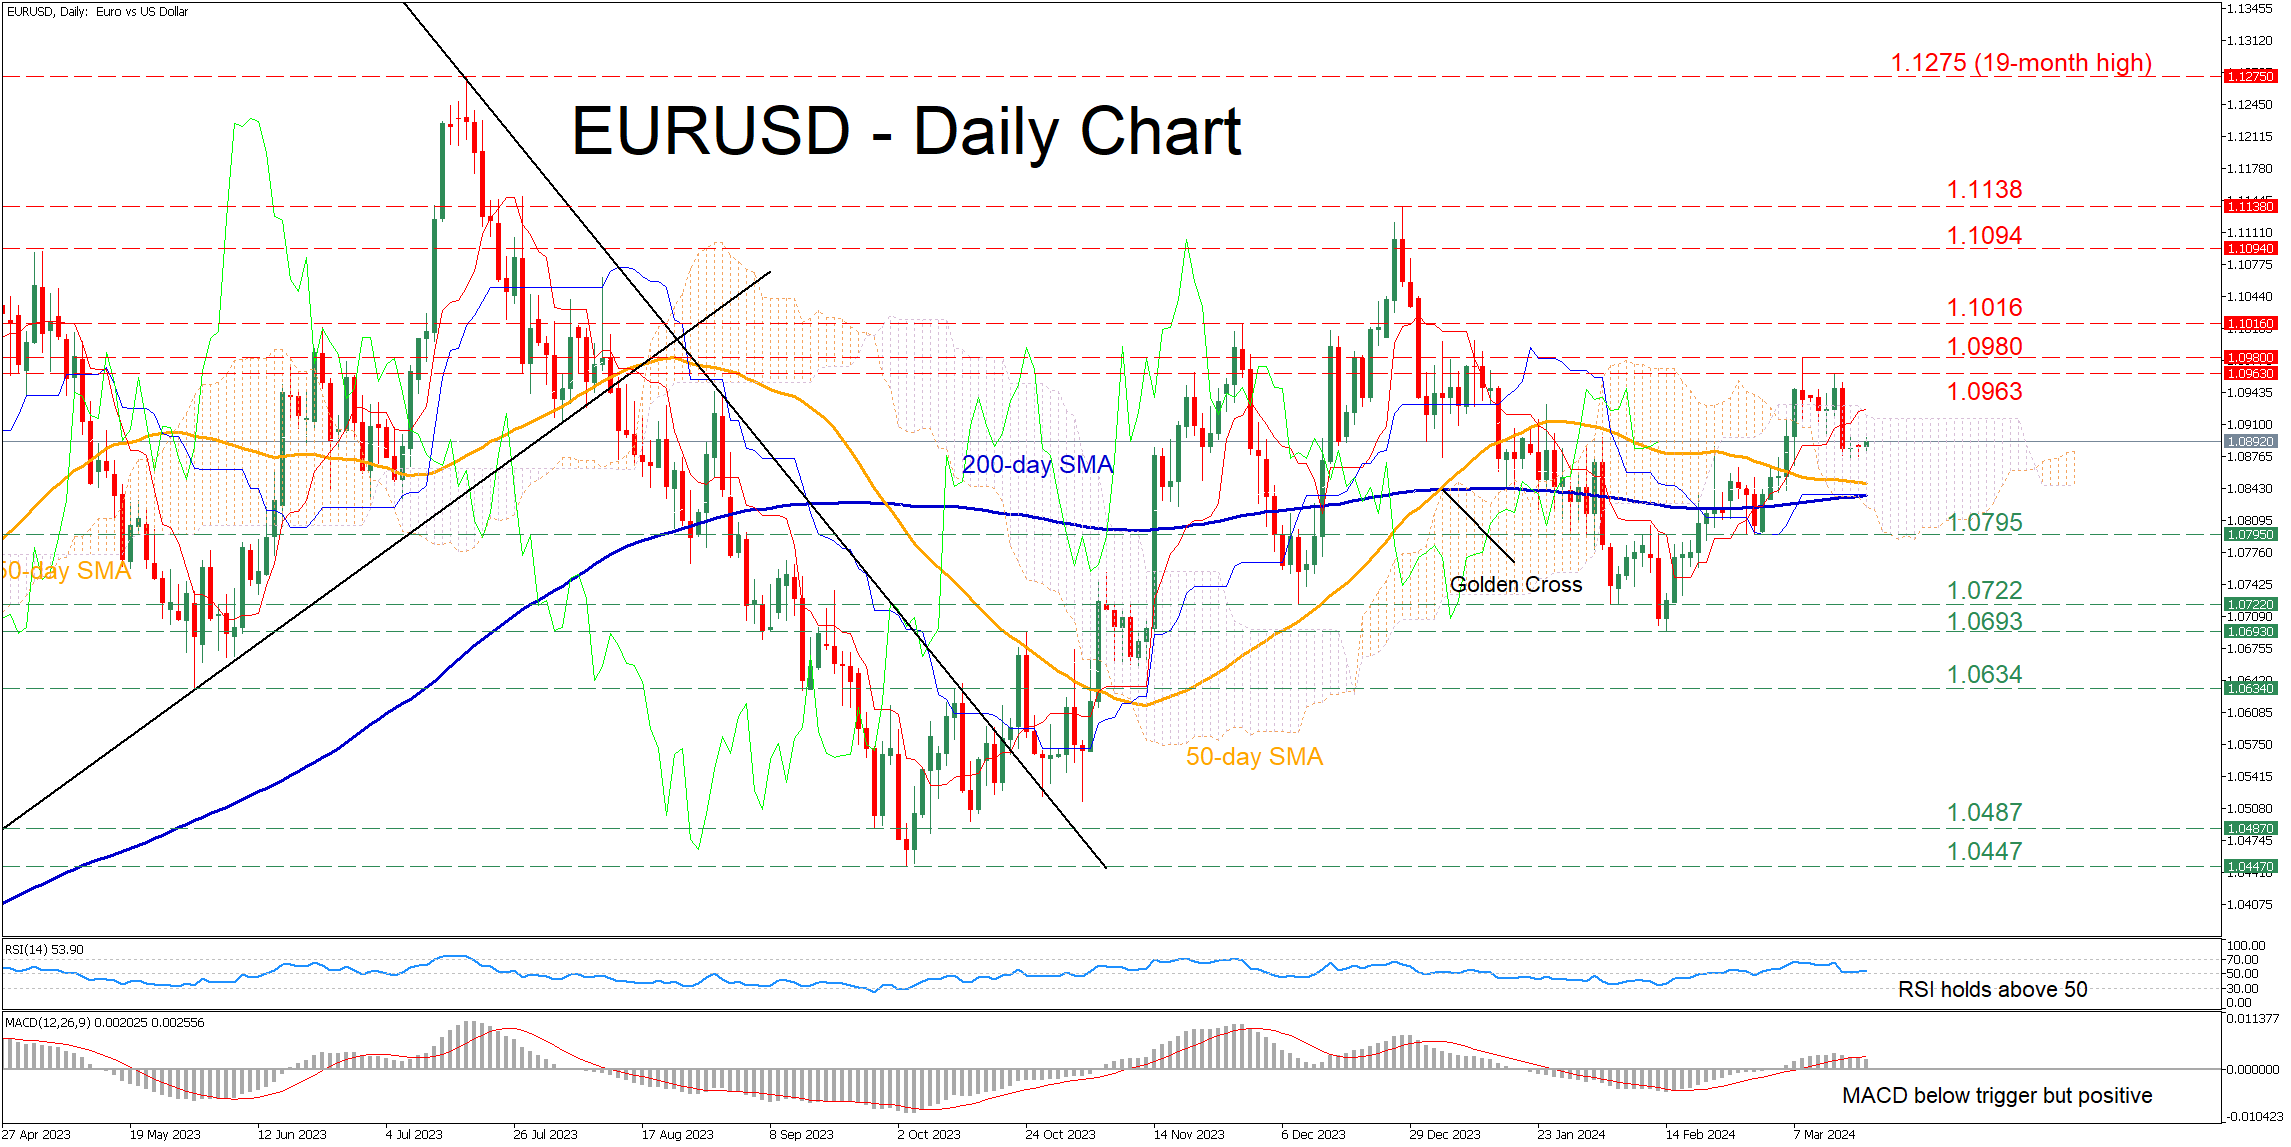
EURUSD had been in a steady recovery from its 2024 bottom of 1.0693, advancing to as high as 1.0980 on March 8. However, the pair’s rebound was rejected after a temporary jump above the Ichimoku cloud, with the short-term oscillators deteriorating significantly but holding above their neutral zones.
Should the recent weakness persist, the price could fall below both its 50- and 200-day simple moving averages (SMAs) and test the February-March support of 1.0795. Sliding beneath that floor, the price may descend towards the December bottom of 1.0722. Even lower, the 2024 low of 1.0693 could provide downside protection.
Alternatively, if the pair reverses back higher, immediate resistance could be found at 1.0963 ahead of the recent rejection region of 1.0980. A violation of the latter could pave the way for the November high of 1.1016. Further advances may then encounter resistance at the April 2023 peak of 1.1094.
In brief, EURUSD has been relatively quiet in the past couple of sessions, hovering within its Ichimoku cloud after its attempt for recovery got rejected. Nevertheless, the ascending 200-day SMA is closing the gap with the 50-day SMA, where a potential death cross could trigger a new round of weakness.
BTC/USD Analysis: Bears Have Become More Active Near $70,000 Level
On February 26 (A), a strong bullish impulse started in the Bitcoin market. Its trajectory is visually described by a blue line. The price of bitcoins developed along it — this can be interpreted in such a way that market participants agreed that the value of the cryptocurrency was increasing.
If the price of Bitcoin deviated from the blue line, it was only for a short period of time. For example, to pierce the psychological level of USD 60,000 on March 5th.
However, the bullish momentum changed on March 15th, and this can be seen on the BTC/USD chart today:
→ the blue line began to work as resistance (shown by the first arrow);
→ the level of USD 70,000 also began to act as resistance (shown by the second arrow).
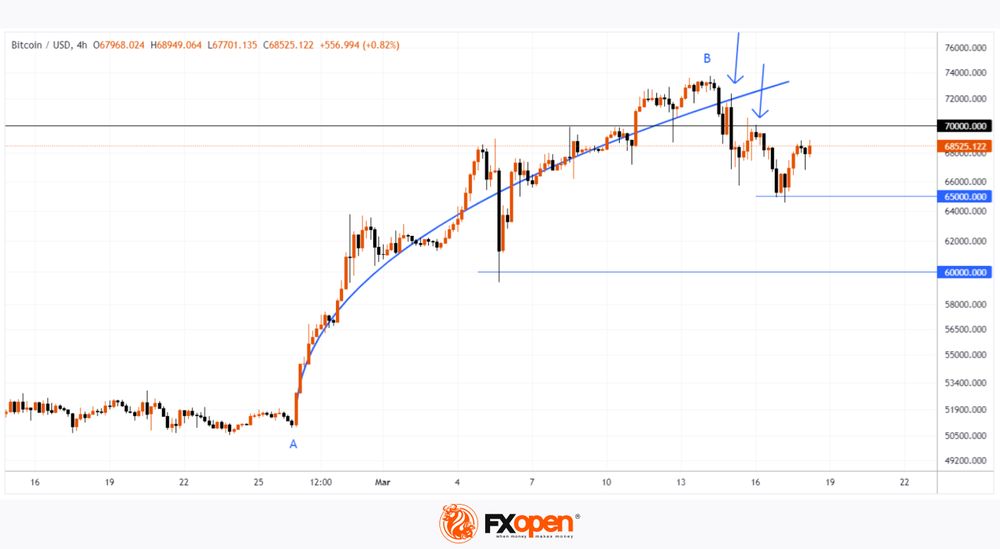
BTC price briefly deviated from breaking through the psychological USD 65,000 level - but it appears that due to said resistances, bulls may now have trouble getting Bitcoin price back onto the upward trajectory shown by the blue line.
This could mean that the market's consensus on the value of BTC has changed - the chart suggests that a price of over USD 70k per Bitcoin may be considered overpriced (not surprising after A→B's rise of over 40% in 14 days).
On the other hand, demand remains high ahead of the halving (scheduled for April 19).
According to Matt Hougan (a top executive at Bitwise, one of the BTC ETF providers), about 40% of independent registered financial advisors at Barron's Summit owned Bitcoin. And this number among their clients is about 5-10%, which leaves potential for further growth.
Matt Hougan also noted the growing concern about the huge US government debt, and Bitcoin in this case acts as an insurance asset.
Given the strong fundamentals and signs of technical weakness near the last historical high, it is reasonable to assume that the price of Bitcoin may form some kind of consolidation zone around USD 70,000, thereby suggesting the levels that most market participants consider a fair price for Bitcoin at the moment.
FXOpen offers the world's most popular cryptocurrency CFDs*, including Bitcoin and Ethereum. Floating spreads, 1:2 leverage — at your service. Open your trading account now or learn more about crypto CFD trading with FXOpen.
*At FXOpen UK and FXOpen AU, Cryptocurrency CFDs are only available for trading by those clients categorised as Professional clients under FCA Rules and Professional clients under ASIC Rules respectively. They are not available for trading by Retail clients.
This article represents the opinion of the Companies operating under the FXOpen brand only. It is not to be construed as an offer, solicitation, or recommendation with respect to products and services provided by the Companies operating under the FXOpen brand, nor is it to be considered financial advice.
AUD/USD Stabilizes Amid Chinese Economic Data and US Inflation Concerns
The Australian dollar has momentarily halted its downward trajectory against the US dollar, stabilizing around the 0.6565 mark. With a lack of significant domestic data from Australia, the AUD's movements are largely influenced by the performance of the Chinese yuan and economic developments from China. Recently, the offshore yuan weakened to its lowest in a week at 7.2 against the US dollar, following a series of macroeconomic updates from China.
China's industrial output showed an impressive year-on-year increase of 7.0%, exceeding both the anticipated 6.5% growth and the previous rate of 4.6%. Capital investment also outperformed expectations, registering a 4.2% year-on-year rise compared to the forecasted 3.2%. Retail sales growth in February was reported at 5.5% year-on-year, albeit a slowdown from January's 7.4% increase. Additionally, the January employment report indicated a slight uptick in unemployment, rising to 5.3% from the prior 5.1%.
Despite these positive indicators from China, the yuan's valuation remains pressured by robust US inflation data, which complicates the Federal Reserve's pathway to easing monetary policy. The prevailing market expectation now leans towards a potential 25 basis point rate cut by the Fed in June, with around a 60% probability of this outcome, a shift from earlier predictions of a spring rate cut.
Given Australia's close economic and trade ties with China, these statistics from China are particularly significant for the AUD's performance.
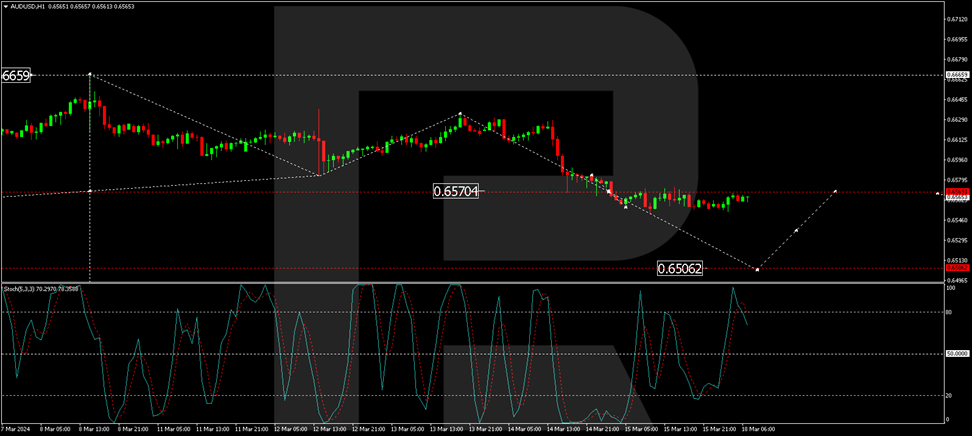
Technical analysis of AUD/USD
The H4 chart analysis of AUD/USD indicates a consolidation phase around the 0.6570 level, with expectations of a downward breakout leading to the continuation of the decline towards the local target of 0.6506. After reaching this target, a potential corrective movement to 0.6570 (testing from below), followed by a further drop to 0.6477, is anticipated. The MACD indicator, with its signal line pointing downwards, supports this bearish scenario.
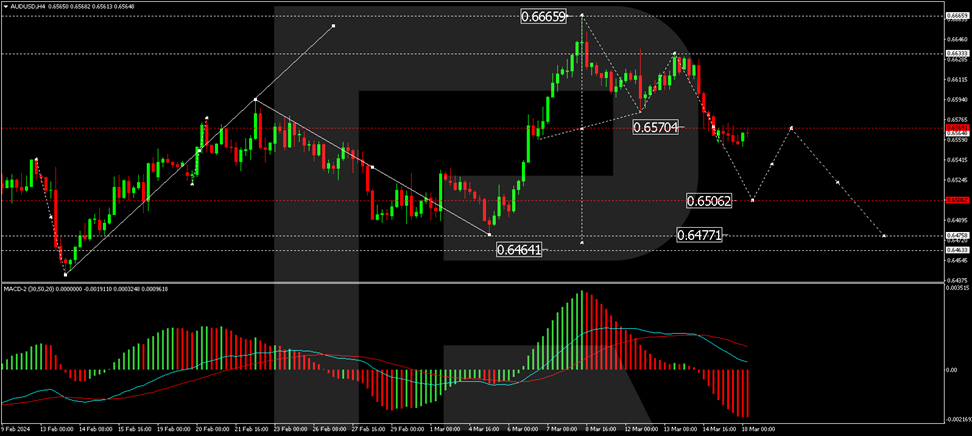
On the H1 chart, the AUD/USD pair has concluded its declining wave structure at 0.6570, with a consolidation phase currently observed around this mark. A downward breakout from this consolidation is expected today, aiming for the 0.6506 level. Upon achieving this target, the onset of a corrective phase to 0.6570 (testing from below) may be considered. The Stochastic oscillator, currently above 80 and poised to descend to 20, corroborates the likelihood of this continuation in the bearish trend.
This Week is Jampacked with Central Bank Meetings
Markets
Core bonds fell on each and every day last week, including on Friday. Weekly gains for US yields varied between 17.6 bps (30-y) to 27.9 bps (5-y). German rates added between 14.7 and 19.1 bps in a curve move similar to the US. Real yields accounted for the bulk of the move. Note however how Friday’s moves were relatively limited in size compared to other days, suggesting some exhaustion ahead of important events taking place this week. These include a whole range of central bank meetings with the Fed being the headliner. Last week’s rates rally brought the first resistance areas - in particular the February year-to-date highs - nearby. This put a dampener on the surge as well. The combination of real yields rising with stock markets close to record highs triggered some profit-taking. Wall Street on Friday shed about 1% (Nasdaq). European equities ended choppy trading slightly lower. Thursday’s dollar surge against the euro didn’t roll-over into Friday but it was a close call. EUR/USD traded close to but below 1.09. The trade-weighted dollar index did eke out a small gain thanks to JPY weakness. Friday morning’s wage negotiation results paved the way for a BoJ hike out of negative territory (perhaps as soon as tomorrow) but that failed to inspire the Japanese currency. USD/JPY jumped from 148.33 to 149.04. Oil prices steadied north of $85/b. A hefty jump in copper last week pushed its price to the highest since April last year in a potential sign markets are moving beyond peak pessimism on Chinese and, more generally, global growth. Investment and factory data in the former this morning in any case came in to the topside of expectations but slowing retail sales and the ongoing malaise in the property sector still warrant caution.
This week is jampacked with central bank meetings. Japan and Australia kick off tomorrow. Wednesday’s Fed meeting is the one most closely looked at: how is stubborn inflation and ongoing eco resilience going to affect the central bank’s forecasts? And the rates dot plot? And the estimated neutral rate? The Czech Republic joins the US on Wednesday while Frankfurt holds its 24th ECB and Its Watchers conference. High-profile speakers include president Lagarde, chief economist Lane and board member Schnabel. The three central debates revolve around the inflation surge and whether it is over, monetary policy transmission and the implications of geopolitics & structural change. Thursday gives the stage to the Bank of England, Norges Bank and the Swiss National Bank. We’re treated on the March PMIs the same day to top it off. Ahead of this much event risk, it would make sense for markets to stick to the sidelines today. We expect technically insignificant trading, both on core bond markets as on currency markets.
News & Views
Rating agency Moody’s raised the outlook on the Spanish Baa1 rating from stable to positive, underpinned by a more balance growth model. Low private sector leverage, a robust banking sector, a current account surplus and a strengthened labour market are the outcome of strong governance and increased policy effectiveness to tackle those previous imbalances. Moody’s believes that exports and domestic demand to become economic drivers with the scope for further growth of the tourism sector being more limited. Real GDP growth forecasts for this year and next are 1.7% and 1.8%, both above potential growth (estimated at 1.5%-1.6%). The Baa1 rating remains one of the weaker investment grade levels (and below Fitch’s A- and S&P’s A; both stable outlook) because of Spain’s high debt burden which – coupled with weakening debt affordability and structural challenges related to population ageing – remains a constraint on fiscal strength. Moody’s expect the budget deficit to be around 3% of GDP in the next three years with the debt ratio expected to moderate from 107.7% of GDP in 2023 to 105% in 2026.
UK Rightmove house prices rose by 1.5% M/M in March, the fastest pace since May 2023. Prices are up 0.8% from a year ago, extending evidence that the housing market is strengthening again. Asking prices remained almost £5000 below their peak levels last and it still took an average of 71 days for properties to find a buyer (longest for the time of the year since 2019). Buyer demand and sales are respectively 8% and 13% higher than a year ago.