Sample Category Title
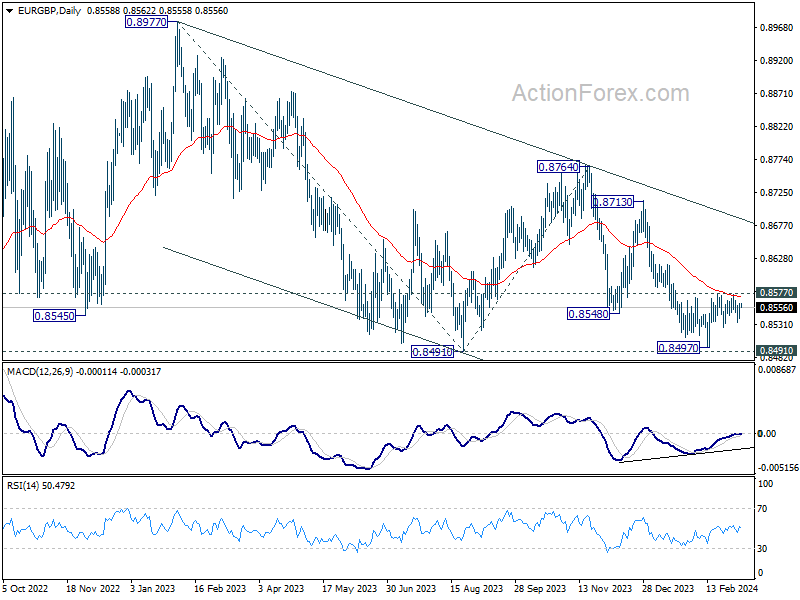
EUR/GBP Daily Outlook
Daily Pivots: (S1) 0.8546; (P) 0.8555; (R1) 0.8568; More...
Intraday bias in EUR/GBP remains neutral for the moment. Considering bullish convergence condition in D MACD, decisive break of 0.8577 and 55 D EMA (now at 0.8572) will argue that fall from 0.8764 has completed. Intraday bias will be back on the upside for rebound towards 0.8713 resistance. Nevertheless, firm break of 0.8491/7 support zone will confirm larger down trend resumption.
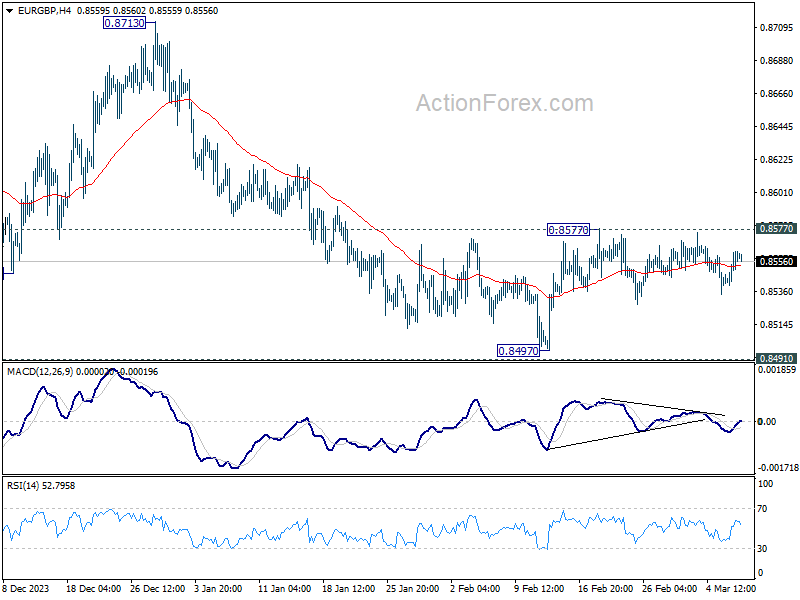
In the bigger picture, fall from 0.8764 is seen as another leg in the whole down trend from 0.9267 (2022 high). Outlook will stay bearish as long as 0.8713 resistance holds. Break of 0.8491 will target 61.8% projection of 0.8977 to 0.8491 from 0.8764 at 0.8464.
EUR/AUD Daily Outlook
Daily Pivots: (S1) 1.6551; (P) 1.6630; (R1) 1.6683; More...
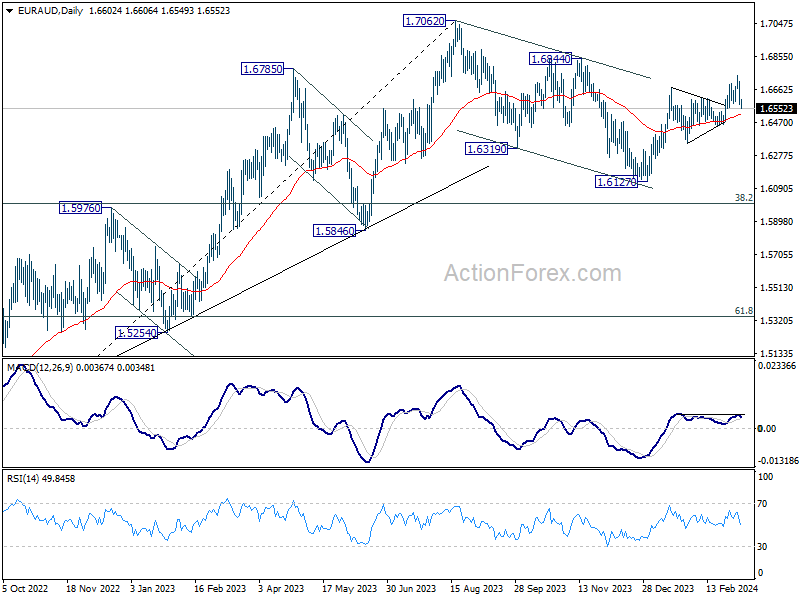
EUR/AUD's deeper decline from 1.6742 and break of 1.6578 minor support mixes up the near term outlook. Intraday bias is back on the downside for 1.6450 support first. Decisive break there will argue that whole rebound from 1.6127 has completed with three waves up to 1.6742, and turn near term outlook bearish. On the upside, though, break of 1.6742 will resume this rebound.
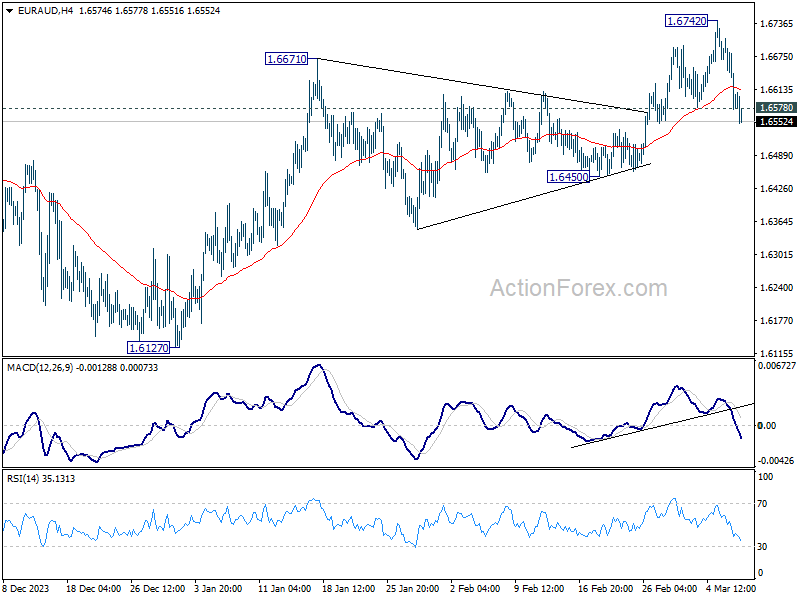
In the bigger picture, fall from 1.7062 medium term top is seen as a correction to the up trend from 1.4281 (2022 low). Break of 1.6844 resistance will argue that this up trend is ready to resume through 1.7062 high. In case of another fall, strong support should be seen around 1.5846 and 38.2% retracement of 1.4281 to 1.7062 at 1.6000 to bring rebound.
EUR/CHF Daily Outlook
Daily Pivots: (S1) 0.9591; (P) 0.9611; (R1) 0.9634; More...
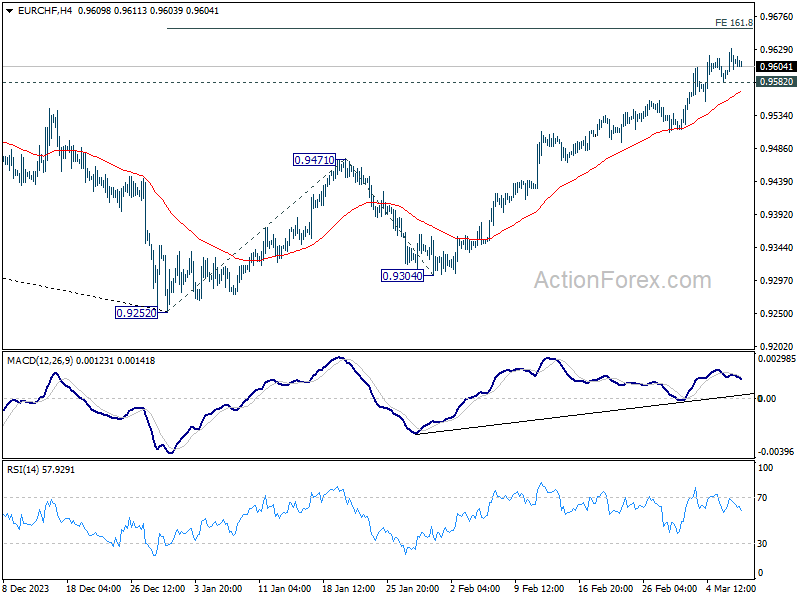
Intraday bias in EUR/CHF stays on the upside despite diminishing upside momentum. Rise from 0.9252 is in progress for 161.8% projection of 0.9252 to 0.9471 from 0.9304 at 0.9658 next. On the downside, below 0.9582 minor support will turn intraday bias neutral and bring consolidations first, before staging another rise.
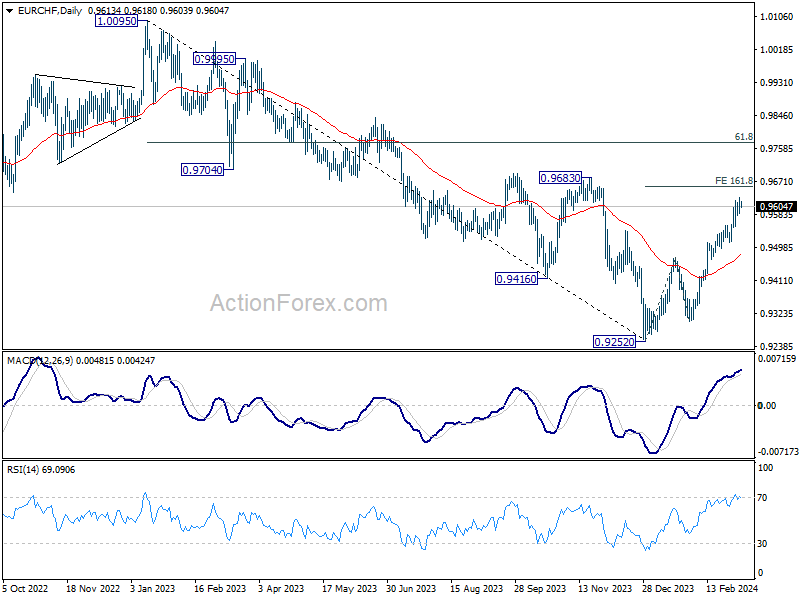
In the bigger picture, as long as 0.9683 resistance holds, rebound from 0.9252 are seen as a corrective move only. Larger down trend is expected to resume through 0.9252 after the correction completes. However, firm break of 0.9683 and sustained trading above 55 W EMA (now at 0.9622) will argue that 0.9252 is already a medium term bottom. Stronger rise would then be seen 61.8% retracement of 1.0095 to 0.9252 at 0.9773 and above.
USD/CAD Daily Outlook
Daily Pivots: (S1) 1.3475; (P) 1.3538; (R1) 1.3577; More...
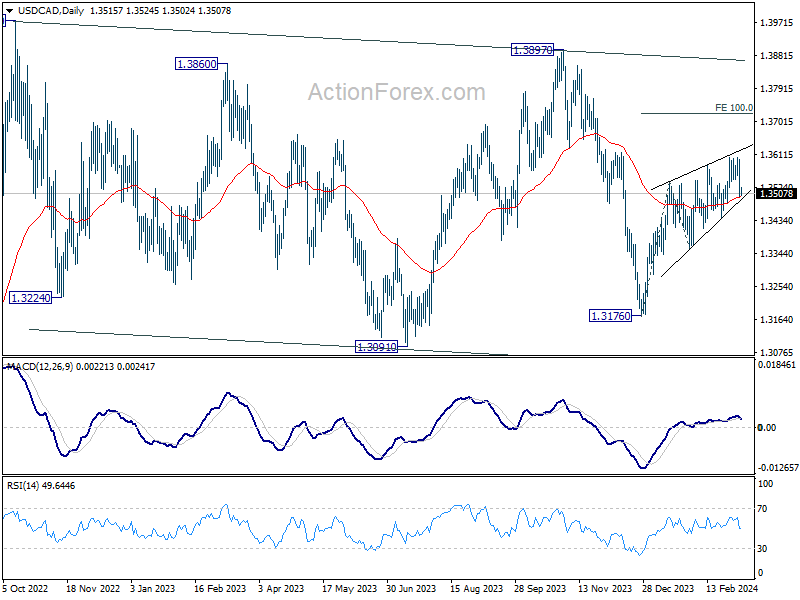
Intraday bias in USD/CAD remains neutral and outlook is unchanged. Further rally is expected as long as 1.3439 support holds. Break of 1.3605 will resume the rise from 1.3176 and target 100% projection of 1.3176 to 1.3540 from 1.3357 at 1.3721 next. However, firm break of 1.3439 will argue that rebound from 1.3176 has completed, and bring deeper fall to 1.3357 support next.
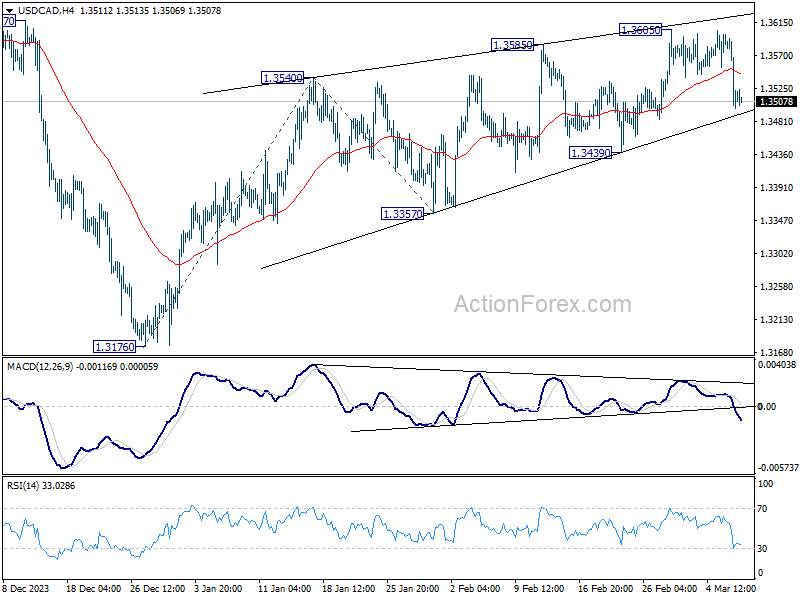
In the bigger picture, price actions from 1.3976 (2022 high) are viewed as a corrective pattern only. In case of another fall, strong support should emerge above 1.2947 resistance turned support to bring rebound. Overall, larger up trend from 1.2005 (2021 low) is still expected to resume through 1.3976 at a later stage.
AUD/USD Daily Report
Daily Pivots: (S1) 0.6511; (P) 0.6547; (R1) 0.6600; More...
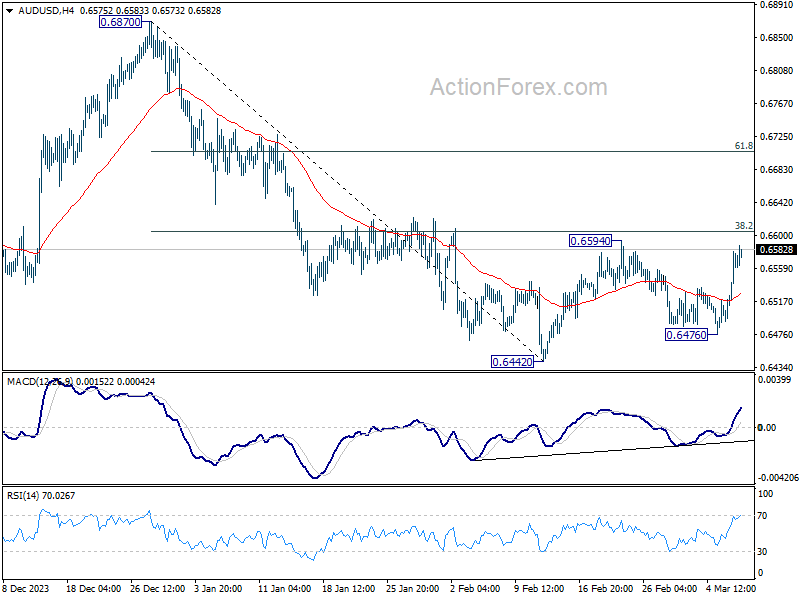
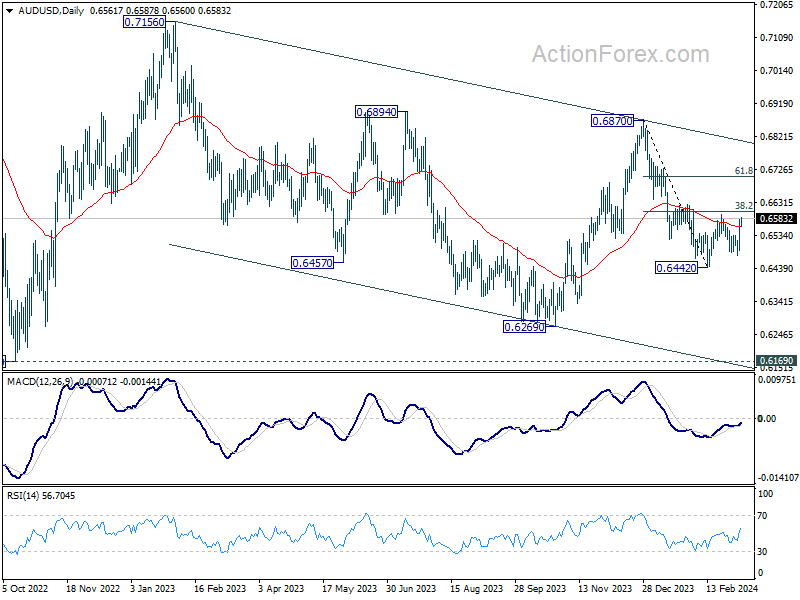
AUD/USD's strong rebound suggests that corrective pattern from 0.6442 is extending with another leg. While further rise cannot be ruled out, upside should be limited by 38.2% retracement of 0.6877 to 0.6442 at 0.6605. Break of 0.6476 support will argue that fall from 0.6870 is ready to resume through 0.6442 low. However, sustained break of 0.6605 will dampen this bearish view and bring stronger rise to 61.8% retracement at 0.6707 instead.
In the bigger picture, price actions from 0.6169 (2022 low) are seen as a medium term corrective pattern to the down trend from 0.8006 (2021 high). Fall from 0.7156 (2023 high) is seen as the second leg, which might still be in progress. Overall, sideway trading could continue in range of 0.6169/7156 for some more time. But as long as 0.7156 holds, an eventual downside breakout would be mildly in favor.
EUR/USD Daily Outlook
Daily Pivots: (S1) 1.0856; (P) 1.0885; (R1) 1.0929; More...
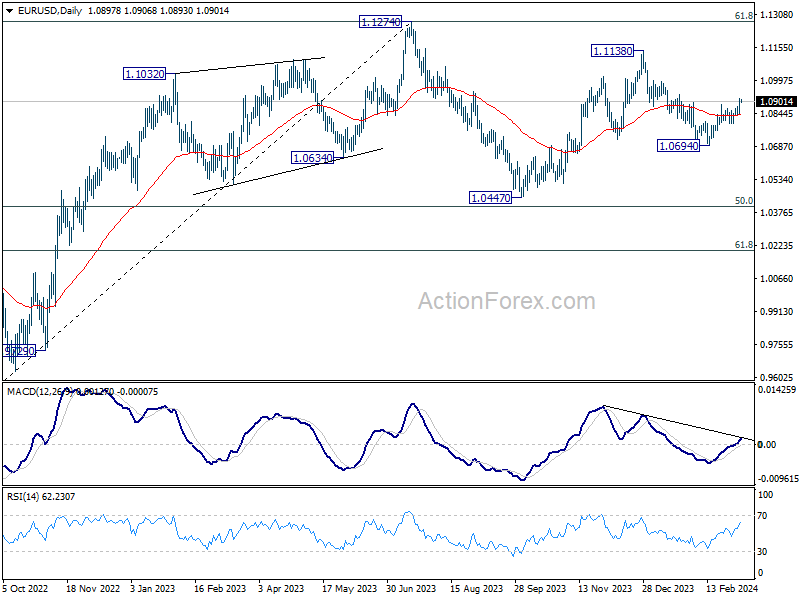
EUR/USD's break of 1.0887 confirms resumption of rebound from 1.0694. Intraday bias is back on the upside for retesting 1.1138 first. Firm break there will resume the rise from 1.0447 to retest 1.1274 high. For now, further rally is in favor as long as 1.0795 support holds, in case of retreat.
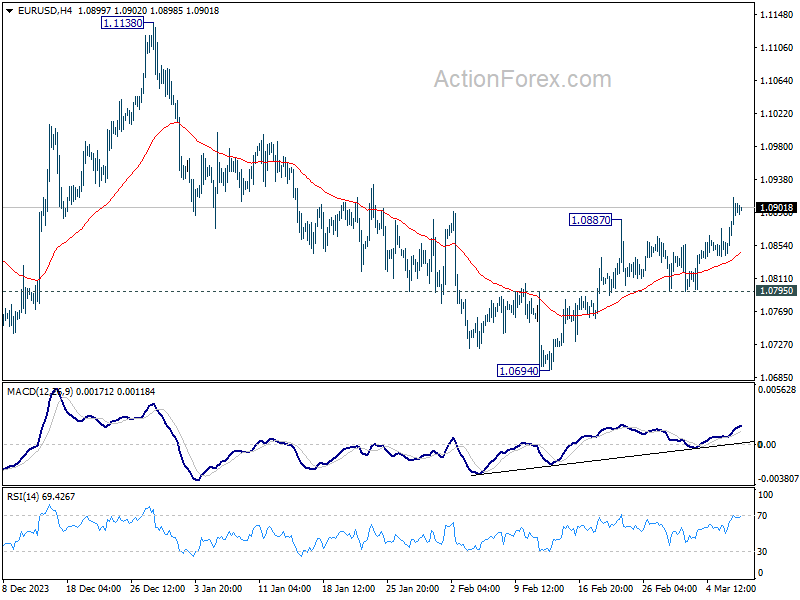
In the bigger picture, price actions from 1.1274 are viewed as a corrective pattern to rise from 0.9534 (2022 low). Rise from 1.0447 is seen as the second leg. While further rally could cannot be ruled out, upside should be limited by 1.1274 to bring the third leg of the pattern. Meanwhile, sustained break of 1.0694 support will argue that the third leg has already started for 1.0447 and possibly below.
GBP/USD Daily Outlook
Daily Pivots: (S1) 1.2694; (P) 1.2728; (R1) 1.2765; More...
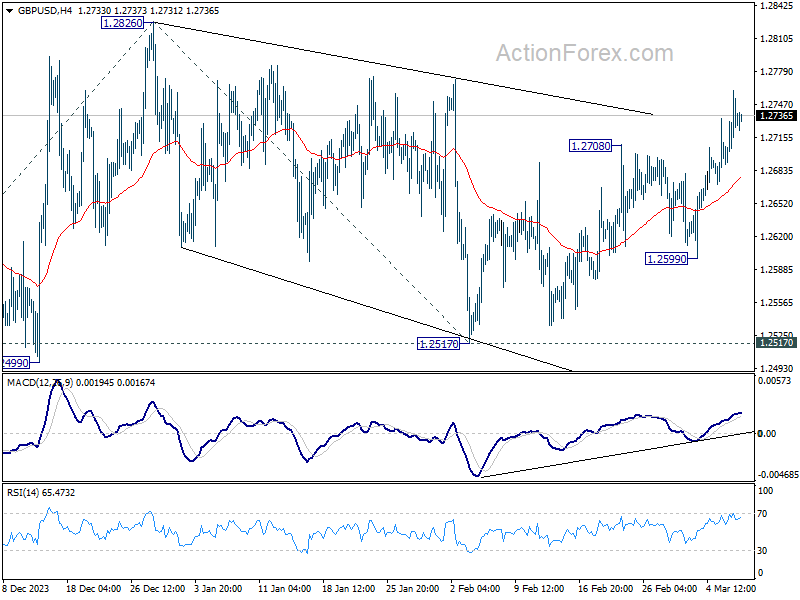
GBP/USD's rally from 1.2517 is in progress and intraday bias stays on the upside. Further rise would be seen to 1.2826 resistance first. Firm break there will resume whole rally from 1.2036, and target 61.8% projection of 1.2036 to 1.2826 from 1.2517 at 1.3005 next. For now, further rise will remain in favor as long as 1.2599 support holds, in case of retreat.
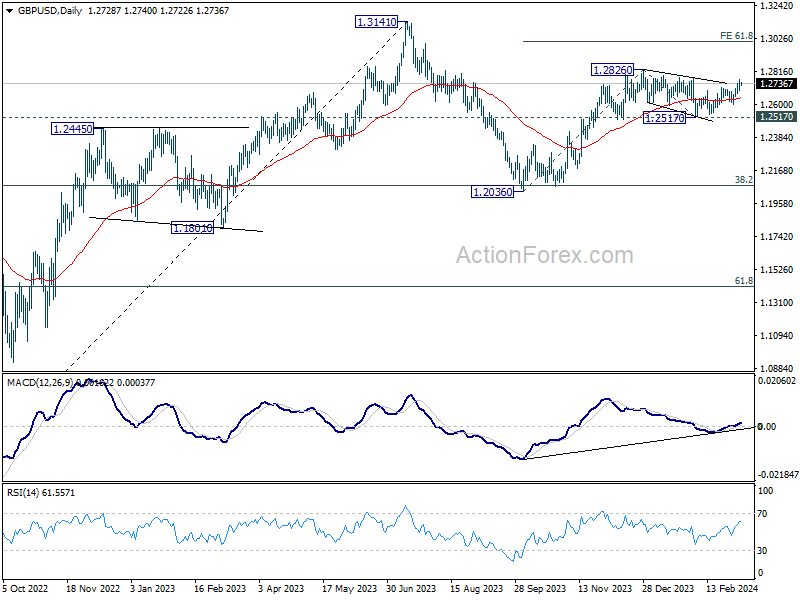
In the bigger picture, price actions from 1.3141 medium term top are seen as a corrective pattern to up trend from 1.0351 (2022 low). Rise from 1.2036 is seen as the second leg, which could be still in progress. But upside should be limited by 1.3141 to bring the third leg of the pattern. Meanwhile, break of 1.2517 support will argue that the third leg has already started for 38.2% retracement of 1.0351 (2022 low) to 1.3141 at 1.2075 again.
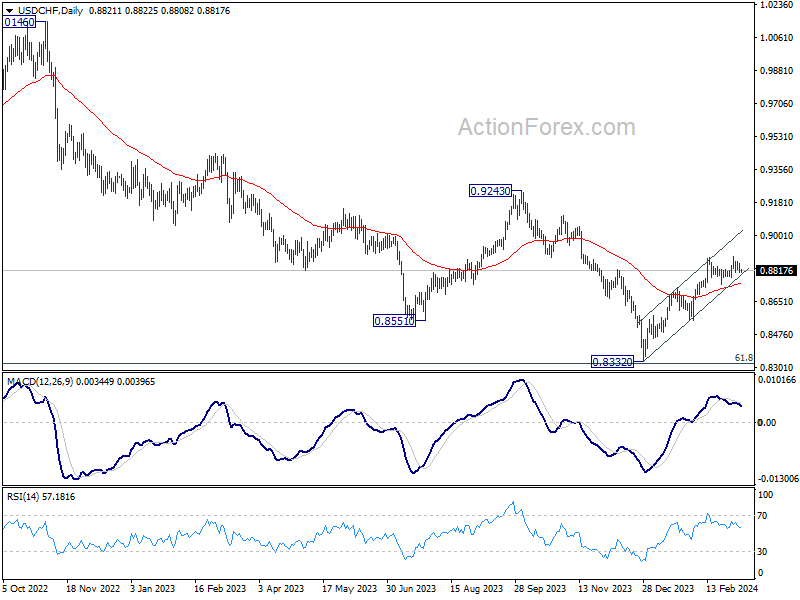
USD/CHF Daily Outlook
Daily Pivots: (S1) 0.8798; (P) 0.8828; (R1) 0.8850; More....
No change in USD/CHF's outlook as sideway consolidation continues. Intraday bias stays neutral at this point. Further rally remains in favor as long as 0.8741 support holds. Break of 0.8891 will resume the whole rebound from 0.8332 towards 0.9243 key resistance. Nevertheless, break of 0.8741 support will turn bias back to the downside for deeper pullback.
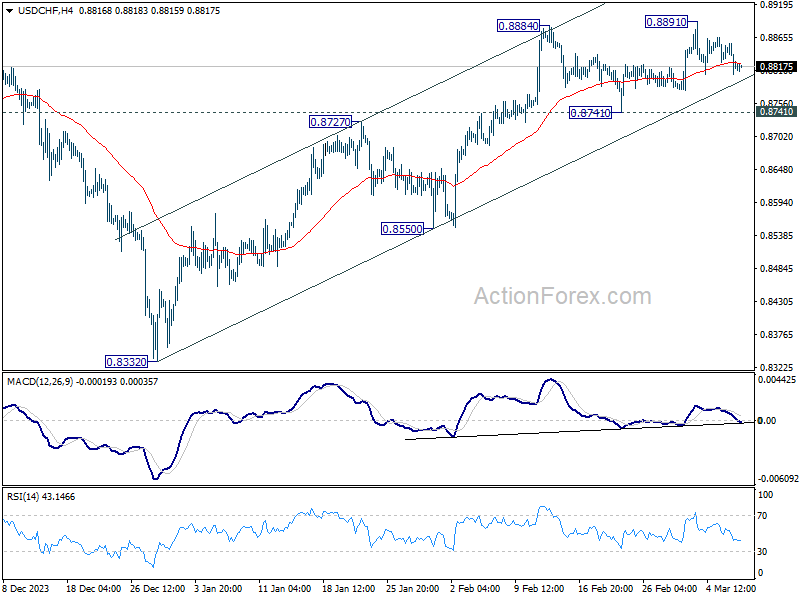
In the bigger picture, a medium term bottom should be formed at 0.8332, on bullish convergence condition in W MACD, just ahead of 0.8317 long term fibonacci support. It's still early to decide if the larger down trend from 1.0146 (2022 high) is reversing. But further rise should be seen to 0.9243 resistance even as a correction.
Technical Outlook and Review
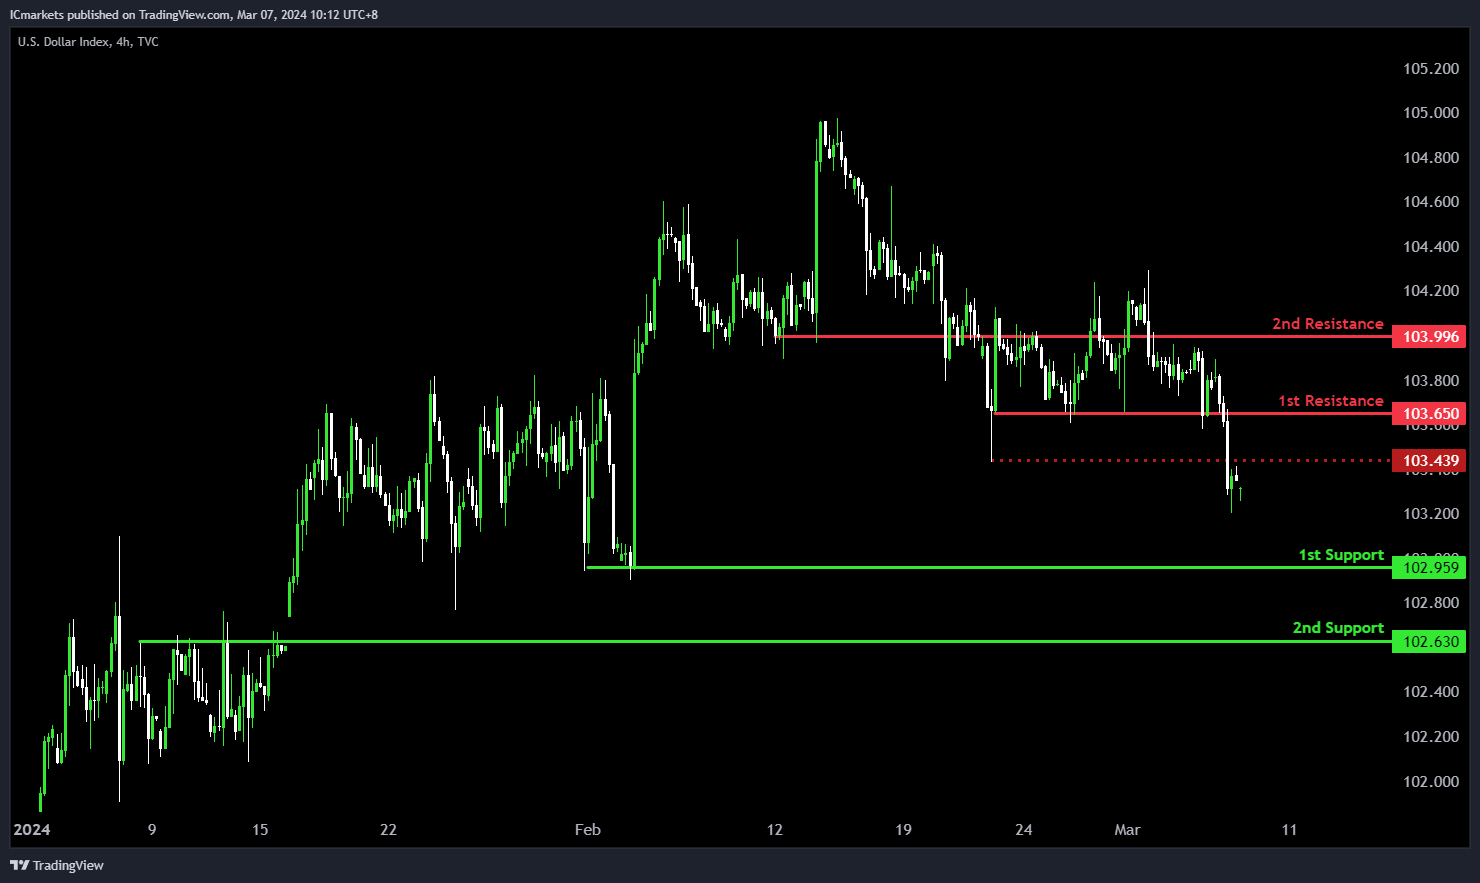
DXY:
The DXY chart exhibits a bearish momentum, suggesting a potential continuation towards the 1st support level.
The 1st support at 102.95 is significant as a multi-swing low support, indicating its historical importance as a level where buying interest has emerged, potentially providing support to the price.
Furthermore, the 2nd support at 102.63 is characterized as a pullback support, reinforcing its significance as a level where buyers may intervene to prevent further decline.
On the resistance side, the 1st resistance level at 103.65 is identified as a pullback resistance, suggesting its historical importance as a barrier where selling pressure may increase, potentially limiting upward movement in the short term.
Additionally, the 2nd resistance at 103.99 is noted as an overlap resistance, further reinforcing its significance as a level where selling interest may intensify.
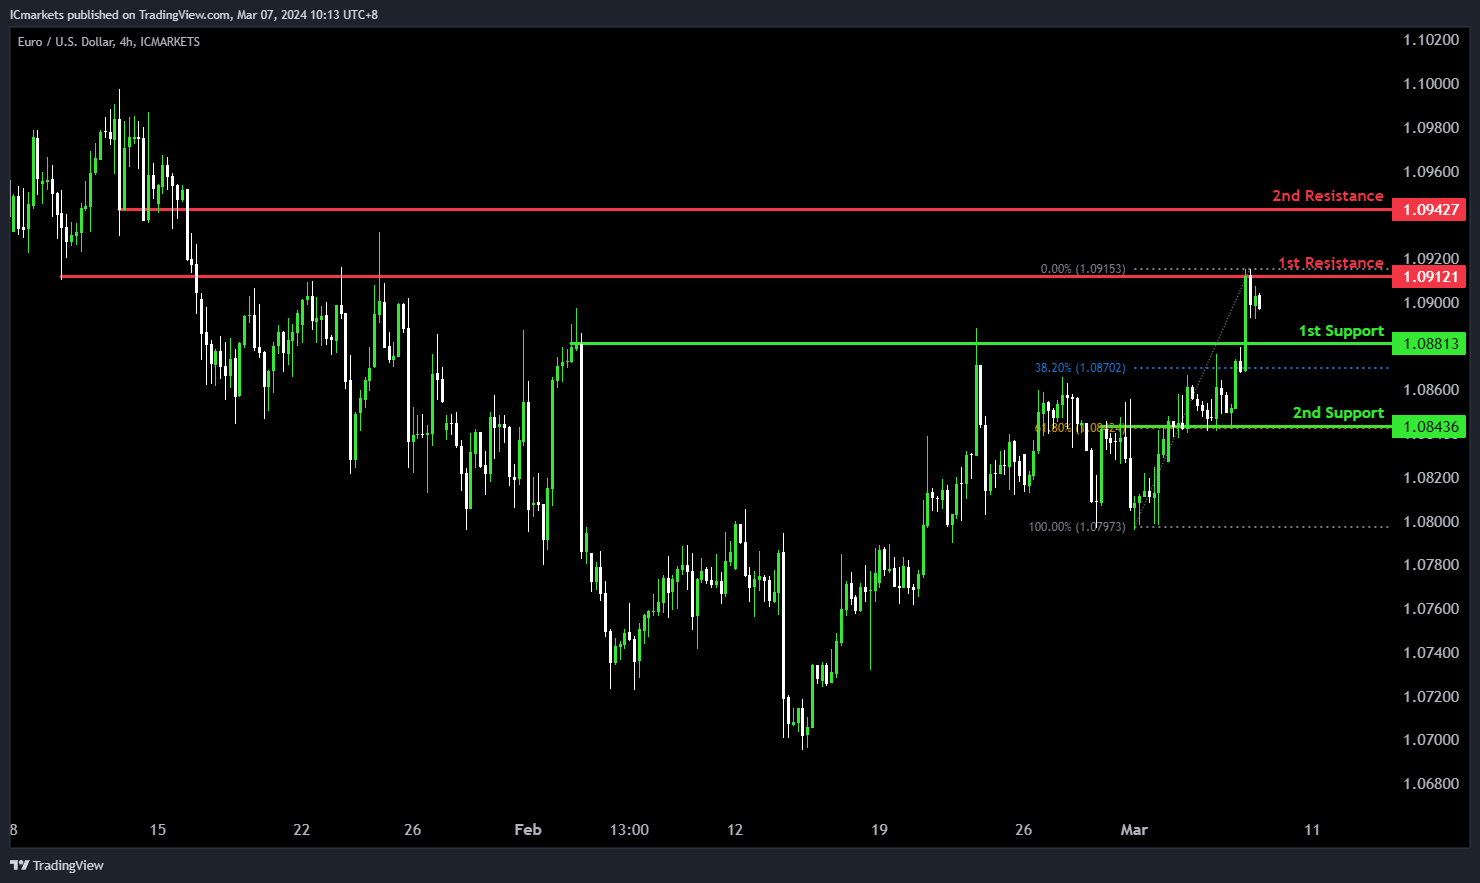
EUR/USD:
The EUR/USD chart currently demonstrates bullish momentum, suggesting a potential scenario where the price may drop further to the 1st support in the short term before bouncing from there and rising to the 1st resistance.
The 1st support level at 1.0881 is significant as a pullback support, coinciding with the 38.20% Fibonacci Retracement level, indicating its historical significance as a level where buying interest has emerged, potentially providing support to the price.
Additionally, the 2nd support at 1.0843 is identified as an overlap support, further reinforcing its importance as a level where buyers may intervene to prevent further decline, aligning with the 61.80% Fibonacci Retracement level.
On the resistance side, the 1st resistance level at 1.0912 is identified as an overlap resistance, suggesting its historical importance as a barrier where selling pressure may increase, potentially limiting upward movement in the short term.
Furthermore, the 2nd resistance at 1.0942 is noted as a pullback resistance, indicating its significance as a level where selling interest may intensify, potentially capping the upward movement of prices.
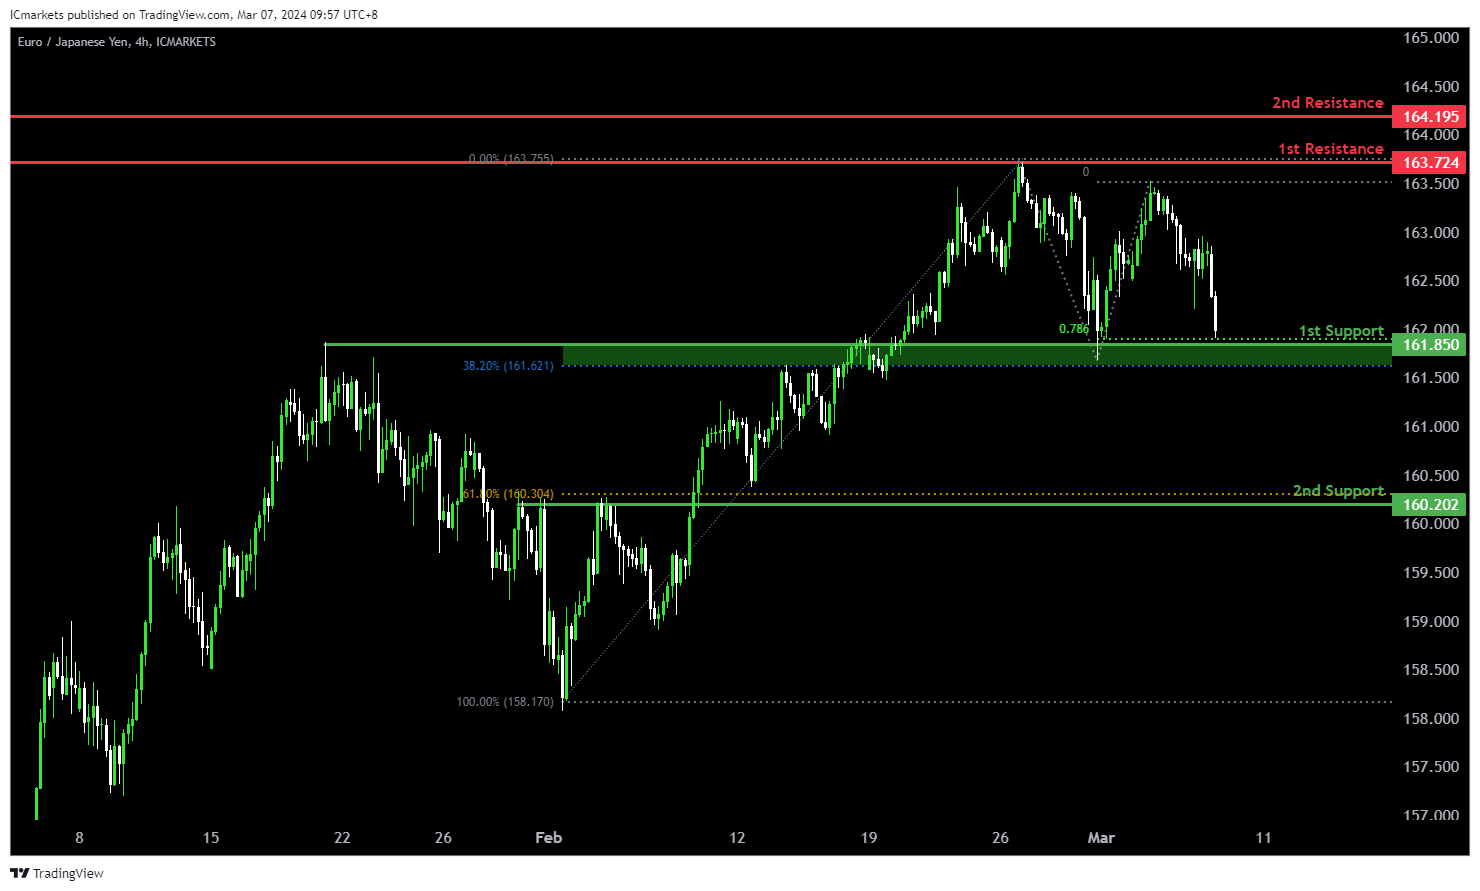
EUR/JPY:
The EUR/JPY chart currently indicates a bearish momentum, suggesting a potential continuation of the downward trend. Several factors support the possibility of a bearish movement towards the 1st support level.
The 1st support at 161.850 aligns with an overlap support, the 78.60% Fibonacci Projection, and the 38.20% Fibonacci Retracement level, indicating a significant historical level where buying interest may emerge. Additionally, the 2nd support at 160.202 corresponds to a pullback support and the 61.80% Fibonacci Retracement, further reinforcing its importance as a potential area of support.
On the resistance side, the 1st resistance level at 163.724 is characterized by a multi-swing high resistance, suggesting a historical barrier to upward movement. Furthermore, the 2nd resistance level at 164.205 aligns with a swing high resistance, adding to its significance as a potential barrier to further bullish movement.
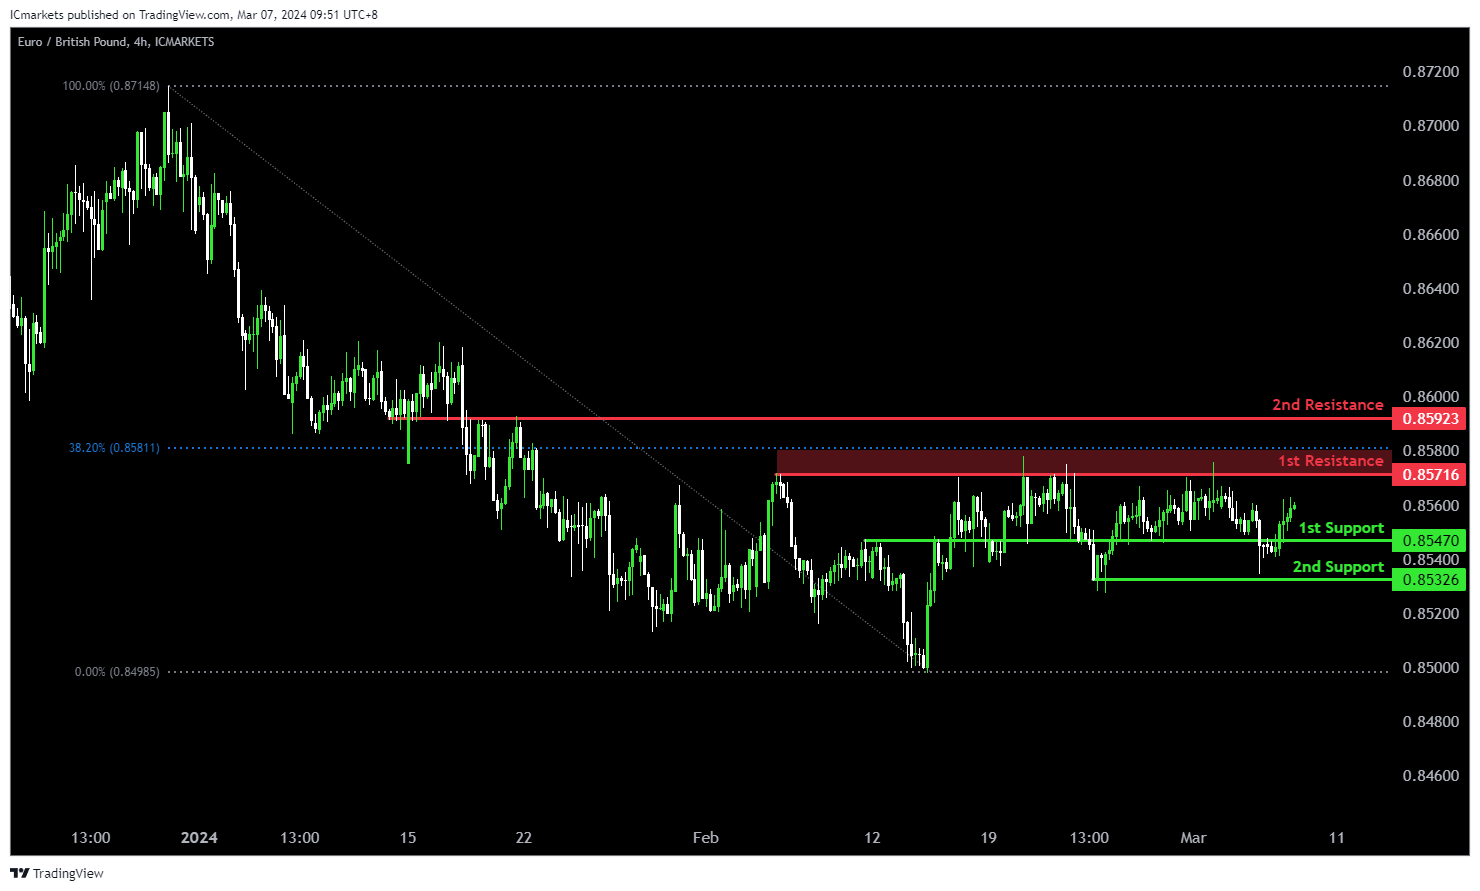
EUR/GBP:
The EUR/GBP chart demonstrates a bullish momentum, indicating a potential continuation of the upward trend. Several factors support the possibility of a bullish movement towards the 1st resistance level.
The 1st support at 0.85470 is identified as a pullback support, suggesting a historical level where buying interest may emerge. Additionally, the 2nd support at 0.85326 corresponds to a swing low support, further reinforcing its importance as a potential area of support.
On the resistance side, the 1st resistance level at 0.85716 aligns with a swing high resistance and the 38.20% Fibonacci Retracement level, indicating a historical barrier to upward movement. Furthermore, the 2nd resistance level at 0.85923 is characterized by an overlap resistance, adding to its significance as a potential barrier to further bullish movement.
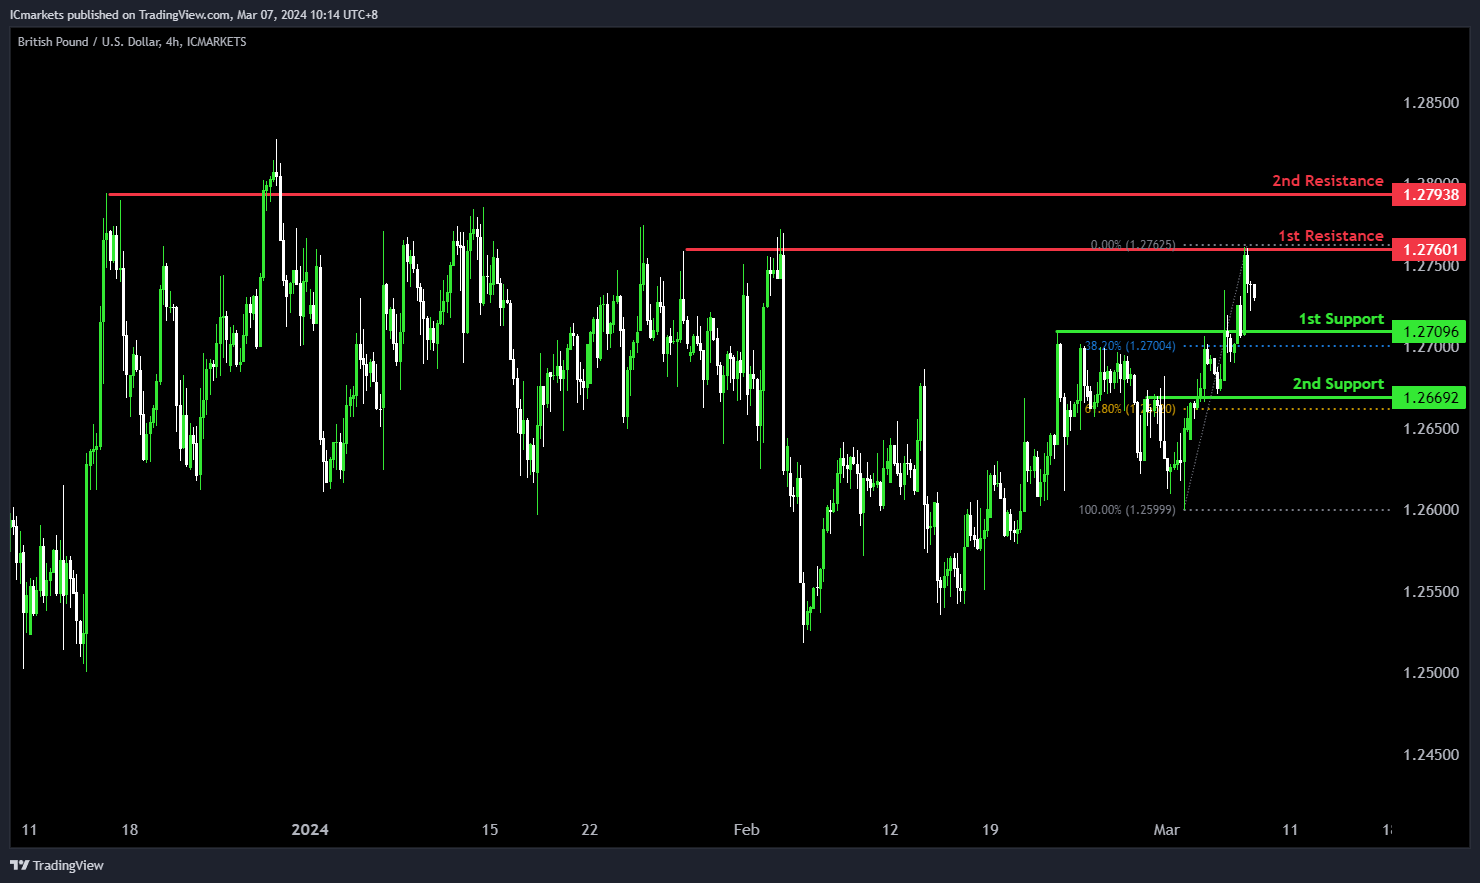
GBP/USD:
The GBP/USD chart currently exhibits bullish momentum, indicating a potential scenario where the price may drop further to the 1st support in the short term before bouncing from there and rising to the 1st resistance.
The 1st support level at 1.2709 is identified as a pullback support, suggesting its historical significance as a level where buying interest has emerged to support the price.
Additionally, the 2nd support at 1.2669 is characterized as an overlap support, reinforcing its importance as a level where buyers may intervene to prevent further decline.
On the resistance side, the 1st resistance level at 1.2760 is identified as a multi-swing high resistance, indicating its historical importance as a barrier where selling pressure may increase, potentially limiting upward movement in the short term.
Furthermore, the 2nd resistance at 1.2793 is noted as a pullback resistance, suggesting its significance as a level where selling interest may intensify, potentially capping the upward movement of prices.
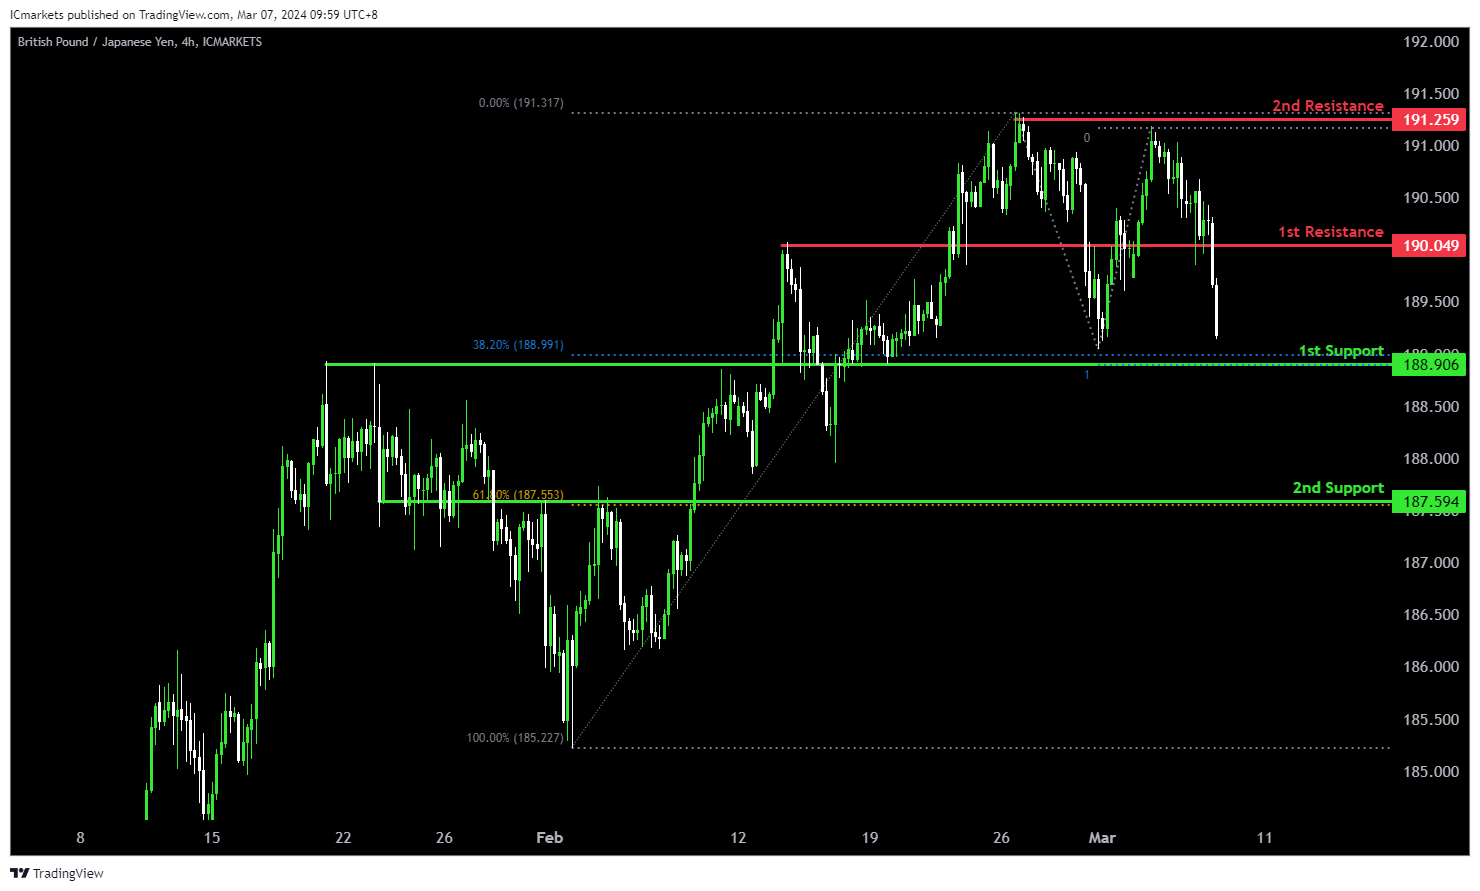
GBP/JPY:
The GBP/JPY chart currently exhibits a bearish momentum, suggesting a potential continuation of the downward trend. Several factors support the possibility of a bearish movement towards the 1st support level.
The 1st support at 188.906 aligns with a pullback support and the 38.20% Fibonacci Retracement level, indicating a significant historical level where buying interest could emerge. Additionally, the confluence with the 100% Fibonacci Projection strengthens this support zone.
Moreover, the 2nd support at 187.594 corresponds to an overlap support and the 61.80% Fibonacci Retracement level, further reinforcing its importance as a potential area of support.
On the resistance side, the 1st resistance level at 190.049 is identified as a pullback resistance, suggesting a historical barrier to upward movement. Additionally, the 2nd resistance level at 191.259 aligns with a swing high resistance, adding to its significance as a potential barrier to further bullish movement.
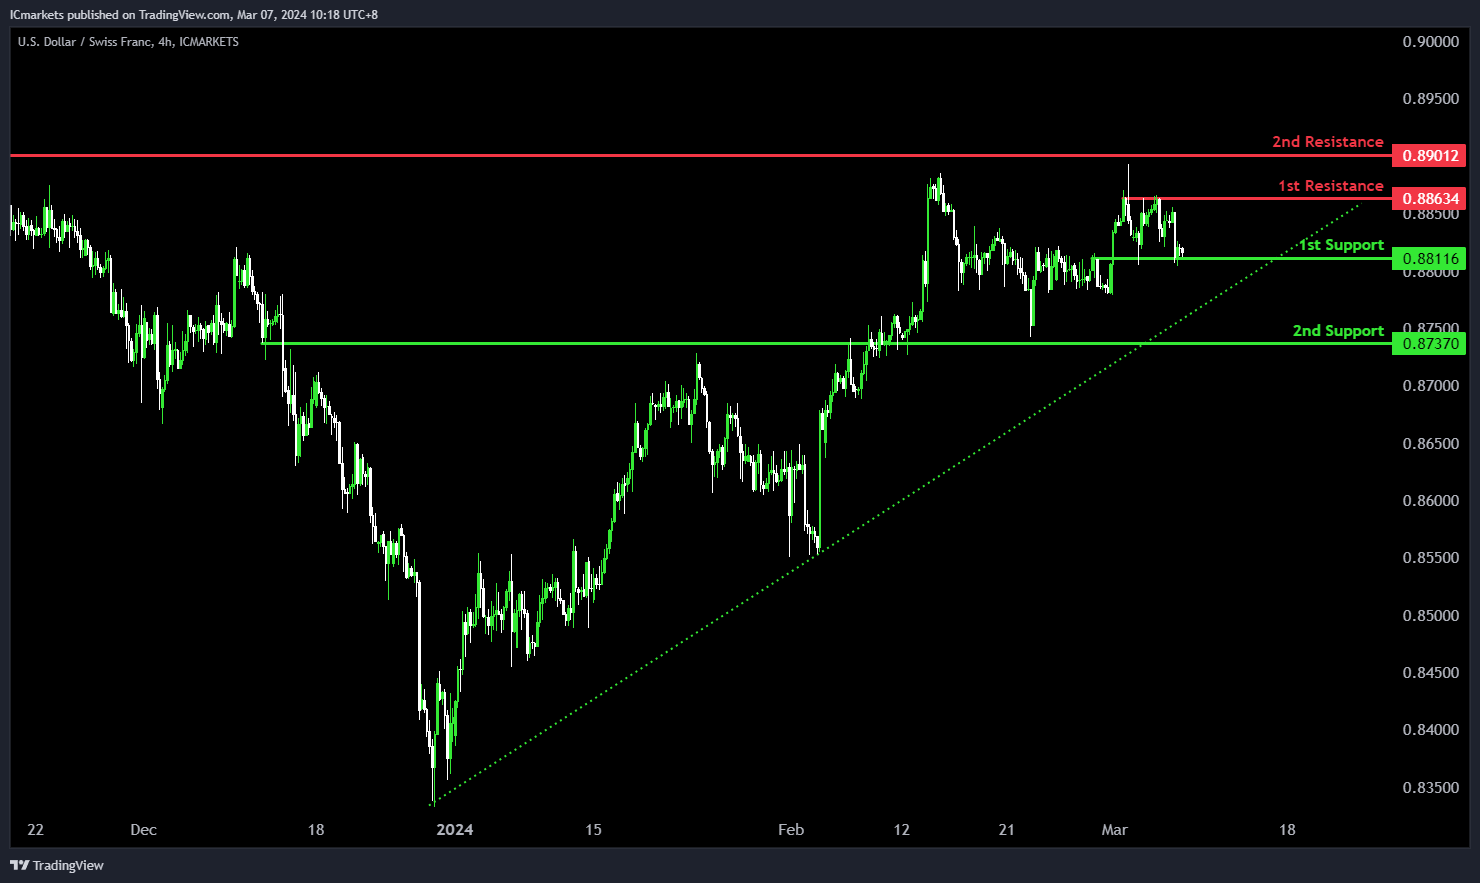
USD/CHF:
The USD/CHF chart maintains a bullish momentum, attributed to its presence within a bullish ascending channel.
There’s a potential scenario where the price could decline further to the 1st support in the short term before rebounding and ascending towards the 1st resistance.
The 1st support level at 0.8811 is identified as an overlap support, signifying its historical significance as a level where buying interest has emerged to support the price.
Furthermore, the 2nd support at 0.8737 is characterized as another overlap support, reinforcing its importance as a level where buyers may intervene to prevent further decline.
On the resistance side, the 1st resistance level at 0.8863 is identified as a multi-swing high resistance, suggesting its historical importance as a barrier where selling pressure may increase, potentially limiting upward movement in the short term.
Additionally, the 2nd resistance at 0.8901 is noted as an overlap resistance, indicating its significance as a level where selling interest may intensify.
USD/JPY:
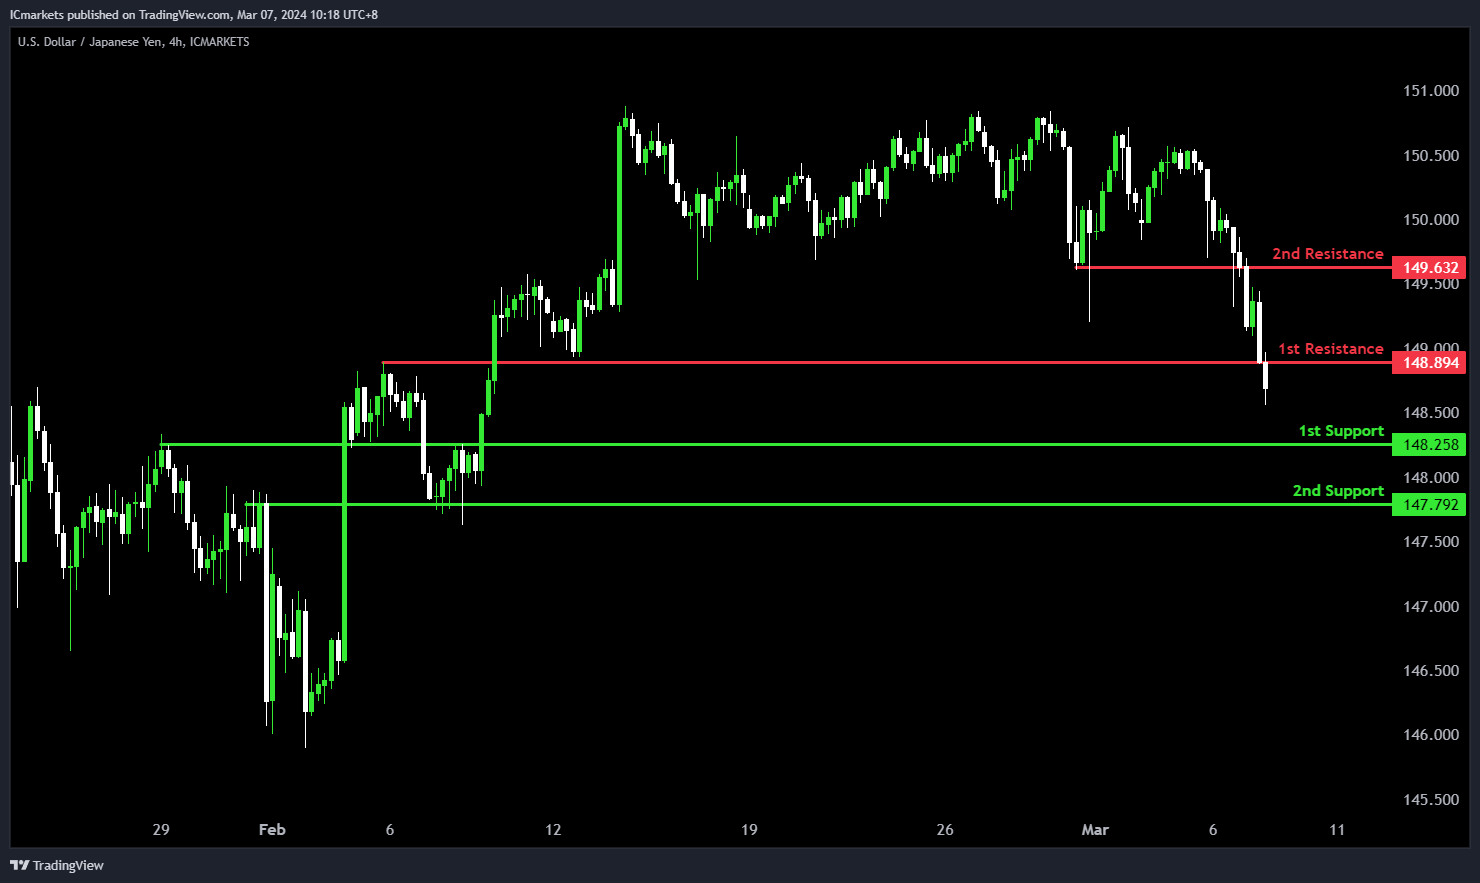
The USD/JPY chart currently exhibits a bearish momentum, suggesting a potential scenario of a bearish continuation towards the 1st support.
The 1st support level at 148.25 is identified as a pullback support, indicating its historical significance as a level where buying interest has emerged to support the price.
Additionally, the 2nd support at 147.79 is characterized as an overlap support, reinforcing its importance as a level where buyers may intervene to prevent further decline.
On the resistance side, the 1st resistance level at 148.89 is identified as a pullback resistance, suggesting its historical importance as a barrier where selling pressure may increase, potentially limiting upward movement in the short term.
Furthermore, the 2nd resistance at 149.63 is noted as another pullback resistance, indicating its significance as a level where selling interest may intensify.
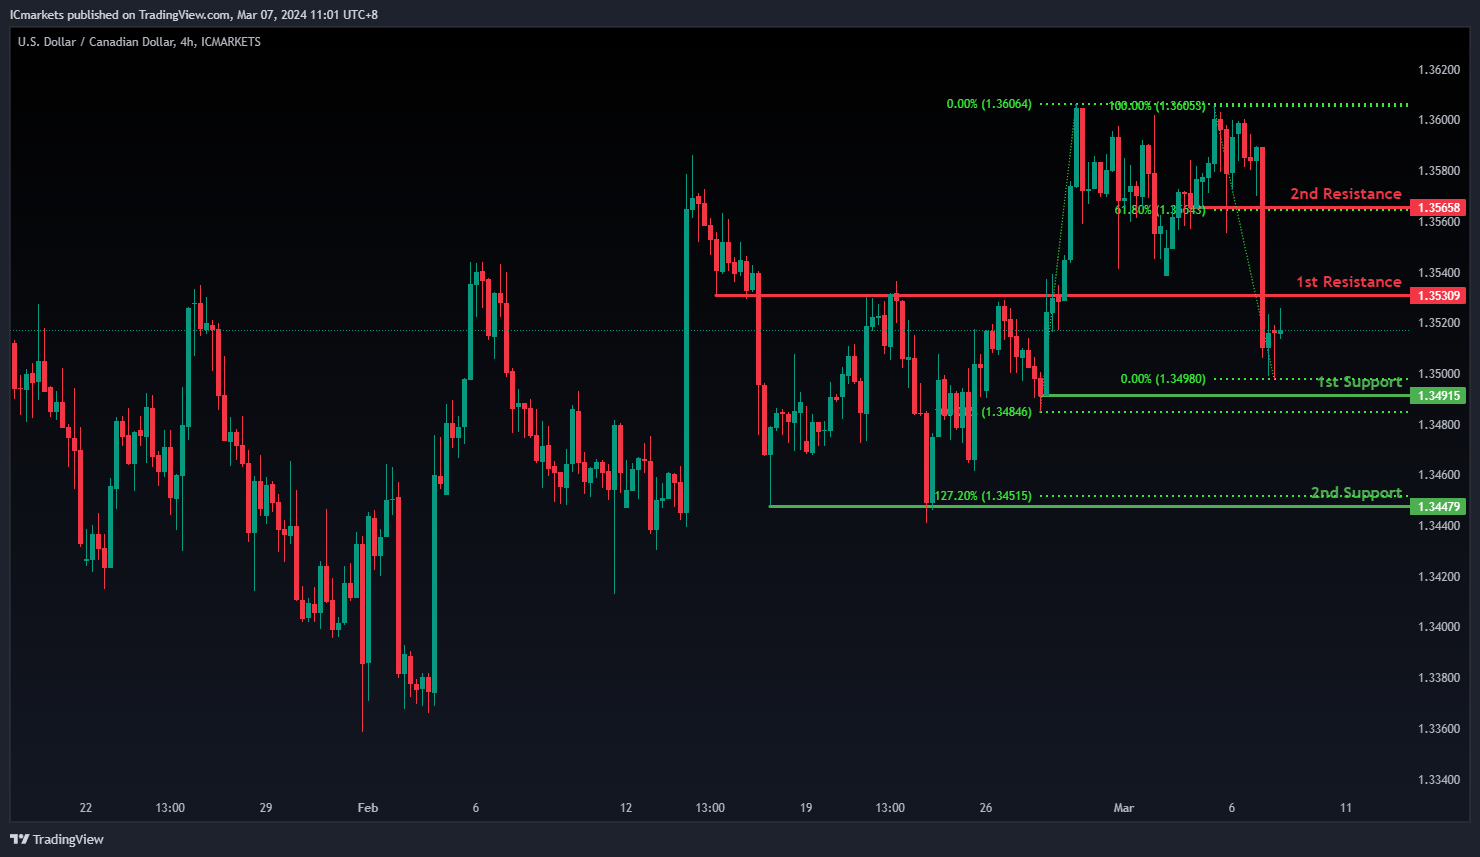
USD/CAD:
The USD/CAD chart currently exhibits an overall bearish momentum. In this context, there is a potential scenario for price to fall towards the 1st support.
The 1st support level at 1.3491 is identified as a pullback support. Further below, the 2nd support level at 1.3447 is also marked as a pullback support that aligns close to the 127.20% Fibonacci Extension level, reinforcing its significance as a key support level.
To the upside, the 1st resistance level at 1.3530 is identified as an overlap resistance. Higher up, the 2nd resistance level at 1.3565 is marked as a pullback resistance that aligns with the 61.80% Fibonacci retracement level, further highlighting its importance as a potential resistance zone.
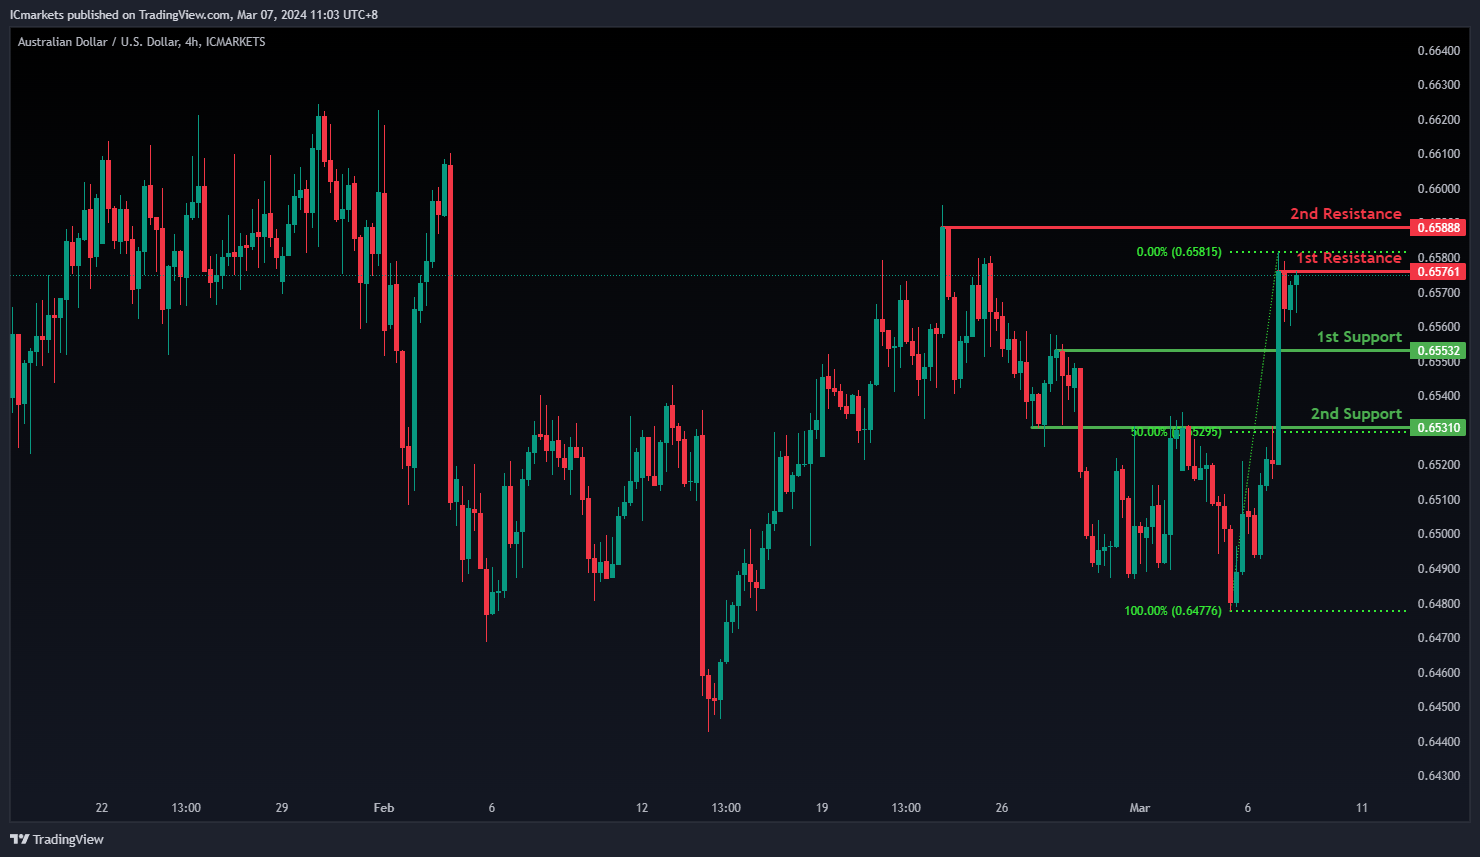
AUD/USD:
The AUD/USD chart currently exhibits an overall bullish momentum. In this context, there is a potential scenario for price to break above the 1st resistance and rise towards the 2nd resistance.
The 1st resistance level at 0.6576 is identified as a pullback resistance. Higher up, the 2nd resistance level at 0.6588 is also noted as a swing-high resistance, further highlighting its importance as a potential resistance zone.
To the downside, the 1st support level at 0.6553 is identified as a pullback support. Further below, the 2nd support level at 0.6531 is marked as an overlap support that aligns with the 50.00% Fibonacci Retracement level, further emphasizing its importance as a potential support zone.
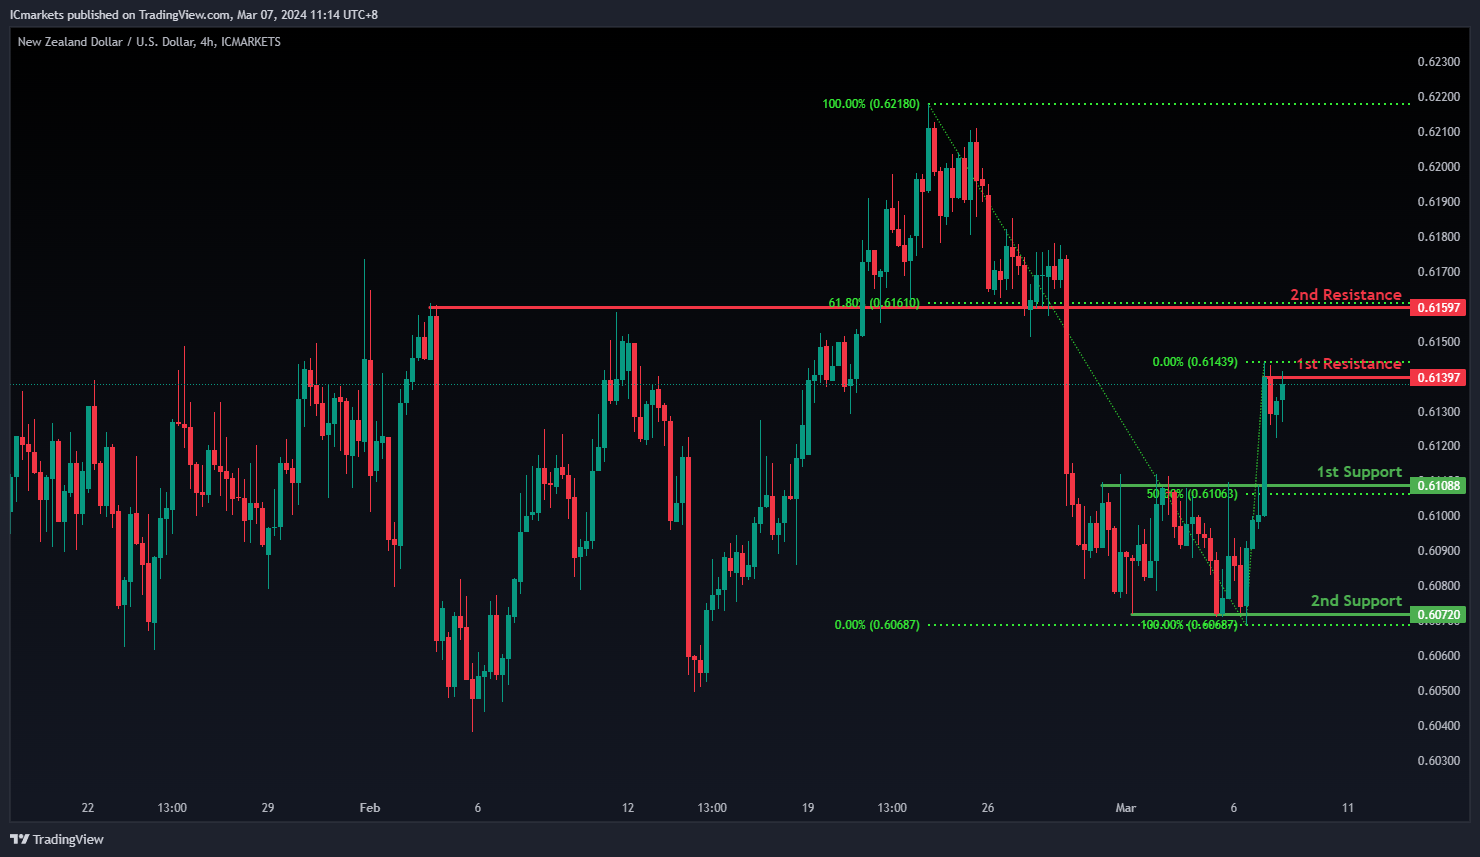
NZD/USD
The NZD/USD chart currently exhibits an overall bullish momentum. In this context, there is a potential scenario for price to break above the 1st resistance and rise towards the 2nd resistance.
The 1st resistance level at 0.6139 is identified as a pullback resistance. Higher up, the 2nd resistance level at 0.6159 is noted as an overlap resistance that aligns with the 61.80% Fibonacci Retracement level, further highlighting its importance as a potential resistance zone.
To the downside, the 1st support level at 0.6108 is identified as a pullback support that aligns with the 50.00% Fibonacci Retracement level. Further below, the 2nd support level at 0.6072 is also marked as a pullback support, further emphasizing its importance as a potential support zone.
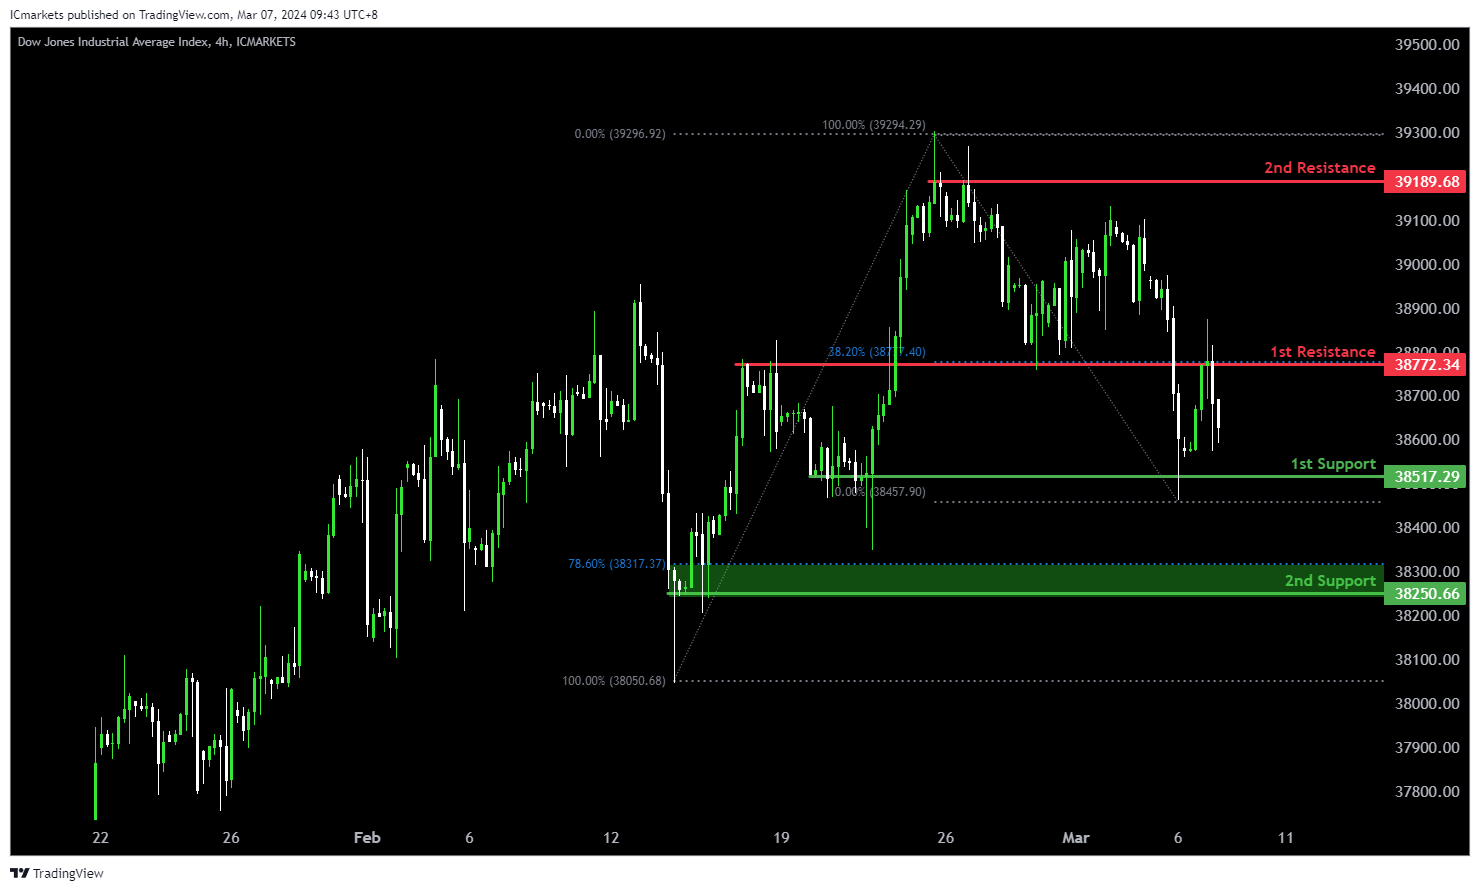
DJ30:
The DJ30 chart currently demonstrates a bearish momentum, indicating a potential continuation of the downward trend. Several factors support the possibility of a bearish movement towards the 1st support level.
The 1st support at 38517.29 corresponds to a swing low support, suggesting a significant historical level where buying interest might emerge. Additionally, the 2nd support at 38250.66 aligns with another swing low support and the 78.60% Fibonacci Retracement level, further reinforcing its significance as a potential area of support.
On the resistance side, the 1st resistance level at 38772.34 is characterized as an overlap resistance, indicating a historical barrier to upward movement. Furthermore, the confluence with the 38.20% Fibonacci Retracement adds to its significance as a potential barrier to further bullish movement.
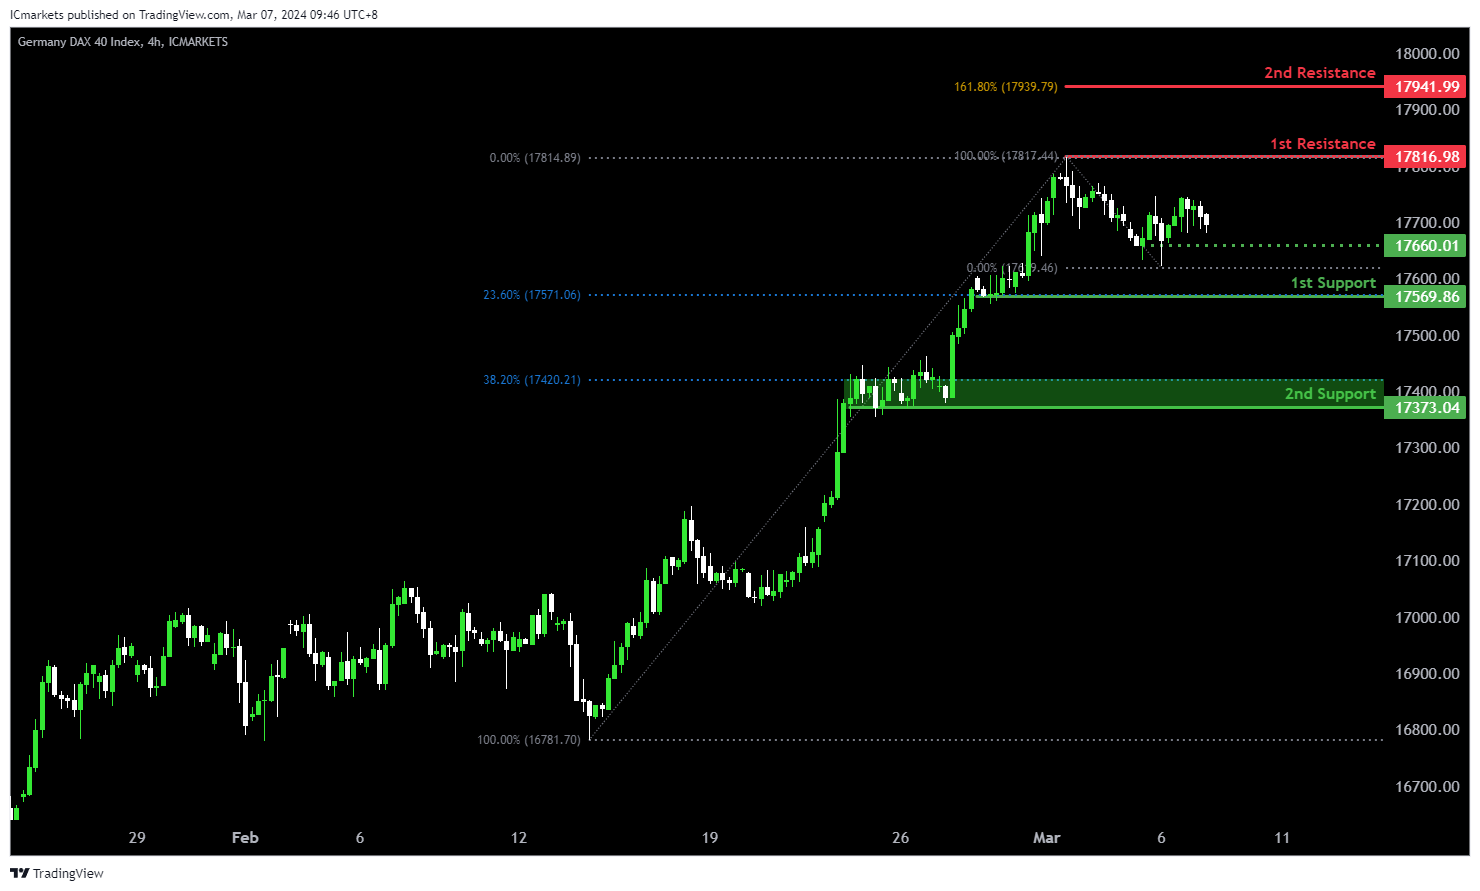
GER40:
The GER40 chart currently demonstrates a bearish momentum, suggesting a potential continuation of the downward trend. Several factors support the possibility of a bearish movement towards the 1st support level.
The 1st support at 17569.86 corresponds to a swing low support, indicating a significant historical level where buying interest might emerge. Additionally, the 2nd support at 17373.04 aligns with another swing low support and the 38.20% Fibonacci Retracement level, further reinforcing its significance as a potential area of support.
On the resistance side, the 1st resistance level at 17816.98 is characterized as a swing high resistance, suggesting a historical barrier to upward movement. Furthermore, the confluence with the 161.80% Fibonacci Extension adds to its significance as a potential barrier to further bullish movement.
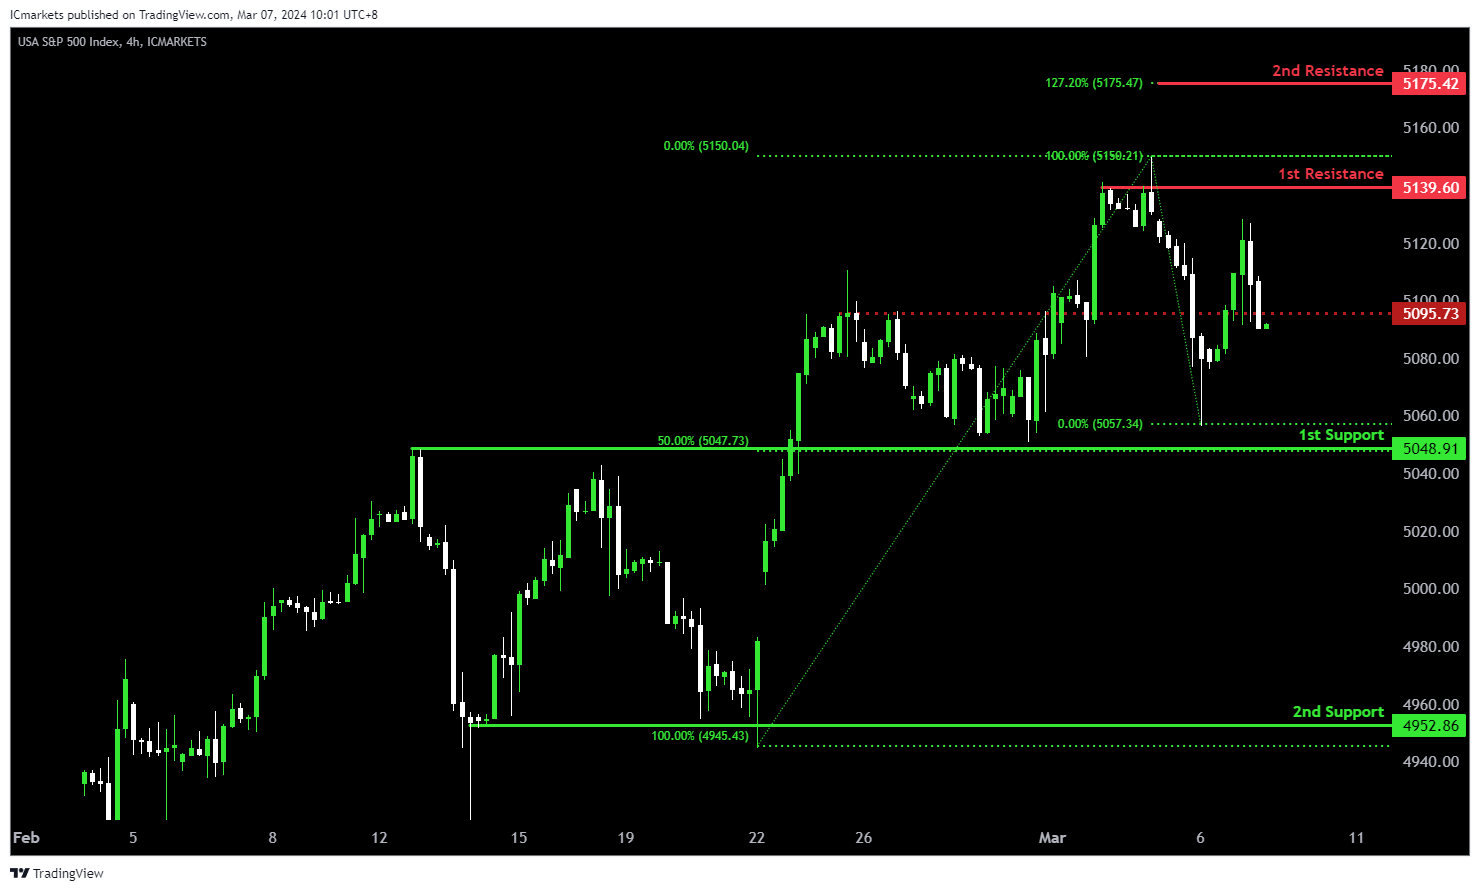
US500:
The US500 chart currently reflects a bearish momentum, suggesting a potential continuation of the downward trend. Several factors support the possibility of a bearish movement towards the 1st support level.
The 1st support at 5048.91 aligns with a pullback support and the 50% Fibonacci Retracement level, indicating a significant historical level where buying interest may emerge. Additionally, the 2nd support at 4952.86 corresponds to a swing low support, further reinforcing its importance as a potential area of support.
On the resistance side, the 1st resistance level at 5139.60 is identified as a swing high resistance, suggesting a historical barrier to upward movement. Furthermore, the 2nd resistance level at 5175.42 coincides with the 127.20% Fibonacci Extension, adding to its significance as a potential barrier to further bullish movement. Additionally, the intermediate resistance at 5095.7 is characterized as a swing high resistance, providing additional reinforcement to the resistance structure.
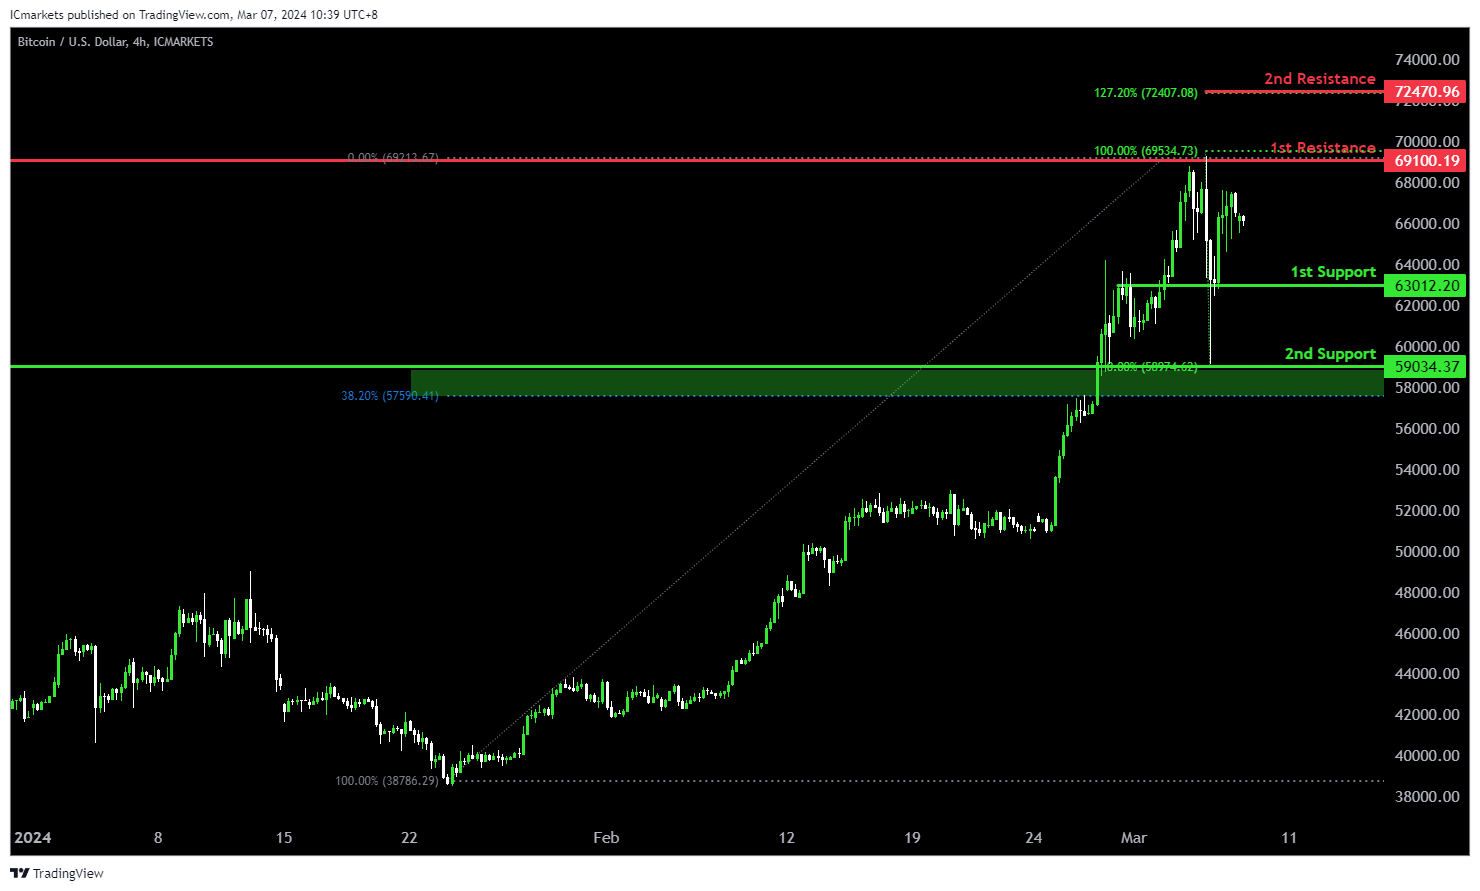
BTC/USD:
The BTC/USD chart currently indicates a bullish momentum, suggesting a potential continuation of the upward trend. Several factors support the possibility of a bullish movement towards the 1st resistance level.
The 1st support at 63012.20 aligns with an overlap support, indicating a significant historical level where buying interest may emerge. Additionally, the 2nd support at 59034.37 corresponds to a pullback support and the 38.20% Fibonacci Retracement level, further reinforcing its importance as a potential area of support.
On the resistance side, the 1st resistance level at 69100.19 is identified as a swing high resistance, suggesting a historical barrier to upward movement. Moreover, the 2nd resistance level at 72470.96 coincides with the 127.20% Fibonacci Extension, adding to its significance as a potential barrier to further bullish movement.
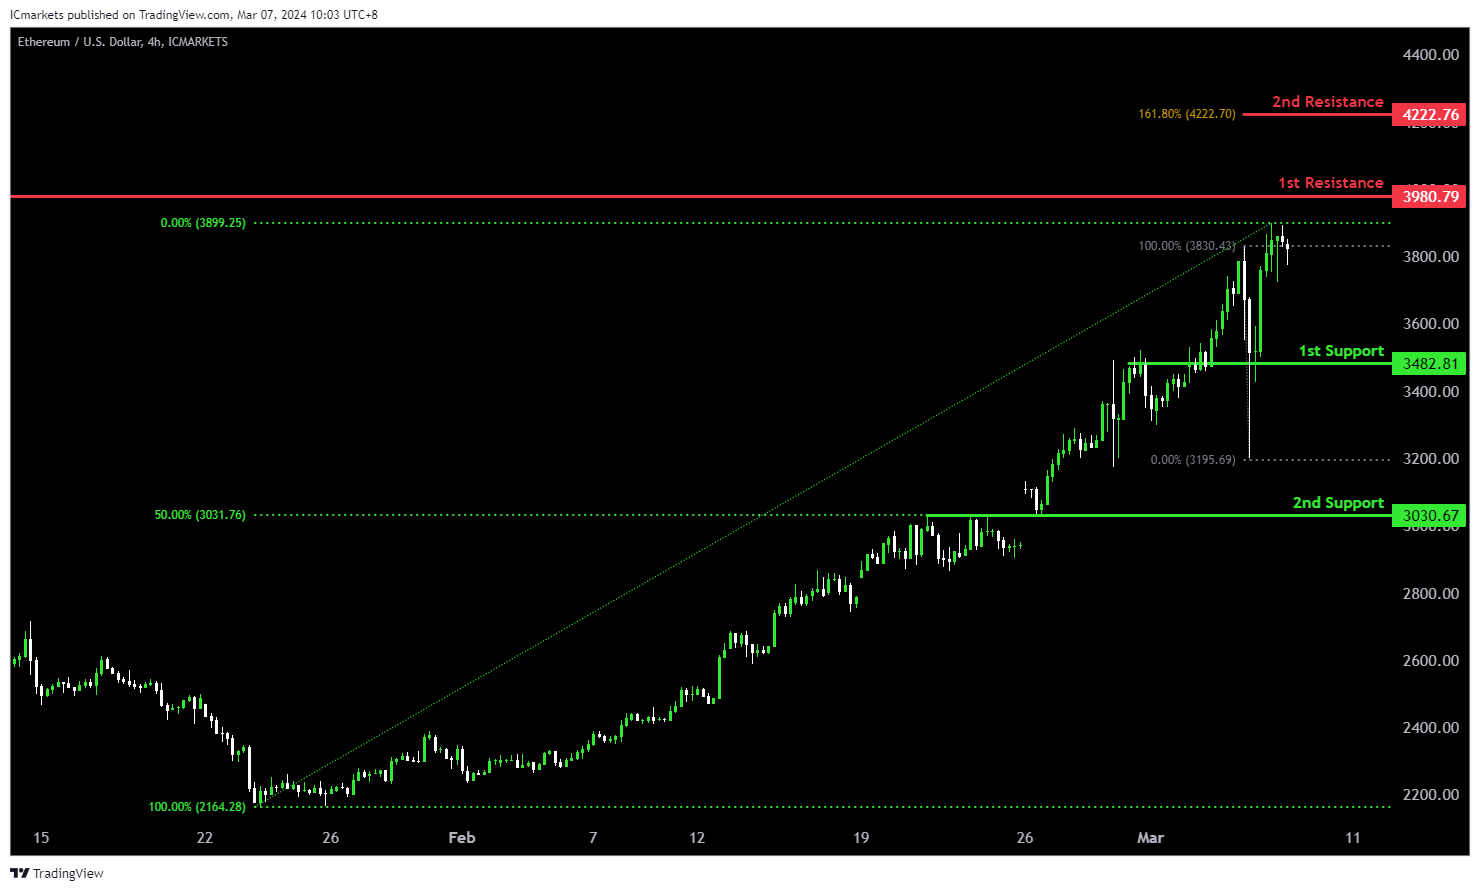
ETH/USD:
The ETH/USD chart currently exhibits bullish momentum, supported by several factors contributing to the upward movement.
The 1st support at 3482.81 aligns with an overlap support, indicating a significant historical level where buying interest is present. Additionally, the 2nd support at 3030.67 corresponds to another overlap support and coincides with the 50% Fibonacci Retracement level, further reinforcing its significance as a potential area of support.
On the resistance side, the 1st resistance level at 3980.79 is characterized as an overlap resistance, suggesting a historical barrier to upward movement. Furthermore, the 2nd resistance level at 4222.76 aligns with the 161.80% Fibonacci Extension, adding to its significance as a potential barrier to further bullish movement.
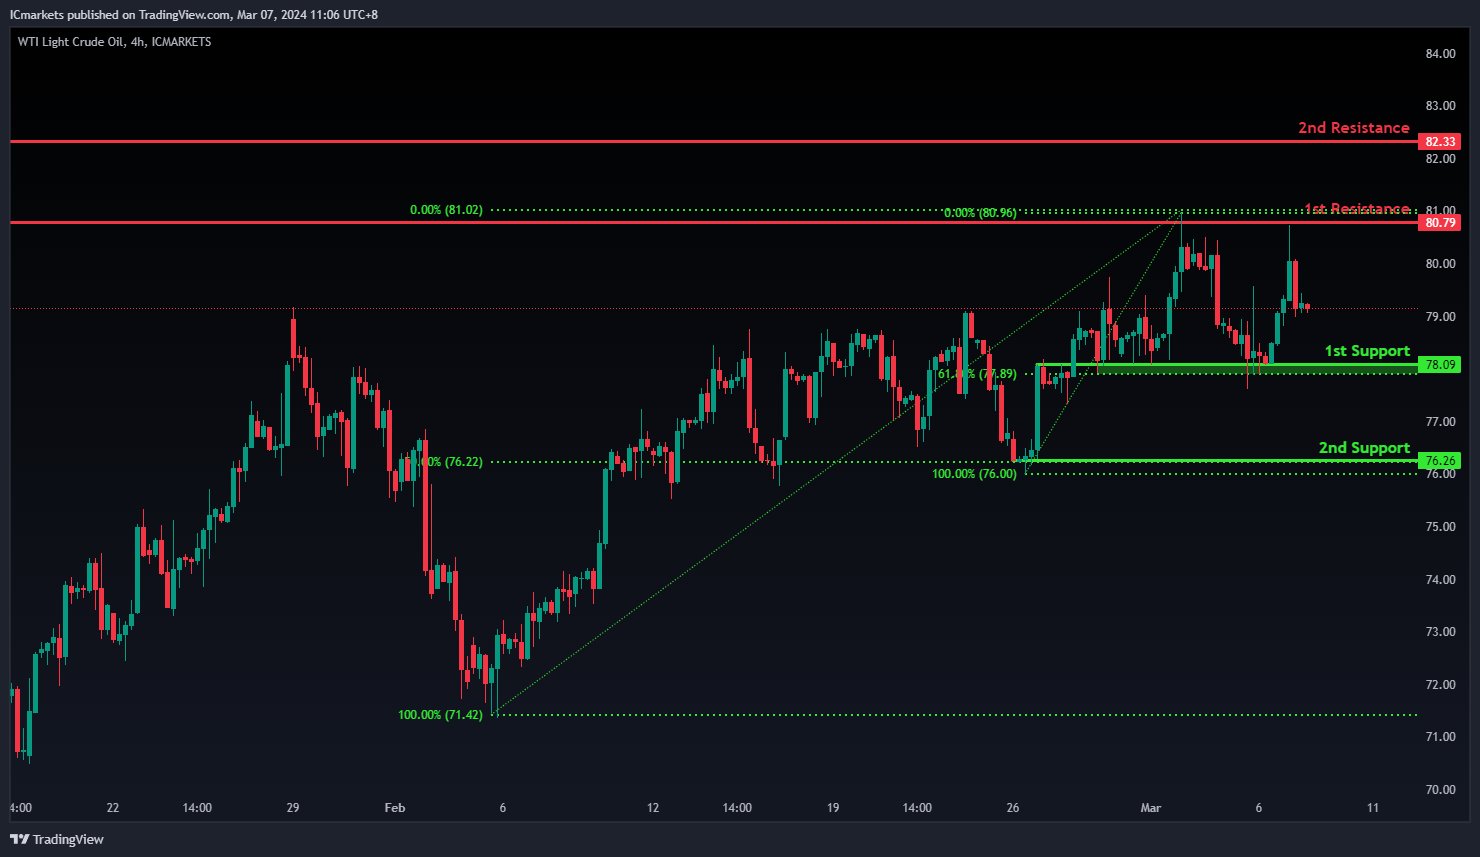
WTI/USD:
The WTI (West Texas Intermediate) oil chart currently exhibits an overall bullish momentum. However, there is a potential scenario for price to fall towards the 1st support before making a bullish bounce and rise towards the 1st resistance.
The 1st support level at 78.09 is identified as an overlap support that aligns with the 61.80% Fibonacci Retracement level. Further below, the 2nd support level at 76.26 is marked as a pullback support that aligns with the 50.00% Fibonacci Retracement level, reinforcing its significance as a key support level.
To the upside, the 1st resistance level at 80.79 is identified as an overlap resistance. Higher up, the 2nd resistance level at 82.33 is marked as a pullback resistance, further highlighting its importance as a potential resistance zone.
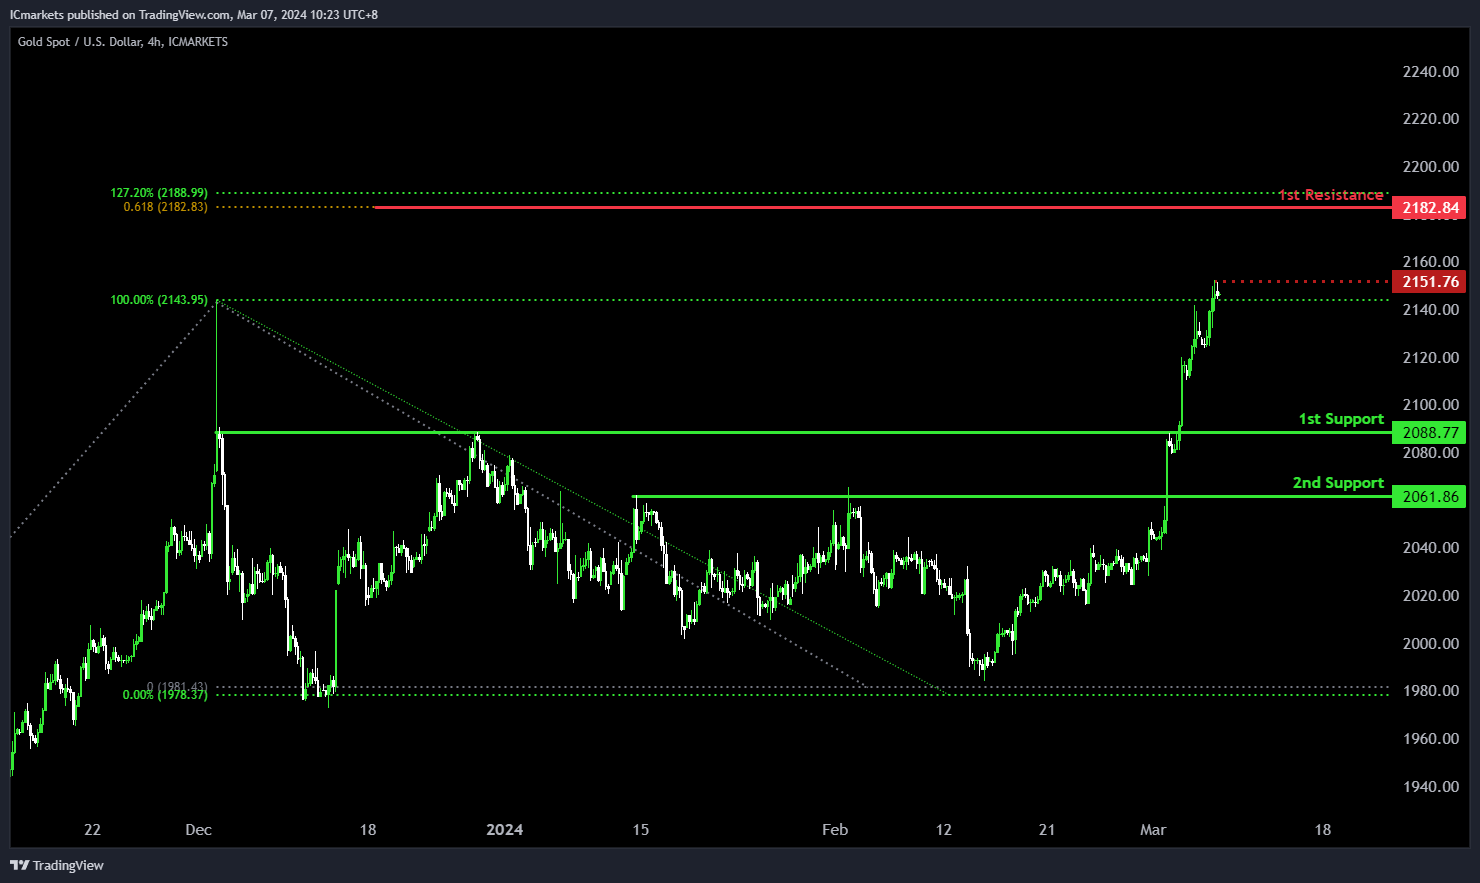
XAU/USD (GOLD):
The XAUUSD (Gold) chart currently demonstrates bullish momentum, suggesting a potential scenario of a drop further to the 1st support in the short term before bouncing from there and rising to the 1st resistance.
The 1st support level at 2088.77 is identified as a pullback support, indicating its historical significance as a level where buying interest has emerged to support the price.
Furthermore, the 2nd support at 2061.86 is characterized as another pullback support, reinforcing its importance as a level where buyers may intervene to prevent further decline.
On the resistance side, the 1st resistance level at 2182.84 is highlighted, corresponding to the 61.80% Fibonacci Projection. This level may act as a barrier where selling pressure could increase, potentially limiting upward movement.
Additionally, the intermediate resistance at 2151.76 is noted as a swing high resistance, further solidifying its significance as a level where selling interest may intensify.
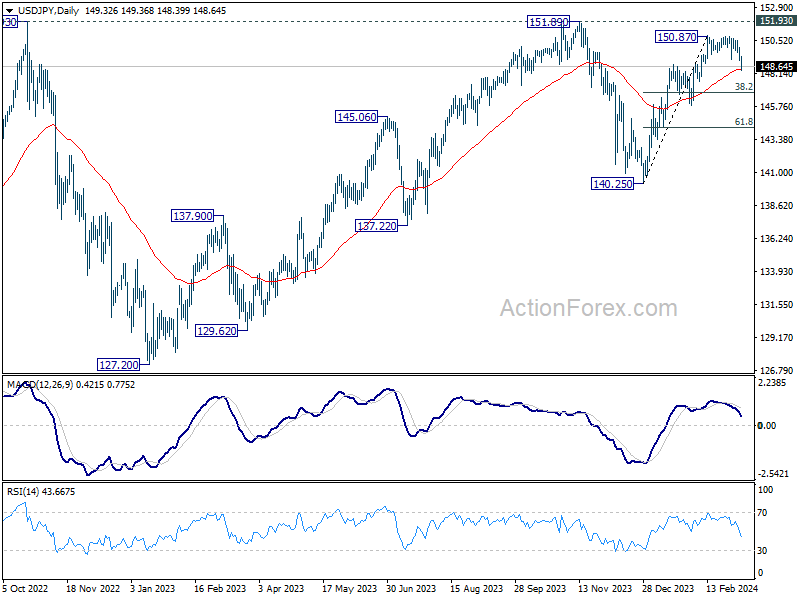
USD/JPY Daily Outlook
Daily Pivots: (S1) 148.98; (P) 149.53; (R1) 149.97; More...
Intraday bias in USD/JPY back on the downside with strong break of 149.20 support. Fall from 150.87 could either be correcting the rise from 140.25, or completely reversing it. In either case, deeper decline is expected to 38.2% retracement of 140.25 to 150.87 at 146.81. Sustained break there will bolster the latter case, and target 61.8% retracement at 144.30 and below. For now, risk will stay on the downside as long as 150.87 resistance holds, in case of recovery.
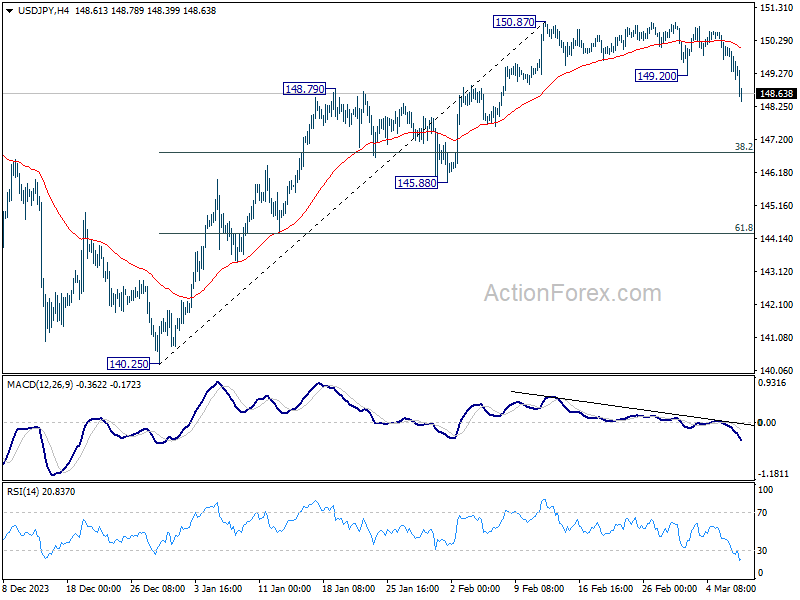
In the bigger picture, outlook is mixed up as fall from 150.87 accelerates lower. Sustained trading below 55 D EMA (now at 148.45) will open up the case that corrective pattern from 151.89 (2023 high) is extending, with fall from 150.87 as the third leg. In this case, deeper decline would be seen to 140.25 support or below. Nevertheless, strong bounce from 55 D EMA will retain near term bullishness for at least another take on 151.89.