Sample Category Title
EUR/CHF Daily Outlook
Daily Pivots: (S1) 0.9500; (P) 0.9518; (R1) 0.9534; More...
Intraday bias in EUR/CHF is turned with current retreat. Another rise could still be seen, by considering bearish divergence condition in 4H MACD, upside would be limited by 0.9574 fibonacci level. On the downside, break of 0.9466 support will indicate short term topping, and turn bias back to the downside.
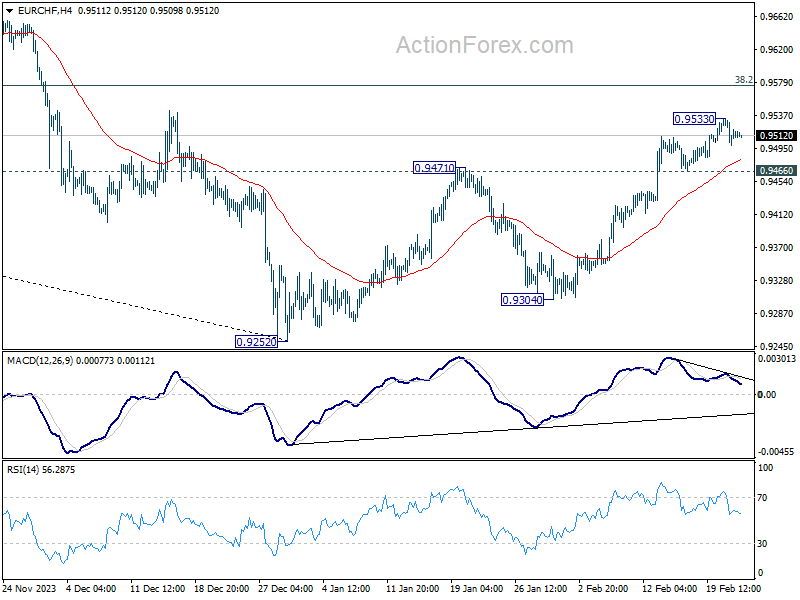
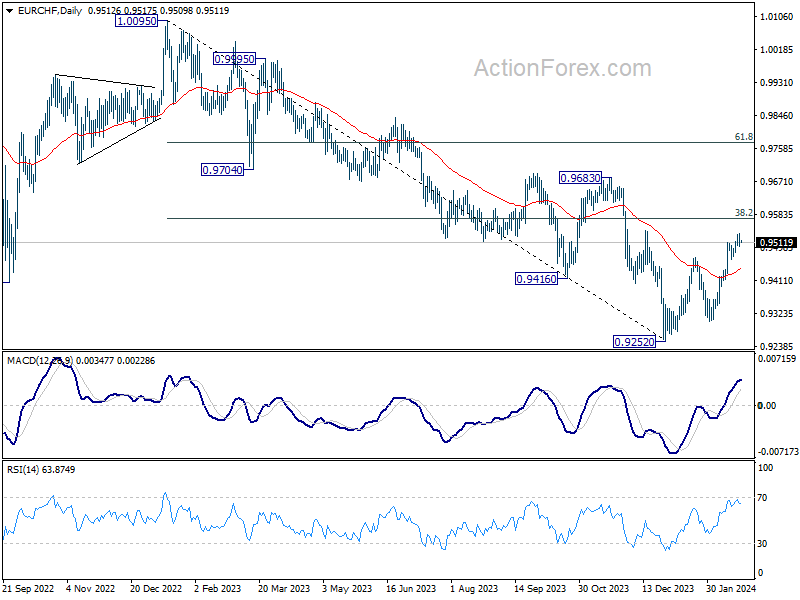
In the bigger picture, price actions from 0.9252 are tentatively seen as a correction to the five-wave down trend from 1.0095 (2023 high). Further rise would be seen to 38.2% retracement of 1.0095 to 0.9252 at 0.9574 and possibly above. But overall medium term outlook will remain bearish as long as 0.9683 resistance holds.
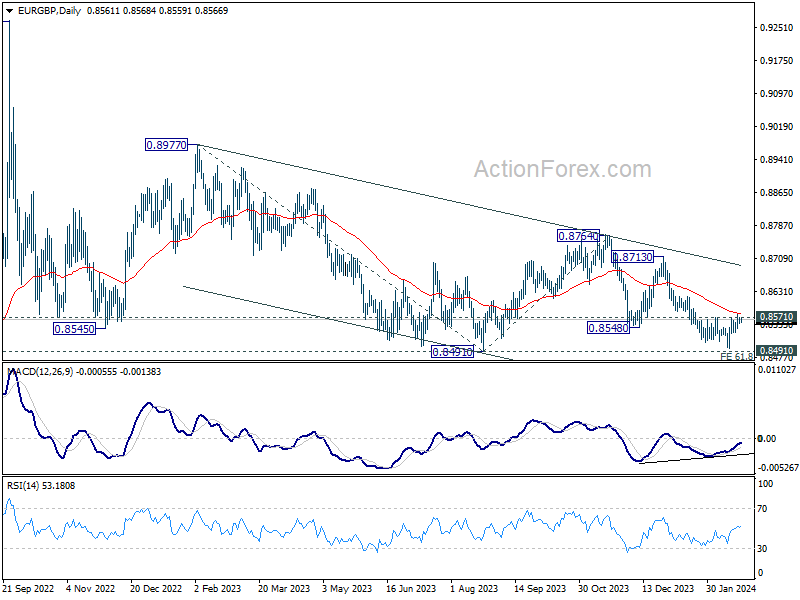
EUR/GBP Daily Outlook
Daily Pivots: (S1) 0.8555; (P) 0.8564; (R1) 0.8570; More...
Outlook in EUR/GBP is unchanged and intraday bias stays neutral. On the downside, break of 0.8497 will resume recent fall to 0.8464 projection level. However, considering bullish convergence condition in 4H MACD, sustained break of 0.8571 will confirm short term bottoming, and turn bias back to the upside for stronger rebound.
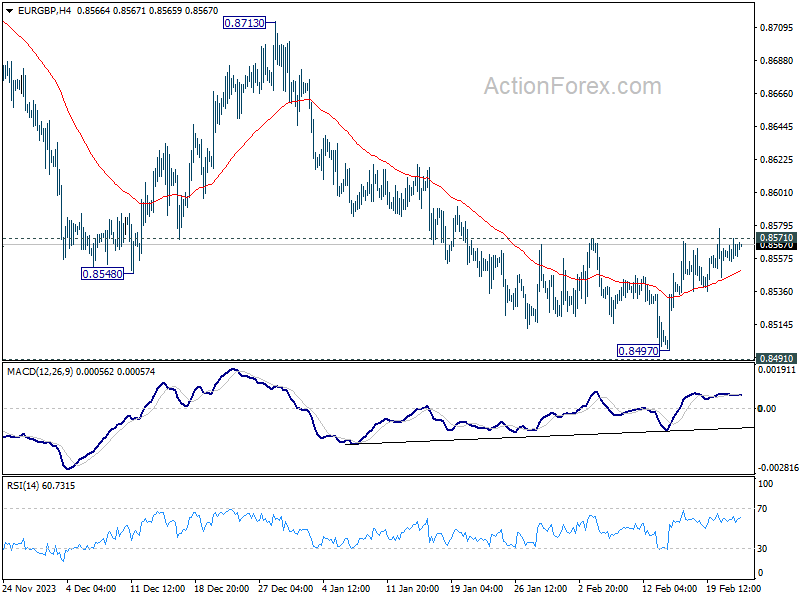
In the bigger picture, fall from 0.8764 is seen as another leg in the whole down trend from 0.9267 (2022 high). Outlook will stay bearish as long as 0.8713 resistance holds. Break of 0.8491 will target 61.8% projection of 0.8977 to 0.8491 from 0.8764 at 0.8464.
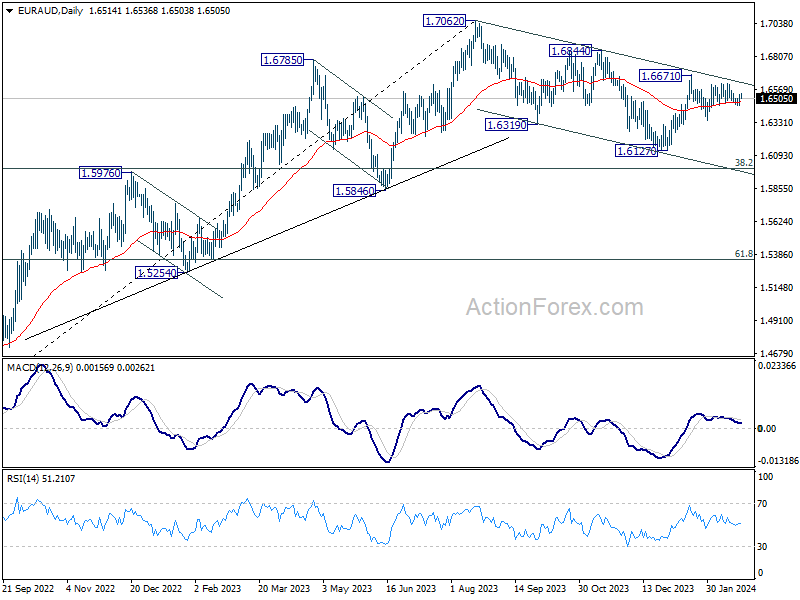
EUR/AUD Daily Outlook
Daily Pivots: (S1) 1.6468; (P) 1.6501; (R1) 1.6546; More...
Range trading continues in EUR/AUD and intraday bias remains neutral for the moment. On the upside, decisive break of 1.6671 will revive the case that whole correction from 1.7062 has completed with three waves down to 1.6127. Further rally should then be seen to 1.6844 resistance for confirmation. Nevertheless, below 1.6455 minor support will turn bias to the downside for 1.6348 and possibly below.
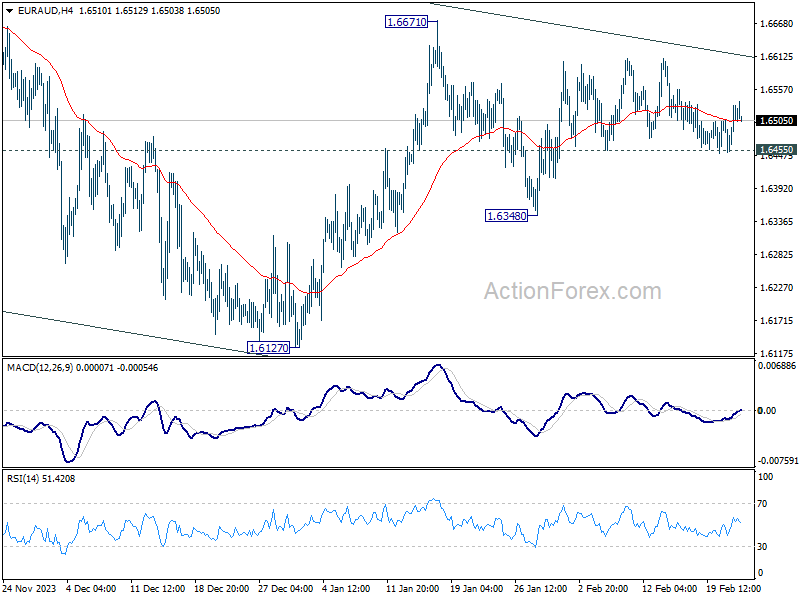
In the bigger picture, fall from 1.7062 medium term top is seen as a correction to the up trend from 1.4281 (2022 low). Break of 1.6844 resistance will argue that this up trend is ready to resume through 1.7062 high. In case of another fall, strong support should be seen around 1.5846 and 38.2% retracement of 1.4281 to 1.7062 at 1.6000 to bring rebound.
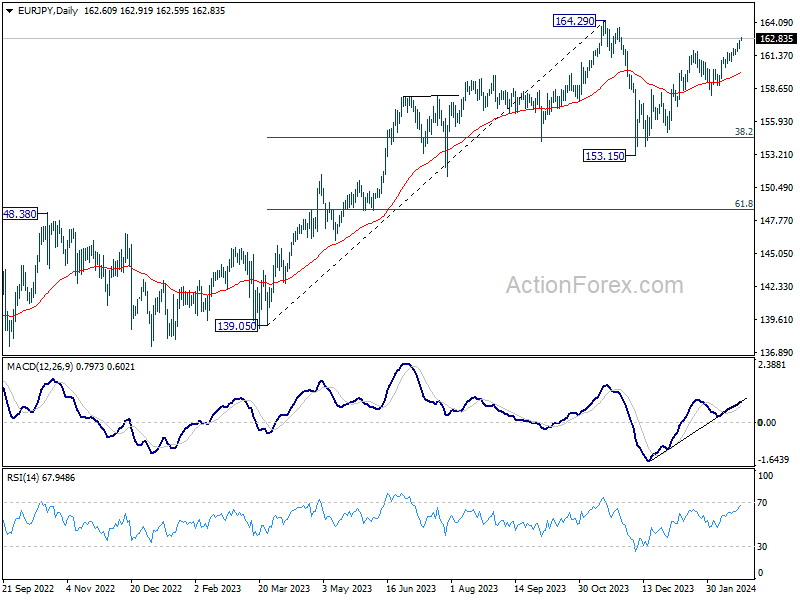
EUR/JPY Daily Outlook
Daily Pivots: (S1) 162.17; (P) 162.41; (R1) 162.86; More...
EUR/JPY's rally is in progress and intraday bias stays on the upside. Current rise from 153.15 is in progress for retesting 164.29 high. On the downside, however, below 161.93 minor support will turn intraday bias neutral and bring consolidations, before staging another rally.
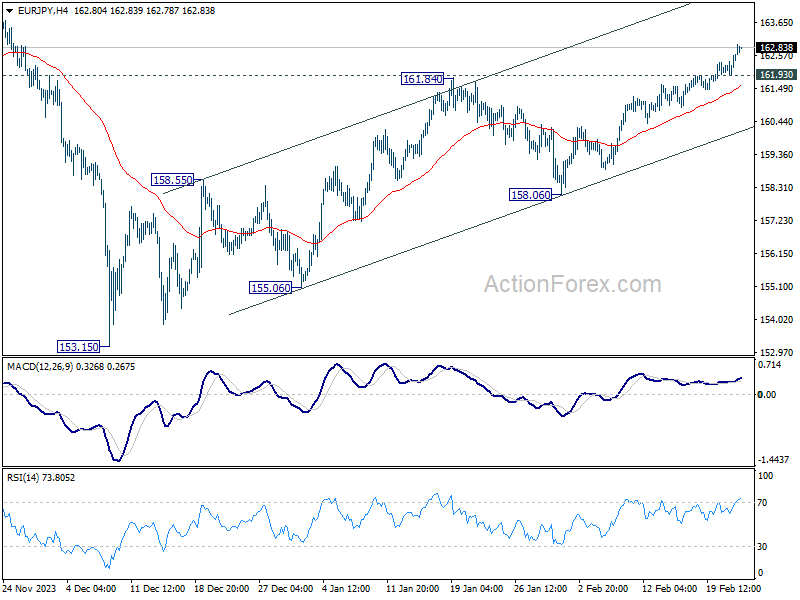
In the bigger picture, price actions from 164.29 medium term top are seen as a correction to rise from 139.05 only. As long as 148.38 resistance turned support holds (2022 high), larger up trend from 114.42 (2020 low) is expected to resume through 164.29 at a later stage. Next target would be 169.96 (2008 high).
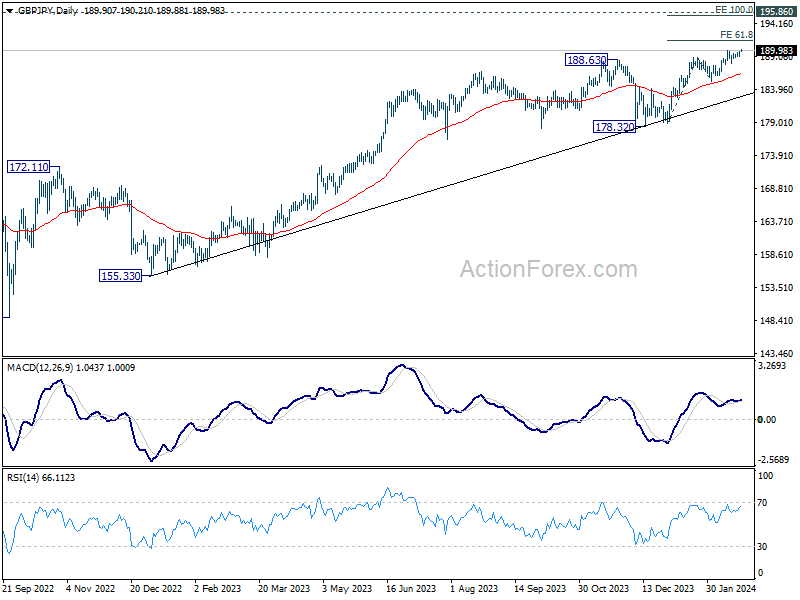
GBP/JPY Daily Outlook
Daily Pivots: (S1) 189.42; (P) 189.68; (R1) 190.21; More...
GBP/JPY's up trend is trying to resume by breaking through 190.05. Intraday bias is back on the upside for 61.8% projection of 178.71 to 188.90 from 185.21 at 191.50. On the downside, below 189.05 minor support will turn intraday bias neutral and bring consolidations again, before staging another rally.
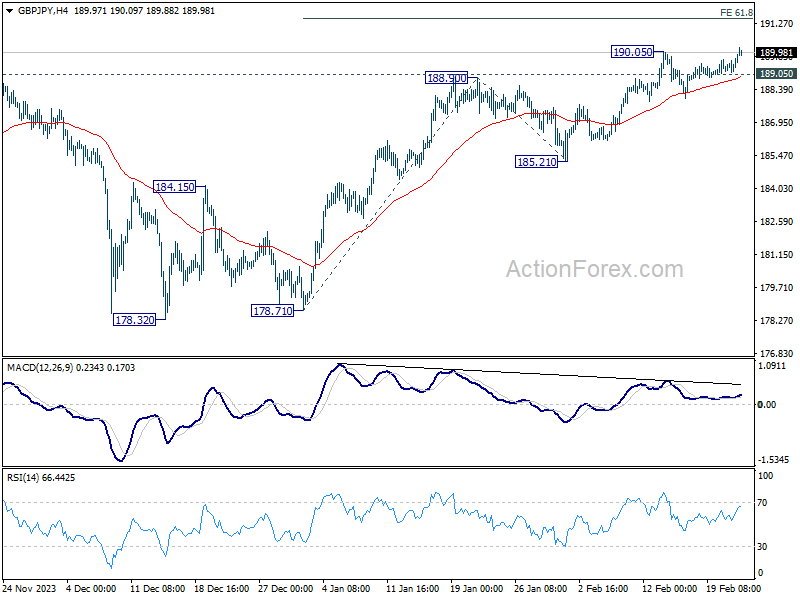
In the bigger picture, up trend from 123.94 (2020 low) in in progress. Medium term outlook will stay bullish as long as 178.32 support holds. Next target is 195.86 long term resistance (2015 high).
Japan’s Stock Market Breaks Through the “Iron Coffin Lid”, Yen Broadly Lower
Japanese Yen had a broad-based declined in Asian session today, while Nikkei extended its recent up trend, momentarily reaching a new record high, ending the 34-year wait. This milestone is of considerable psychological significance for Japan, symbolizing the end of over three decades of economic stagnation ensued after the burst of the country's stock and property bubble. The term "iron coffin lid" has often been used to describe the elusive barrier that is unreachable, making today's breakthrough a momentous occasion for Japanese investors and the broader economy.
Despite recent weak PMI data and anticipation of BoJ rate hike later in the year, Japanese investors appear undeterred. BoJ Governor Kazuo Ueda continued his actively communicating with the markets, noting today that trend inflation is "heightening" and that service prices continue to "rise moderately", reassuring investors of the central bank's commitment to making "appropriate monetary policy decisions."
The latest Reuters poll indicates that 83% of economists expect BoJ to end its negative interest rate policy in April, with 76% predicting the abandonment of yield curve control at the same meeting.
Meanwhile, Dollar's weakness persists, even as the market pares back its expectations regarding Fed's rate cuts. The minutes from January FOMC meeting reveal a committee majority concerned with the risks associated with premature policy easing. This sentiment reflects a broader inclination towards maintaining interest rates at their current level for an extended period, albeit with the recognition that this strategy may necessitate more aggressive cuts later on.
For the week, the Yen ranks as the poorest performer among major currencies, trailed by Dollar and Sterling. Conversely, New Zealand Dollar leads as the strongest, followed by Canadian Dollar and Swiss Franc, with Euro and Australian Dollar positioned in the middle. Nevertheless, upcoming PMI data and ECB meeting accounts hold the potential to further shuffle these rankings.
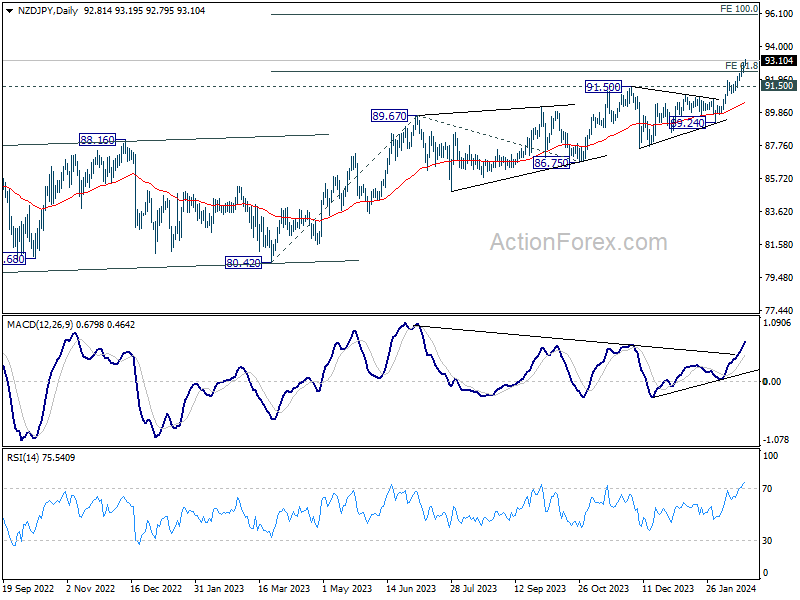
Technically, NZD/JPY's up trend continues today and hit as high as 93.19 so far. D MACD is showing sign up upside acceleration. Given that 61.8% projection of 80.42 to 89.67 from 86.75 is broken, next target will be 100% projection at 96.00. In any case, outlook will now stay bullish as long as 91.50 resistance turned support holds.
In Asia, at the time of writing, Nikkei is up 1.86%. Hong Kong HSI is up 0.55%. China Shanghai SSE is up 0.78%. Singapore Strait Times is down -0.26%. Japan 10-year JGB yield is down -0.0005 at 0.725. Overnight, DOW rose 0.13%. S&P 500 rose 0.13%. NASDAQ fell -0.32%. 10-year yield rose 0.050 to 4.325.
FOMC minutes: A majority hesitant on swift monetary easing
The latest FOMC minutes reveal a predominant caution against premature easing of monetary policy. The document underscores a consensus among "most participants" over the potential risks of reducing interest rates too hastily, expressing a preference for delaying cuts rather than risking the need to reverse course.
During the FOMC meeting held on January 30-31, the discussion emphasized that participants did not anticipate it being appropriate to lower the federal funds rate target range without "greater confidence" that inflation was on a sustainable path back to 2% target. The determination of the future policy rate path was tied closely to "incoming data, the evolving outlook, and the balance of risks." .
Although the balance of risks towards employment and inflation goals was seen as "moving into better balance", participants remained "highly attentive to inflation risks". While upside risks to inflation have "diminished", inflation remains above target. This vigilance is framed within a broader context of concern that "progress toward price stability could stall", particularly in scenarios where demand strengthens unexpectedly or supply-side improvements falter.
The predominant narrative within the FOMC leans towards a cautious approach to policy easing, with "most participants" underscoring the perils of "moving too quickly" and the importance of a meticulous evaluation of incoming data to ascertain whether inflation trends align with the target sustainably. In contrast, only "a couple of participants" raised concerns about the economic downsides of an "overly restrictive stance" persisting for an extended period.
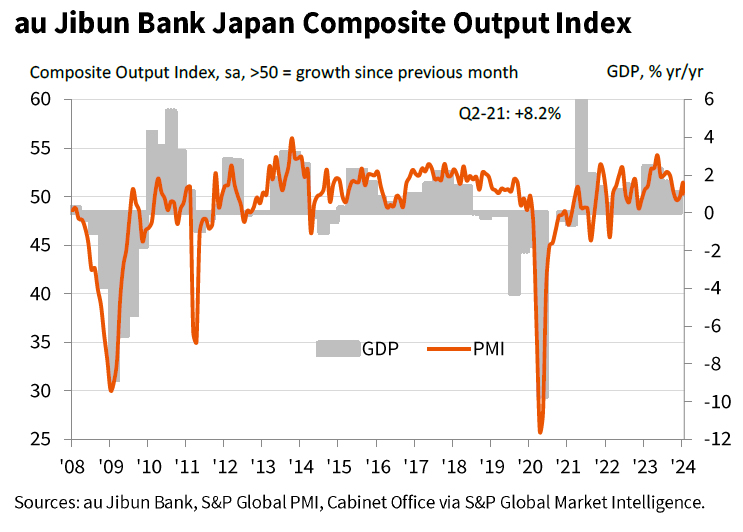
Japan's PMI composite drops to 50.3, from recovery to stagnation
Japan's PMI Manufacturing dipped further to 47.2 from 48.0, marking the ninth consecutive month of sector contraction and hitting the lowest point since August 2020. PMI Services also declined, albeit more moderate, falling from 53.1 to 52.5. Consequently, Composite PMI, which combines both manufacturing and service sectors, decreased from 51.5 to a near-stagnation point of 50.3.
Usamah Bhatti, Economist at S&P Global Market Intelligence, commented on the recent data, noting that the slight improvement observed at the beginning of the year has "all but evaporate[d]" in February. He described the month's growth as "only fractional," attributing it to "softer upturn in services activity" that was insufficient to counterbalance the "steepest contraction in manufacturing output for a year."
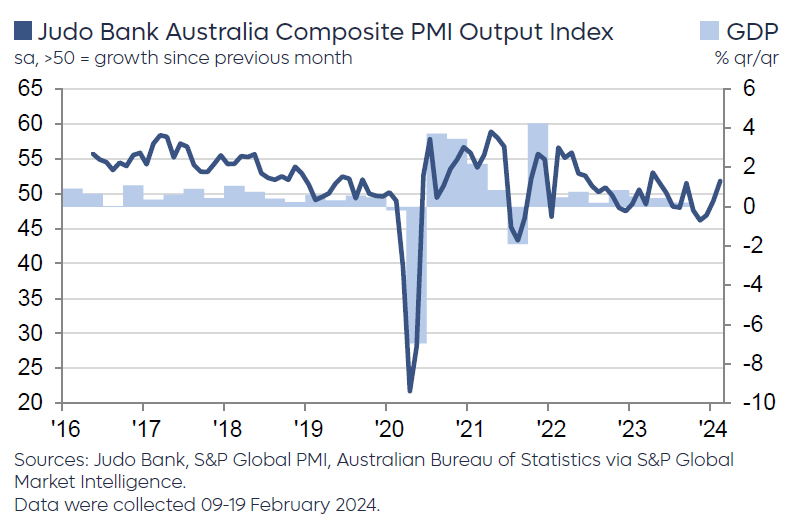
Australia's Composite PMI climbs to 51.8, diminishing prospects for near-term RBA rate cut
Australia's PMI Manufacturing fell sharply from 50.1 to 47.7 in February, with Manufacturing Output marking a 45-month low at 45.0. In stark contrast, PMI Services surged to a 10-month high of 52.8, propelling the Composite PMI to 51.8, the first time it has breached the 50-mark threshold since last June.
Warren Hogan, Chief Economic Advisor at Judo Bank, said the PMI results "weaken the case for monetary policy easing any time soon". Improvement in activity indicators and modest rise in price indexes suggest that "risks to monetary policy remain even balanced".
Hogan's analysis also points to an economy that is gaining momentum, expanding at more vigorous pace in 2024 compared to the latter half of 2023. He posits that continuous improvements could herald stronger economic growth this year than the last, hinting that "soft landing is behind us".
Furthermore, Composite Employment Index reached its highest level since last September, indicating "rising labour demand and employment growth" in the overall economy. This is accompanied by intensifying price pressures, with Composite Output Price Index's climb to its highest point since last September 2023, indicating that domestic inflation could be hovering between 4% and 5%. Hogan cautions that the recent trend of disinflation "may well have run its course."
New Zealand's trade deficit widens, exports falls -7.1% yoy and imports down -20% yoy
New Zealand's trade activity in January showed notable downturn, with goods exports dropping by -7.1% yoy to NZD 4.9B and goods imports declining by a substantial -20.0% yoy to NZD 5.9B. This resulted in trade deficit of NZD -976m, significantly larger than the anticipated NZD -200m.
A closer examination of the data reveals Australia as the leading contributor to the monthly fall in New Zealand's exports, with a -17% decrease amounting to NZD -112m. Not far behind, Japan saw a dramatic -34% reduction in its exports from New Zealand, translating to NZD -105m. Conversely, EU was a rare bright spot, where New Zealand's exports actually increased by 5.8%, or NZD 15m. Other major trading partners like China and the USA also experienced declines in exports from New Zealand, by -2.8% (NZD -42m) and -5.6% (NZD -31m), respectively.
On the import side, EU recorded the most significant monthly drop, with imports falling by -33% to NZD -386m. South Korea followed closely with a -34% decrease, equating to NZD -286m. Other notable decreases in imports came from China (NZD -84m, -5.4%), Australia (NZD -57m, -9.2%), and the USA (NZD -30m, -5.6%).
Looking ahead
Eurozone PMIs, CPI final, and ECB meeting accounts will be featured in European session. UK will also release PMIs. Later int he day, Canada retail sales will be a focus. US will publish jobless claims, PMIs, and existing home sales.
GBP/JPY Daily Outlook
Daily Pivots: (S1) 189.42; (P) 189.68; (R1) 190.21; More...
GBP/JPY's up trend is trying to resume by breaking through 190.05. Intraday bias is back on the upside for 61.8% projection of 178.71 to 188.90 from 185.21 at 191.50. On the downside, below 189.05 minor support will turn intraday bias neutral and bring consolidations again, before staging another rally.
In the bigger picture, up trend from 123.94 (2020 low) in in progress. Medium term outlook will stay bullish as long as 178.32 support holds. Next target is 195.86 long term resistance (2015 high).
Economic Indicators Update
| GMT | Ccy | Events | Actual | Forecast | Previous | Revised |
|---|---|---|---|---|---|---|
| 21:45 | NZD | Trade Balance (NZD) Jan | -976M | -200M | -323M | -368M |
| 22:00 | AUD | Manufacturing PMI Feb P | 47.7 | 50.1 | ||
| 22:00 | AUD | Services PMI Feb P | 52.8 | 49.1 | ||
| 00:30 | JPY | Manufacturing PMI Feb P | 47.2 | 48.2 | 48 | |
| 00:30 | JPY | Services PMI Feb P | 52.5 | 53.1 | ||
| 08:15 | EUR | France Manufacturing PMI Feb P | 44 | 43.1 | ||
| 08:15 | EUR | France Services PMI Feb P | 45.6 | 45.4 | ||
| 08:30 | EUR | Germany Manufacturing PMI Feb P | 46.1 | 45.5 | ||
| 08:30 | EUR | Germany Services PMI Feb P | 48 | 47.7 | ||
| 09:00 | EUR | Eurozone Manufacturing PMI Feb P | 47.1 | 46.6 | ||
| 09:00 | EUR | Eurozone Services PMI Feb P | 48.7 | 48.4 | ||
| 09:30 | GBP | Manufacturing PMI Feb P | 47.1 | 47 | ||
| 09:30 | GBP | Services PMI Feb P | 54.4 | 54.3 | ||
| 10:00 | EUR | Eurozone CPI Y/Y Jan F | 2.80% | 2.80% | ||
| 10:00 | EUR | Eurozone CPI Core Y/Y Jan F | 3.30% | 3.30% | ||
| 12:30 | EUR | ECB Meeting Accounts | ||||
| 13:30 | CAD | Retail Sales M/M Dec | 0.80% | -0.20% | ||
| 13:30 | CAD | Retail Sales ex Autos M/M Dec | 0.70% | -0.50% | ||
| 13:30 | USD | Initial Jobless Claims (Feb 16) | 217K | 212K | ||
| 14:45 | USD | Manufacturing PMI Feb P | 50.2 | 50.7 | ||
| 14:45 | USD | Services PMI Feb P | 52 | 52.5 | ||
| 15:00 | USD | Existing Home Sales Jan | 3.95M | 3.78M | ||
| 15:30 | USD | Natural Gas Storage | -59B | -49B | ||
| 16:00 | USD | Crude Oil Inventories | 3.9M | 12.0M |
Technical Outlook and Review
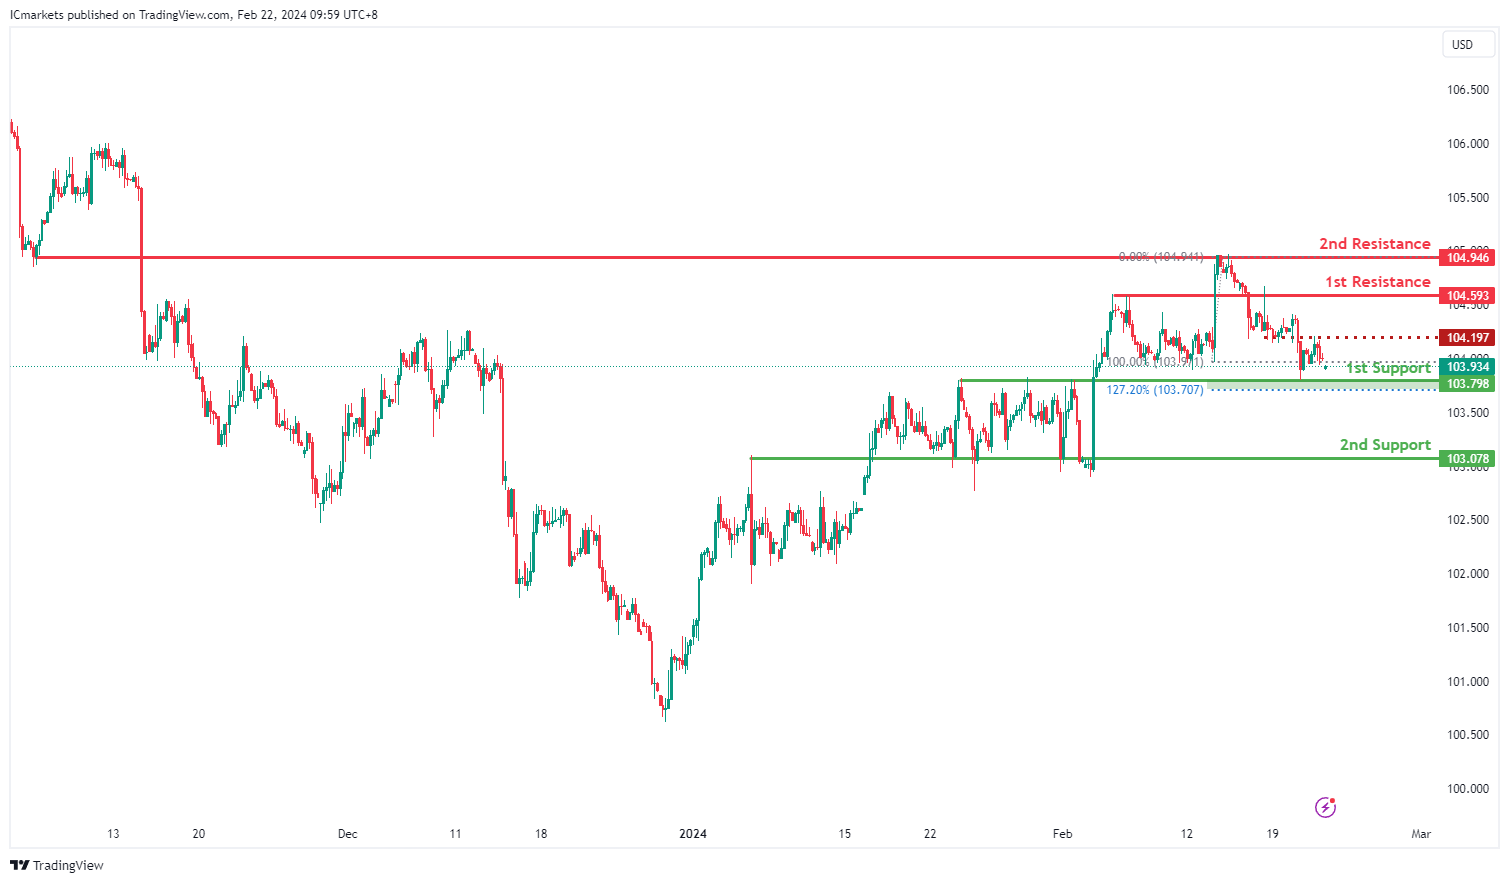
DXY:
The DXY (US Dollar Index) chart currently exhibits bullish momentum, suggesting a potential bullish bounce off the 1st support level followed by a movement towards the 1st resistance.
The 1st support level at 103.79 is identified as an overlap support, indicating a historical level where buying interest has previously emerged to support the price. Additionally, the presence of the 127.20% Fibonacci Extension adds further significance to this support zone, potentially reinforcing its ability to attract buyers.
Similarly, the 2nd support at 103.07 is characterized as an overlap support, further strengthening its importance as a level where buyers may intervene to support the price.
On the resistance side, the 1st resistance level at 104.59 is identified as an overlap resistance, indicating its historical significance as a barrier where selling pressure may increase.
Furthermore, the 2nd resistance at 104.94 is noted as an overlap resistance, further reinforcing its significance as a level where selling interest may intensify.
An intermediate resistance level at 104.19 is also identified, aligning with an overlap resistance. This level adds additional confluence to the resistance zone, potentially acting as a barrier to further upward movement.
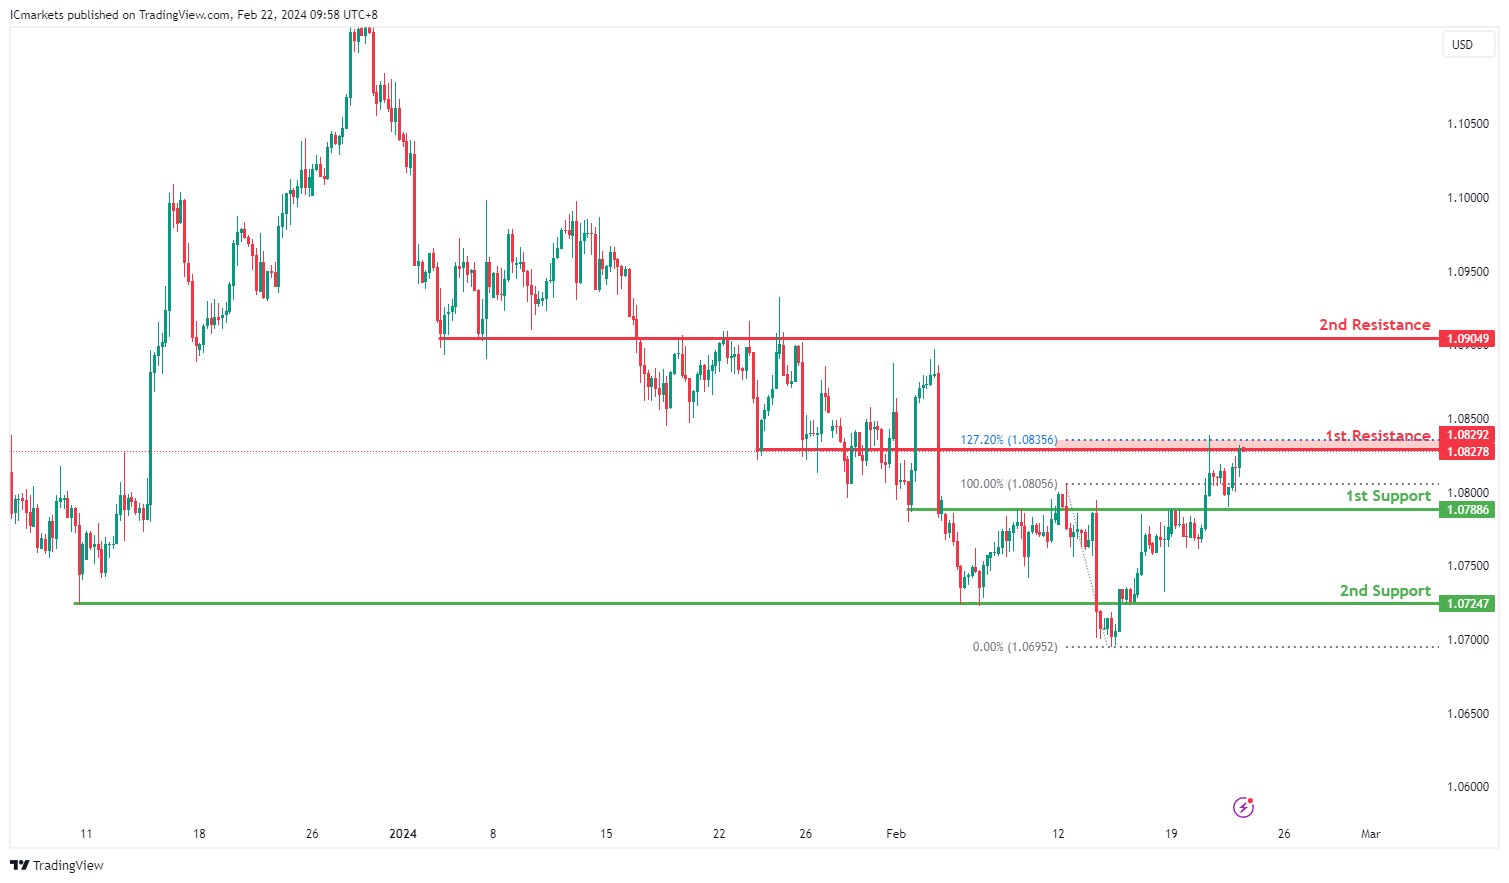
EUR/USD:
The EUR/USD chart currently indicates a bearish momentum, suggesting a potential bearish reaction off the 1st resistance level followed by a drop towards the 1st support.
The 1st support at 1.0788 is identified as an overlap support, indicating its historical significance as a level where buying interest has previously emerged to support the price.
Additionally, the 2nd support at 1.0724 is characterized as an overlap support, further reinforcing its importance as a potential level where buyers may intervene to support the price.
On the resistance side, the 1st resistance level at 1.0829 is identified as an overlap resistance, indicating its historical significance as a barrier where selling pressure may increase. Furthermore, the presence of the 127.20% Fibonacci Extension adds further confluence to this resistance zone.
The 2nd resistance at 1.0904 is noted as an overlap resistance, further reinforcing its significance as a level where selling interest may intensify.
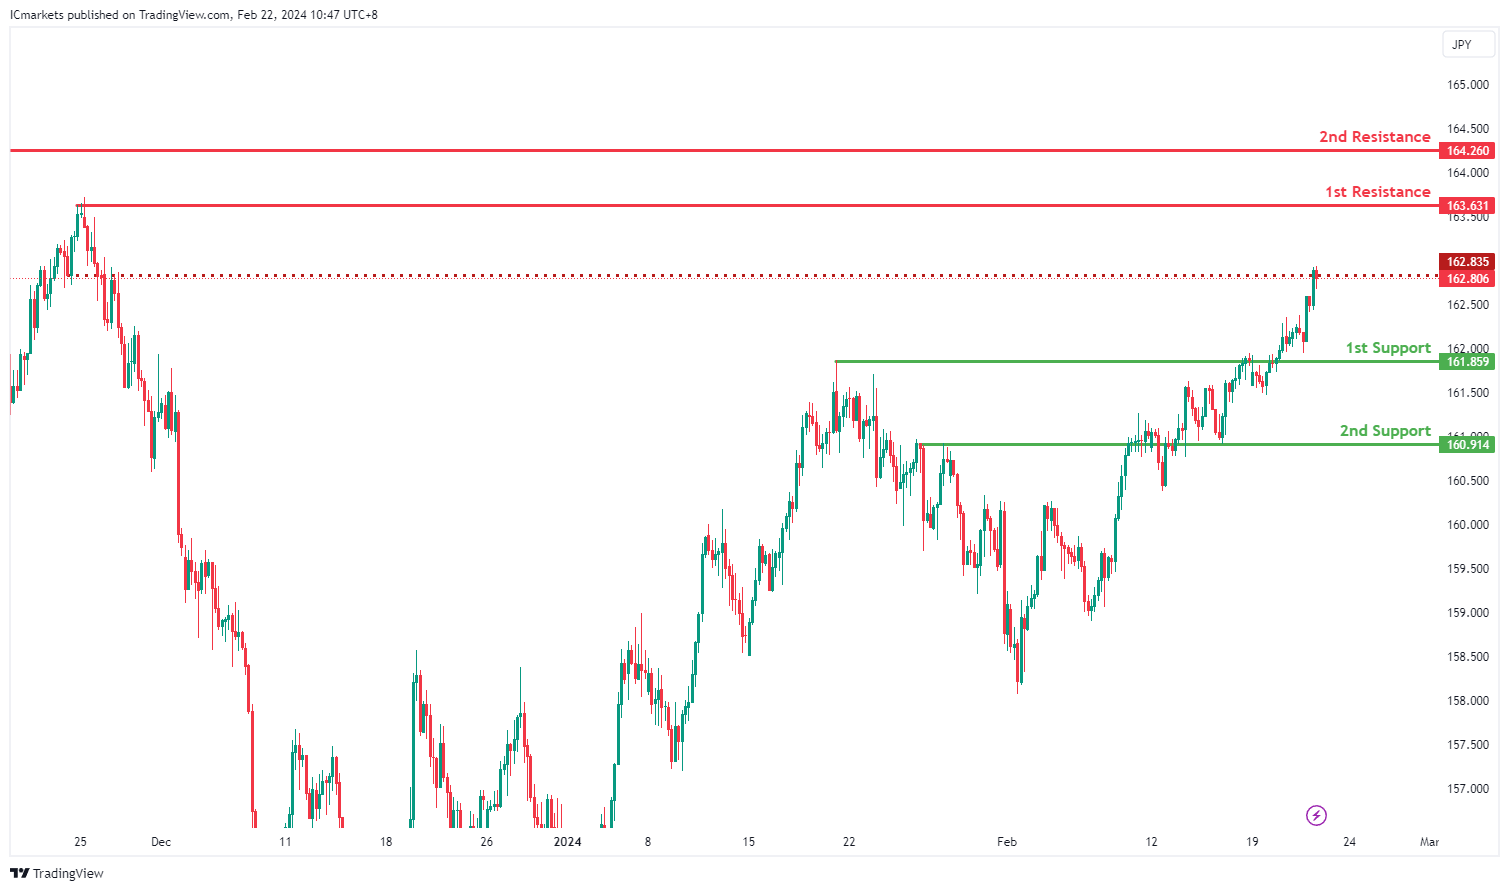
EUR/JPY:
The EUR/JPY chart is currently exhibiting bullish momentum, indicating a potential continuation of the upward trend. Several factors contribute to this sentiment, supporting the possibility of a bullish movement towards the 1st resistance level.
The 1st support level at 161.859 aligns with an overlap support, suggesting a historical level where buying interest has previously emerged. Similarly, the 2nd support at 160.914 corresponds to another overlap support, reinforcing its significance as a potential area of support.
On the resistance side, the intermediate resistance at 162.835 is identified as an overlap resistance, indicating a historical barrier to upward movement. Additionally, the 1st resistance level at 163.631 aligns with a swing high resistance, further strengthening its significance as a potential barrier to further upward movement.
Furthermore, the 2nd resistance level at 164.26 is identified as a multi-swing high resistance, adding to its significance as a potential barrier to further bullish movement.
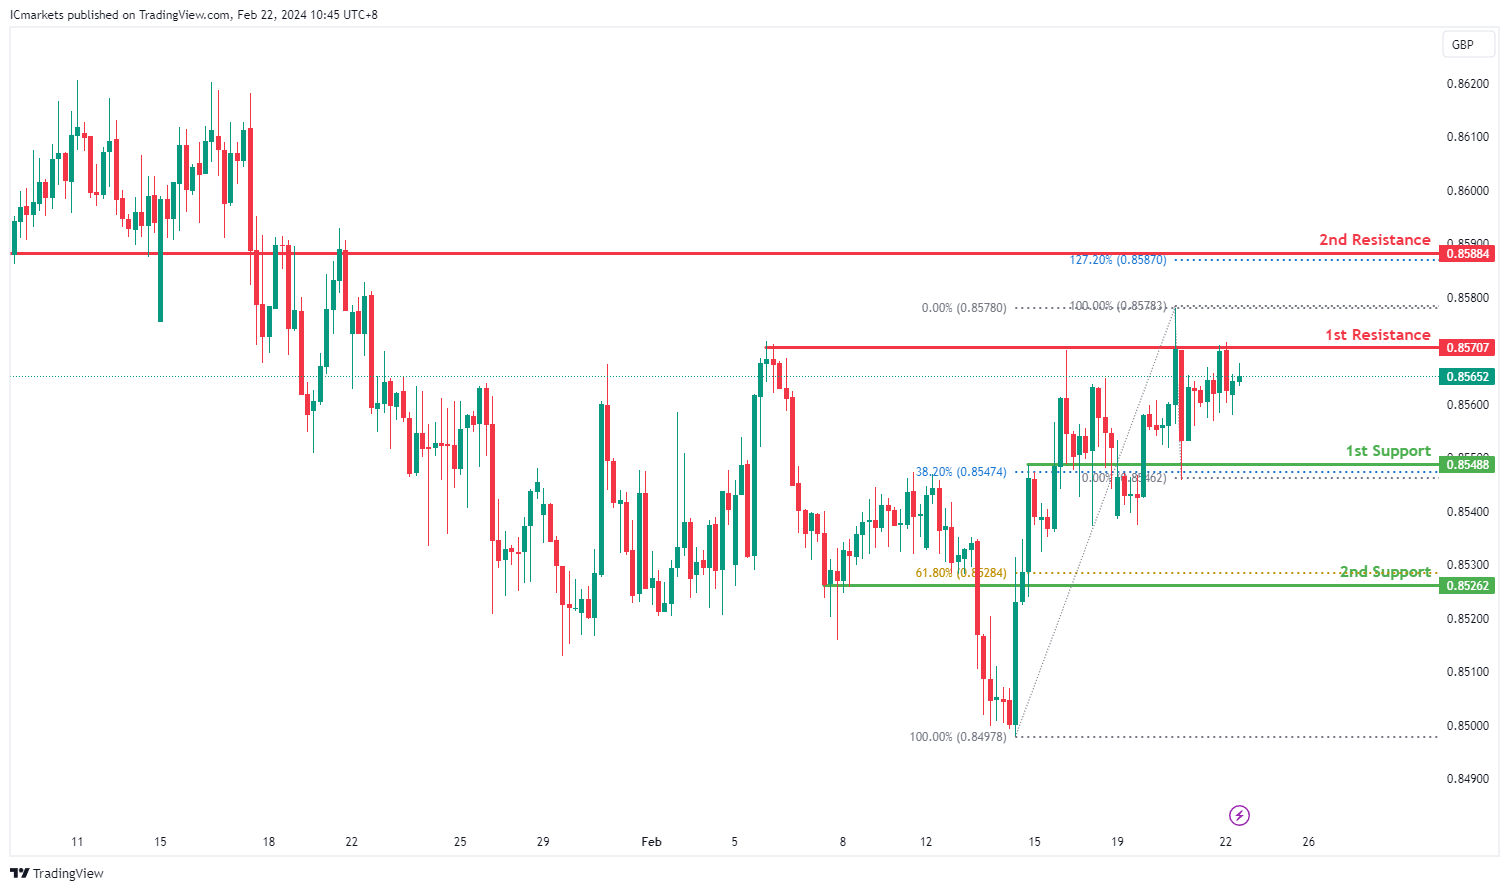
EUR/GBP:
The EUR/GBP chart currently displays bullish momentum, suggesting a potential continuation of the upward trend. Several factors support the possibility of a bullish movement towards the 1st resistance level.
The 1st support at 0.85488 aligns with an overlap support and the 38.20% Fibonacci Retracement, indicating a significant historical level where buying interest has emerged. Additionally, the 2nd support at 0.85262 corresponds to a swing low support and the 61.80% Fibonacci Retracement, further reinforcing its significance as a potential area of support.
On the resistance side, the 1st resistance level at 0.85707 is identified as a pullback resistance, suggesting a historical barrier to upward movement. Moreover, the 2nd resistance level at 0.85884 aligns with an overlap resistance and the 127.20% Fibonacci Extension, adding to its significance as a potential barrier to further bullish movement.
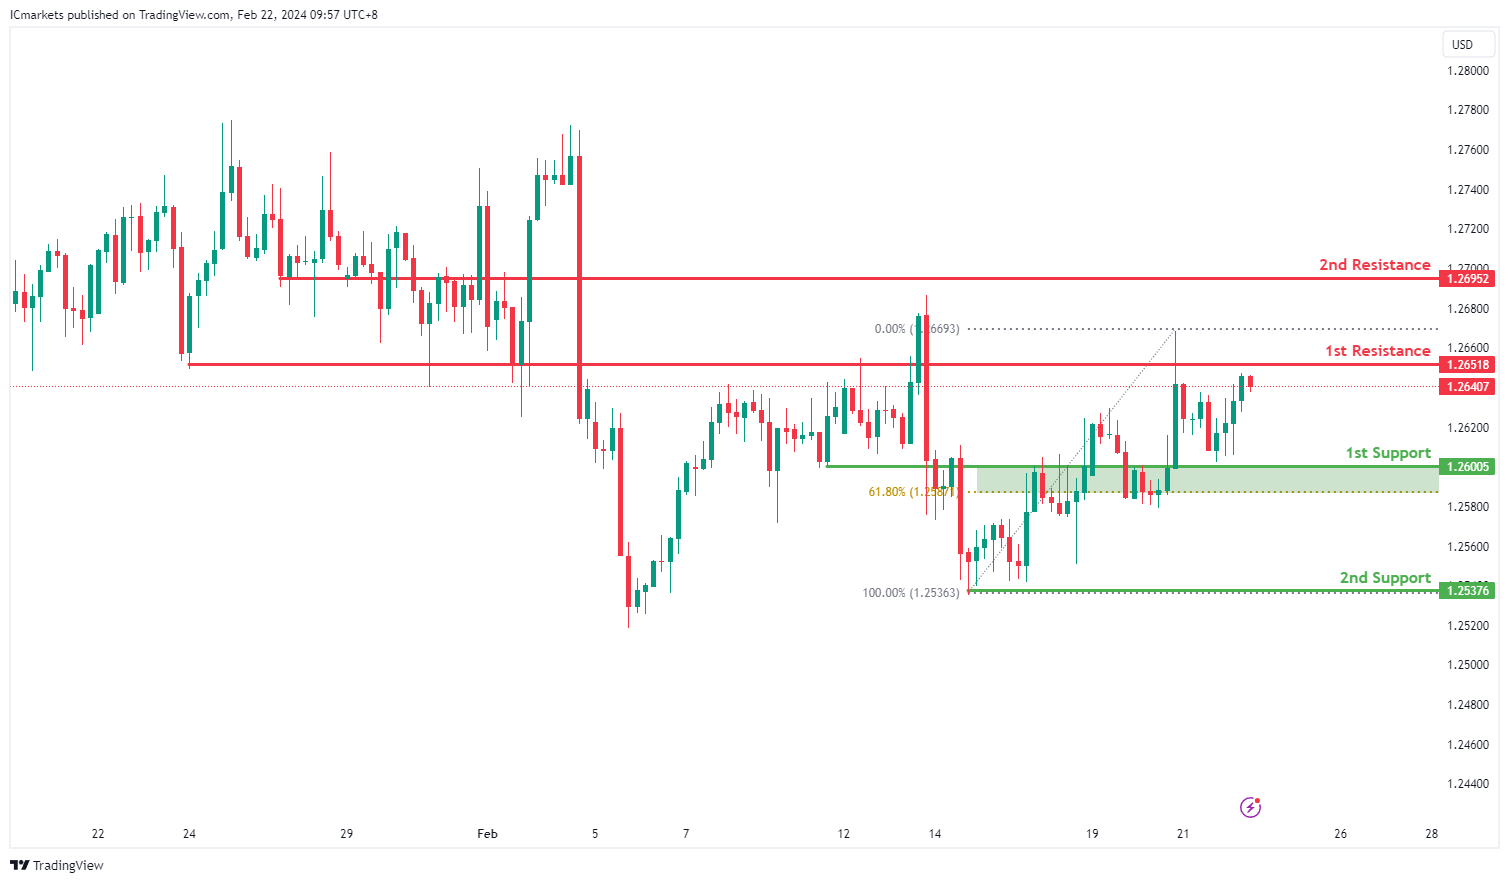
GBP/USD:
The GBP/USD chart currently suggests a bearish momentum, indicating a potential bearish reaction off the 1st resistance level followed by a drop towards the 1st support.
The 1st support at 1.2600 is identified as a pullback support, suggesting its significance as a level where buying interest may emerge to support the price.
Furthermore, the 2nd support at 1.2537 is characterized as a multi-swing low support, indicating its historical importance as a level where buyers have previously intervened to support the price.
On the resistance side, the 1st resistance level at 1.2651 is identified as an overlap resistance, suggesting its historical significance as a barrier where selling pressure may increase.
Additionally, the 2nd resistance at 1.2695 is noted as a pullback resistance, further reinforcing its importance as a level where selling interest may intensify.
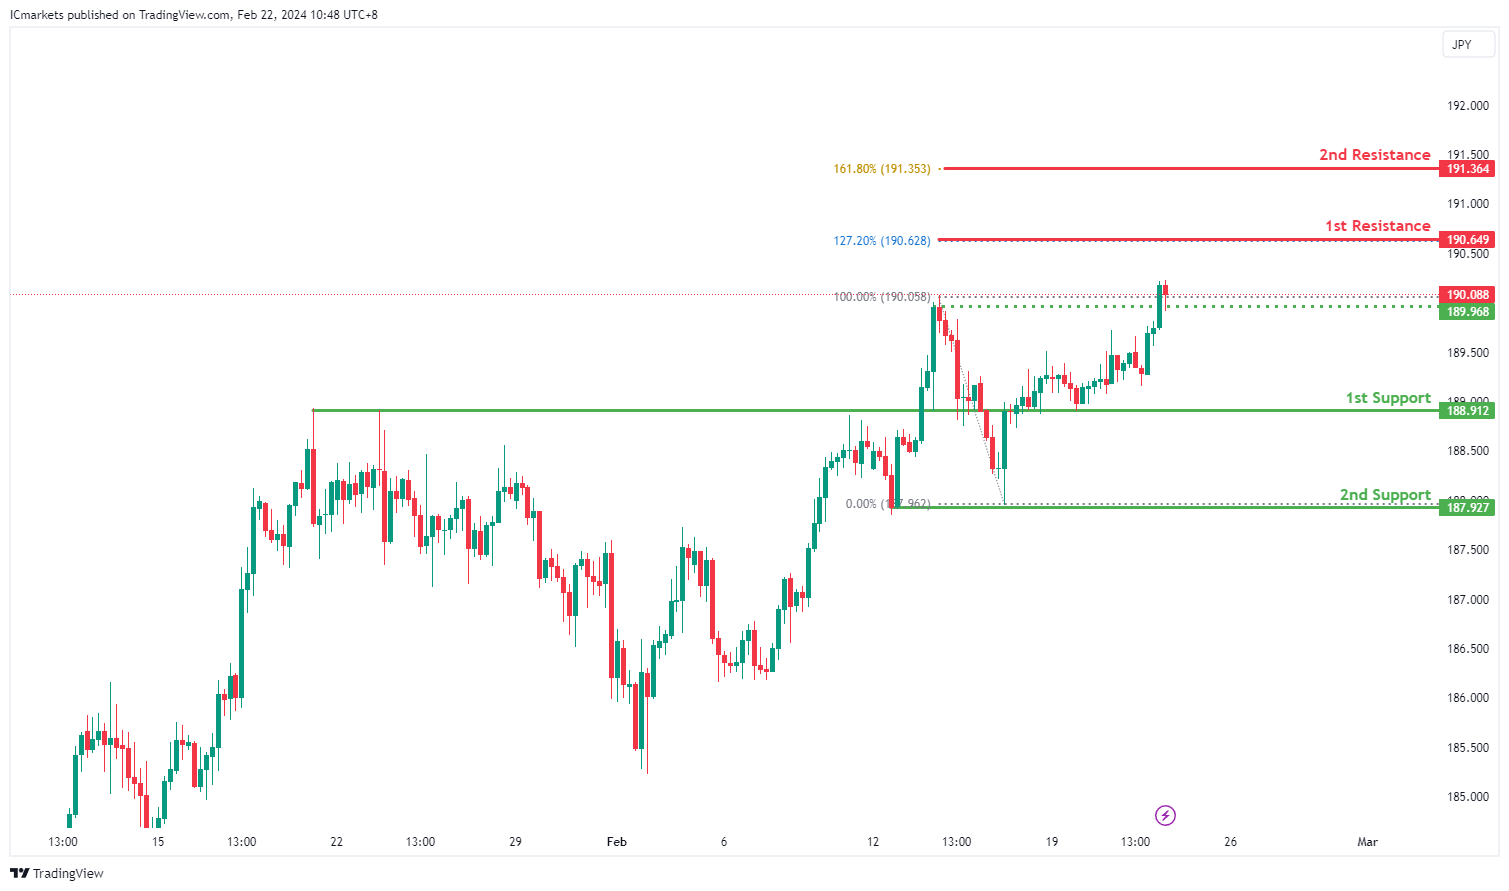
GBP/JPY:
The GBP/JPY chart currently exhibits bullish momentum, suggesting a potential continuation of the upward trend. Several factors support the possibility of a bullish movement towards the 1st resistance level.
The 1st support at 188.912 aligns with an overlap support, indicating a significant historical level where buying interest has emerged. Additionally, the 2nd support at 187.927 corresponds to a swing low support, further reinforcing its importance as a potential area of support.
On the resistance side, the 1st resistance level at 190.649 aligns with the 127.20% Fibonacci Extension, suggesting a potential barrier to further upward movement. Moreover, the 2nd resistance level at 191.364 coincides with the 161.80% Fibonacci Extension, adding to its significance as a potential barrier to further bullish movement.
An intermediate support level at 189.97 is also identified as a pullback support, providing additional reinforcement to the support structure.
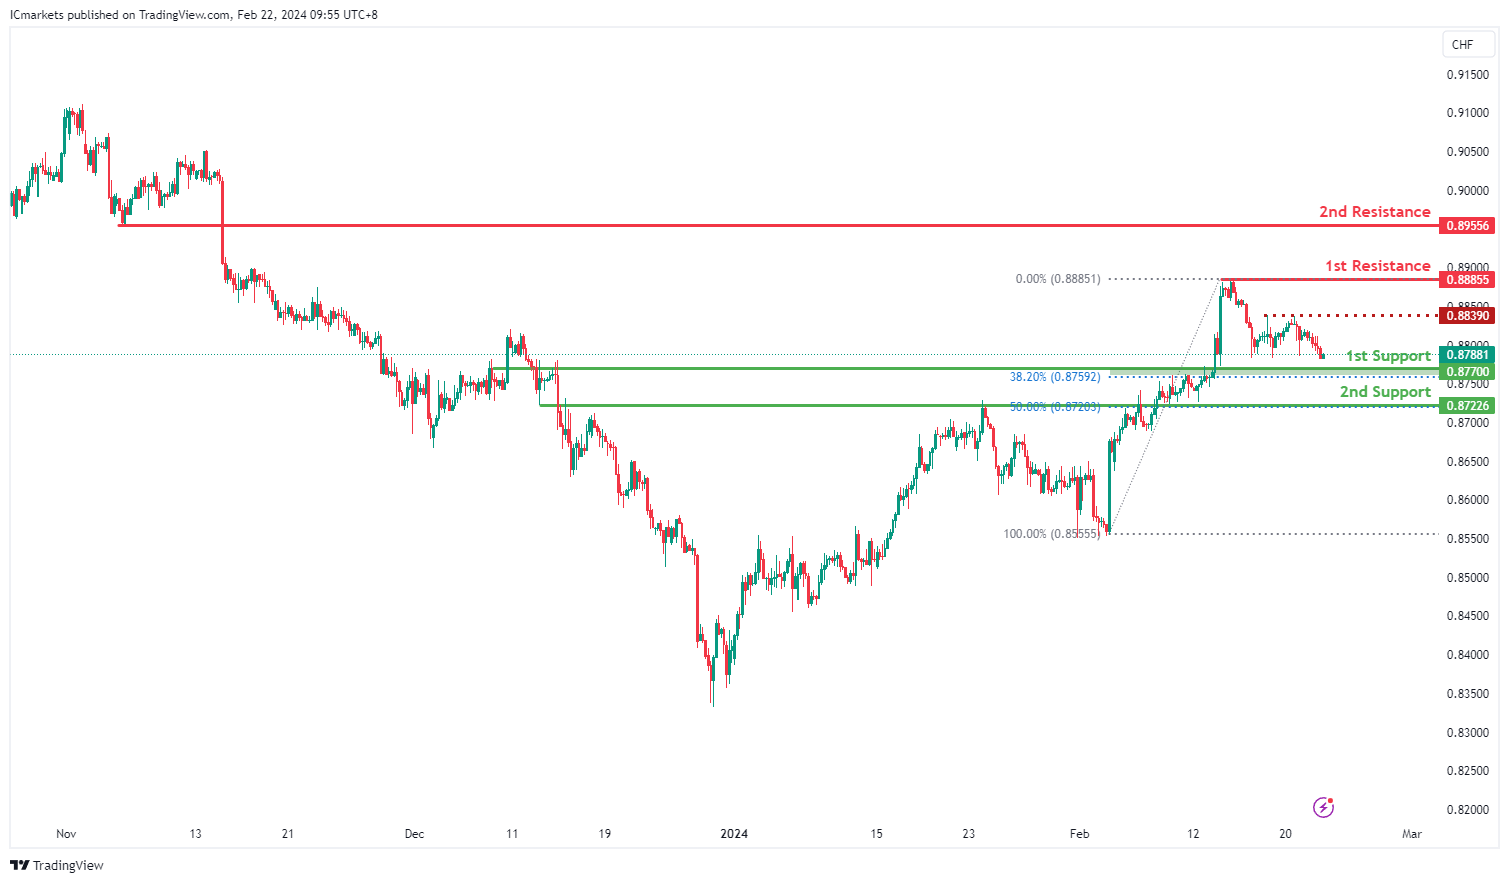
USD/CHF:
The USD/CHF chart currently indicates a bullish momentum, suggesting a potential bullish bounce off the 1st support level followed by a movement towards the 1st resistance.
The 1st support at 0.8770 is identified as an overlap support and coincides with the 38.20% Fibonacci Retracement level. This convergence implies a significant historical level where buying interest has previously emerged, potentially providing support to the price if tested.
Similarly, the 2nd support at 0.8722 is characterized as an overlap support and corresponds to the 50% Fibonacci Retracement level. This level also indicates a strong historical area where buyers have intervened to support the price, further reinforcing its significance as a potential support zone.
On the resistance side, the 1st resistance level at 0.8885 is identified as a multi-swing high resistance. This level suggests that it has acted as a significant barrier to upward price movements in the past, indicating potential selling pressure near this level.
Additionally, the 2nd resistance at 0.8955 is noted as a pullback resistance. This suggests that it has served as a level where selling interest has intensified, further confirming its importance as a resistance zone.
An intermediate resistance level at 0.8839 is also identified, aligning with the multi-swing high resistance. This level could act as an additional barrier to upward movement, potentially influencing price action in the short term.
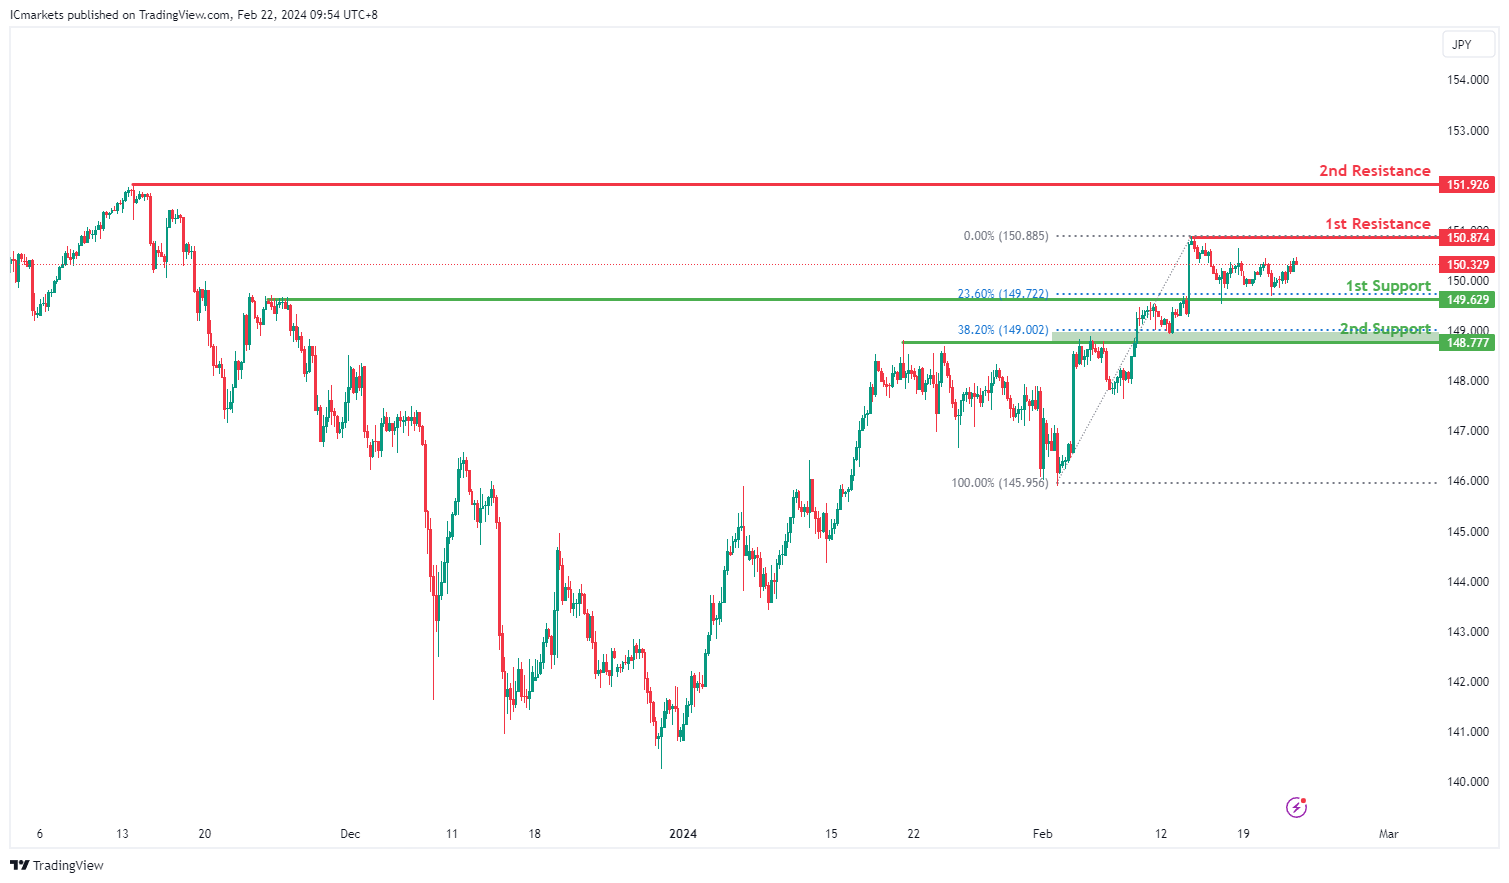
USD/JPY:
The USD/JPY chart currently suggests a neutral momentum, indicating a potential fluctuation between the 1st resistance and 1st support levels.
The 1st support at 149.62 is identified as an overlap support and aligns with the 23.60% Fibonacci Retracement level. This convergence suggests a strong historical level where buying interest has emerged in the past, potentially providing support to the price if tested.
Similarly, the 2nd support at 148.77 is characterized as an overlap support and corresponds to the 38.20% Fibonacci Retracement level. This level also indicates a significant historical area where buyers have intervened to support the price, reinforcing its importance as a potential support zone.
On the resistance side, the 1st resistance level at 150.87 is identified as a swing high resistance. This level suggests that it has acted as a significant barrier to upward price movements in the past, indicating potential selling pressure near this level.
Additionally, the 2nd resistance at 151.92 is noted as another swing high resistance, further confirming its importance as a historical point where selling interest has been strong.
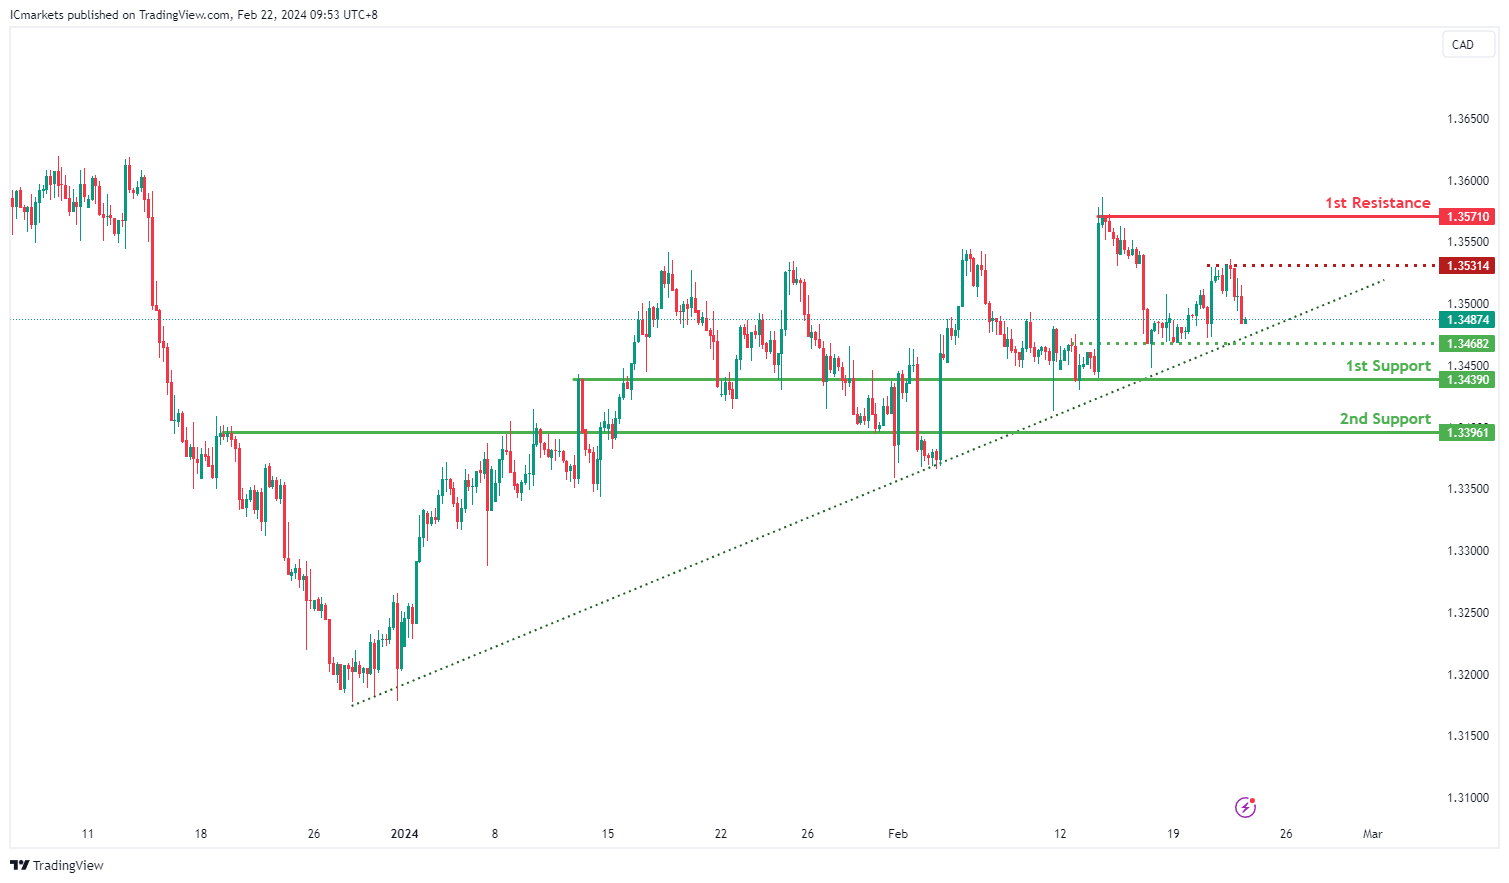
USD/CAD:
The USD/CAD chart currently exhibits a bullish momentum, supported by its position within a bullish ascending channel, signaling a potential uptrend continuation.
Potential price action could involve a bullish rebound off the 1st support level, followed by an advance towards the 1st resistance level.
The 1st support at 1.3439 is deemed significant as a historical level of buying interest, acting as a pullback support where buyers may step in to support the price.
Moreover, the 2nd support at 1.3396 is characterized as a pullback support, indicating its historical relevance as a level where buyers have intervened, adding further strength to the support zone.
On the resistance side, the intermediate resistance at 1.3531 is identified as a swing high resistance, suggesting its historical significance as a barrier to upward movement, potentially prompting a pullback or consolidation.
Additionally, the 1st resistance level at 1.3571 is recognized as a multi-swing high resistance, further validating its importance as a historical point where selling pressure has emerged, potentially limiting further upward movement.
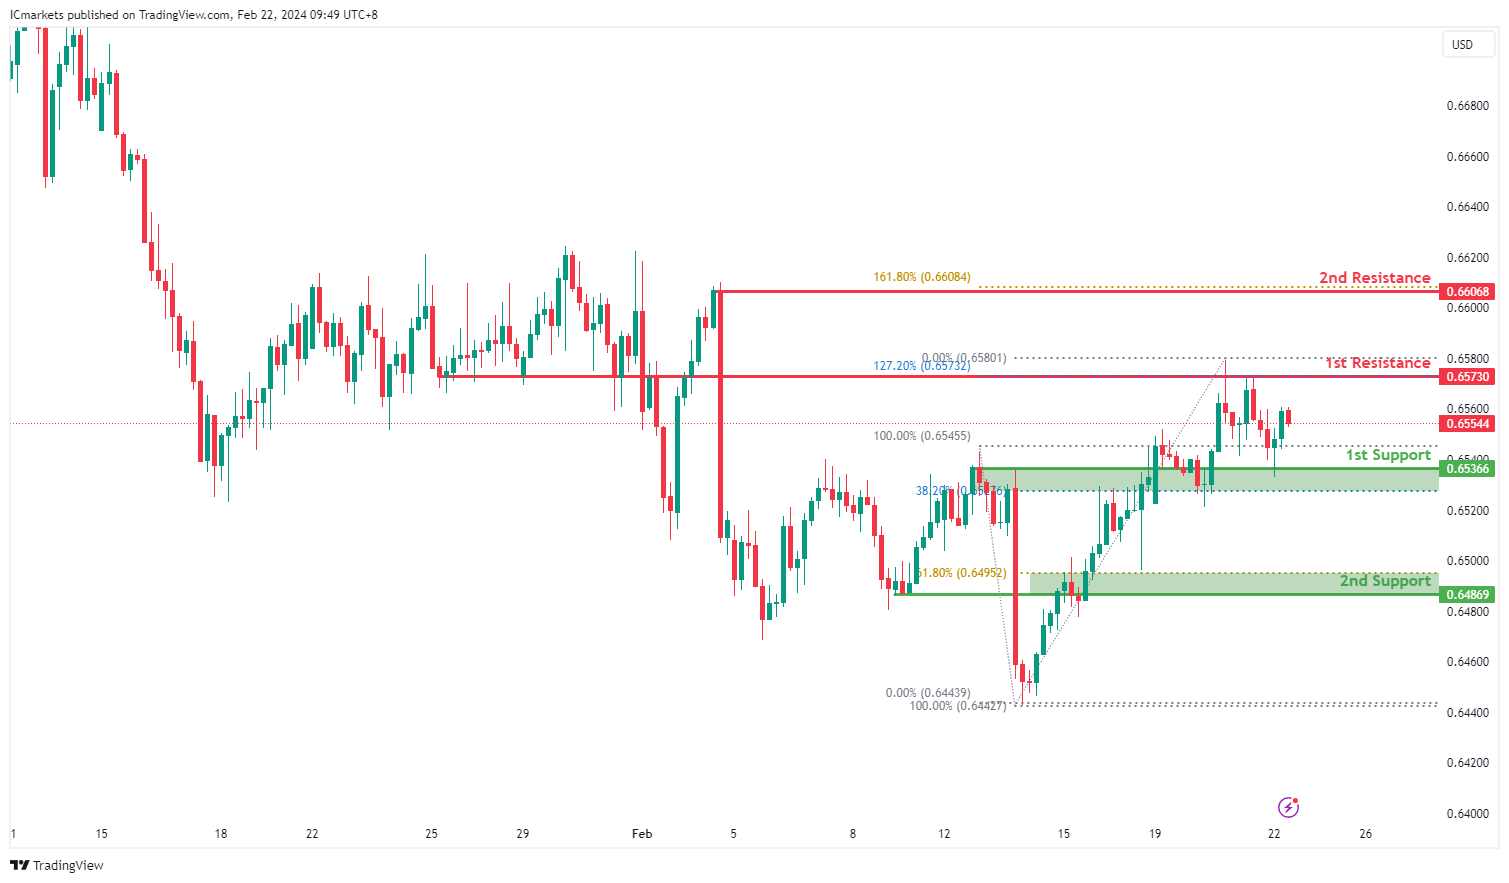
AUD/USD:
The AUD/USD chart currently indicates a bearish momentum, suggesting a potential continuation of the downtrend towards the 1st support level.
The 1st support at 0.6536 is identified as an overlap support, implying its historical significance as a level where buying interest has emerged in the past, potentially providing a floor for price action.
Additionally, the 2nd support at 0.6486 is characterized as an overlap support and aligns with the 61.80% Fibonacci Retracement level, further reinforcing its importance as a potential area of price support.
On the resistance side, the 1st resistance level at 0.6573 is recognized as an overlap resistance, indicating its historical significance as a barrier to upward movement, potentially attracting selling pressure.
Furthermore, the 2nd resistance at 0.6606 is noted as a swing high resistance and corresponds to the 161.80% Fibonacci Extension level, suggesting its importance as a potential area where selling interest may intensify.
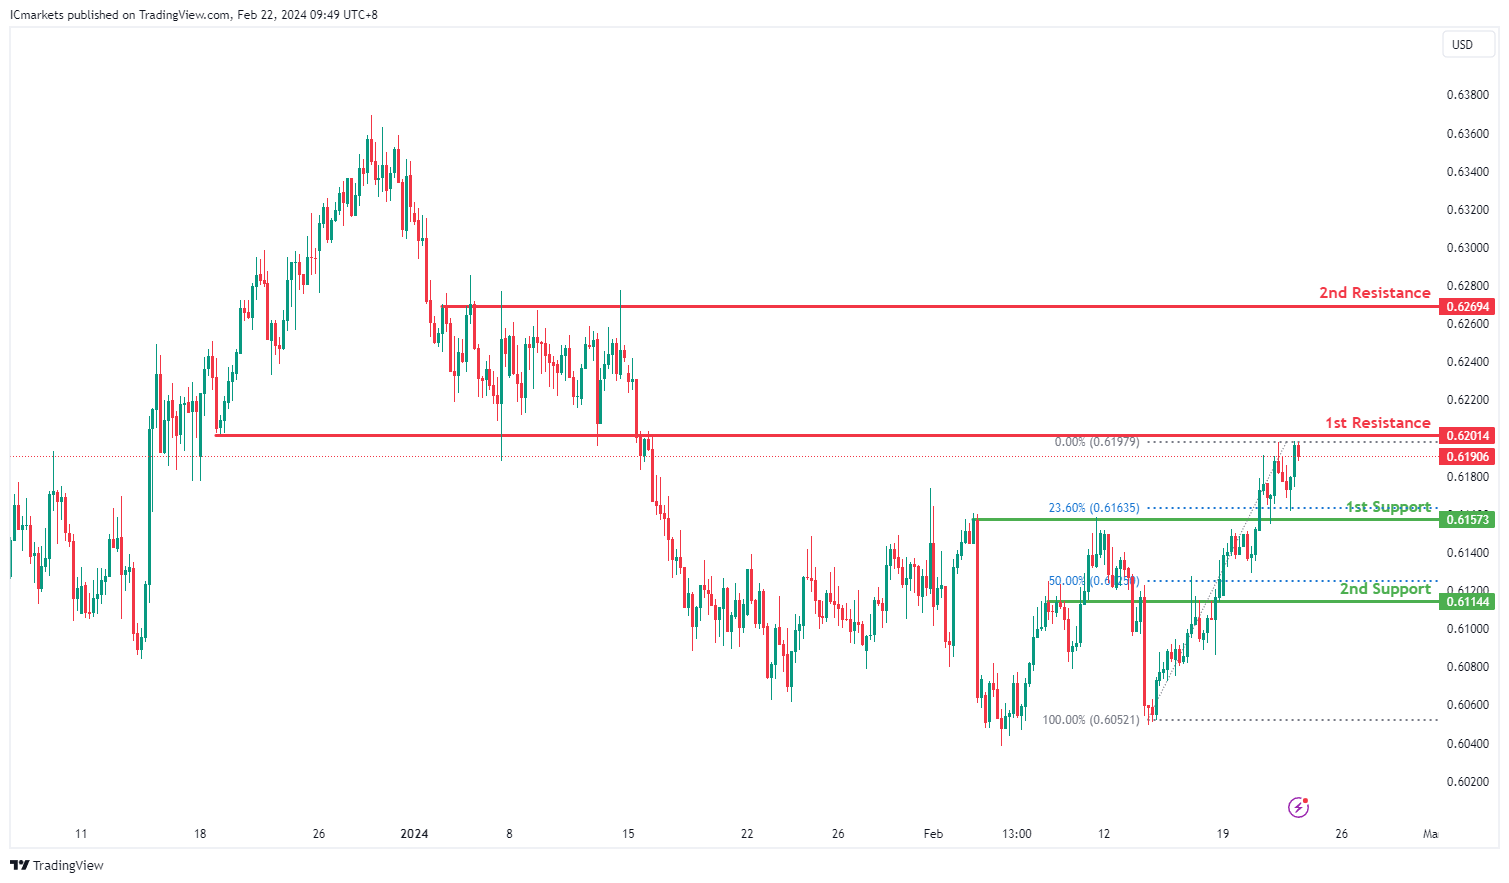
NZD/USD
The NZD/USD chart currently exhibits a bearish momentum, indicating a potential bearish reaction off the 1st resistance level followed by a drop towards the 1st support.
The 1st support at 0.6157 is identified as an overlap support, suggesting its historical significance as a level where buying interest has emerged in the past. Additionally, this support aligns with the 23.60% Fibonacci Retracement level, adding further confluence to its importance.
Furthermore, the 2nd support at 0.6114 is characterized as an overlap support and coincides with the 50% Fibonacci Retracement level, strengthening its role as a potential area of price support.
On the resistance side, the 1st resistance level at 0.6201 is recognized as an overlap resistance, indicating its historical significance as a barrier to upward movement. This level may attract selling pressure as traders seek to capitalize on potential reversals.
Additionally, the 2nd resistance at 0.6269 is noted as a multi-swing high resistance, further reinforcing its importance as a level where selling interest may intensify.
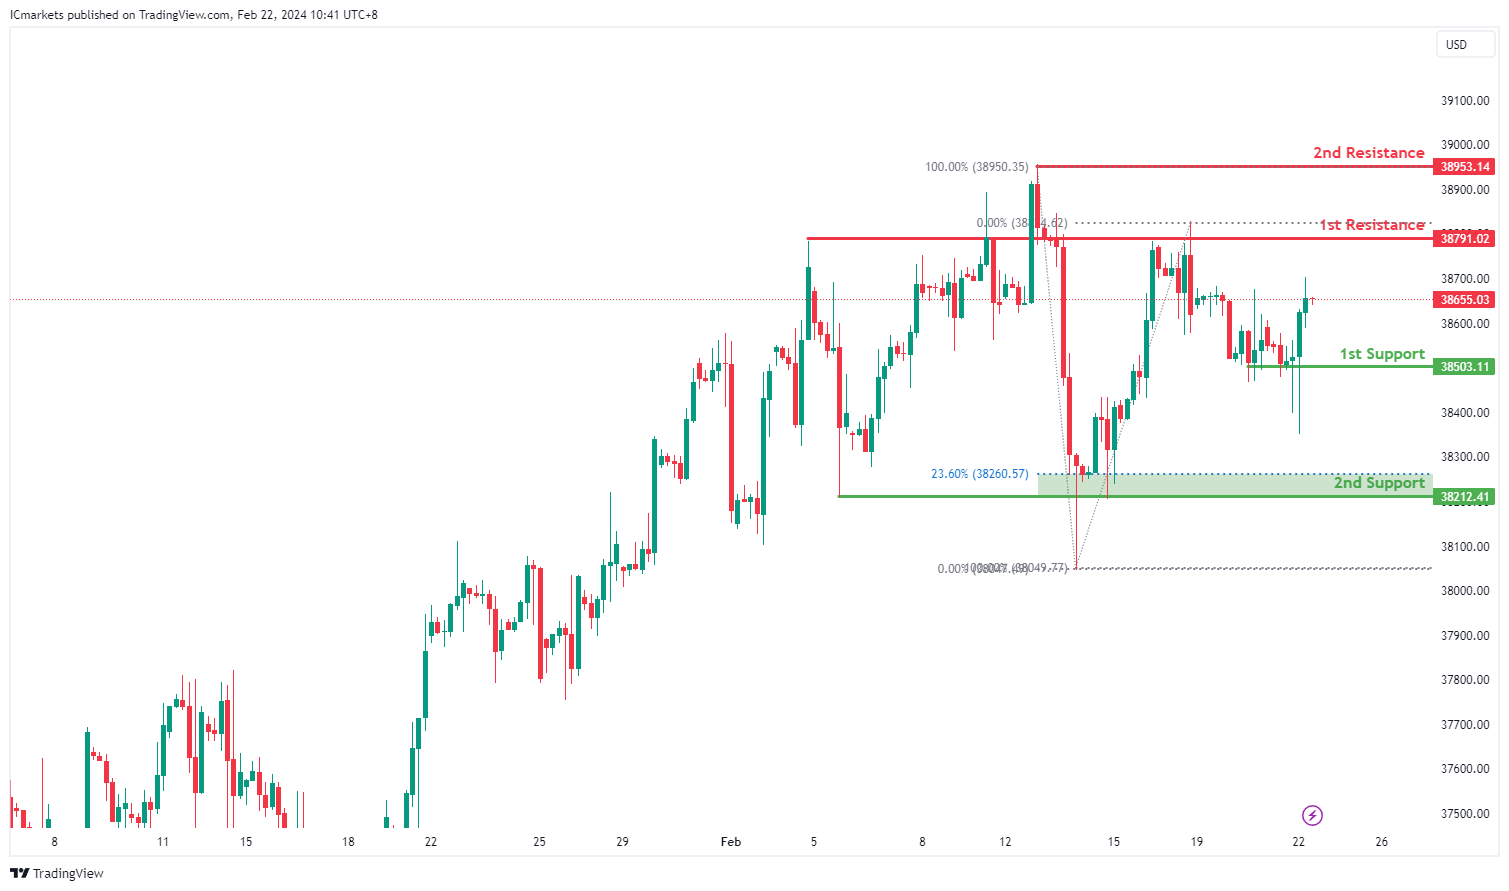
DJ30:
The DJ30 chart currently indicates bullish momentum, suggesting a potential continuation of the upward trend. There are several factors supporting the possibility of a bullish movement towards the 1st resistance level.
The 1st support at 38503.11 is a multi-swing low support, indicating a significant historical level where buying interest has previously emerged. Furthermore, the 2nd support at 38212.41 aligns with a multi-swing low support and the 23.60% Fibonacci Retracement level, providing additional reinforcement to its significance as a potential area of support.
On the resistance side, the 1st resistance level at 38791.02 is identified as an overlap resistance, suggesting a historical barrier where selling pressure may increase. Additionally, the 2nd resistance level at 38953.14 corresponds to a swing high resistance, further adding to its significance as a potential barrier to further bullish movement.
GER40:
The GER40 chart currently exhibits bullish momentum, indicating a potential continuation of the upward trend. Several factors contribute to this momentum, supporting the possibility of a bullish movement towards the 1st resistance level.
The 1st support at 17061.18 aligns with an overlap support, suggesting a significant historical level where buying interest has emerged. Additionally, the 2nd support at 16930.84 corresponds to a swing low support, further reinforcing its importance as a potential area of support.
On the resistance side, the 1st resistance level at 17219.01 is identified as a swing high resistance and coincides with the 127.20% Fibonacci Extension, suggesting a potential barrier where selling pressure may increase. Furthermore, the 2nd resistance level at 17309.34 aligns with a swing high resistance and the 161.80% Fibonacci Extension, adding to its significance as a potential barrier to further bullish movement.

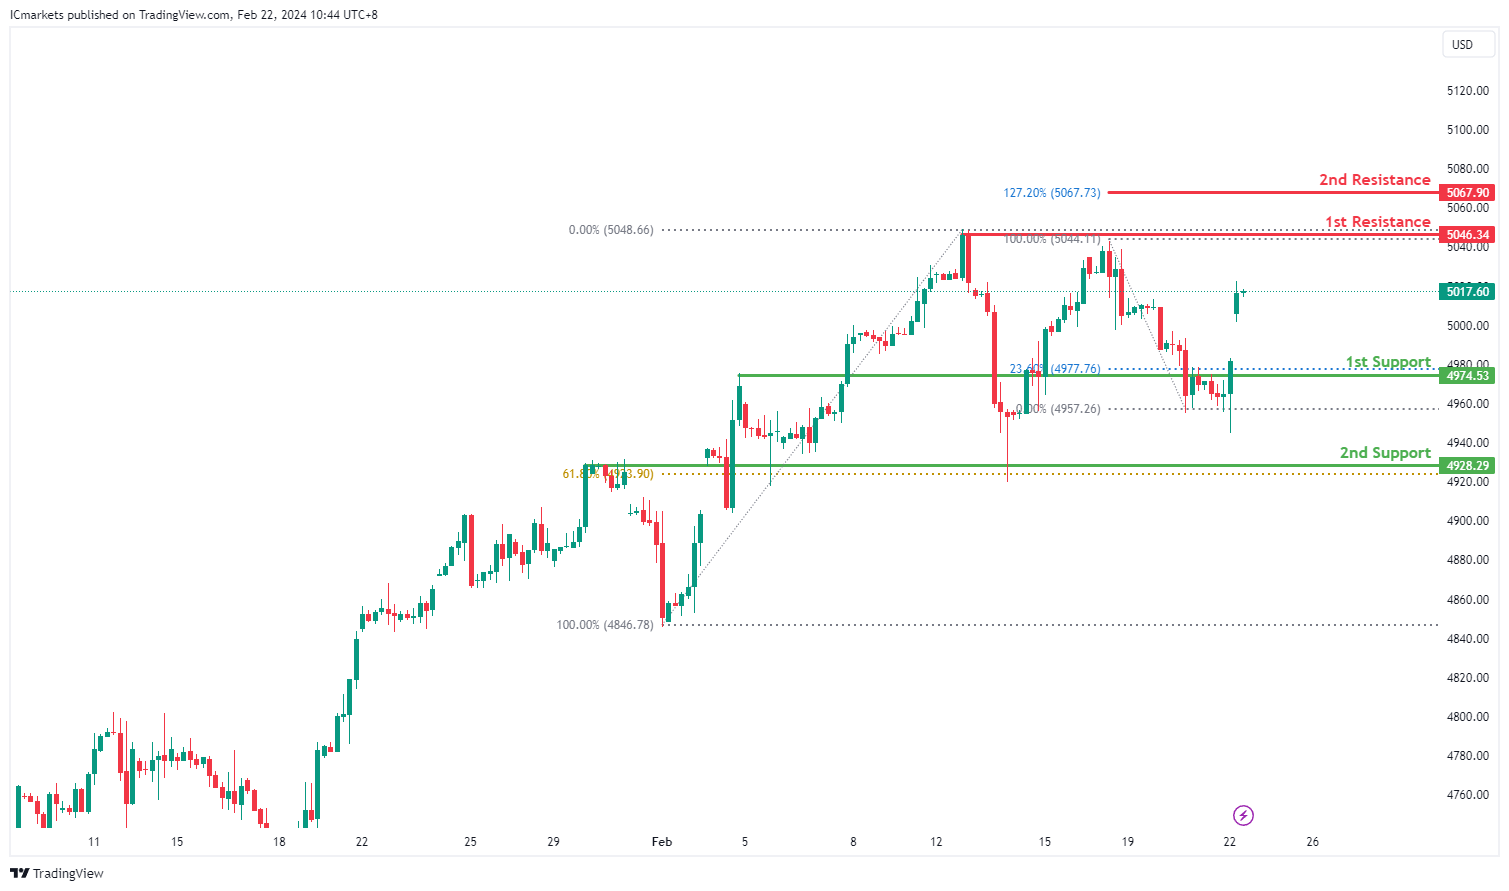
US500:
The US500 chart currently shows bullish momentum, suggesting a potential continuation of the upward trend. Several factors indicate the possibility of a bullish movement towards the 1st resistance level.
The 1st support at 4974.53 aligns with an overlap support and the 23.60% Fibonacci Retracement level, indicating a significant historical level where buying interest has emerged. Additionally, the 2nd support at 4928.29 corresponds to another overlap support and the 61.80% Fibonacci Retracement level, further reinforcing its importance as a potential area of support.
On the resistance side, the 1st resistance level at 5046.34 is identified as a swing high resistance, suggesting a potential barrier where selling pressure may increase. Furthermore, the 2nd resistance level at 5067.90 aligns with the 127.20% Fibonacci Extension, adding to its significance as a potential barrier to further bullish movement.
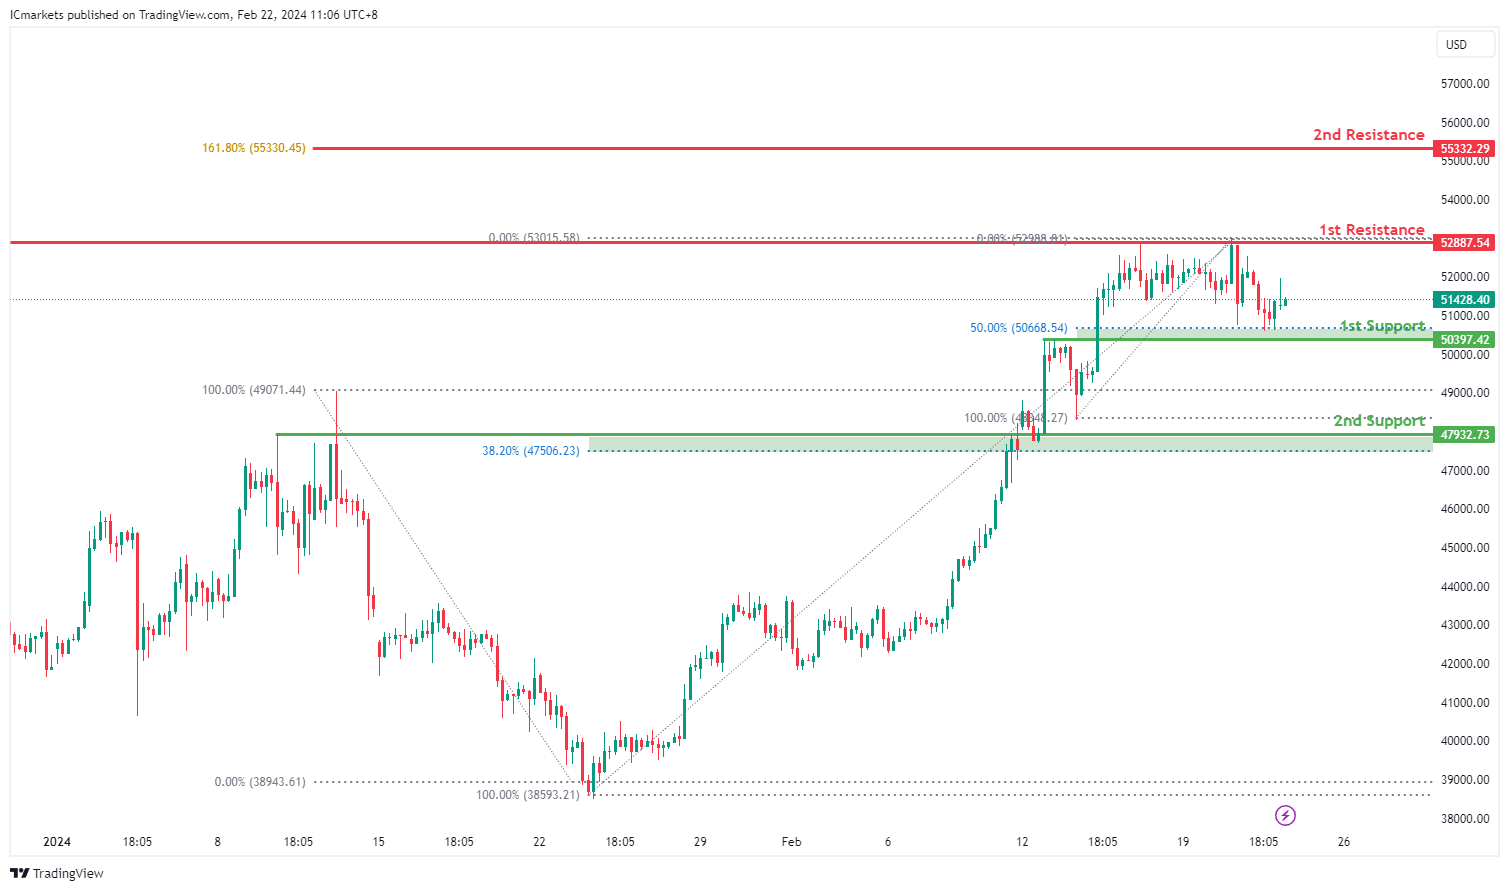
BTC/USD:
The BTC/USD chart currently demonstrates bullish momentum, suggesting a potential continuation of the upward trend. Several factors indicate the possibility of a bullish movement towards the 1st resistance level.
The 1st support at 50397.42 aligns with a pullback support and the 50% Fibonacci Retracement level, indicating a significant historical level where buying interest has emerged. Furthermore, the 2nd support at 47932.73 corresponds to an overlap support and the 38.20% Fibonacci Retracement level, further reinforcing its importance as a potential area of support.
On the resistance side, the 1st resistance level at 52887.54 is identified as a multi-swing high resistance, suggesting a potential barrier where selling pressure may increase. Additionally, the 2nd resistance level at 55332.29 aligns with the 161.80% Fibonacci Extension, adding to its significance as a potential barrier to further bullish movement.
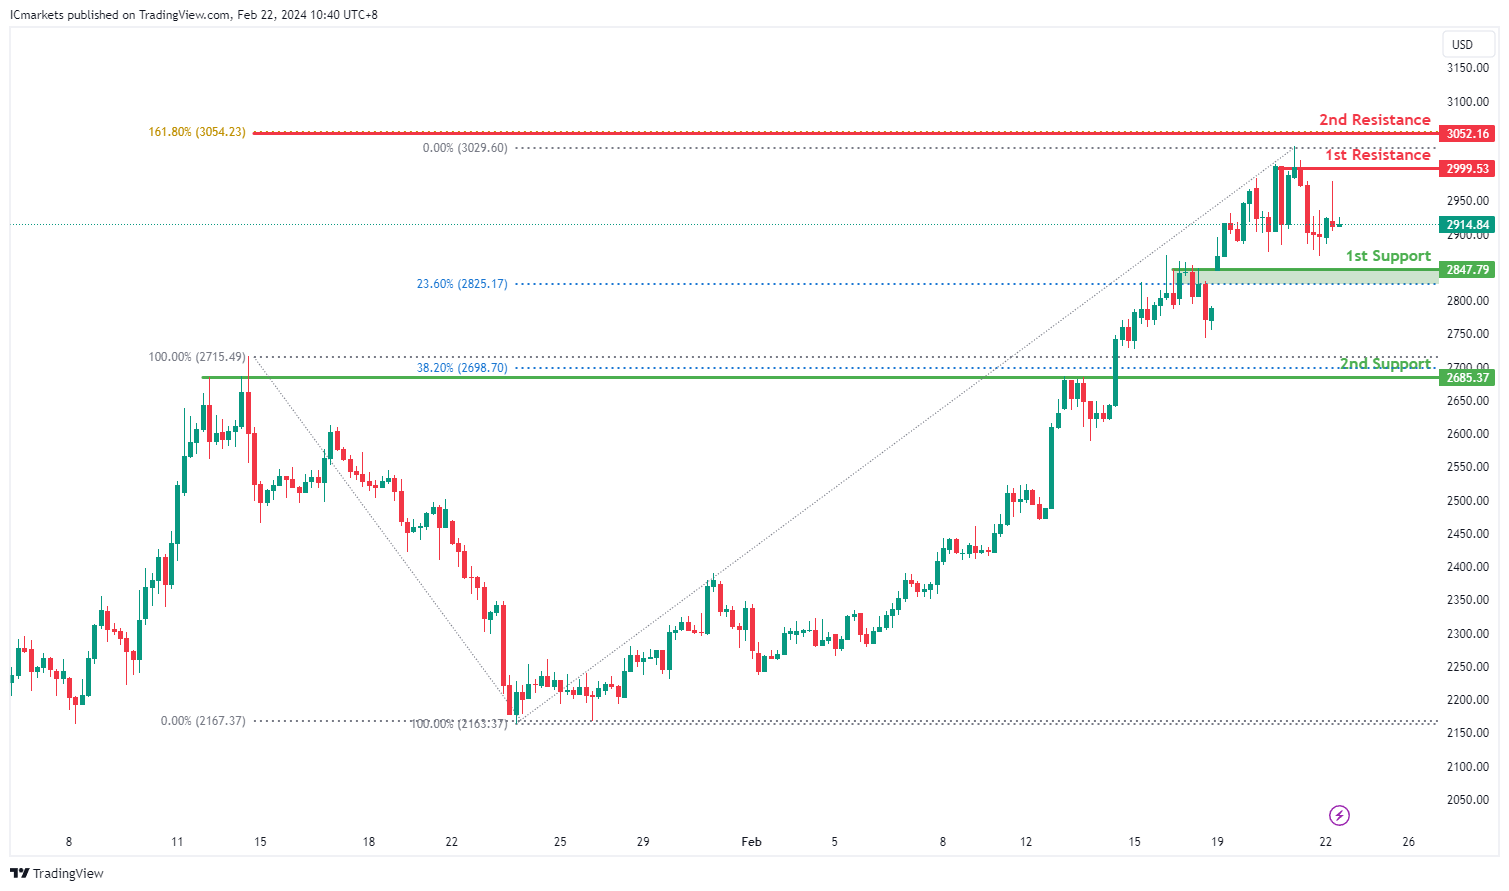
ETH/USD:
The ETH/USD chart currently indicates bullish momentum, suggesting a potential continuation of the upward trend. There are indications that the price might experience a short-term drop to the 1st support level before rebounding and ascending towards the 1st resistance level.
The 1st support at 2847.79 is supported by an overlap support and coincides with the 23.60% Fibonacci Retracement level, marking a significant historical level where buying interest has previously emerged. Additionally, the 2nd support at 2685.37 aligns with a pullback support and the 38.20% Fibonacci Retracement level, further reinforcing its potential as a support zone.
On the resistance side, the 1st resistance level at 2999.53 is identified as a multi-swing high resistance, suggesting a level where selling pressure may intensify. Moreover, the 2nd resistance level at 3052.16 corresponds to the 161.80% Fibonacci Extension, indicating a potential barrier to further bullish movement.
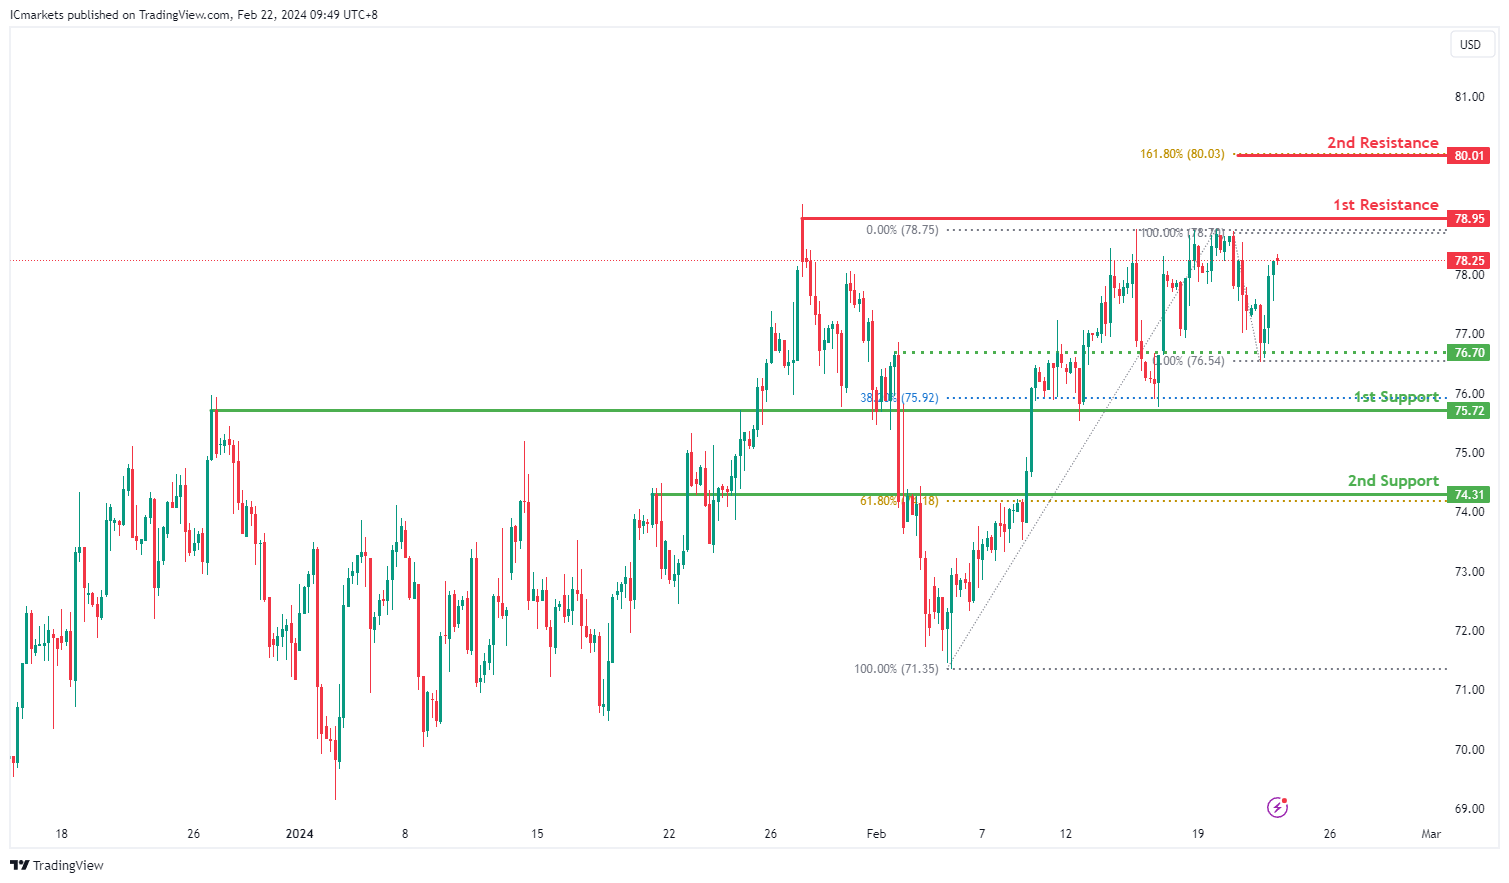
WTI/USD:
The WTI (West Texas Intermediate) chart currently reflects a bearish momentum, suggesting a potential bearish reaction off the 1st resistance level followed by a drop towards the 1st support.
The 1st support at 75.72 is identified as an overlap support and coincides with the 38.20% Fibonacci Retracement level, indicating its significance as a historical level where buying interest has previously emerged.
Furthermore, the 2nd support at 74.31 is characterized as a pullback support and aligns with the 61.80% Fibonacci Retracement level, further reinforcing its potential importance as a level where buyers may enter the market.
On the resistance side, the 1st resistance level at 78.95 is recognized as a swing high resistance, suggesting its historical significance as a barrier to upward movement. This level may attract selling pressure as traders look to capitalize on potential reversals.
Additionally, the 2nd resistance at 80.01 is noted as a significant level, as it corresponds to the 161.80% Fibonacci Extension, indicating potential strong resistance to further price appreciation.
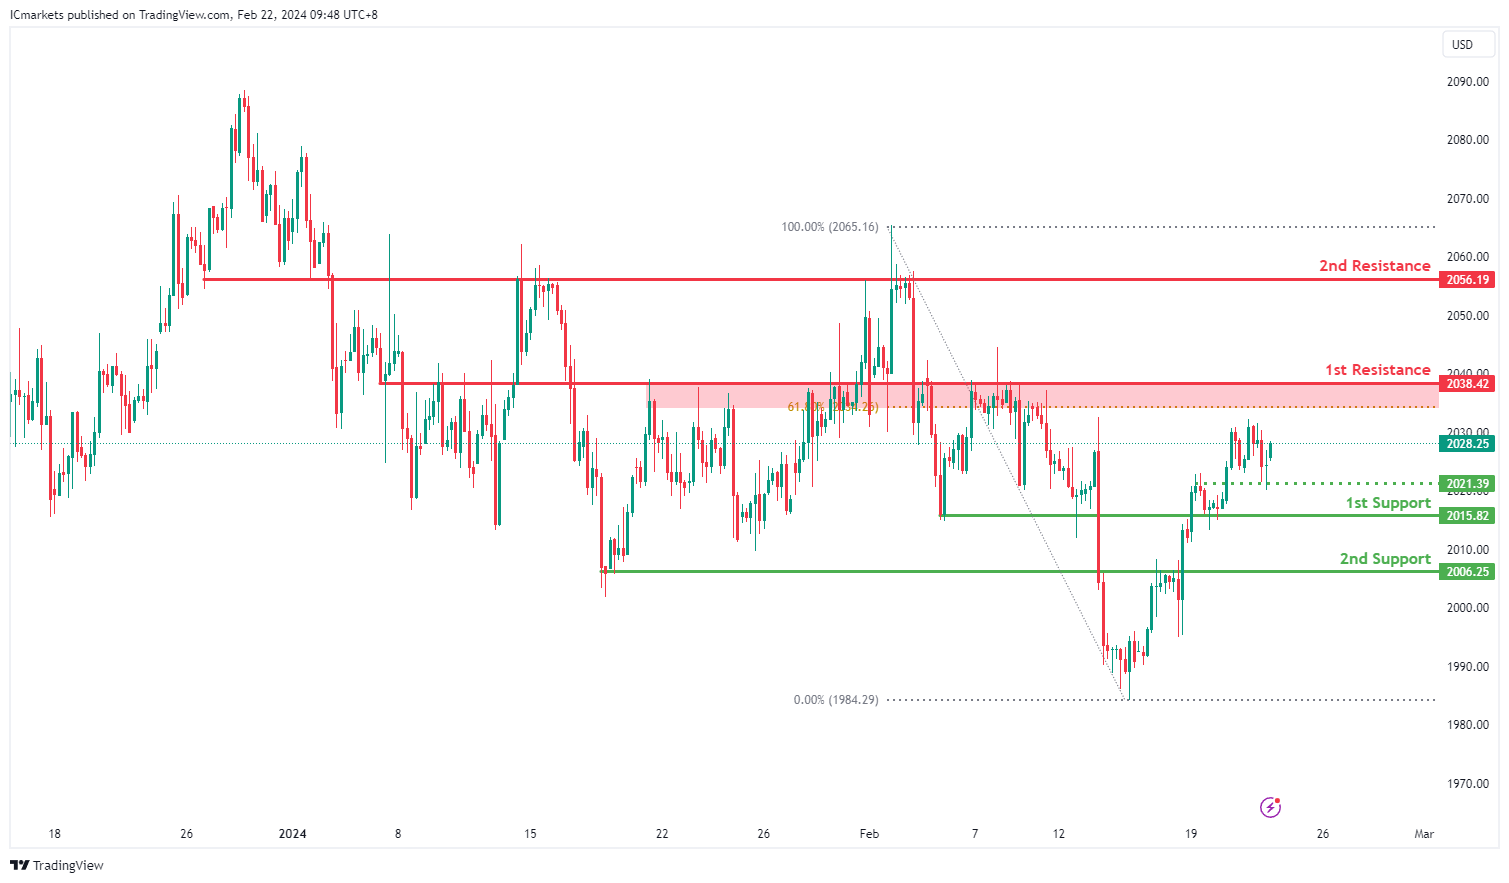
XAU/USD (GOLD):
The XAUUSD (Gold/US Dollar) chart currently indicates a bearish momentum, suggesting a potential bearish reaction off the 1st resistance level followed by a drop towards the 1st support.
The 1st support at 2015.82 is identified as an overlap support, indicating its historical significance as a level where buying interest has previously emerged. This level may attract buyers looking to enter the market or defend existing long positions.
Additionally, the 2nd support at 2006.25 is characterized as a pullback support, suggesting its importance as a level where buyers may intervene to support the price after a retracement. This level aligns with the overall bearish sentiment on the chart.
On the resistance side, the 1st resistance level at 2038.42 is recognized as an overlap resistance and coincides with the 61.80% Fibonacci Retracement level. This level may attract selling interest as traders look to capitalize on potential reversals or profit-taking opportunities.
Furthermore, the 2nd resistance at 2056.19 is identified as another overlap resistance, indicating its historical significance as a level where selling pressure has been observed. This level may act as a barrier to further upward movement.
An intermediate support level at 2021.39 is also identified, aligning with an overlap support. This level could provide additional support to the price if tested, potentially influencing price action in the short term.
Japan’s PMI composite drops to 50.3, from recovery to stagnation
Japan's PMI Manufacturing dipped further to 47.2 from 48.0, marking the ninth consecutive month of sector contraction and hitting the lowest point since August 2020. PMI Services also declined, albeit more moderate, falling from 53.1 to 52.5. Consequently, Composite PMI, which combines both manufacturing and service sectors, decreased from 51.5 to a near-stagnation point of 50.3.
Usamah Bhatti, Economist at S&P Global Market Intelligence, commented on the recent data, noting that the slight improvement observed at the beginning of the year has "all but evaporate[d]" in February. He described the month's growth as "only fractional," attributing it to "softer upturn in services activity" that was insufficient to counterbalance the "steepest contraction in manufacturing output for a year."
Crude Oil Price Fails Again at $78.80, Are Dips Supported?
Key Highlights
- Crude oil prices failed again to clear the $78.80 and $79.20 levels.
- It traded below a major bullish trend line with support at $77.65 on the 4-hour chart.
- Gold prices could gain bullish momentum above $2,032.
- The US Manufacturing PMI could remain stable at 50.5 in Feb 2024 (Preliminary).
Crude Oil Price Technical Analysis
In the past few days, Crude oil prices saw a strong increase above the $75.00 level. The price climbed above $76.50 to move into a positive zone.
Looking at the 4-hour chart of XTI/USD, the price settled above the $76.50 zone, the 200 simple moving average (green, 4-hour), and the 100 simple moving average (red, 4-hour).
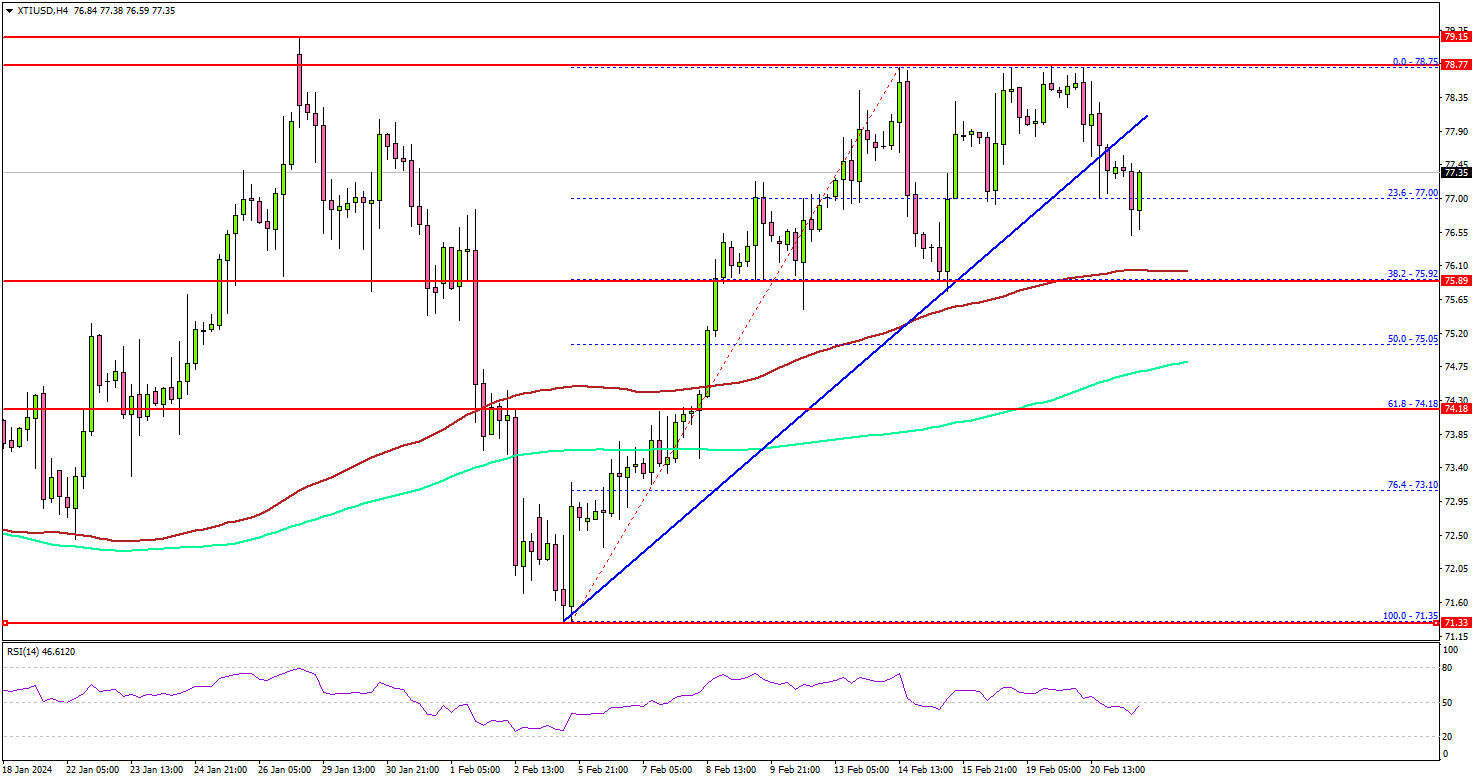
Finally, the price climbed above the $78.00 level. However, the bears were again active near the $78.80 and $79.00 levels. A high was formed at $78.75 and the price reacted to the downside. There was a break below the $78.00 support.
Besides, the price traded below a major bullish trend line with support at $77.65 on the same chart. The first major support on the downside is near the $76.00 level or the 100 simple moving average (red, 4-hour).
The 38.2% Fib retracement level of the upward move from the $71.35 swing low to the $78.75 high is also near the $76.00 zone. The next major support is at $74.20, below which the price might test $73.10. Any more losses might send oil prices toward $71.80.
On the upside, the price is facing hurdles near the $78.40 level. The next major resistance is near the $78.80 zone, above which the price may perhaps accelerate higher. In the stated case, it could even visit the $80.00 resistance.
Looking at gold prices, the bulls are aiming for a recovery wave above the $2,035 and $2,040 resistance levels.
Economic Releases to Watch Today
Germany’s Manufacturing PMI for Feb 2024 (Preliminary) - Forecast 46.1, versus 45.5 previous.
Germany’s Services PMI for Feb 2024 (Preliminary) - Forecast 48.0, versus 47.7 previous.
Euro Zone Manufacturing PMI for Feb 2024 (Preliminary) – Forecast 47.0, versus 46.6 previous.
Euro Zone Services PMI for Feb 2024 (Preliminary) – Forecast 48.8, versus 48.4 previous.
US Manufacturing PMI for Feb 2024 (Preliminary) – Forecast 50.5, versus 50.7 previous.
US Services PMI for Feb 2024 (Preliminary) – Forecast 52.0, versus 52.5 previous.
Australia’s Composite PMI climbs to 51.8, diminishing prospects for near-term RBA rate cut
Australia's PMI Manufacturing fell sharply from 50.1 to 47.7 in February, with Manufacturing Output marking a 45-month low at 45.0. In stark contrast, PMI Services surged to a 10-month high of 52.8, propelling Composite PMI to 51.8, the first time it has breached the 50-mark threshold since last June.
Warren Hogan, Chief Economic Advisor at Judo Bank, said the PMI results "weaken the case for monetary policy easing any time soon". Improvement in activity indicators and modest rise in price indexes suggest that "risks to monetary policy remain even balanced".
Hogan's analysis also points to an economy that is gaining momentum, expanding at more vigorous pace in 2024 compared to the latter half of 2023. He posits that continuous improvements could herald stronger economic growth this year than the last, hinting that "soft landing is behind us".
Furthermore, Composite Employment Index reached its highest level since last September, indicating "rising labour demand and employment growth" in the overall economy. This is accompanied by intensifying price pressures, with Composite Output Price Index's climb to its highest point since last September 2023, indicating that domestic inflation could be hovering between 4% and 5%. Hogan cautions that the recent trend of disinflation "may well have run its course."