
Sample Category Title
Crypto Market Growth Halted Amid Capital Inflows
Market picture
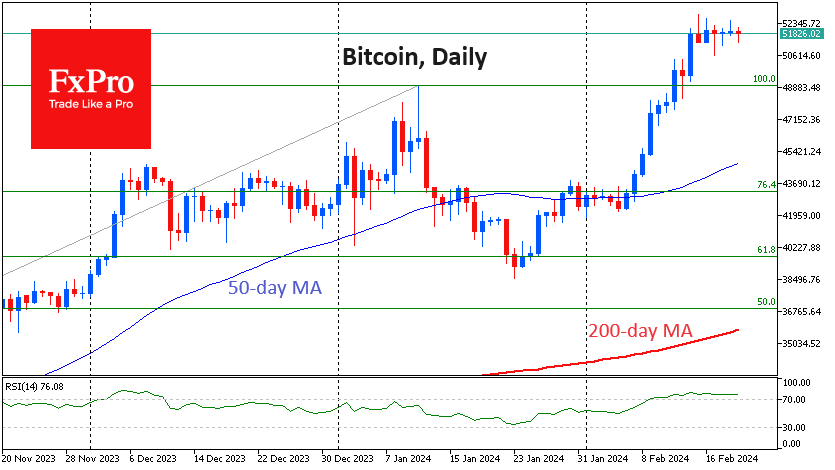
The crypto market has corrected 0.46% in the last 24 hours, fluctuating within a narrow range without a clear direction. Bitcoin is down 1% but up 3.7% over seven days, Ethereum is flat for the day but up 10.6% over the week. The top coins are mixed with BNB +2% and Solana -2.5%.
Bitcoin is currently drawing its fourth daily candle with opening and closing levels close to each other. Such sideways consolidations are characteristic of strong bull markets, as opposed to corrective pullbacks on smoother rallies.
Ethereum hit local highs on rumours of a positive regulatory decision before the end of March. Bloomberg analyst James Seyffarth bet 4 ETH that the SEC will not approve a spot Ethereum ETF next month.
According to data from CoinShares, investment in crypto funds rose by a record $2.452 billion last week, following inflows of $1.116 billion the previous week. Bitcoin investments increased by $2.424 billion, Ethereum by $21 million, Cardano lost $6 million, and Solana lost $1.6 million.
Since the beginning of the year, crypto funds have seen inflows of an impressive $5.2 billion, with total AUM rising to $67 billion, the highest since December 2021.
News background
Bitcoin will see institutional support in the next three to six months, according to Coinbase. Bitcoin ETFs could eventually become a major competitor to gold funds.
According to IntoTheBlock, there is an 85% chance that Bitcoin will reach a new all-time high within the next six months. Five factors could contribute to this: the halving of the price, ETFs, monetary easing, the US election, and companies accumulating BTC as part of their treasuries.
Former CIA contractor Edward Snowden, who has been living in Russia since 2013, called bitcoin the most significant achievement of the financial system in the entire existence of money and means of exchange.
Amberdata admitted that Ethereum will outpace Bitcoin in terms of growth due to more constructive deflationary policies. The supply of ETH has been decreasing since September 2022, thanks to the update of The Merge, as well as the implementation of a mechanism to burn part of the commissions. During this time, around 0.36 million ETH, or 0.3% of the total supply of 120 million coins, have been removed from circulation.
Bearish Yields Could Send US Dollar Lower
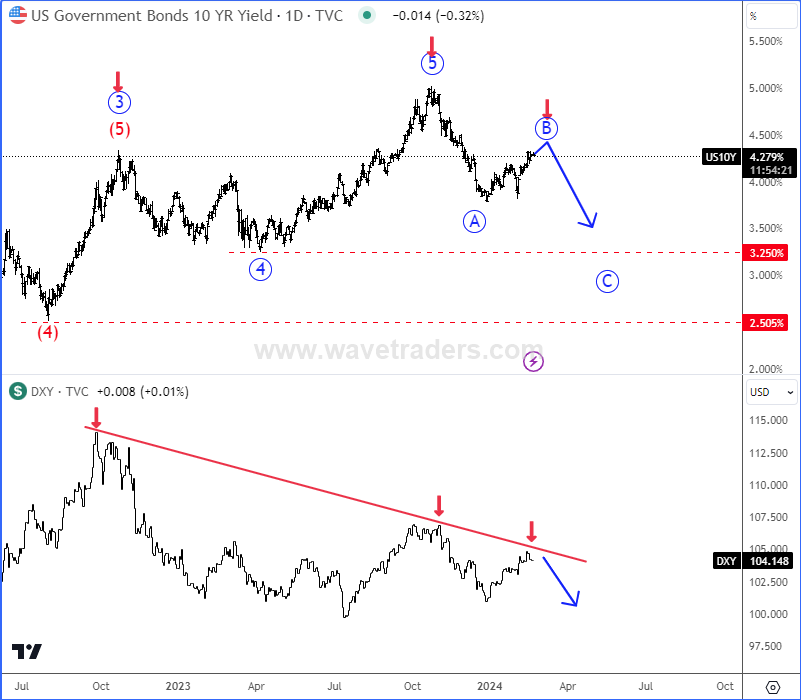
US Yields have topped back in October 2023 with sharp leg down, which is from Elliott wave perspective first leg A of a deeper A-B-C decline that can send the price back to the former wave 4 area to 3.25% - 2.5%.
At the same time, we can see US dollar Index - DXY also turning down due to a positive correlation with Yields, we just saw some divergence in 2023.
https://www.youtube.com/watch?v=1Z9PiQG6auc
EURJPY on the Rise Above 162.00, But for How Long?
- EURJPY posts new 3-month high
- Momentum indicators are gaining ground
- Positive structure remains intact above short- and long-term diagonal lines
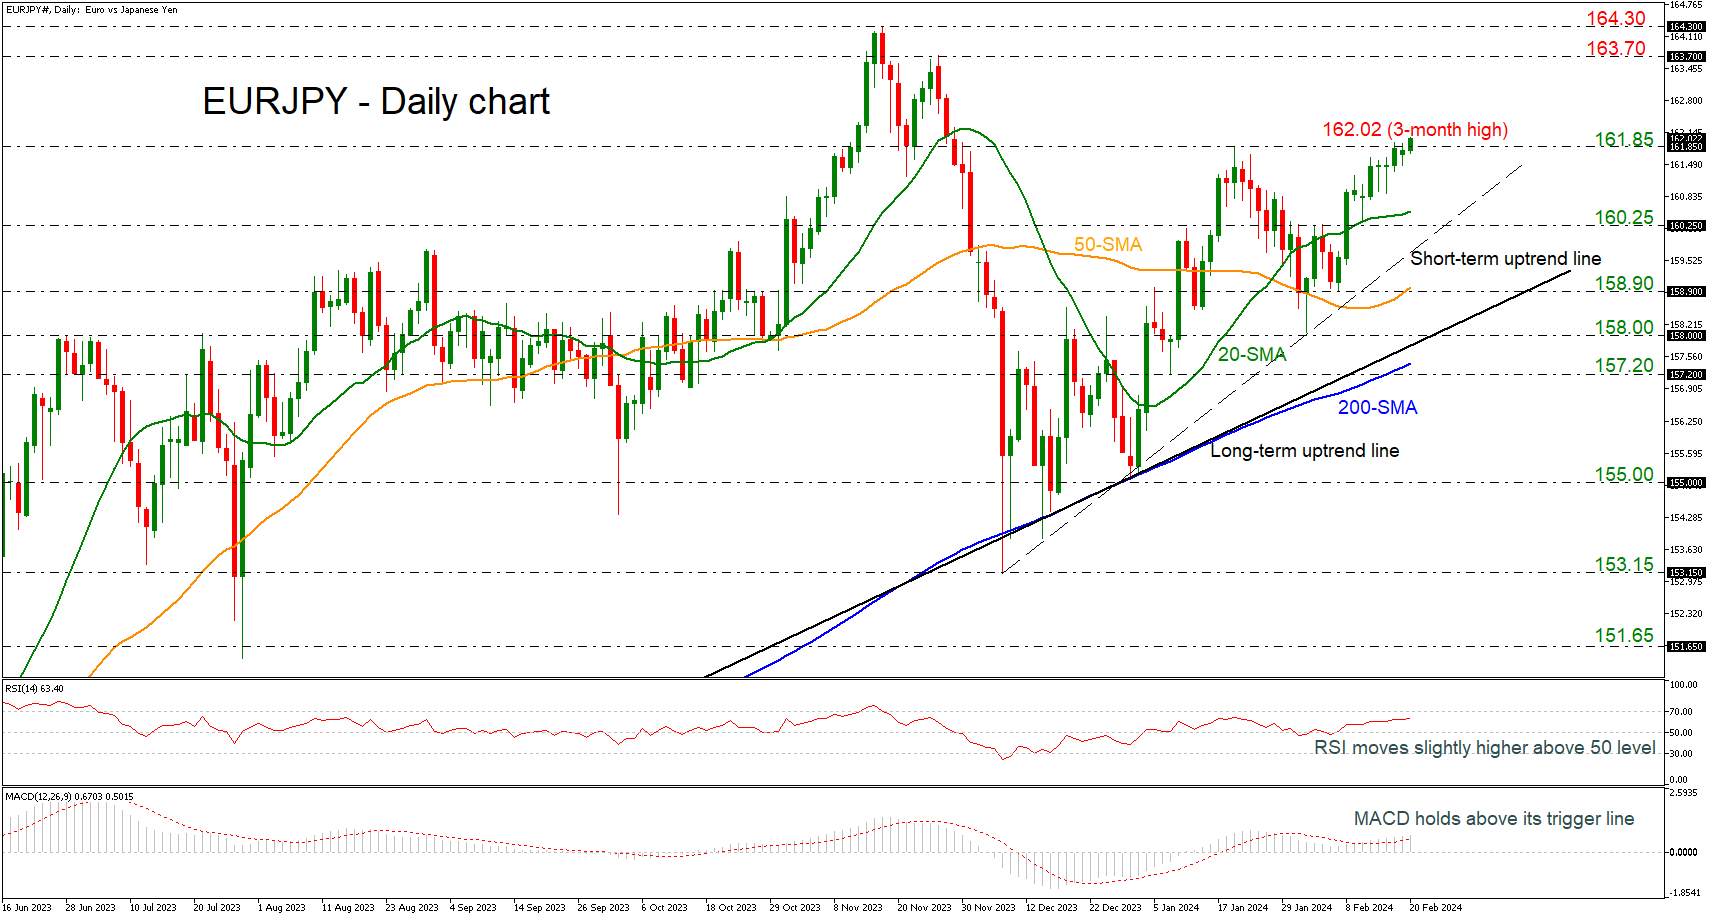
EURJPY is skyrocketing above the 162.00 round number, recording a fresh three-month high. The market is completing a strong bullish rally after the bounce off the 158.90 support level, posting the tenth consecutive green day.
To attract new buyers, the bulls will have to surpass today’s high and move beyond the 163.70 resistance level, taken from the peak on November 27. Another successful battle there could see the price jumping into the 164.30 barricade, registered on November 16.
Technically, the RSI indicator is trying to strengthen its positive momentum above the neutral threshold of 50, approaching the 70 level, while the MACD is extending its move above its trigger and zero lines.
Hence, a downside correction could still be possible in the coming sessions. If the pair slumps below the 20-day simple moving average (SMA) at 160.50 and the 160.25 support level, it could stabilize near the short-term ascending trend line at 159.90. Otherwise, the sell-off could expand towards the 50-day SMA at 158.90. Yet only a clear close below the long-term uptrend line of around 158.00 would disappoint medium-term traders.
Summing up, EURJPY is looking strongly bullish in the short- and long-term timeframes. To boost buying confidence, the pair will need to have a closing day above 161.85.
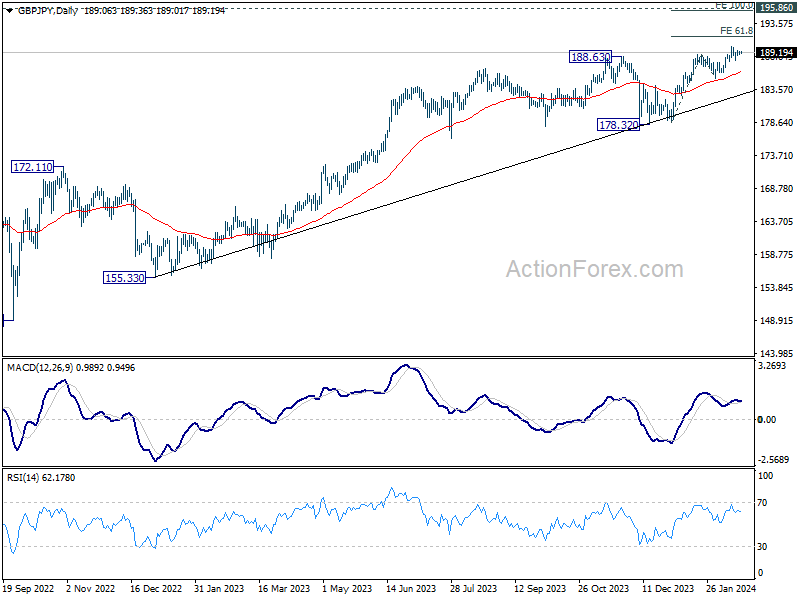
GBP/JPY Daily Outlook
Daily Pivots: (S1) 188.88; (P) 189.17; (R1) 189.44; More...
GBP/JPY is still extending range trading below 190.05 and intraday bias remains neutral. Further rally is expected with 187.83 minor support intact. Break of 190.05 will target 61.8% projection of 178.71 to 188.90 from 185.21 at 191.50. However, break of 187.83 will turn bias to the downside for deeper correction back to 185.21 support instead.
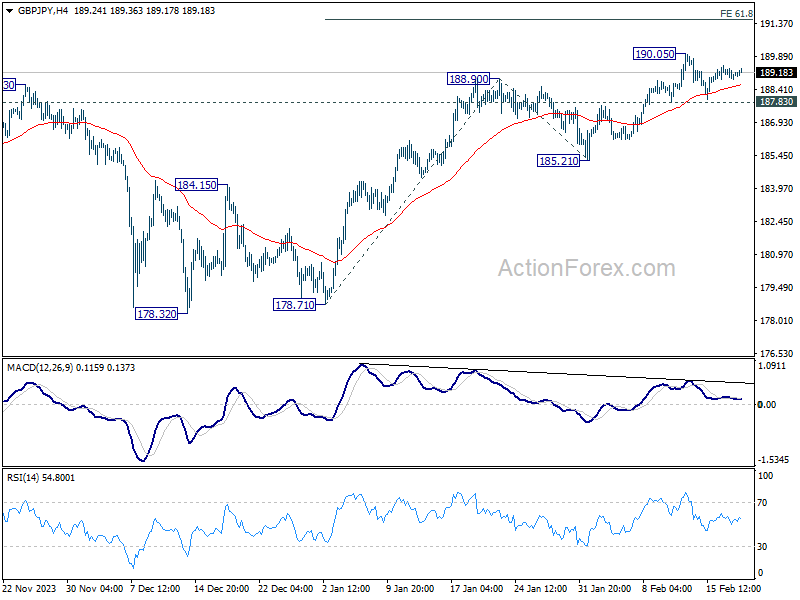
In the bigger picture, up trend from 123.94 (2020 low) in in progress. Medium term outlook will stay bullish as long as 178.32 support holds. Next target is 195.86 long term resistance (2015 high).
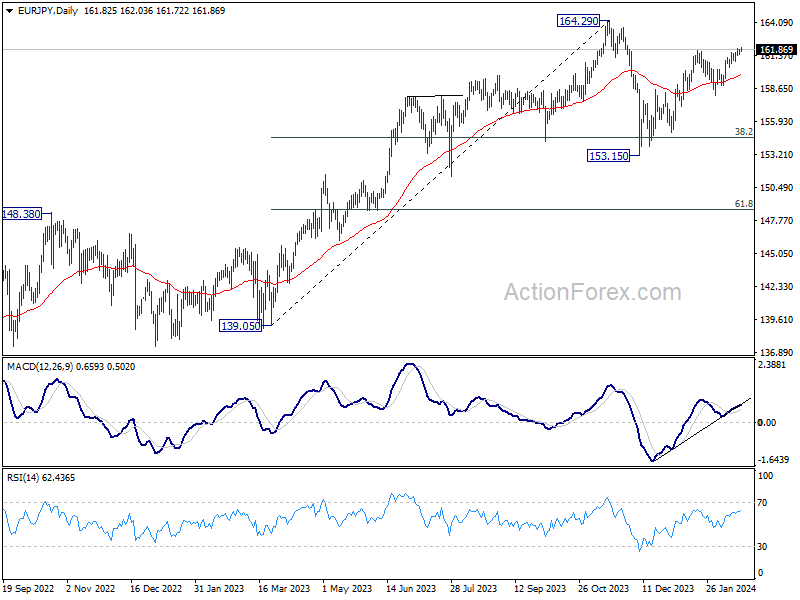
EUR/JPY Daily Outlook
Daily Pivots: (S1) 161.54; (P) 161.77; (R1) 162.05; More...
EUR/JPY's rally is in progress even though upside momentum is not too convincing. Intraday bias stays on the upside. Rise from 153.15 should target a retest on 164.29 high. On the downside, however, below 161.46 minor support will turn intraday bias neutral first.
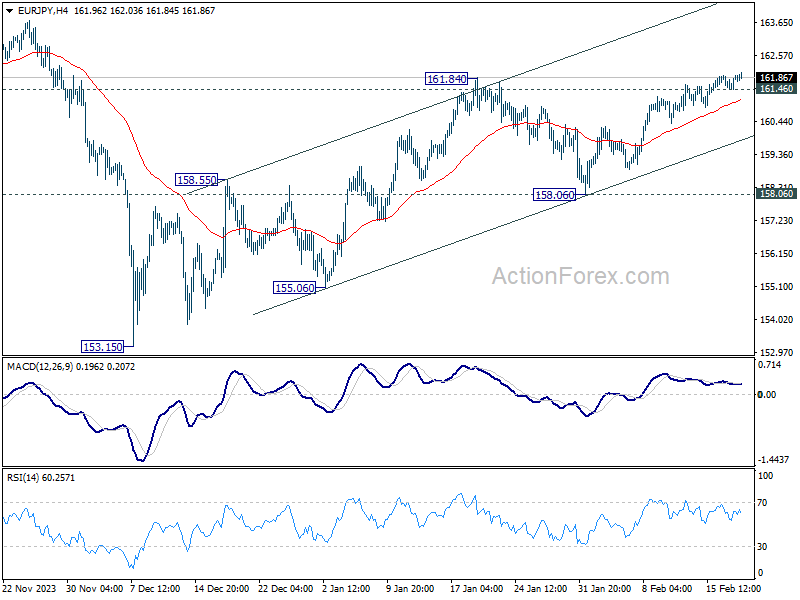
In the bigger picture, price actions from 164.29 medium term top are seen as a correction to rise from 139.05 only. As long as 148.38 resistance turned support holds (2022 high), larger up trend from 114.42 (2020 low) is expected to resume through 164.29 at a later stage. Next target would be 169.96 (2008 high).
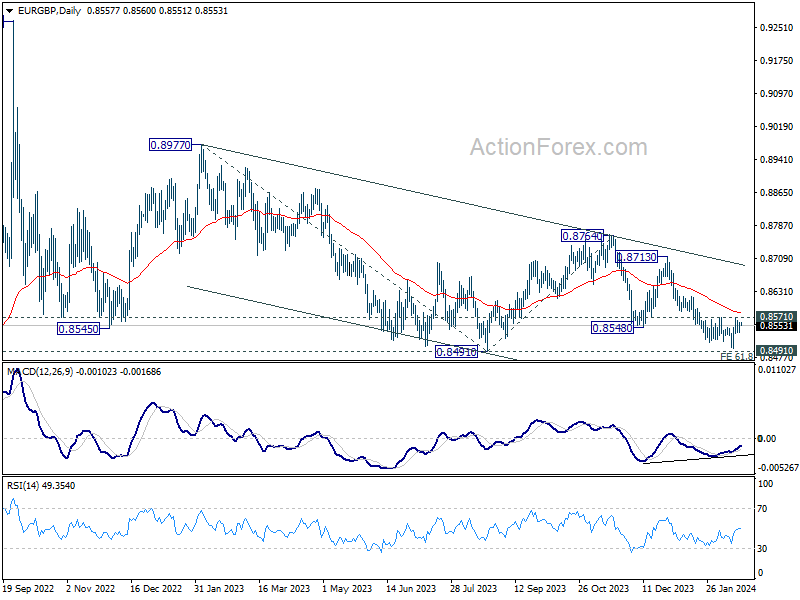
EUR/GBP Daily Outlook
Daily Pivots: (S1) 0.8543; (P) 0.8552; (R1) 0.8565; More...
No change in EUR/GBP and intraday bias remains neutral for the moment. On the downside, break of 0.8497 will resume recent fall to 0.8464 projection level. However, considering bullish convergence condition in 4H MACD, sustained break of 0.8571 will confirm short term bottoming, and turn bias back to the upside for stronger rebound.
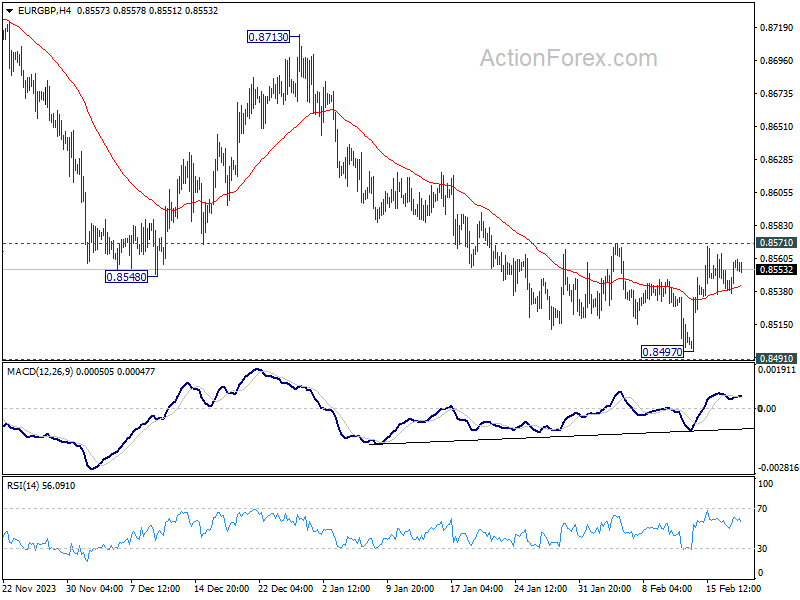
In the bigger picture, fall from 0.8764 is seen as another leg in the whole down trend from 0.9267 (2022 high). Outlook will stay bearish as long as 0.8713 resistance holds. Break of 0.8491 will target 61.8% projection of 0.8977 to 0.8491 from 0.8764 at 0.8464.
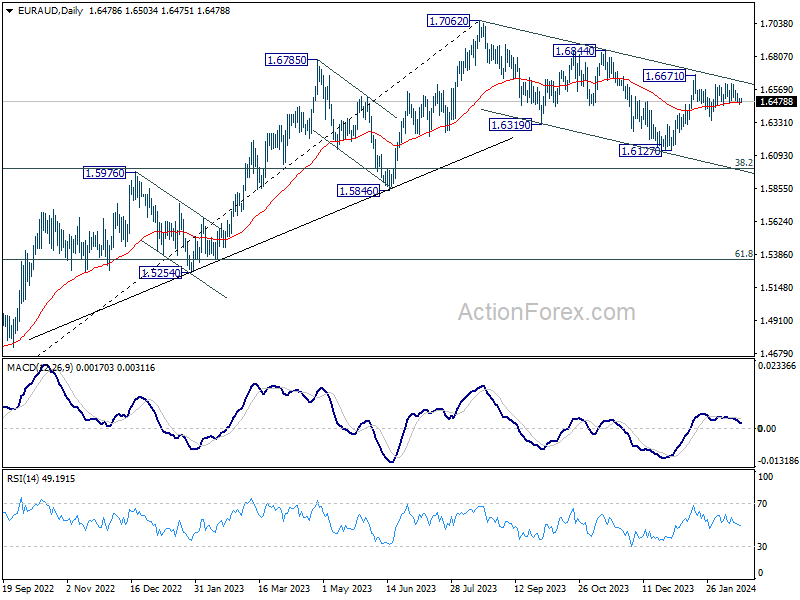
EUR/AUD Daily Outlook
Daily Pivots: (S1) 1.6458; (P) 1.6484; (R1) 1.6509; More...
Outlook in EUR/AUD is unchanged as range trading continues. Intraday bias stays neutral for the moment. On the upside, decisive break of 1.6671 will revive the case that whole correction from 1.7062 has completed with three waves down to 1.6127. Further rally should then be seen to 1.6844 resistance for confirmation. Nevertheless, below 1.6455 minor support will turn bias to the downside for 1.6348 and possibly below.
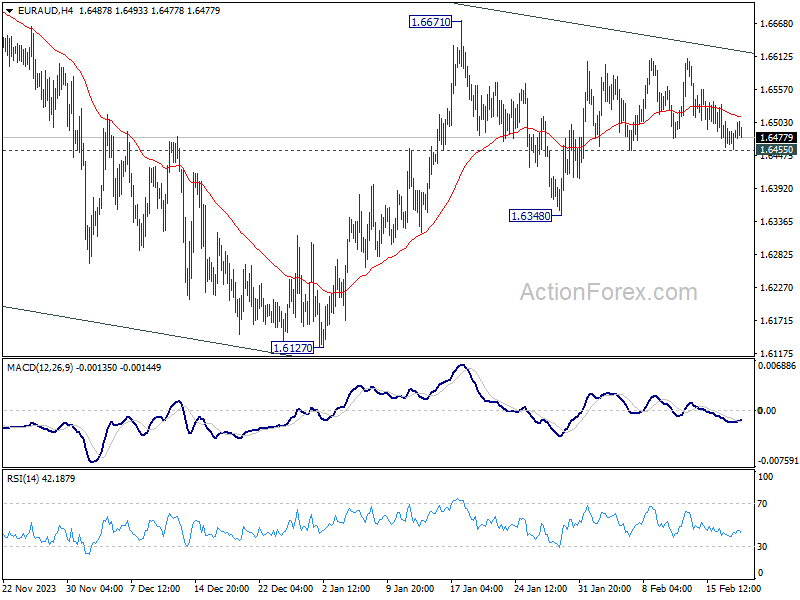
In the bigger picture, fall from 1.7062 medium term top is seen as a correction to the up trend from 1.4281 (2022 low). Break of 1.6844 resistance will argue that this up trend is ready to resume through 1.7062 high. In case of another fall, strong support should be seen around 1.5846 and 38.2% retracement of 1.4281 to 1.7062 at 1.6000 to bring rebound.
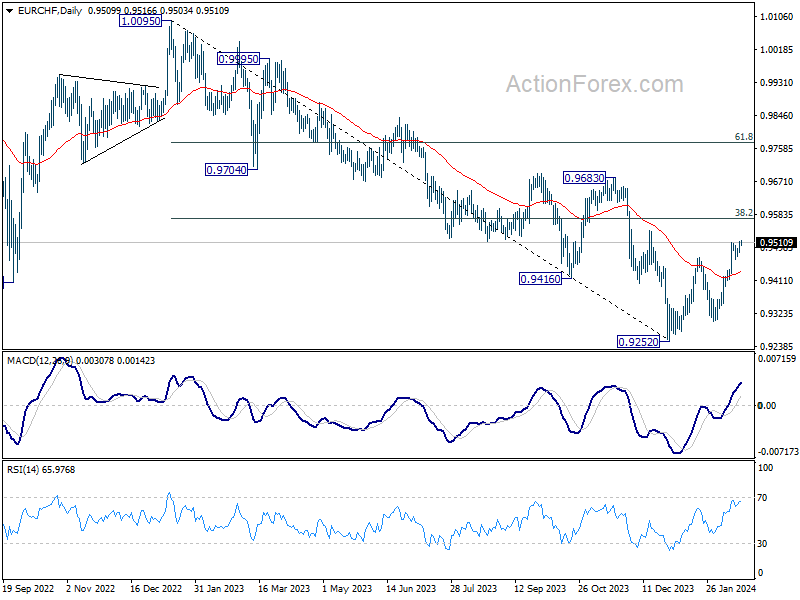
EUR/CHF Daily Outlook
Daily Pivots: (S1) 0.9494; (P) 0.9504; (R1) 0.9522; More...
EUR/CHF's rise from 0.9252 is trying to resume by breaching 0.9510 and intraday bias is back on the upside. Further rally should be seen to 0.9574 fibonacci level next. On the downside, below 0.9466 minor support will turn intraday bias neutral again first.
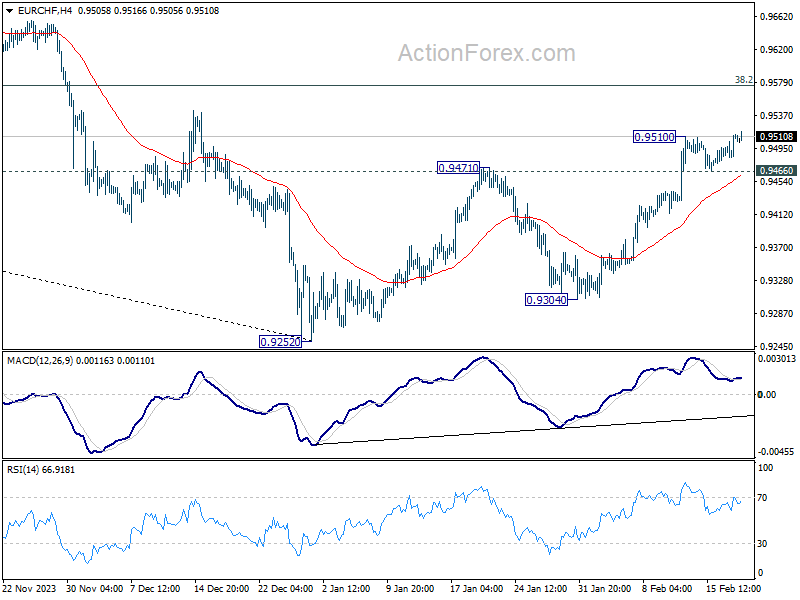
In the bigger picture, price actions from 0.9252 are tentatively seen as a correction to the five-wave down trend from 1.0095 (2023 high). Further rise would be seen to 38.2% retracement of 1.0095 to 0.9252 at 0.9574 and possibly above. But overall medium term outlook will remain bearish as long as 0.9683 resistance holds.
New Fed Call
In focus today
This morning we will get the National Accounts for Q4 2023 in Denmark. We expect the numbers to show a sharp rebound in GDP growth to 1.0% q/q in Q4 after the 0.7% decline in Q3. Both the decline and the rebound are driven by industrial production which again is primarily driven by pharmaceuticals. Outside of pharma, the economy appears to be stagnating as we see elsewhere in Europe.
In Sweden the monthly Prospera survey results is also out this morning. The latest print from January showed a decline in inflation expectations for all tenors (1-, 2- and 5y) whereas the 2y mean was below the 2% target at 1.86%. Later in the day we have speeches from the Riksbank's executive board members Flodén (CET 09:45), Breman (CET 12:00) and Thedéen (CET 17:55).
Later today, we receive the ECB's Q4 2023 negotiated wages indicator. We expect that wage growth decelerated from 4.7% y/y in Q3 2023 as indicated by more timely wage trackers. The ECBs wage tracker suggest a large decline in negotiated wages from 5% y/y in Q3 to 3.7% in Q4. However, the wage tracker including one-offs only marginally recedes from Q3 to Q4 so one should be cautious with conclusions on the aggregate wage pressure from negotiated wages before we receive the compensation per employee wage indicator that covers all wage expenditures.
Economic and market news
What happened overnight
The PBOC cut the 5-year Loan Prime Rate (LPR) by 25bp to 3.95%, signalling support to the property market as the 5-year LPR mainly affects mortgage rates. The Bank kept the 1-year LPR unchanged, however, after also keeping the 1-year medium-term lending facility rate unchanged on Sunday. We think the Central Bank is reluctant to conduct broad rate cuts until the FED has eased policy to avoid a widening spread, opting instead for more targeted cuts like we have seen with the 5-year LPR.
In the just published edition of Reading the Markets USD, we tweak our expected path for US monetary policy a bit. After the recent upside surprises in macro data, and not least last week's CPI, we revise our Fed call and now look for the first 25bp rate cut in May (from March). Our longer-term view of solid structural growth and continuing disinflation still holds, and we think the Fed will opt for gradual quarterly reductions afterwards. In total, we see three cuts in 2024 in May, July and November (previously 4).
What happened yesterday
Yesterday we saw signs that consumer spending might be picking up in China, after the number of holiday trips for the Chinese New Year set a 5-year record. Reports also show increased travelling abroad. It is, though, yet too early to draw conclusions and we will have to wait for actual spending data released in mid-March.
Tensions in the Red Sea were boosted as a Houthi attack on a British vessel on Sunday reportedly forced the crew to abandon ship. Many major shipping companies, such as Maersk, are no longer sailing through the Suez Canal, and the latest attack underscores that this is not likely to change soon. The market impact was muted.
Finally, in an interview with CNBC at the Munich Security Conference, Democratic Senator Connolly said that sanctions on Chinese companies judged to help Russia's war efforts could come "very soon". This follows similar discussions in the EU, whose 13th sanctions package aimed at Russia, which could be ready later this month, might also include sanctions on Chinese companies.
Equities: Global equities marginally higher yesterday in a classic low vol session as US was closed for Presidents' Day. That being said, defensives clearly outperformed cyclicals and once again it was health care leading the advances. Looking at Stoxx600 the last 3 months, health care has outperformed utilities in the defensive space despite yields are down in the same period. This is a classic late cycle phenomenon to see health care outperforming other defensive sectors in the late part of the business cycle. Just for the record, health is the best performing sector of all in the S&P500 the last three months despite all the talks about magnificent seven. In Europe yesterday, STOXX 600 +0.2%, FTSE 100 +0.3%, DAX -0.2% and CAC -0.1%.
Asian markets are lower across the board this morning led by South Korea down 1.4%. Futures in both Europe and US point to a lower opening.
FI: It was a very calm day in FI markets yesterday with only marginal changes throughout the day. Long-end EGB yields ended marginally higher in general, while the short end of the curve was basically unchanged. US markets were closed for President's Day. Overnight, 10Y UST yields have risen a bit, now trading at 4.30%. We expect the level to range trade around 4.20% for the remainder of the year.
FX: SEK came out on top on a quiet-US-holiday-prone start to the week. Commodity currencies also performed well, while CHF lost some ground. EUR/USD held steady just below 1.08 and USD/JPY briefly slipped below 150.
USD/CAD – A Quiet Start to the Week But Plenty to Come
- Canadian inflation expected to have fallen again in January
- Will the FOMC minutes shed any light on rate cuts?
- USDCAD higher but momentum remains weak
It’s no surprise that it’s been a quiet start to the week, with both countries observing a bank holiday but several events on the horizon should ensure things pick up.
Canadian inflation data on Tuesday is the first of those, with the headline rate expected to have eased slightly in January. While not nearly enough to make the next Bank of Canada meeting on 6 March a real possibility for a rate cut – markets view it as around a 17% chance – a beat to the downside could improve the odds in the second quarter of the year.
The release of the FOMC minutes on Wednesday could generate more interest than usual at a time when traders appear unusually unsure of the timing and pace of rate cuts. This comes after a start to the year in which the data has not been as favorable as the final weeks of last forcing markets to scale back expectations for rate cuts this year. Could the FOMC minutes offer some clarity on that?
Weak momentum in the recent moves again?
The US dollar is edging higher against its Canadian counterpart early in the week but may continue to face strong headwinds around last week’s peak.
USDCAD Daily
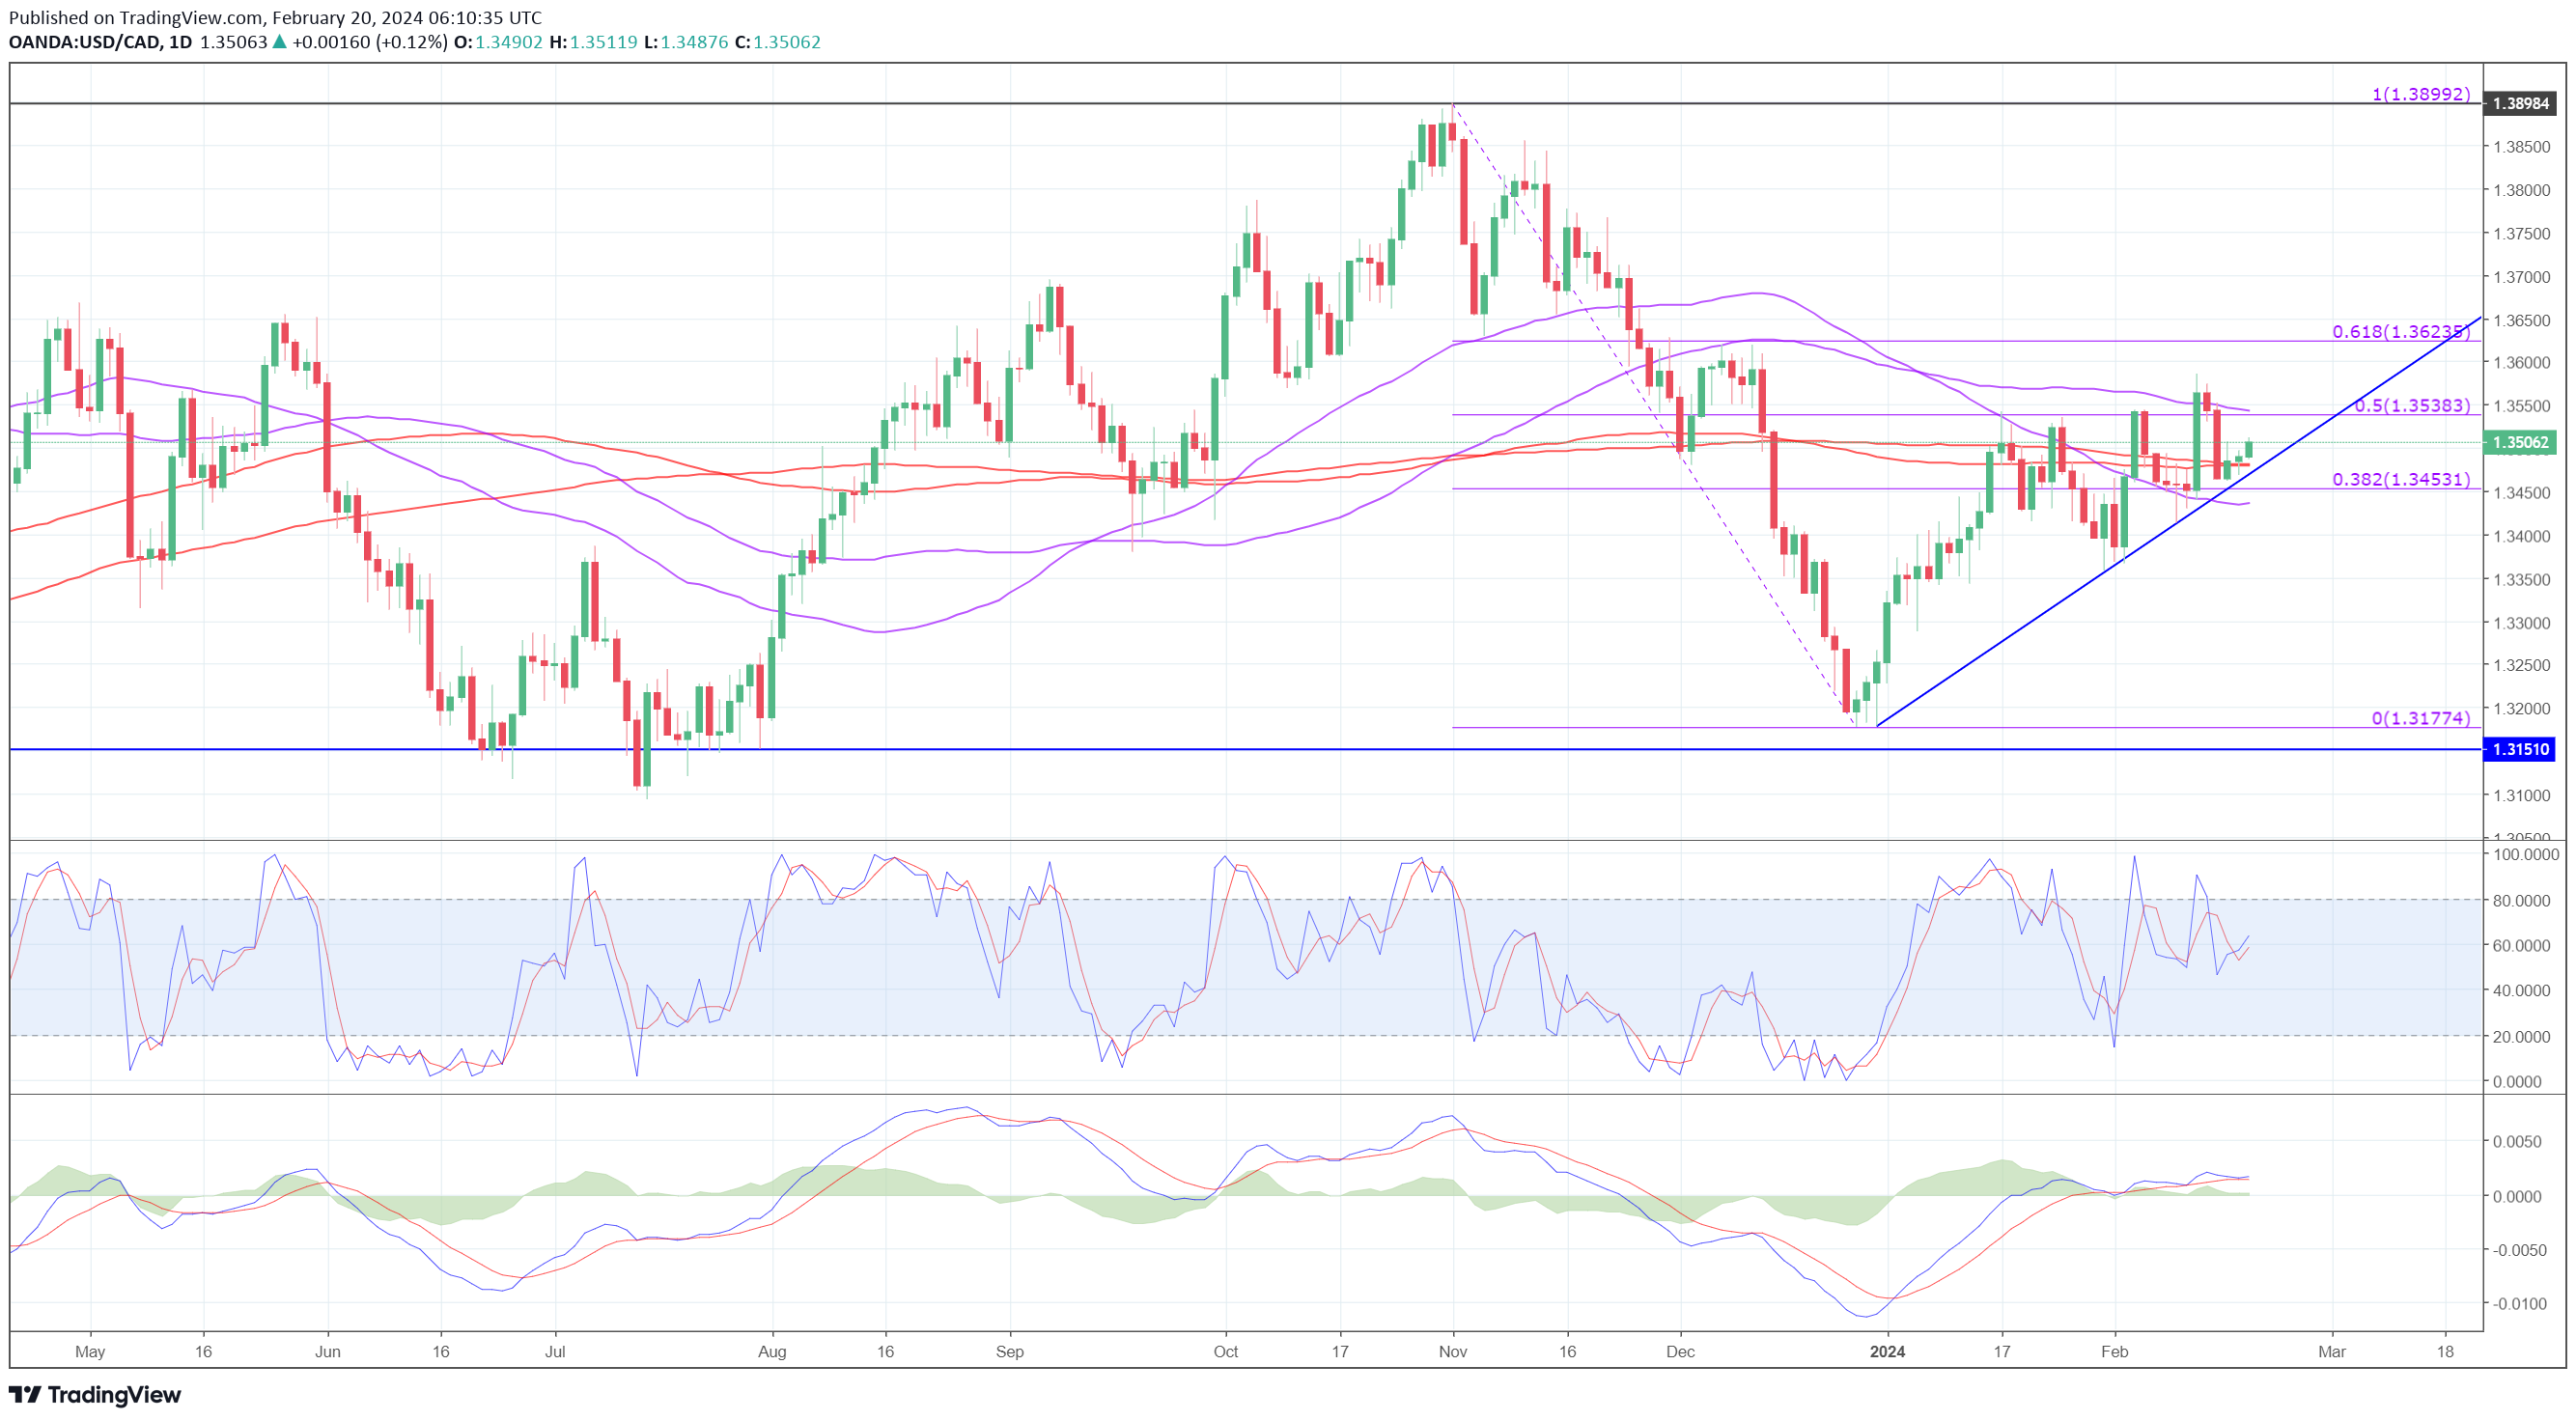
Source – OANDA
New highs over the last month have been matched with weakening momentum which has created a divergence between the price and the stochastic and MACD. It occurred initially around the 50% Fibonacci retracement level and then between it and the 61.8%, both potentially important areas of resistance. While momentum could pick up in any renewed push higher, the mild gains of the last three sessions aren’t particularly encouraging.