Sample Category Title
USD/JPY Daily Outlook
Daily Pivots: (S1) 149.65; (P) 150.04; (R1) 150.40; More...
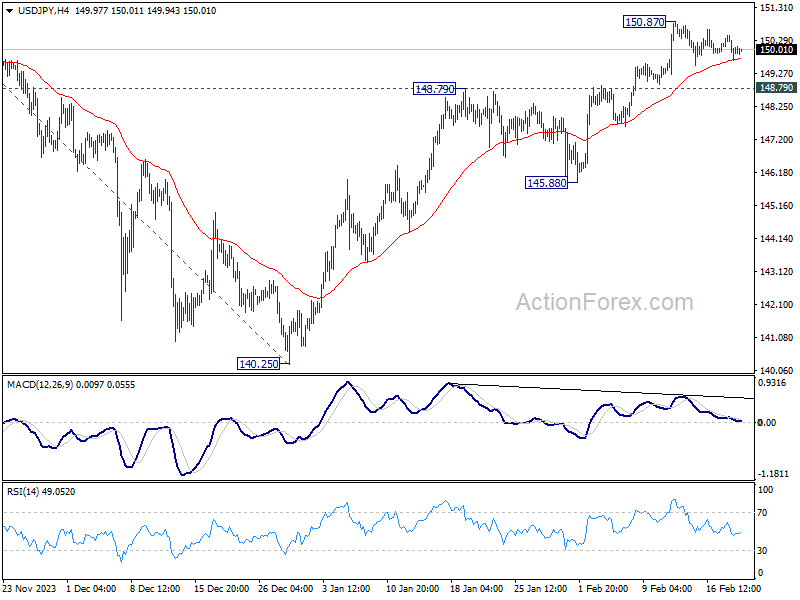
Intraday bias in USD/JPY stays neutral for the moment as consolidation from 150.87 is extending. In case of another retreat, downside should be contained by 148.79 resistance turned support to bring another rally. Above 150.87 will resume the rise from 140.25 to 151.89/93 key resistance zone. Decisive break there will confirm larger up trend resumption of 155.50 projection level next. However, firm break of 148.79 will turn bias to the downside for 145.88 support.
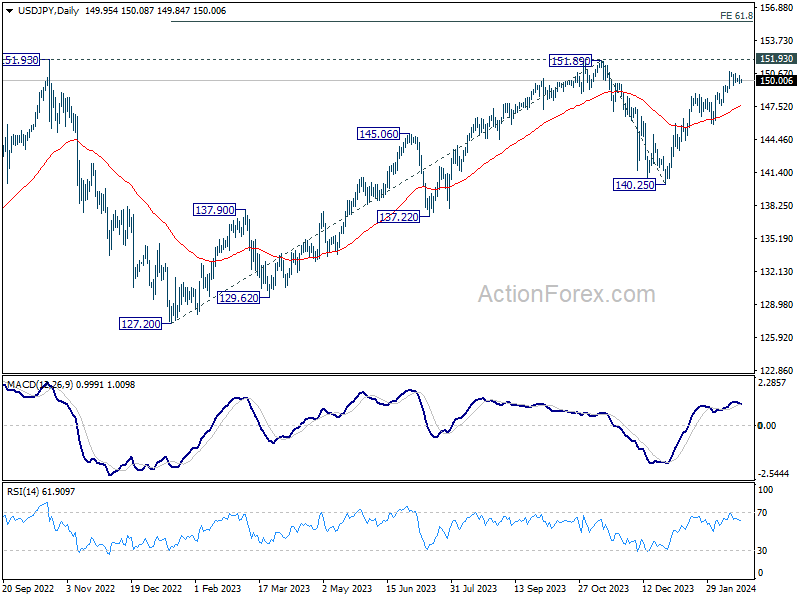
In the bigger picture, fall from 151.89 is seen as a correction to the rally from 127.20, which might have completed at 140.25 already. Firm break of 151.89/93 resistance zone will confirm up trend resumption, and next target will be 61.8% projection of 127.20 to 151.89 from 140.25 at 155.50. This will now remain the favored case as long as 140.25 support holds.
USD/CAD Daily Outlook
Daily Pivots: (S1) 1.3487; (P) 1.3509; (R1) 1.3544; More...
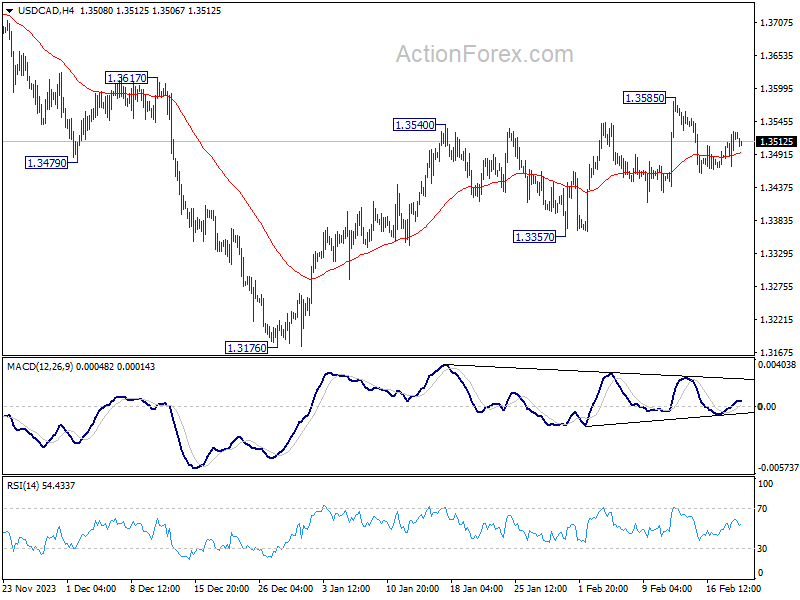
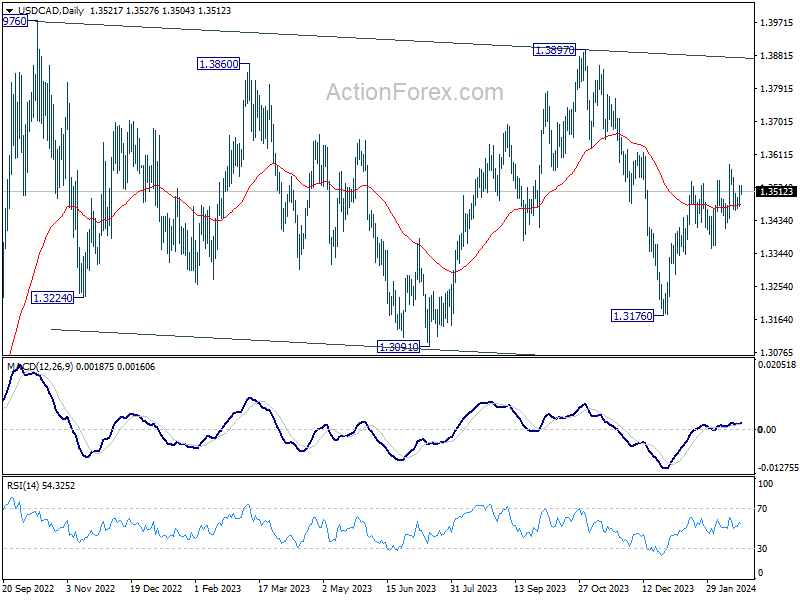
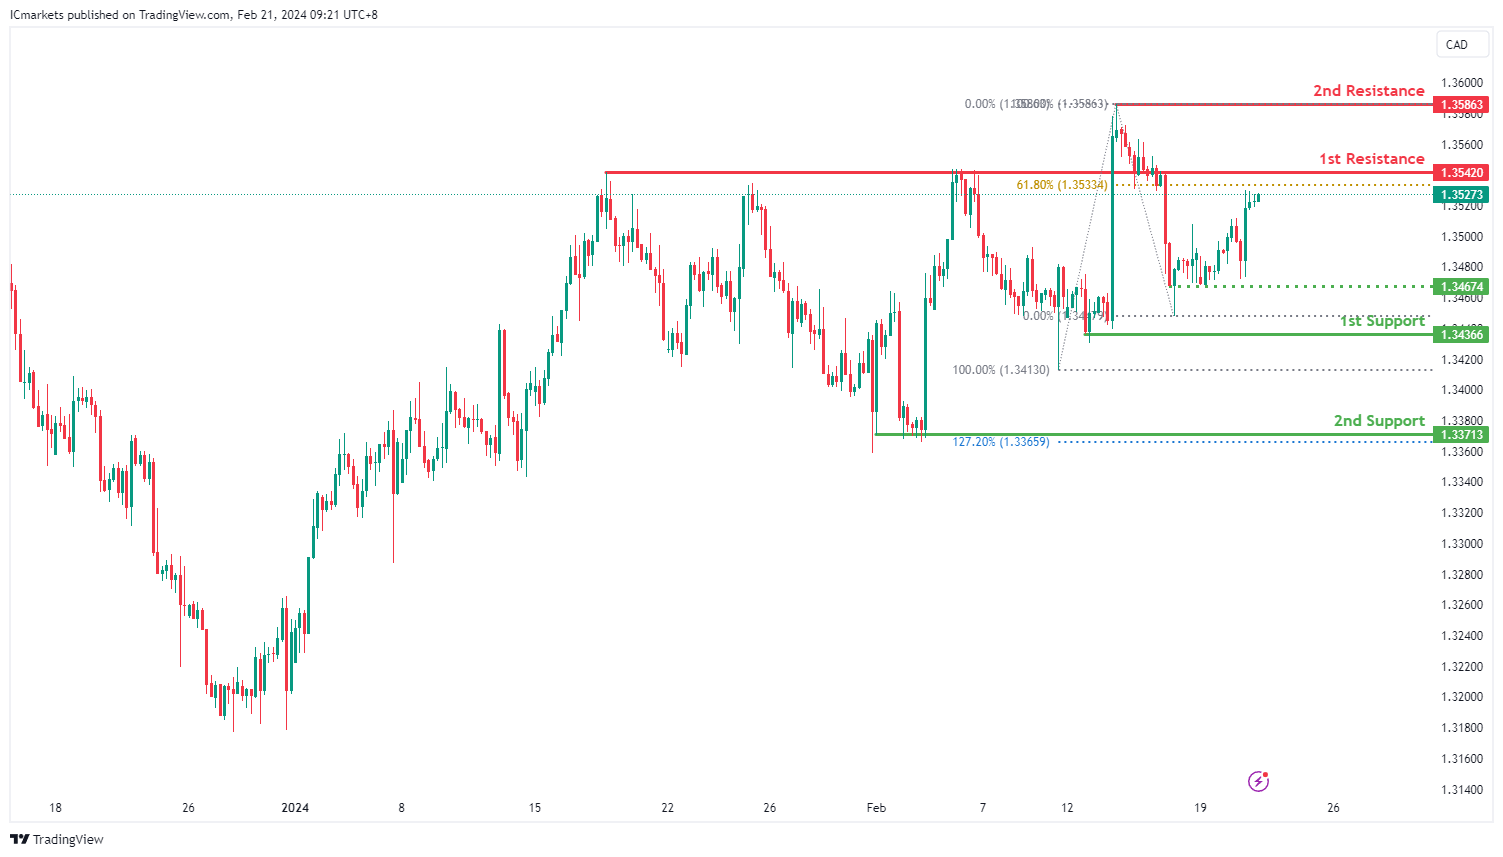
Intraday bias in USD/CAD remains neutral for the moment, as range trading continues. More consolidations could be seen, but further rally is expected as long as 1.3357 support holds. On the upside, firm break of 1.3585 will resume the rebound from 1.3176 for 1.3897 resistance.
In the bigger picture, price actions from 1.3976 (2022 high) are viewed as a corrective pattern only. In case of another fall, strong support should emerge above 1.2947 resistance turned support to bring rebound. Overall, larger up trend from 1.2005 (2021 low) is still expected to resume through 1.3976 at a later stage.
AUD/USD Daily Report
Daily Pivots: (S1) 0.6521; (P) 0.6550; (R1) 0.6578; More...
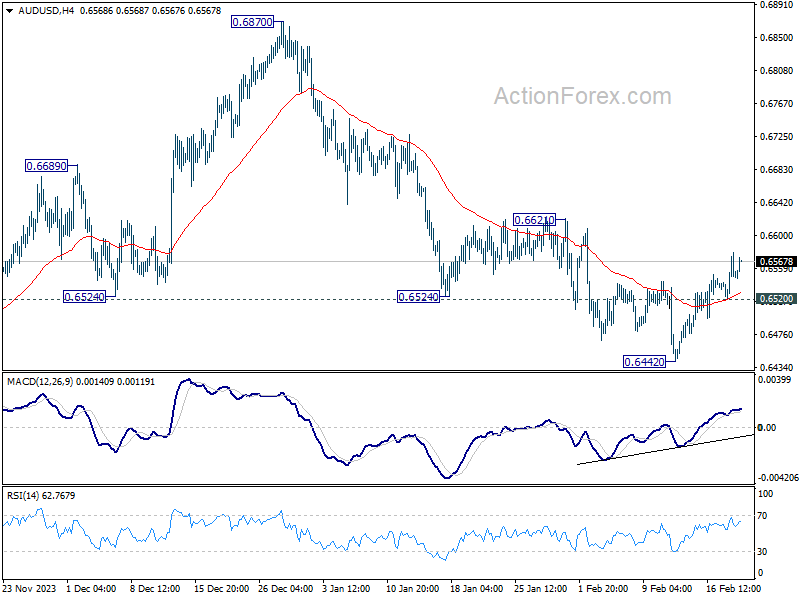
AUD/USD's recovery from 0.6442 extends higher, but upside is still capped well below 0.6621 resistance. Intraday bias remains neutral and further decline is in favor. Below 0.6520 minor support will turn bias to the downside for retesting 0.6442 first. Firm break there will resume the the decline from 0.6870 towards 0.6269 low. Nevertheless, considering bullish convergence condition in 4H MACD, decisive break of 0.6621 will turn near term outlook bullish for 0.6870 resistance instead.
.
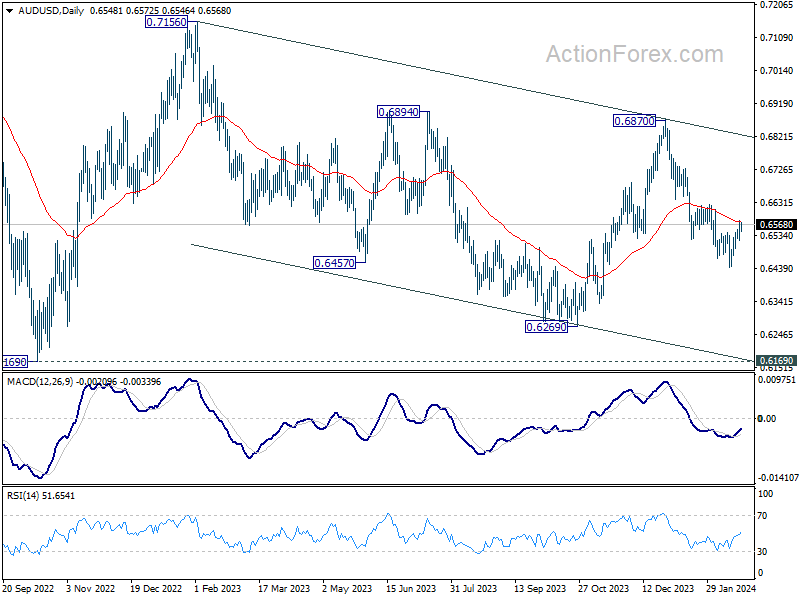
In the bigger picture, price actions from 0.6169 (2022 low) are seen as a medium term corrective pattern to the down trend from 0.8006 (2021 high). Fall from 0.7156 (2023 high) is seen as the second leg, which might still be in progress. Overall, sideway trading could continue in range of 0.6169/7156 for some more time. But as long as 0.7156 holds, an eventual downside breakout would be mildly in favor.
Kiwi and Aussie Rise on China’s Market Boost, Dollar Weakens Ahead of FOMC Minutes
New Zealand and Australia Dollar rise appreciably in Asian session today, buoyed by a significant rebound in stock markets of China and Hong Kong. This positive momentum is largely attributed to the ripple effects of China's larger-than-expected interest rate cut earlier in the week. Hang Seng Index, in particular, showcased a robust increase of around 3%, reflecting renewed investor confidence. This upbeat mood was further amplified by visible signs of China's "national team" ramping up efforts to stabilize the stock market through strategic interventions, evident from the notable increase in assets within leading exchange-traded funds. At the same time, the offshore Chinese Yuan is also strengthening, now eyeing a breakthrough towards 7.2 level against Dollar.
Meanwhile, Dollar is on the softer side as market focus shifts towards the eagerly awaited FOMC minutes. The minutes are expected to temper expectations for an imminent rate cut, and emphasize that the inflation fight is not won yet. Despite a consensus among Fed officials regarding the likelihood of lower interest rate by year-end, the precise timing and manner of such a shift remain highly contingent on evolving economic indicators.
Market speculations, as reflected in fed fund futures, currently assign a 35% likelihood for an initial rate reduction in May, with the odds increasing to approximately 79% for June. This anticipation aligns with the broader consensus among economists, as revealed in a recent Reuters poll conducted from February 14-20. Out of 104 economists surveyed, a significant majority of 86 foresee Fed's first rate cut occurring in Q2. Within this group, a slight majority of 53 earmarks June as the most probable month for this adjustment, whereas a smaller contingent of 33 anticipates May as the kickoff for easing measures, leaving a remainder who expect the first cut to unfold in H2.
As the week unfolds till now, New Zealand Dollar stands out as the frontrunner among currencies, closely followed by Australian Dollar, which has benefitted from the general uplift in regional market sentiments. Euro has is the third strongest, bolstered by yesterday's data indicating a slight moderation in wage growth for Q4. On the other end of the spectrum, Canadian Dollar has faced downward pressure as the worst performer, following unexpectedly low consumer inflation readings, hinting at the potential for an earlier-than-anticipated rate cut by BoC. Swiss Franc and Dollar are also experiencing weakness, whereas Yen and Sterling are mixed.
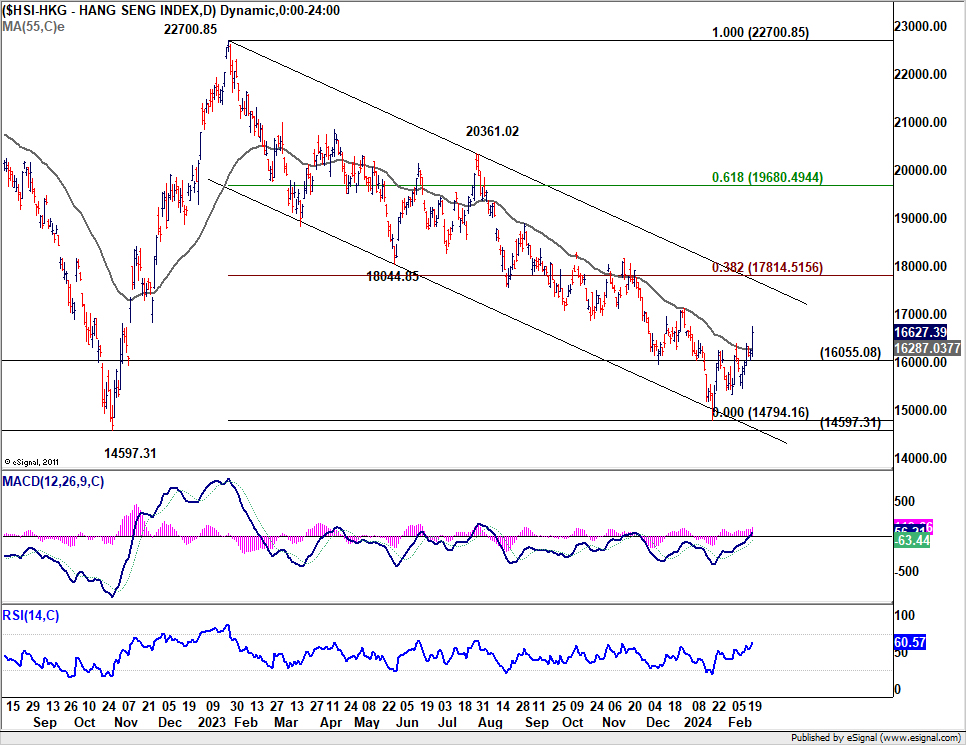
Technically, Hong Kong HSI's rebound made some progress today by breaking through 55 D EMA (now at 16288) decisively. Further rise is now in favor as long as 16055.08 support holds, towards channel resistance (now at around 17700. At this point, it's too early call for bullish trend reversal, and strong resistance could be seen from 38.2% retracement of 22700.85 to 14794.16 at 17814.51 to limit upside. But for the near term, extended rebound and improvement in sentiment could lend additional support to Aussie and Kiwi.
In Asia, at the time of writing, Nikkei is down -0.29%. Hong Kong HSI is up 2.73%. China Shanghai SSE is up 2.17%. Singapore Strait Times is down -0.49%. Japan 10-year JGB yield is down -0.0025 at 0.730. Overnight, DOW fell -0.17%. S&P 500 fell -0.60%. NASDAQ fell -0.92%. 10-year yield fell -0.020 to 4.275.
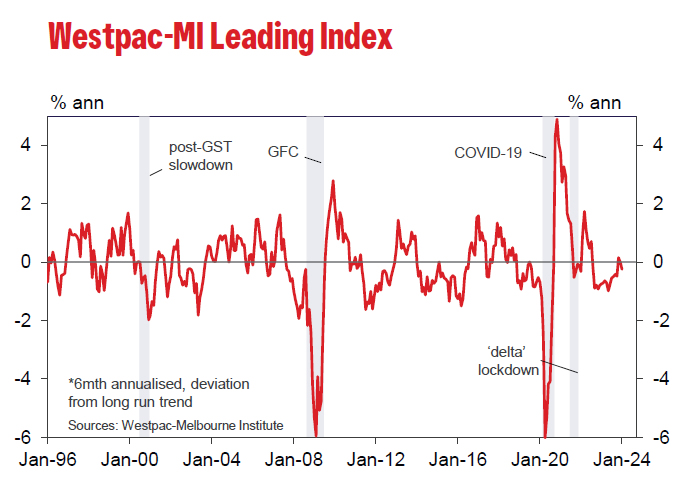
Australia Westpac leading index falls to -0.25%, sub-par growth to continue
Australia's economy is bracing for continued "sub-par growth" into 2024, as indicated by the downturn in the Westpac Leading Index, which dipped from -0.01% to -0.25% in January. Westpac anticipates the economic growth rate to hover around an annualized 1.3% in the first half of this year, marking an improvement from the latter half of 2023's 0.8%, yet remaining significantly below the usual trend rate of about 2.5%.
In the realm of monetary policy, Westpac's analysis suggests a measured approach by RBA. The central bank is expected to take additional time to gain "sufficient confidence" that inflation will revert to target range within a reasonable timeframe. Economic indicators leading up to the March meeting are projected to reinforce a narrative of "weak growth and demand environment domestically," which would justify RBA's decision to maintain its current policy stance.
This cautious period of observation is likely to precede any shift towards a more definitive "on hold" position by the Board, with considerations for interest rate cuts anticipated to emerge further down the line.
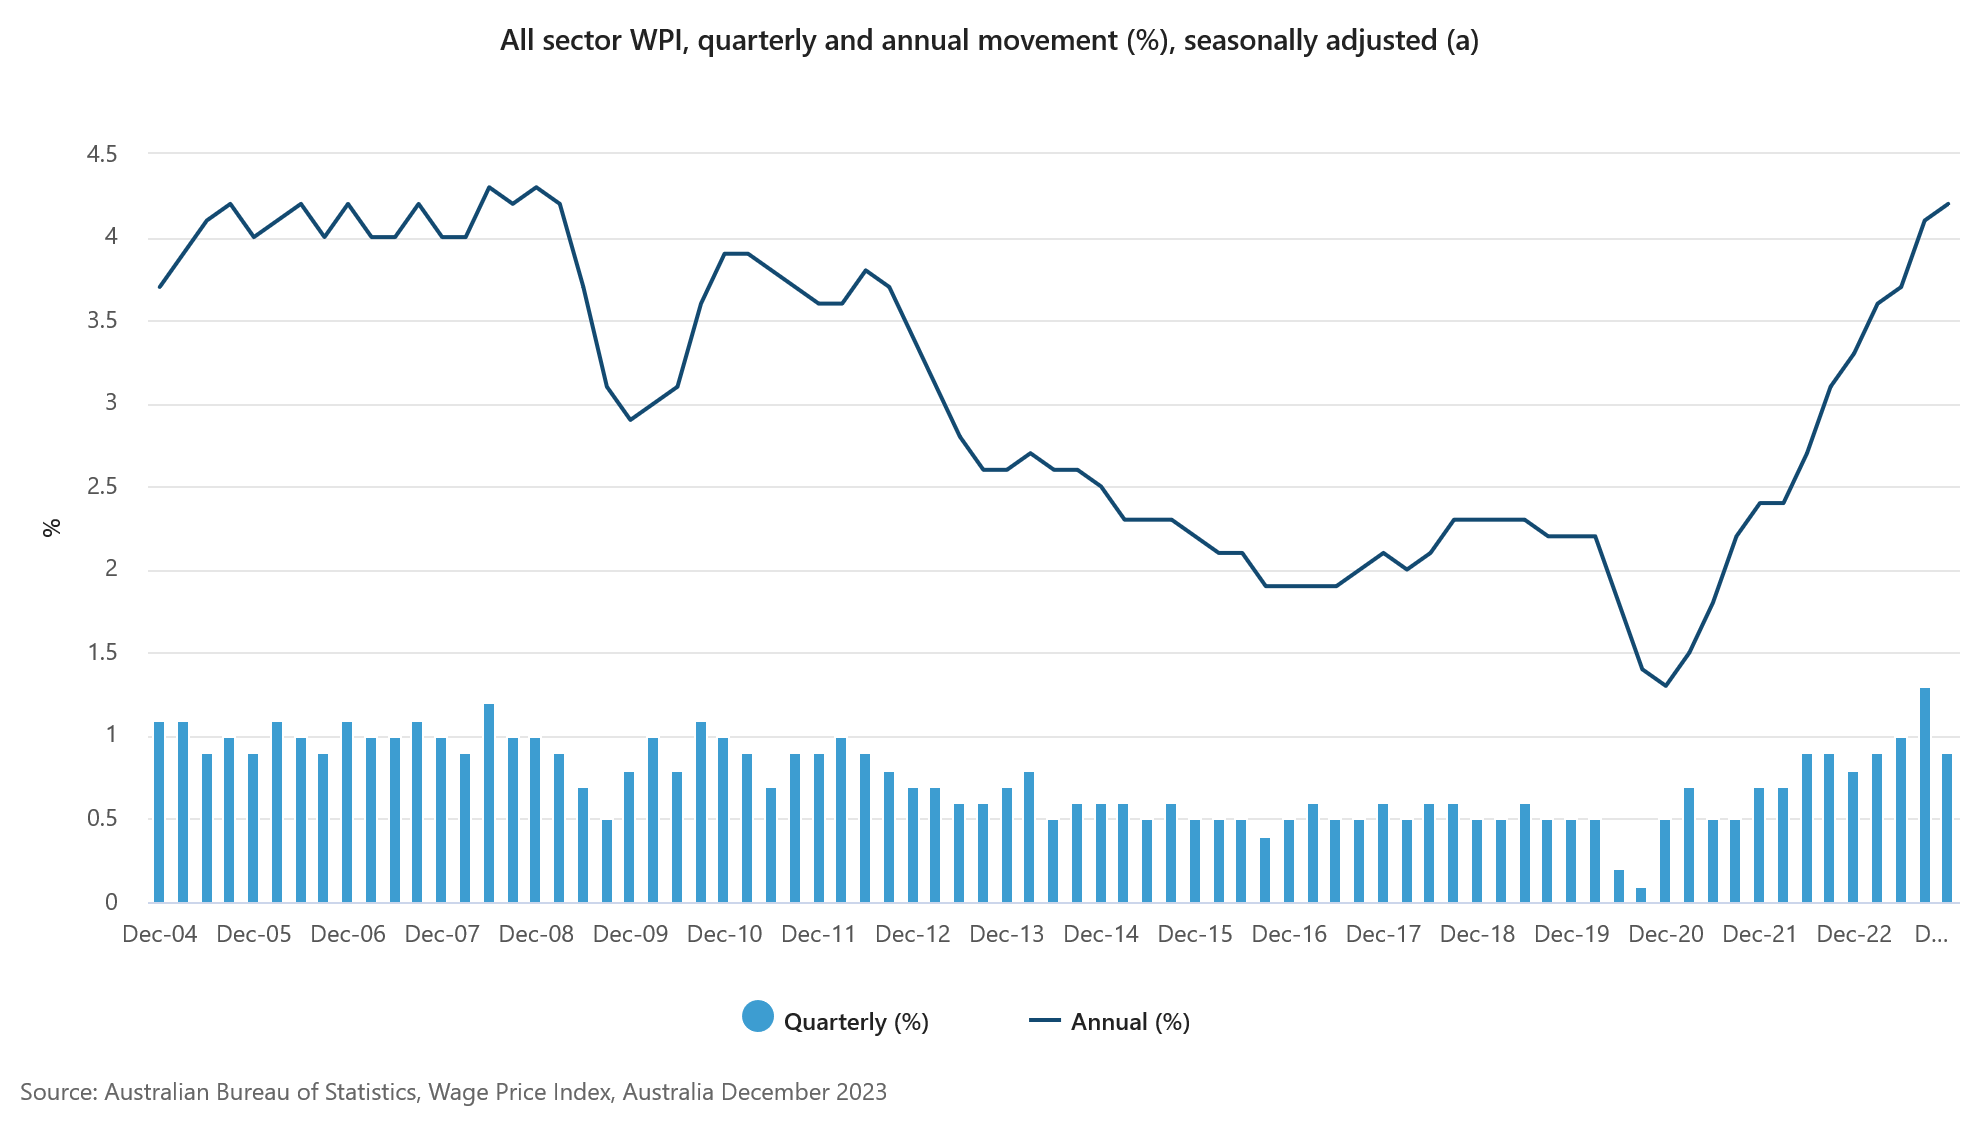
Australia's Q4 wage growth hits 4.2%, driven by sharp public sector increase
Australia's wage price index rose 0.9% qoq in Q4, decelerating from the previous quarter's 1.3% qoq increase, but in line with market expectations. Annually, wage growth ticked up from 4.1% yoy to 4.2% yoy, marking the highest rate since Q1 2009.
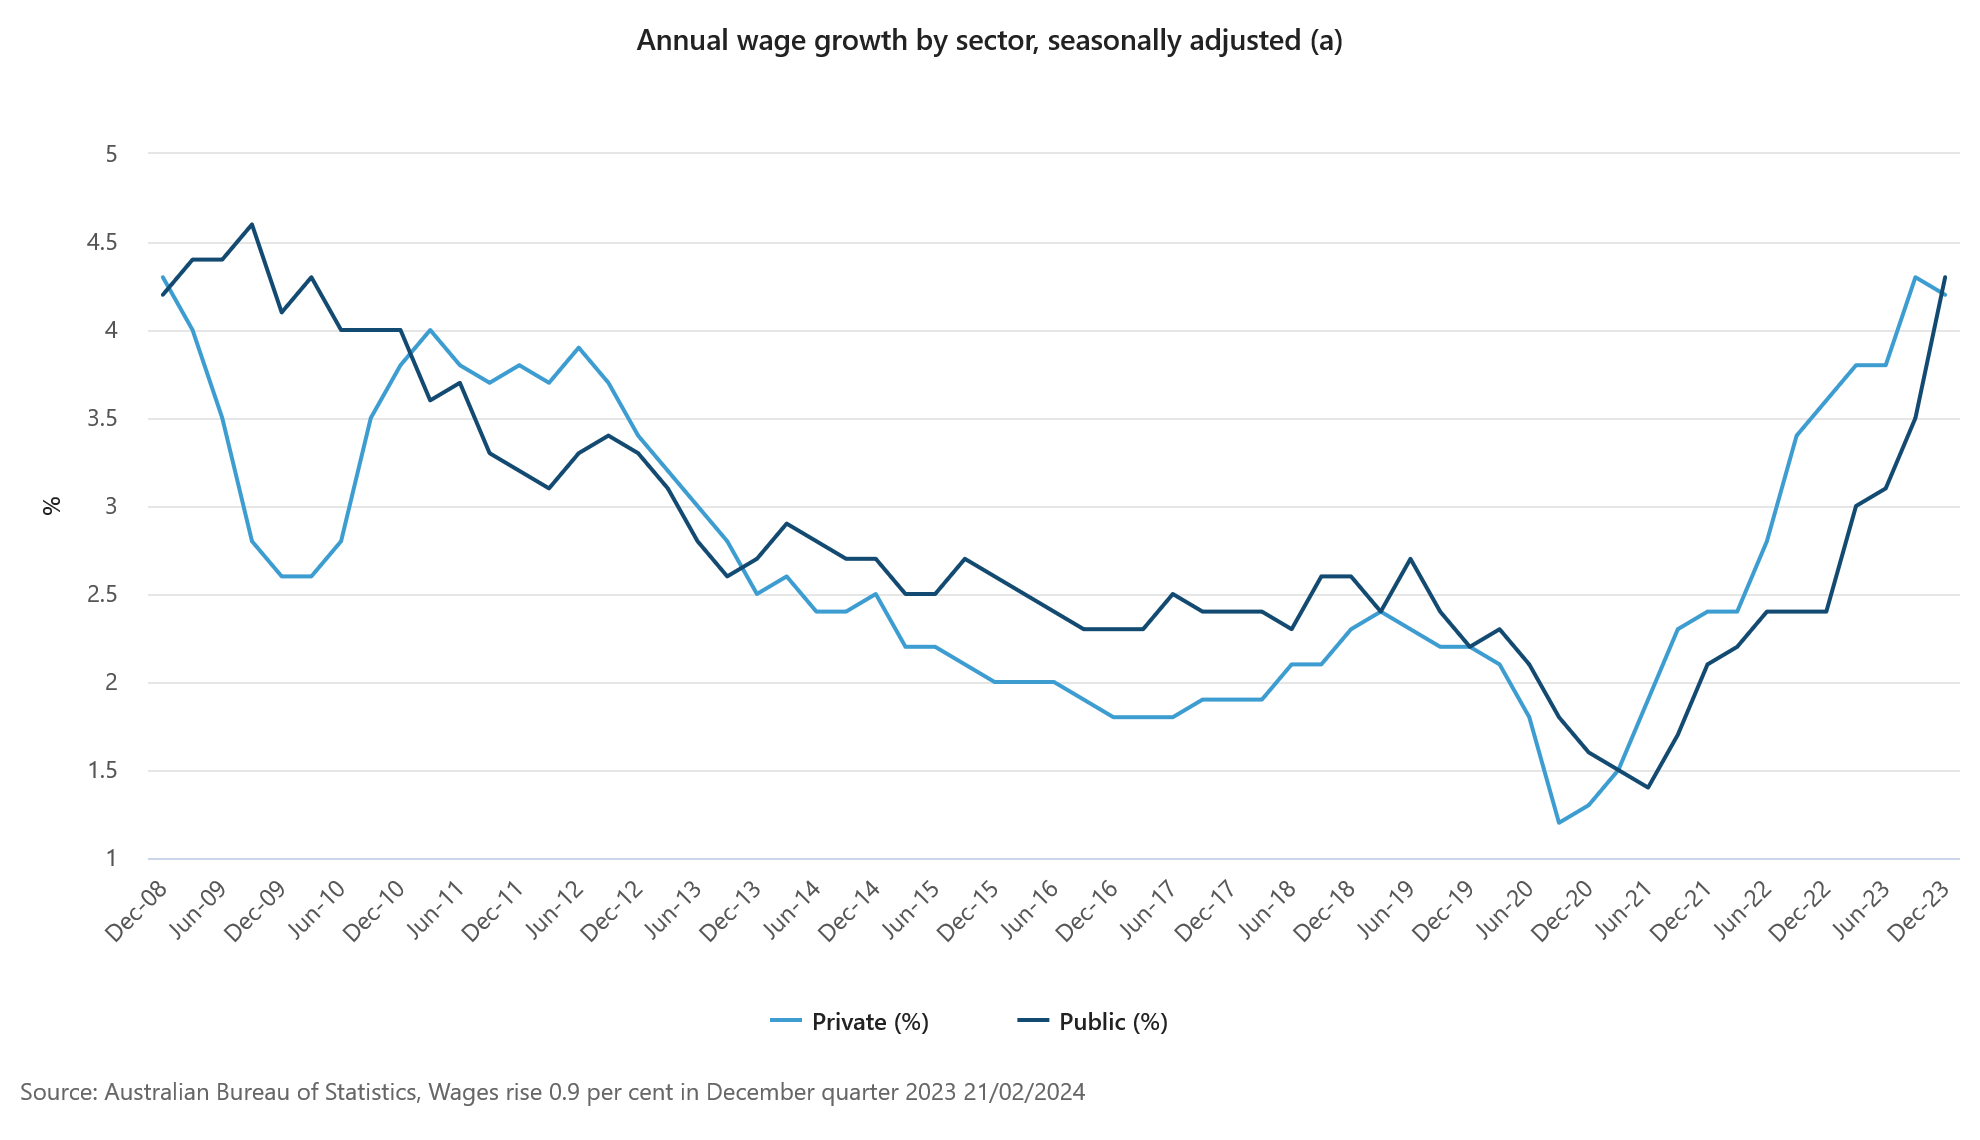
A closer look at sector-specific data reveals that private sector annual wage growth slowed slightly from 4.3% yoy to yoy. In contrast, public sector wage growth accelerated sharply from 3.5% yoy to 4.3% yoy, the highest rate since Q1 2010.
The surge in public sector wages underscores the impact of cyclical patterns of enterprise bargaining, as highlighted by Michelle Marquardt, ABS head of prices statistics. She noted, "In the December quarter 2023, 38 percent of public sector jobs saw a wage rise, considerably higher than the 29 percent from the same quarter in the previous year."
Furthermore, average hourly wage change for these jobs escalated to 4.3%, surpassing 2.8% recorded at the same time last year and achieving the highest level since September 2008.
Japan's exports rises 11.9% yoy in Jan, imports down -9.6% yoy
Japan's export recorded 11.9% yoy increase to JPY 7333B in January, marking the second consecutive month of growth. However, imports saw a contrasting trend, decreasing by -9.6% yoy to JPY 9091B. This resulted in a trade deficit of JPY -1758B for the month.
A notable highlight from the trade data was Japan's trade surplus with the US, amounting to JPY 415B, as exports reached an all-time high for the month at JPY 1.42T.
Conversely, Japan faced a JPY -959.52B trade deficit with China, another significant trading partner. Despite this deficit, exports to China were supported by strong demand for chip-making equipment and cars.
On seasonally adjusted basis, exports registered decline of -3.6% mom to JPY 8765B, while imports fell more sharply by -10.5% mom to JPY 8230B. This shift led to trade surplus of JPY 235B.
Looking ahead
UK public sector net borrowing is a feature in European session, while Eurozone will release consumer confidence. Later in the day, Canada will publish new housing price index. But main focus is on FOMC minutes.
AUD/USD Daily Report
Daily Pivots: (S1) 0.6521; (P) 0.6550; (R1) 0.6578; More...
AUD/USD's recovery from 0.6442 extends higher, but upside is still capped well below 0.6621 resistance. Intraday bias remains neutral and further decline is in favor. Below 0.6520 minor support will turn bias to the downside for retesting 0.6442 first. Firm break there will resume the the decline from 0.6870 towards 0.6269 low. Nevertheless, considering bullish convergence condition in 4H MACD, decisive break of 0.6621 will turn near term outlook bullish for 0.6870 resistance instead.
In the bigger picture, price actions from 0.6169 (2022 low) are seen as a medium term corrective pattern to the down trend from 0.8006 (2021 high). Fall from 0.7156 (2023 high) is seen as the second leg, which might still be in progress. Overall, sideway trading could continue in range of 0.6169/7156 for some more time. But as long as 0.7156 holds, an eventual downside breakout would be mildly in favor.
Economic Indicators Update
| GMT | Ccy | Events | Actual | Forecast | Previous | Revised |
|---|---|---|---|---|---|---|
| 21:45 | NZD | PPI Input Q/Q Q4 | 0.90% | 0.40% | 1.20% | |
| 21:45 | NZD | PPI Output Q/Q Q4 | 0.70% | 0.40% | 0.80% | |
| 23:50 | JPY | Trade Balance (JPY) Jan | 0.24T | -0.23T | -0.41T | -0.44T |
| 00:00 | AUD | Westpac Leading Index M/M Jan | -0.10% | 0.00% | ||
| 00:30 | AUD | Wage Price Index Q/Q Q4 | 0.90% | 0.90% | 1.30% | |
| 07:00 | GBP | Public Sector Net Borrowing (GBP) Jan | -18.4B | 6.8B | ||
| 13:30 | CAD | New Housing Price Index M/M Jan | 0.10% | 0.00% | ||
| 15:00 | EUR | Eurozone Consumer Confidence Feb P | -16 | -16 | ||
| 19:00 | USD | FOMC Minutes |
Technical Outlook and Review
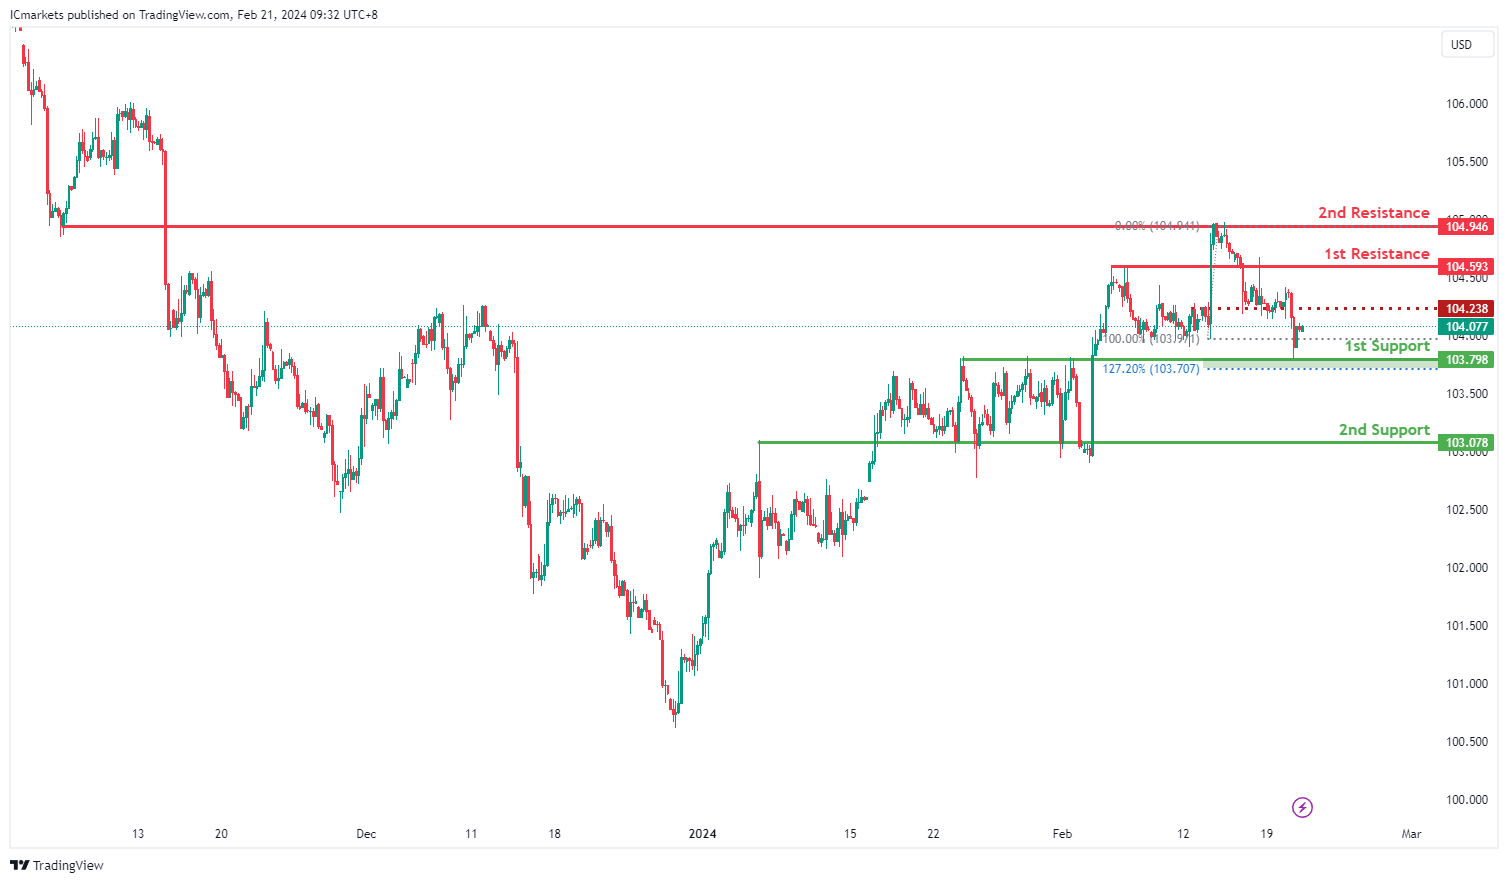
DXY:
The DXY (US Dollar Index) chart currently exhibits bullish momentum, indicating a potential bullish bounce off the 1st support level followed by a movement towards the 1st resistance.
The 1st support level at 103.79 is deemed significant as it aligns with an overlap support, suggesting a historical level where buying interest has been observed. This level may attract buyers to enter the market, potentially leading to a bounce in price.
Similarly, the 2nd support at 103.07 is also identified as an overlap support, reinforcing its importance as a historical level where buying pressure may emerge to support the price.
On the resistance side, the 1st resistance level at 104.59 is characterized as an overlap resistance, indicating its significance as a historical barrier where selling pressure may increase. This level may act as a hurdle for further upward movement in price.
Likewise, the 2nd resistance at 104.94 is identified as an overlap resistance, suggesting its importance as a level where selling interest may intensify, potentially limiting upward price movement.
An intermediate resistance level at 104.23 is also noted, characterized as a pullback resistance. This level may offer resistance to the price temporarily, potentially influencing short-term price action.
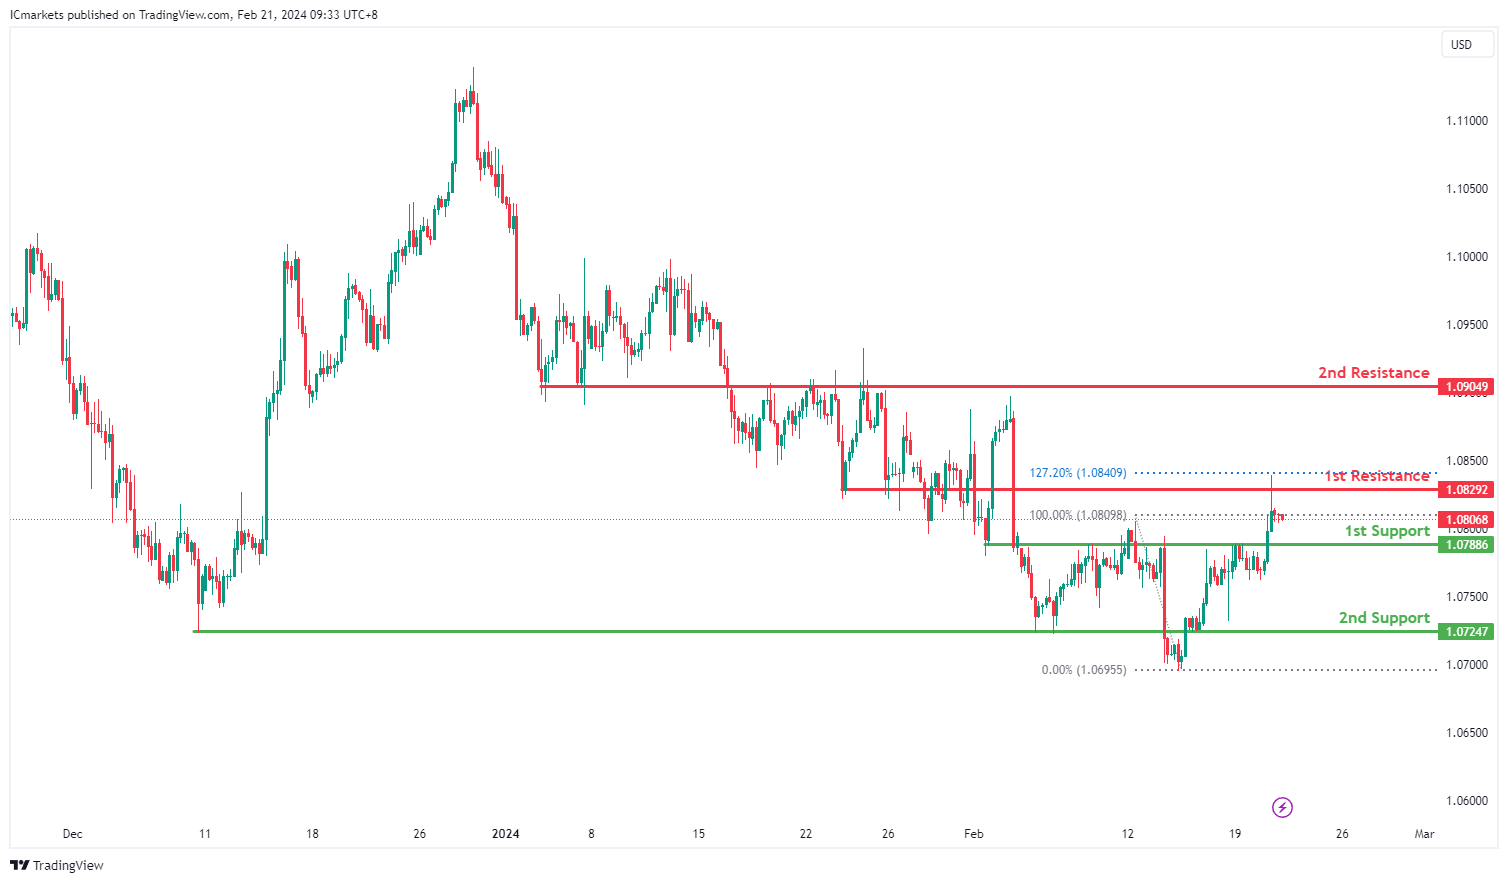
EUR/USD:
The EUR/USD chart currently indicates a bearish momentum, suggesting a potential bearish reaction off the 1st resistance level followed by a drop towards the 1st support.
The 1st support at 1.0788 is considered significant as it aligns with a pullback support, indicating a level where buyers may enter the market following a retracement.
Similarly, the 2nd support at 1.0724 is identified as an overlap support, reinforcing its importance as a historical level where buying interest has been observed.
On the resistance side, the 1st resistance level at 1.0829 is characterized as an overlap resistance, with the added confluence of the 127.20% Fibonacci Extension. This level suggests a historical point where selling pressure may increase, potentially hindering further upward movement.
Likewise, the 2nd resistance at 1.0904 is identified as an overlap resistance, indicating its significance as a level where selling interest may intensify, potentially acting as a barrier to upward price movement.
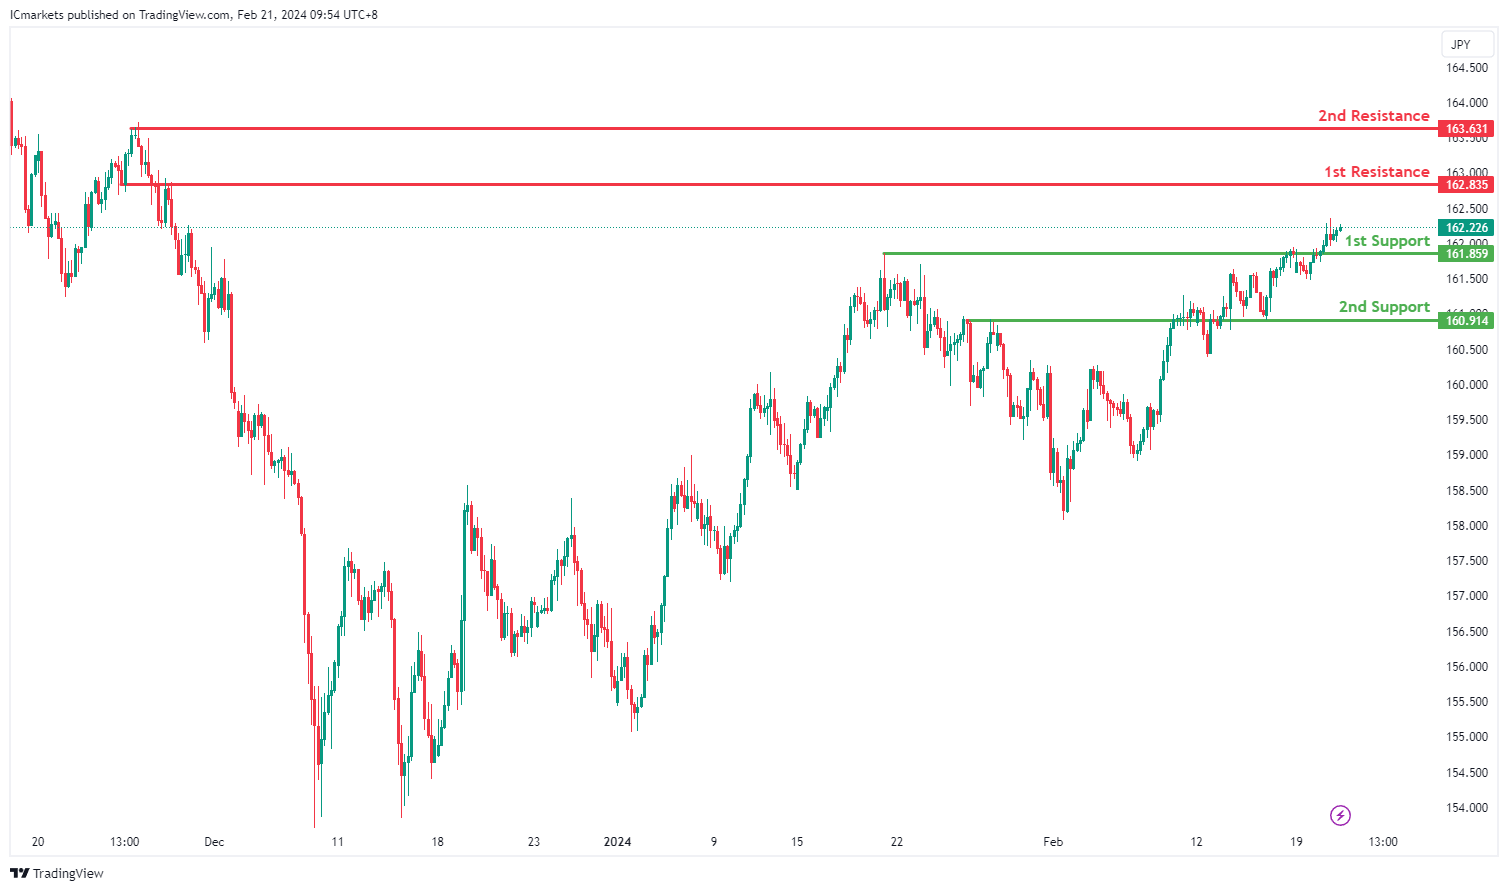
EUR/JPY:
The EUR/JPY chart currently demonstrates a bullish overall momentum, indicating a prevailing upward trend supported by several factors contributing to this sentiment.
The 1st support level at 161.859 aligns with an overlap support, marking a significant historical level where buying interest has been notable. This support level may act as a foundation for further upward movement, reinforcing the bullish sentiment.
Similarly, the 2nd support level at 160.914 also corresponds to an overlap support, further strengthening its significance as a potential area where buyers could step in to support the price during pullbacks.
On the resistance side, the 1st resistance level at 162.835 is identified as a critical point where selling pressure may increase. This level aligns with an overlap resistance, suggesting a potential barrier to further upward movement.
Additionally, the 2nd resistance level at 163.631 corresponds to a swing high resistance, adding to its significance as a point where selling interest has historically emerged.
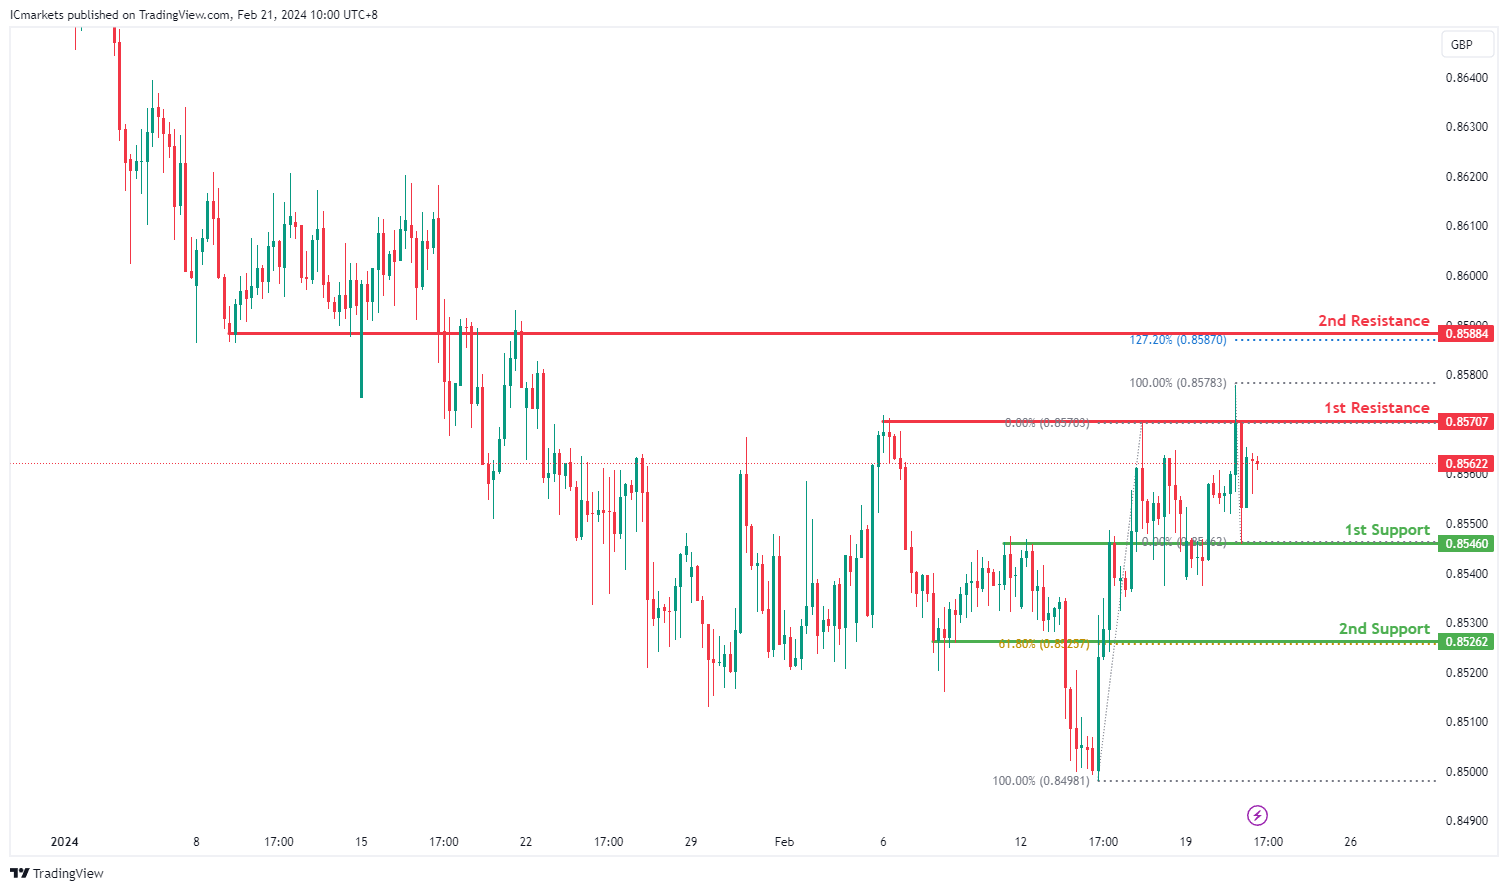
EUR/GBP:
The EUR/GBP chart currently exhibits a weak bullish momentum with low confidence, suggesting a cautious outlook for potential price movements. Despite this, there are factors indicating a possible bullish bounce off the 1st support level, followed by a move towards the 1st resistance.
The 1st support level at 0.85460 aligns with an overlap support, indicating a historical level where buying interest has been observed. Additionally, the 2nd support at 0.85262 corresponds to both a pullback support and the 61.80% Fibonacci Retracement level, further reinforcing its significance as a potential area for buyers to enter the market.
On the resistance side, the 1st resistance level at 0.85707 is identified as a point where selling pressure may increase, as it aligns with a swing high resistance. This level suggests a historical barrier to upward movement.
Furthermore, the 2nd resistance level at 0.85884 coincides with an overlap resistance and the 127.20% Fibonacci Extension, adding to its significance as a potential barrier to further bullish movement.
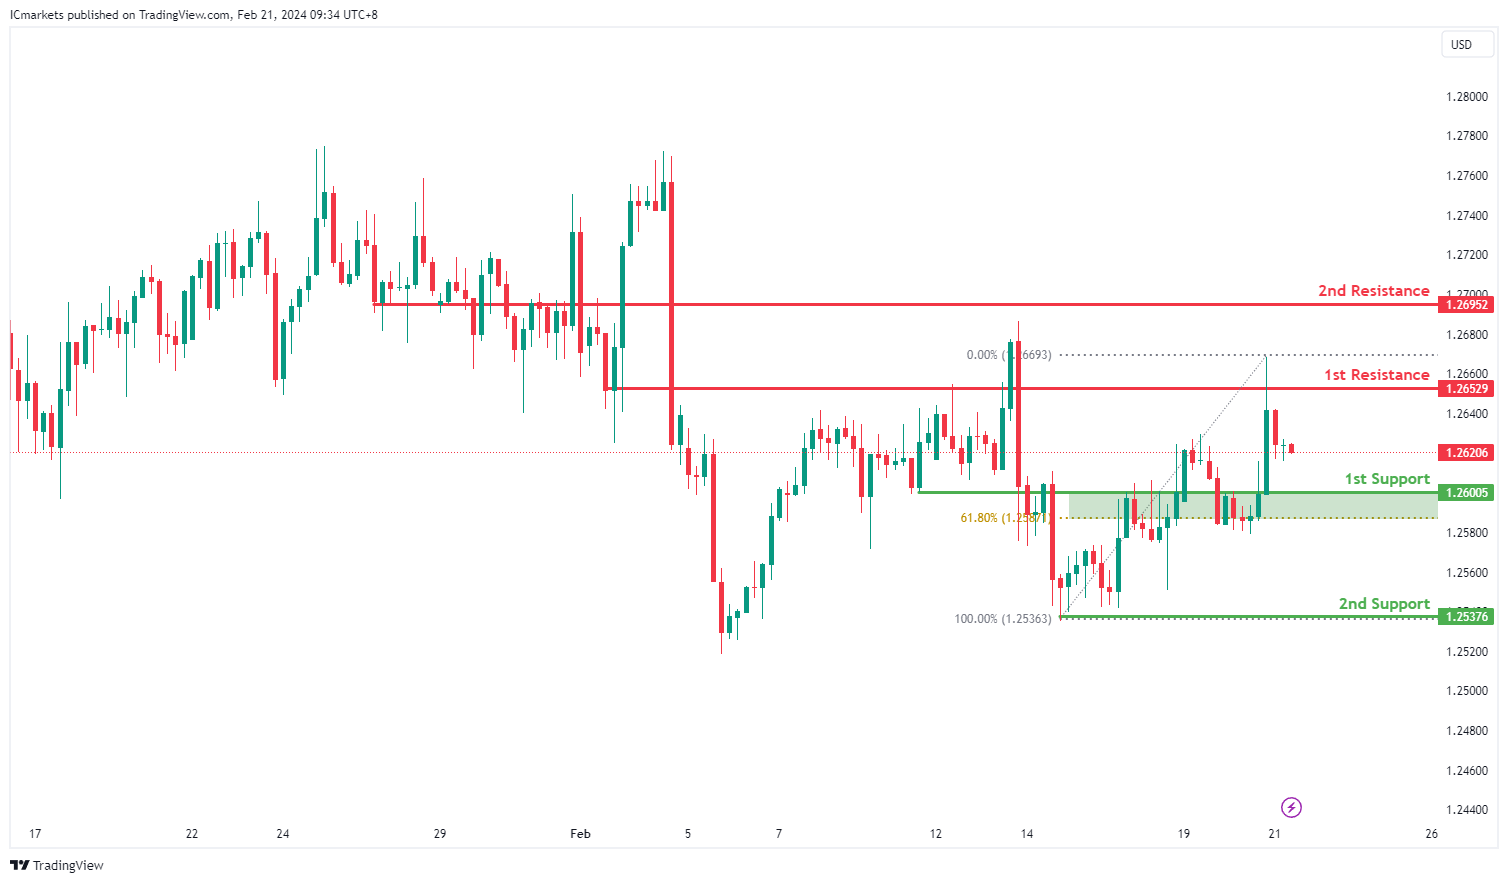
GBP/USD:
The GBP/USD chart currently indicates a bearish momentum, suggesting a potential continuation towards the 1st support level.
The 1st support at 1.2600 is considered significant as it aligns with a pullback support, indicating a level where buyers may enter the market following a retracement.
Similarly, the 2nd support at 1.2537 is identified as a multi-swing low support, reinforcing its importance as a historical level where buying interest has been observed.
On the resistance side, the 1st resistance level at 1.2652 is characterized as an overlap resistance, with the added confluence of the 61.80% Fibonacci Retracement. This level suggests a historical point where selling pressure may increase, potentially hindering further upward movement.
Likewise, the 2nd resistance at 1.2695 is identified as a pullback resistance, indicating its significance as a level where selling interest may intensify, potentially acting as a barrier to upward price movement.
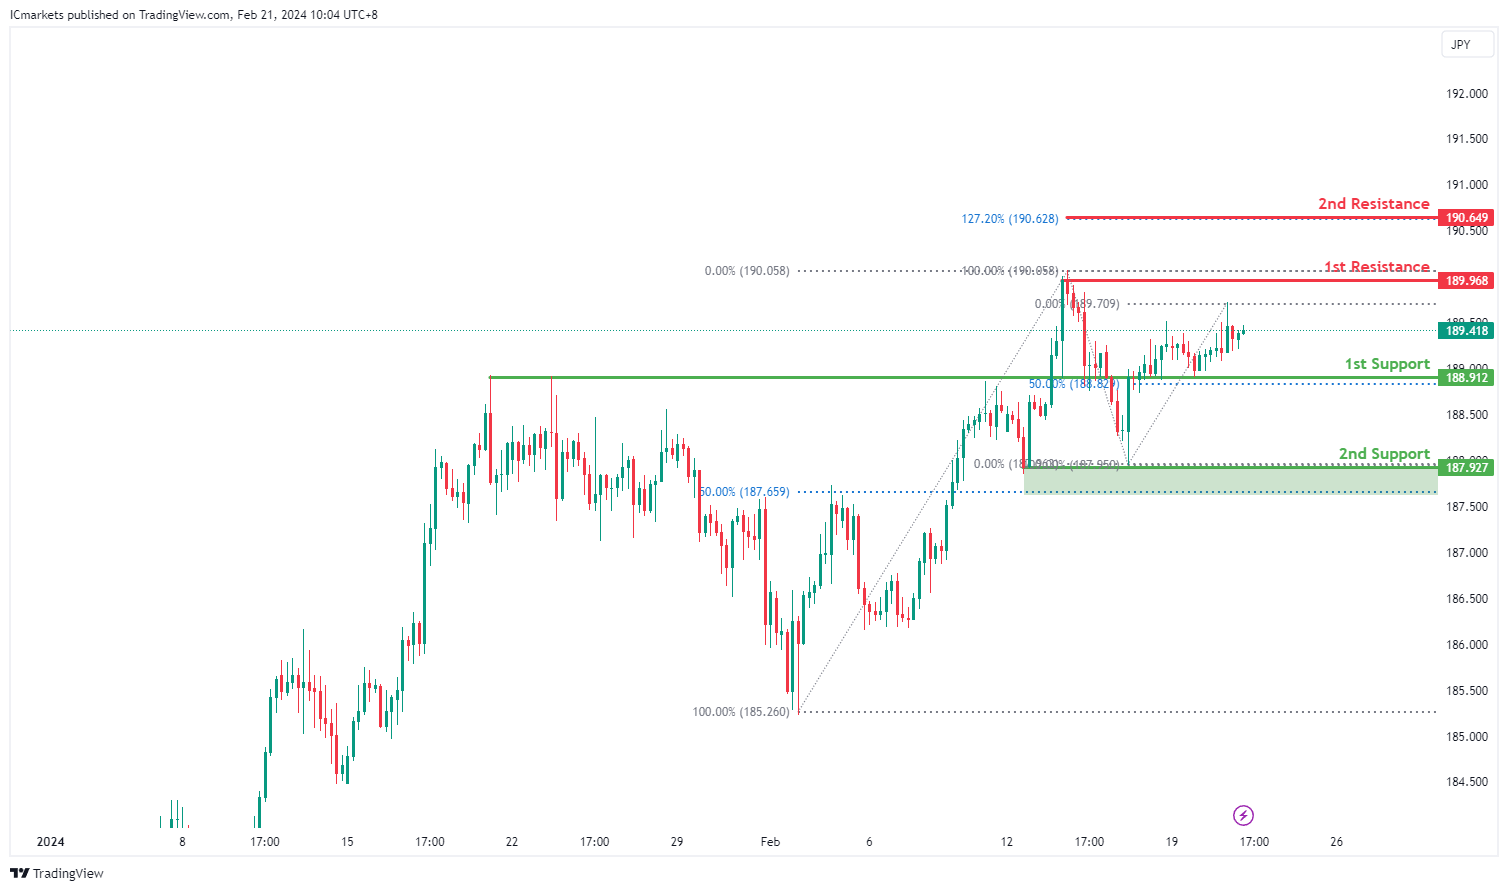
GBP/JPY:
The GBP/JPY chart currently exhibits a bullish momentum, indicating a potential continuation of the upward trend. Several factors support the possibility of a bullish movement towards the 1st resistance level.
The 1st support level at 188.912 aligns with both an overlap support and the 50% Fibonacci Retracement level, indicating a significant historical level where buying interest has emerged. Additionally, the 2nd support at 187.927 corresponds to a swing low support, further reinforcing its importance as a potential area of support.
On the resistance side, the 1st resistance level at 189.968 is identified as a point where selling pressure may increase, as it aligns with a swing high resistance. This level suggests a historical barrier to upward movement.
Furthermore, the 2nd resistance level at 190.649 coincides with the 127.20% Fibonacci Retracement, adding to its significance as a potential barrier to further bullish movement.
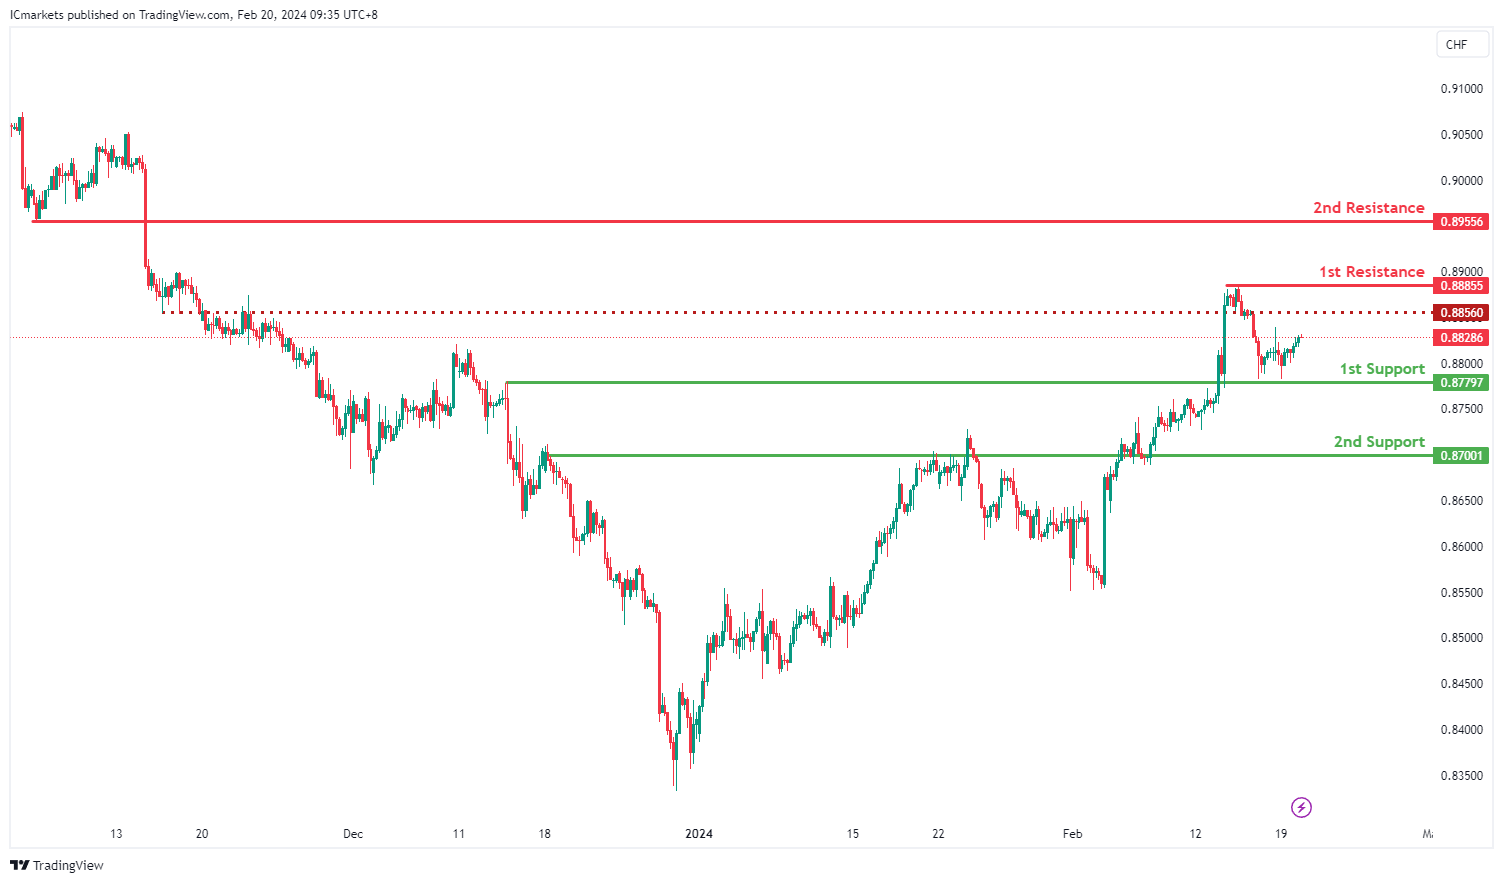
USD/CHF:
The USD/CHF chart currently reflects a bullish momentum, indicating a potential continuation towards the 1st resistance level.
The 1st support at 0.8779 is considered significant as it aligns with an overlap support, suggesting a historical level where buyers have previously intervened to support the price.
Similarly, the 2nd support at 0.8700 also serves as an overlap support, reinforcing its importance as a potential area where buying interest may emerge.
On the resistance side, the 1st resistance level at 0.8885 is identified as a multi-swing high resistance, indicating a historical point where selling pressure has been notable. This level could act as a significant barrier to further upward movement.
Likewise, the 2nd resistance at 0.8955 is characterized as a pullback resistance, suggesting its significance as a level where selling interest may intensify, potentially hindering further upward price movement.
An intermediate resistance level at 0.8839 is also identified, aligning with multi-swing high resistance. This level could provide additional resistance to the price if tested, further reinforcing the potential significance of resistance levels.
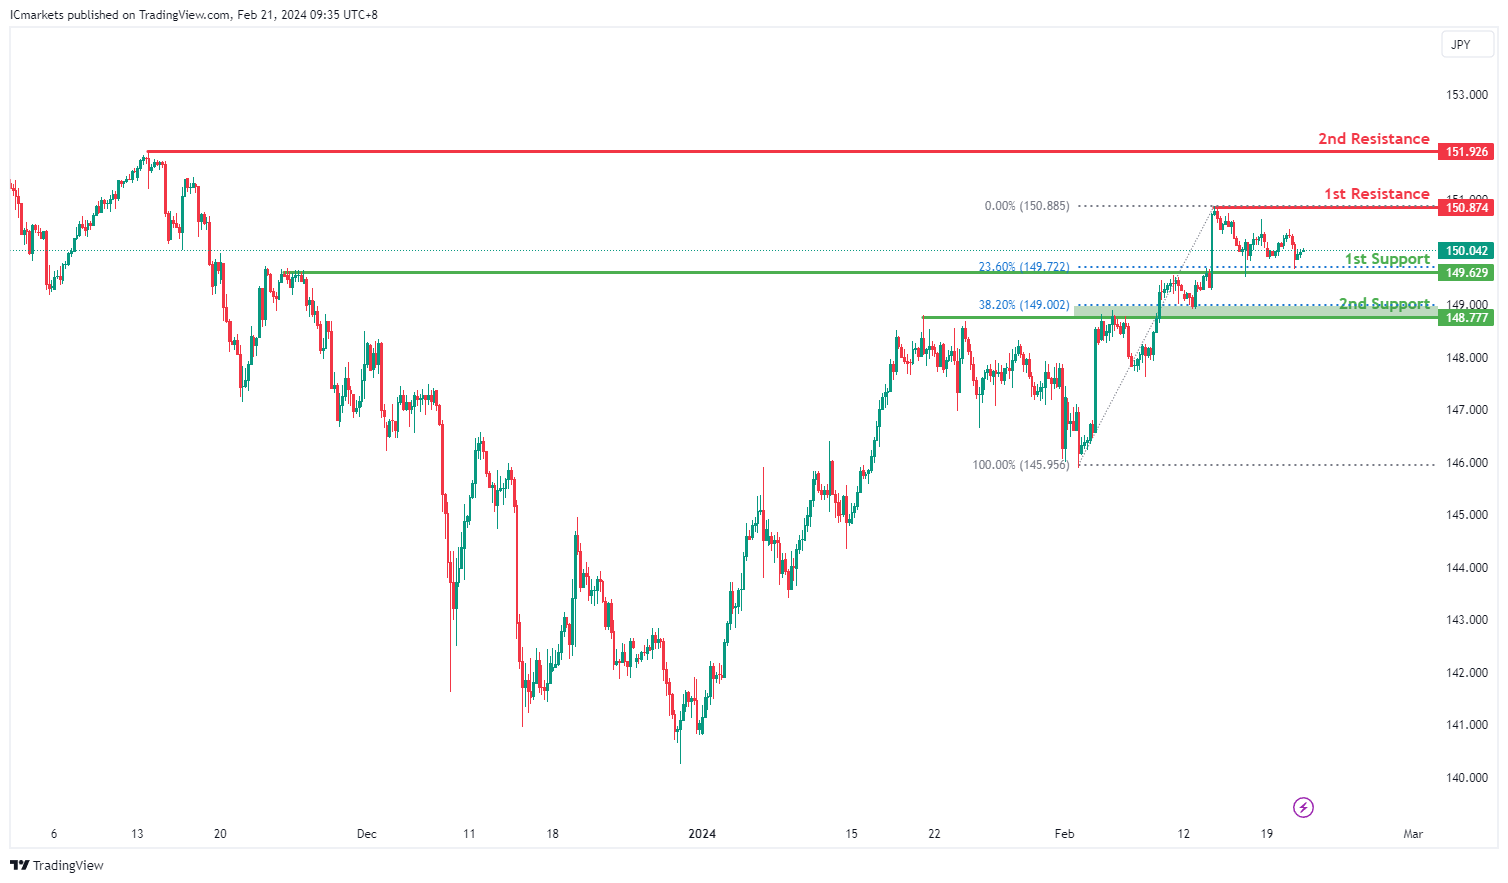
USD/JPY:
The USD/JPY chart currently exhibits a bullish momentum, suggesting a potential continuation towards the 1st resistance level.
The 1st support at 149.62 is notable as it aligns with both an overlap support and the 23.60% Fibonacci Retracement. This convergence indicates a significant historical level where buying interest has previously emerged, potentially providing support to the price if tested.
Similarly, the 2nd support at 148.77 corresponds to another overlap support and the 38.20% Fibonacci Retracement, further reinforcing its importance as a potential support zone. This level underscores a historical area where buyers have intervened to support the price.
On the resistance side, the 1st resistance level at 150.87 is identified as a swing high resistance, indicating a historical point where selling pressure may increase. This level could act as a barrier to further upward movement, potentially prompting a reversal or consolidation.
Similarly, the 2nd resistance at 151.92 also serves as a swing high resistance, highlighting its significance as another potential barrier to upward price movement.
USD/CAD:
The USD/CAD chart currently exhibits an overall bullish momentum. In this context, there is a potential scenario for price to rise towards the 1st resistance.
The 1st resistance level at 1.3542 is identified as an overlap resistance that aligns close to the 61.80% Fibonacci Retracement level. Higher up, the 2nd resistance level at 1.3586 is noted as a swing-high resistance, further highlighting its importance as a potential resistance point.
To the downside, the intermediate support level at 1.3467 is identified as a pullback support while the 1st support level at 1.3436 is also marked as a pullback support. Further below, the 2nd support level at 1.3371 is also noted as a pullback support that aligns close to the 127.20% Fibonacci Extension level, further emphasizing its importance as a potential support zone.
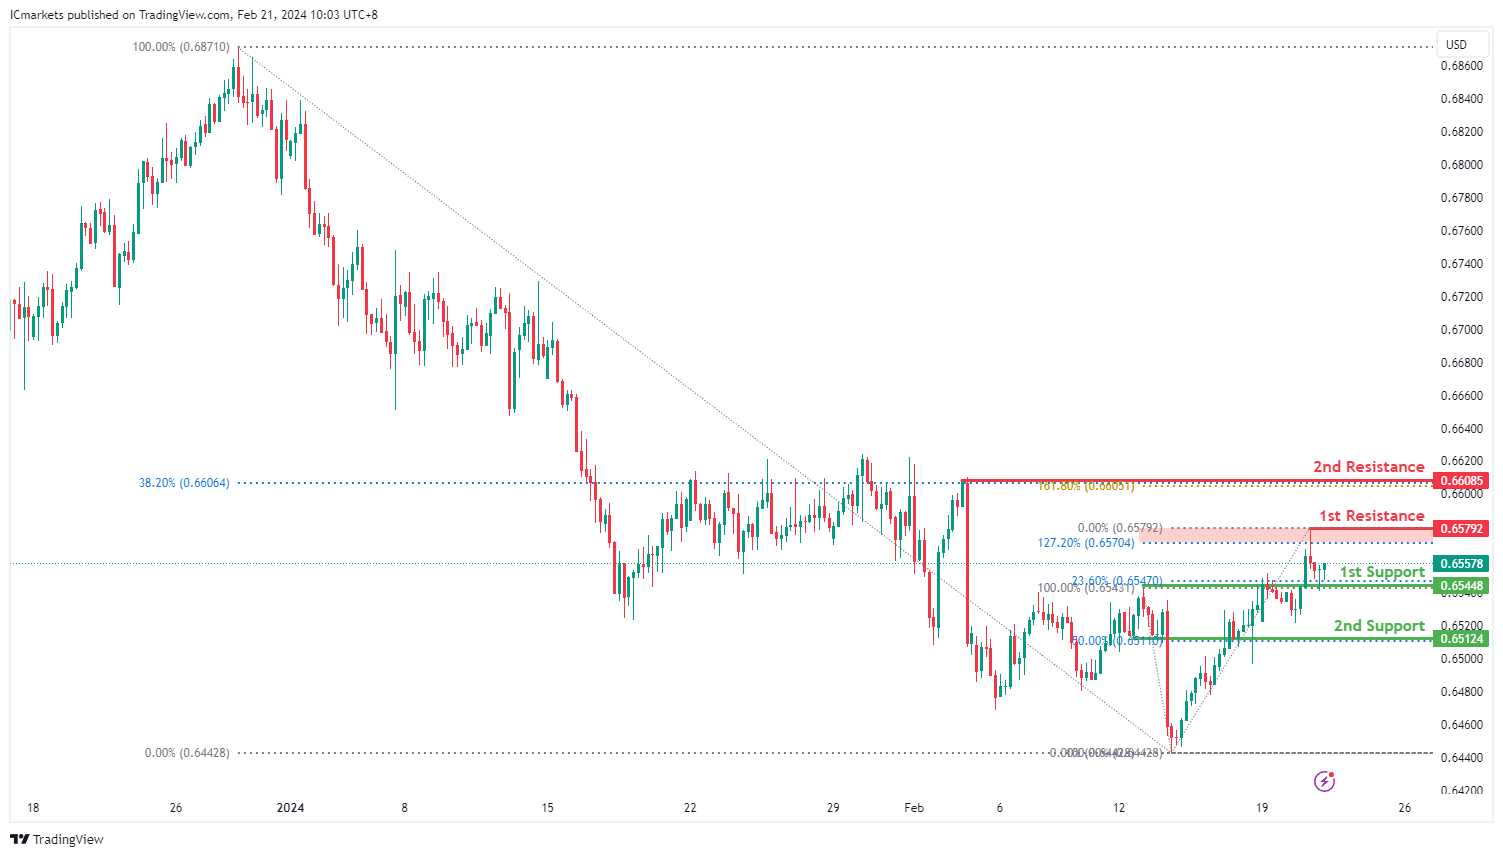
AUD/USD:
The AUD/USD chart currently exhibits an overall bullish momentum. In this context, there is a potential scenario for price to rise towards the 1st resistance.
The 1st resistance level at 0.6579 is identified as a pullback resistance that aligns close to the 127.20% Fibonacci Extension level. Higher up, the 2nd resistance level at 0.6608 is also marked as a pullback resistance that aligns with a confluence of Fibonacci levels i.e. the 38.20% Retracement and the 161.80% Extension, further highlighting its importance as a potential resistance point.
To the downside, the 1st support level at 0.6544 is identified as an overlap support that aligns with the 23.60% Fibonacci Retracement level. Further below, the 2nd support level at 0.6512 is noted as a pullback support that aligns with the 50.00% Fibonacci Retracement level, further emphasizing its importance as a potential support level.
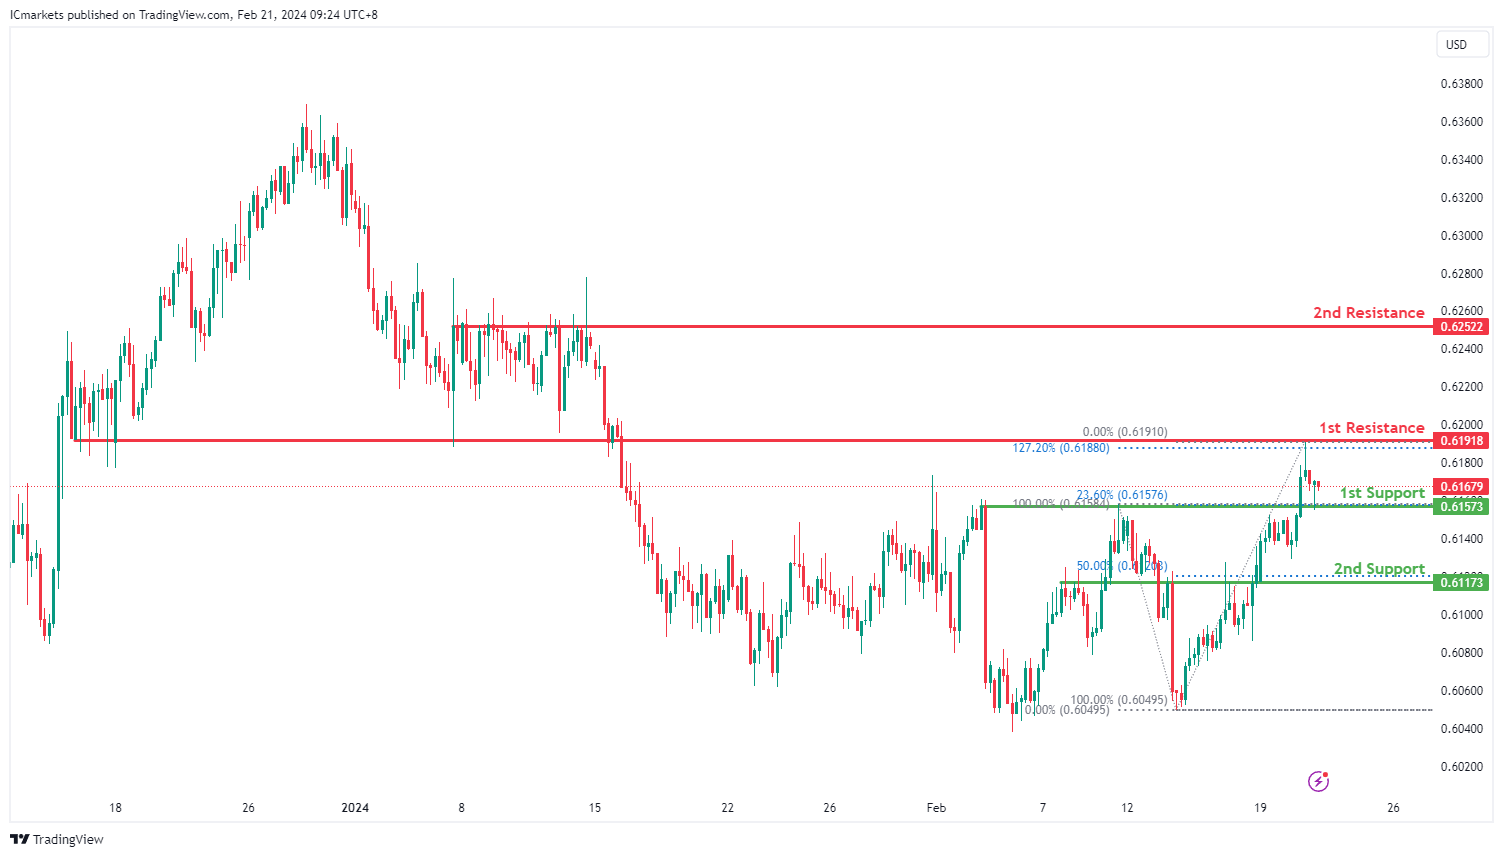
NZD/USD
The NZD/USD chart currently exhibits an overall bullish momentum. In this context, there is a potential scenario for price to rise towards the 1st resistance.
The 1st resistance level at 0.6191 is identified as an overlap resistance that aligns with the 127.20% Fibonacci Extension level. Higher up, the 2nd resistance level at 0.6252 is marked as a pullback resistance, further highlighting its importance as a potential resistance level.
To the downside, the 1st support level at 0.6157 is identified as an overlap support that aligns with the 23.60% Fibonacci Retracement level. Further below, the 2nd support level at 0.6117 is noted as a pullback support that aligns close to the 50.00% Fibonacci Retracement level, further emphasizing its importance as a potential support zone.
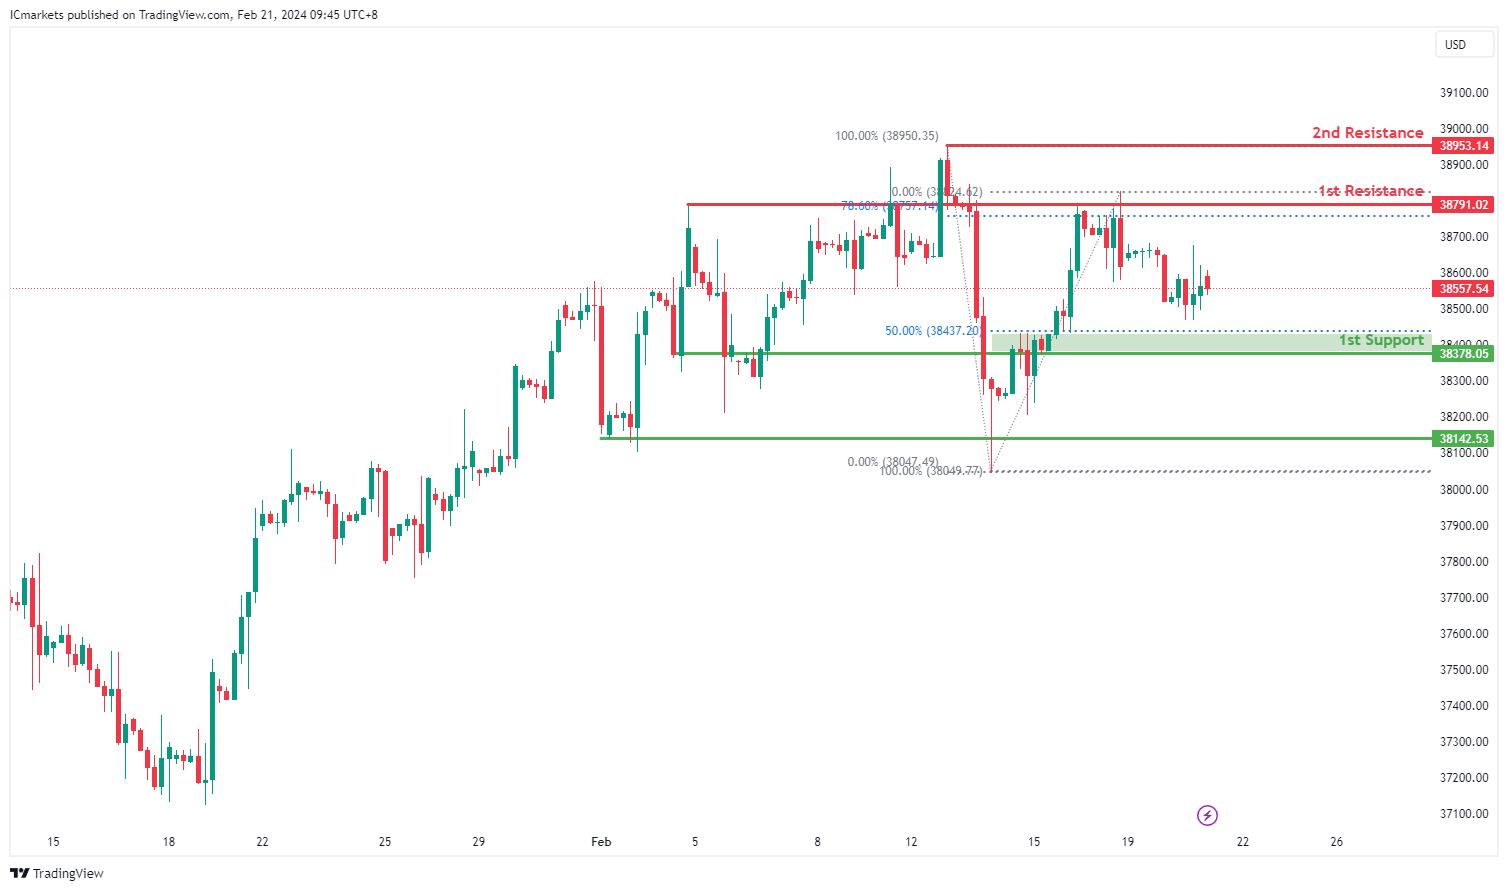
DJ30:
The DJ30 chart currently indicates a bearish momentum, suggesting a potential continuation of the downward trend. Several factors support the possibility of a bearish movement towards the 1st support level.
The 1st support at 38378.05 is significant as it coincides with both a pullback support and the 50% Fibonacci Retracement level. This convergence suggests a strong historical level where buying interest has previously emerged. Additionally, the 2nd support at 38142.53 reinforces the potential support zone, aligning with another pullback support.
On the resistance side, the 1st resistance level at 38791.02 is notable as it corresponds to a pullback resistance and the 78.60% Fibonacci Retracement level. This level represents a historical barrier to upward movement. Furthermore, the 2nd resistance at 38953.14 aligns with a swing high resistance, adding to its significance as a potential barrier to further bullish movement.
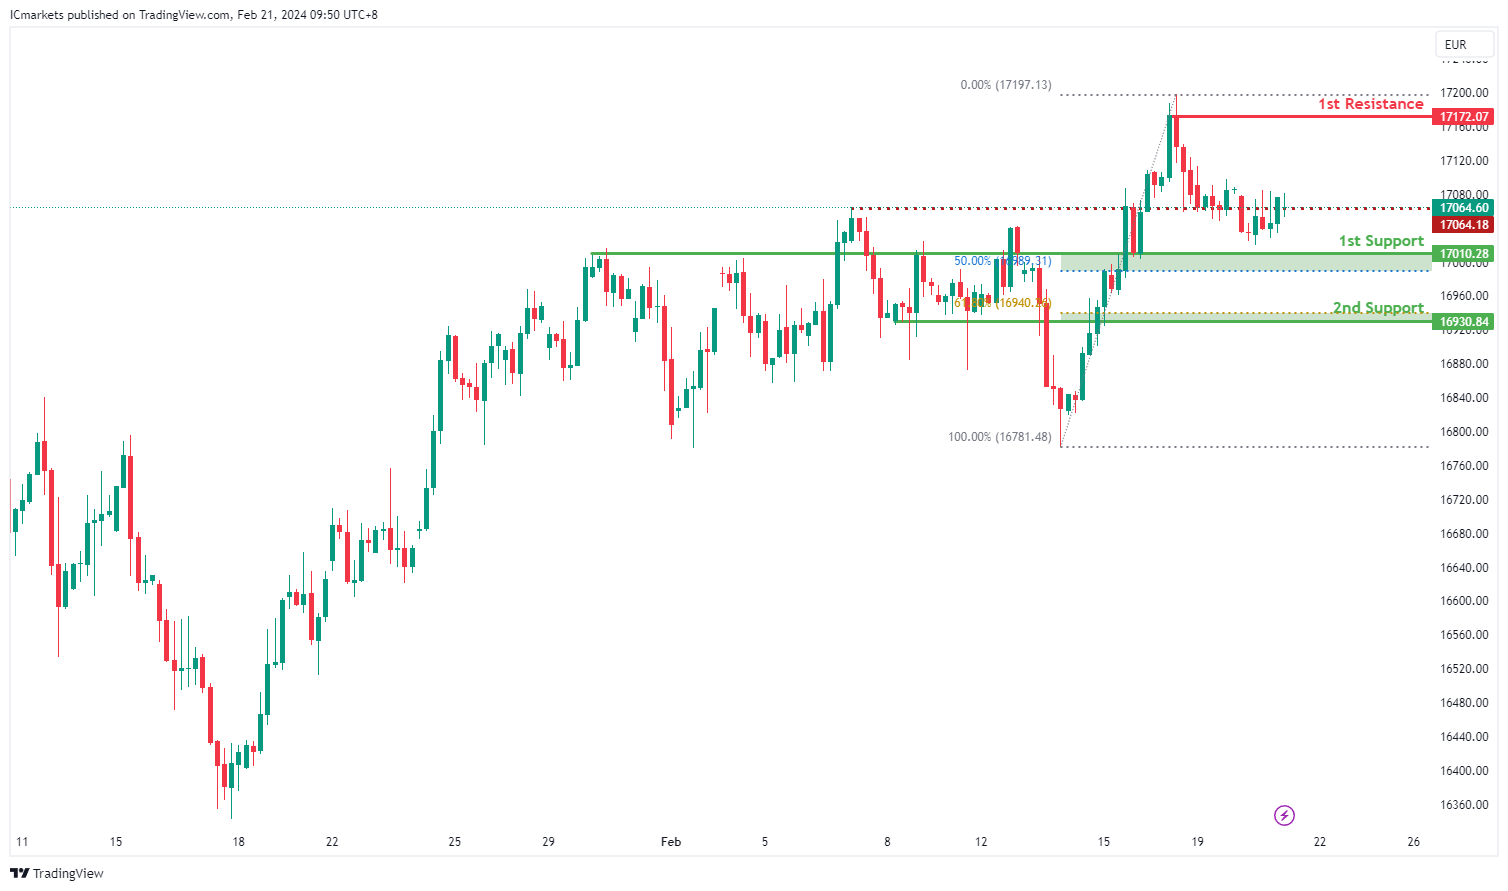
GER40:
The GER40 chart currently demonstrates a bullish momentum, suggesting a potential continuation of the upward trend. Several factors contribute to this bullish sentiment, supporting the possibility of a further upward movement towards the 1st resistance level.
The 1st support at 17010.28 is significant as it aligns with both an overlap support and the 50% Fibonacci Retracement level. This confluence indicates a strong historical level where buying interest has previously emerged. Additionally, the 2nd support at 16930.84 corresponds to a pullback support and the 61.80% Fibonacci Retracement level, reinforcing its importance as a potential support zone.
On the resistance side, the 1st resistance level at 17172.07 is notable as it represents a swing high resistance. This level suggests a historical barrier to further upward movement. Furthermore, the intermediate resistance at 17064.18 aligns with a swing high resistance, adding to its significance as a potential barrier to bullish movement.
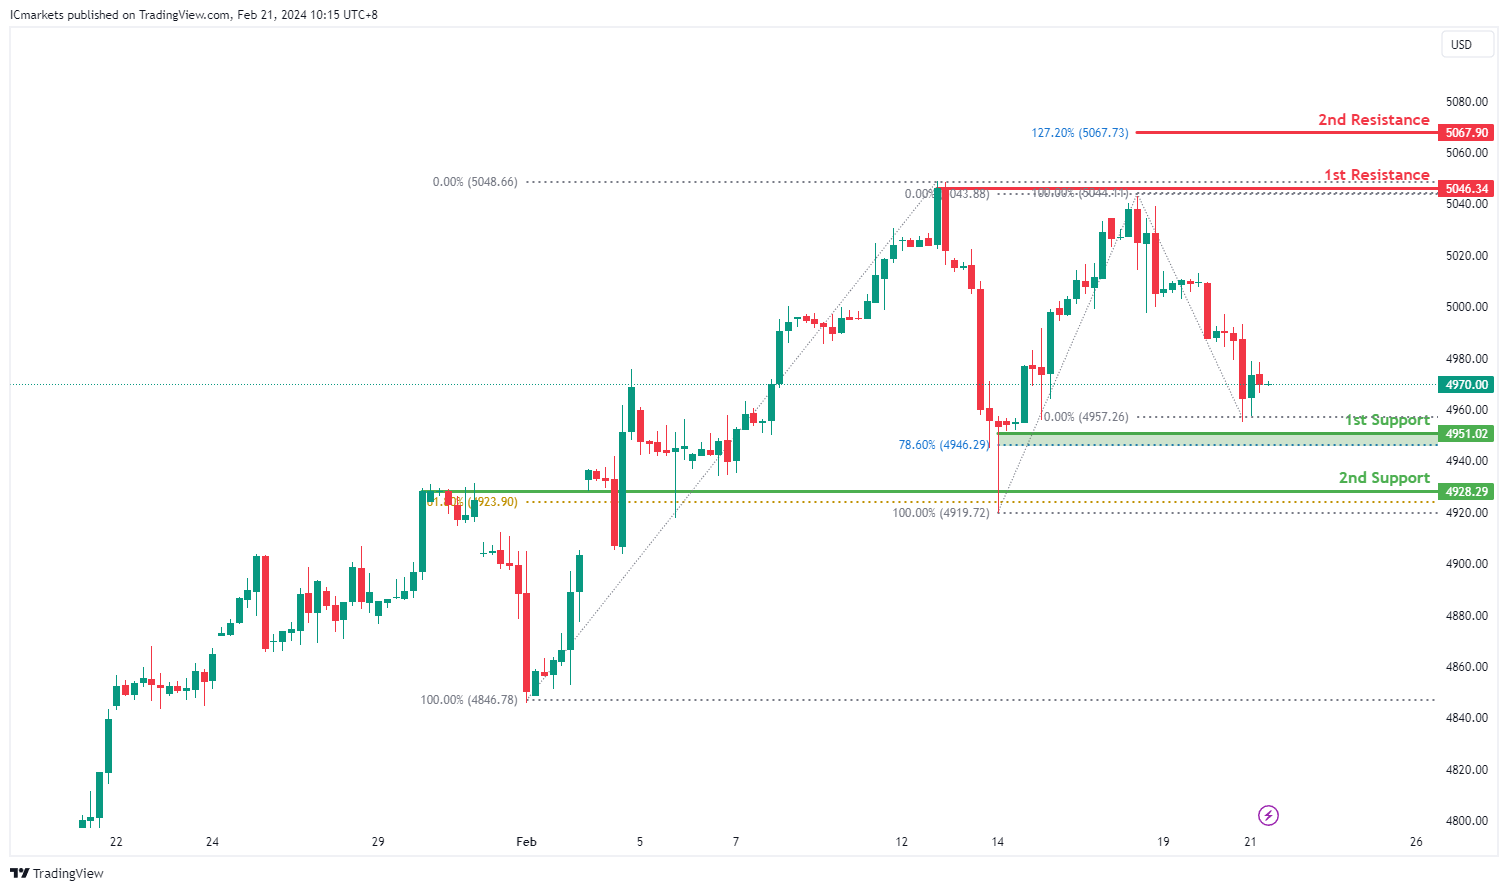
US500:
The US500 chart currently indicates a weak bullish momentum with low confidence, suggesting uncertainty in the market direction. However, several factors suggest a potential short-term scenario where the price could drop further to the 1st support before bouncing back towards the 1st resistance.
The 1st support level at 4951.02 is significant as it aligns with both a swing low support and the 78.60% Fibonacci Retracement level. This convergence indicates a strong historical level where buying interest might emerge, potentially providing support to the price. Additionally, the 2nd support at 4928.29 corresponds to an overlap support and the 61.80% Fibonacci Retracement level, reinforcing its significance as a potential support zone.
On the resistance side, the 1st resistance level at 5046.34 is identified as a swing high resistance. This level may act as a barrier to further upward movement. Furthermore, the 2nd resistance at 5067.90 coincides with the 127.20% Fibonacci Extension, adding to its significance as a potential resistance level.
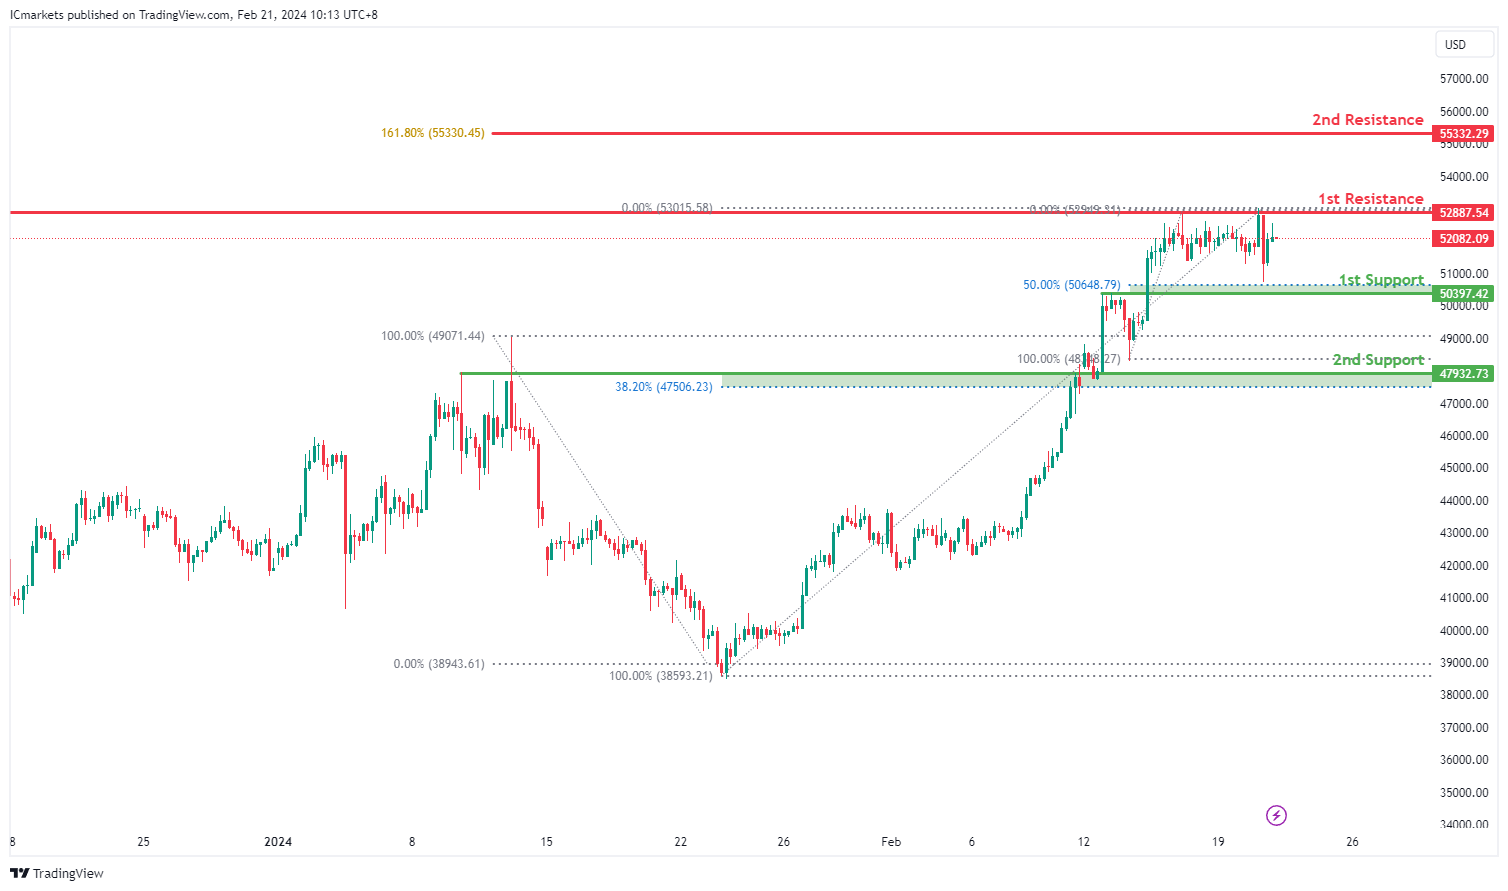
BTC/USD:
The BTC/USD chart currently shows a bullish momentum, indicating a potential continuation of the upward trend. Several factors contribute to this sentiment, supporting the possibility of a bullish movement towards the 1st resistance level.
The 1st support level at 50397.42 aligns with a pullback support and the 50% Fibonacci Retracement level. This convergence suggests a strong historical level where buying interest has emerged in the past. Additionally, the 2nd support at 47932.73 corresponds to an overlap support and the 38.20% Fibonacci Retracement, further reinforcing its significance as a potential support zone.
On the resistance side, the 1st resistance level at 52887.54 is identified as a multi-swing high resistance, indicating a historical barrier to upward movement. Furthermore, the 2nd resistance level at 55332.29 coincides with the 161.80% Fibonacci Extension, adding to its significance as a potential barrier to further bullish movement.
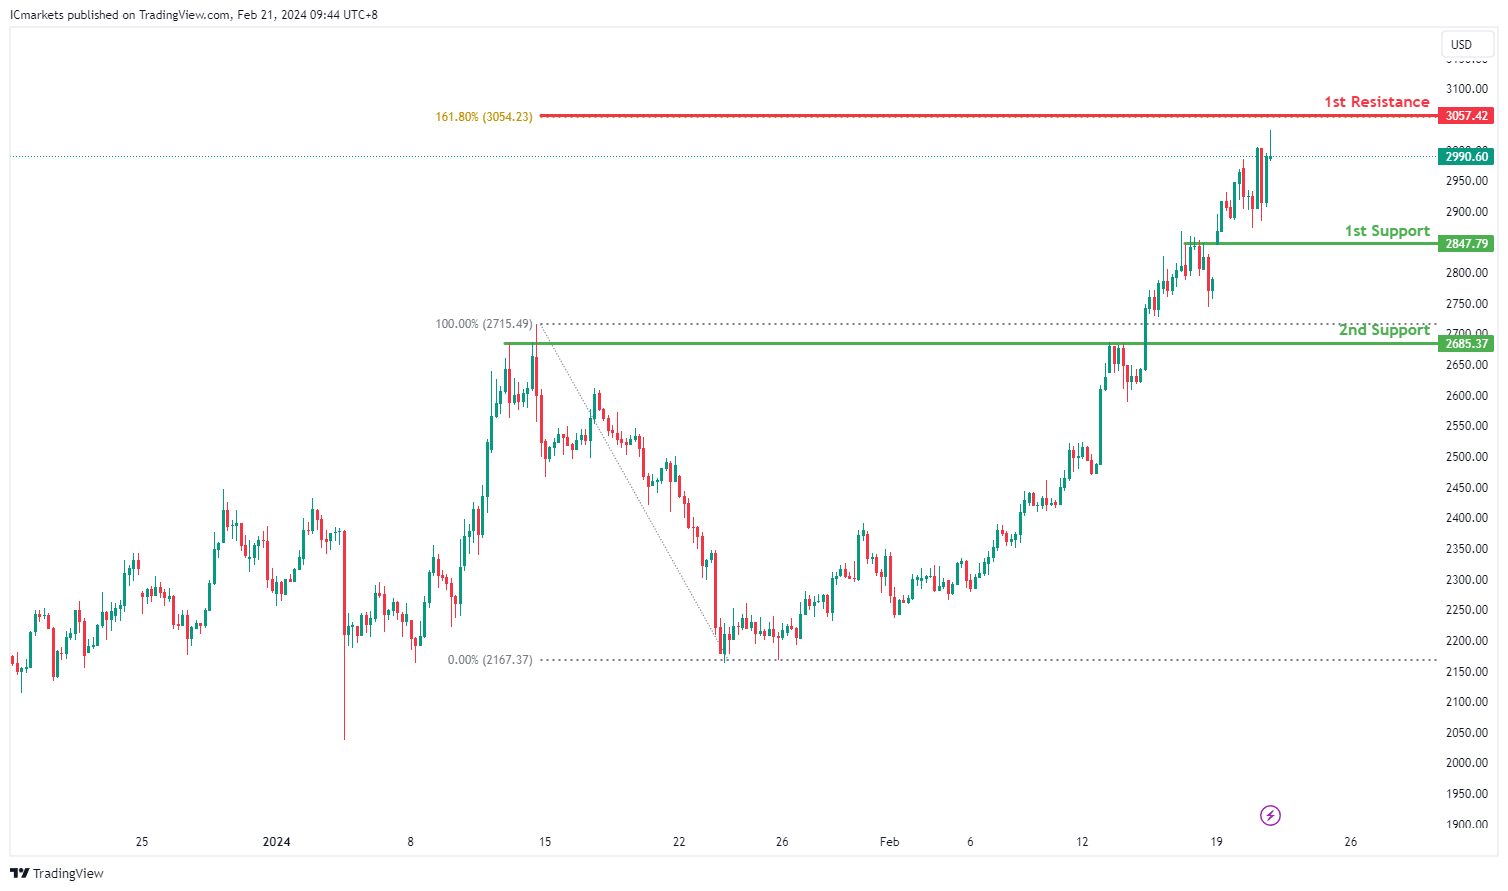
ETH/USD:
The ETH/USD chart currently exhibits bullish momentum, suggesting a potential continuation of the upward trend. Several factors support the possibility of a bullish movement towards the 1st resistance level.
The 1st support level at 2847.79 aligns with an overlap support, indicating a significant historical level where buying interest has emerged. Additionally, the 2nd support at 2685.37 corresponds to a pullback support, further reinforcing its importance as a potential area of support.
On the resistance side, the 1st resistance level at 3057.42 is identified as a 161.80% Fibonacci Extension. Fibonacci extensions are often used to identify potential levels of future resistance or support based on past price movements.
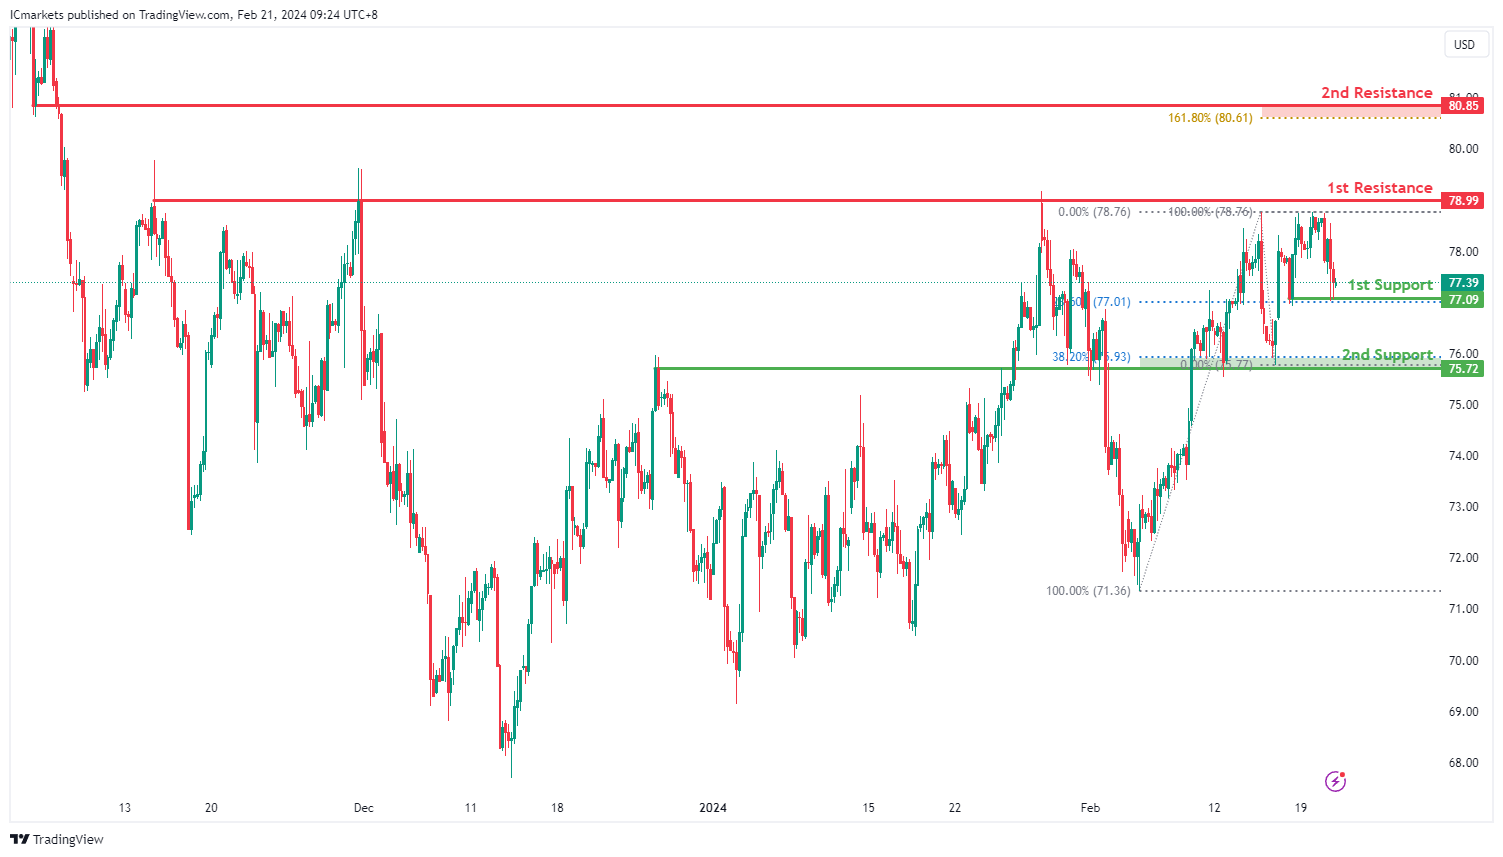
WTI/USD:
The WTI (West Texas Intermediate) chart currently exhibits an overall bullish momentum. However, there is a potential scenario for price to drop towards the 1st support before making a bullish bounce and rise towards the 1st resistance.
The 1st support level at 77.09 is noted as a pullback support that aligns with the 23.60% Fibonacci Retracement level. Further below, the 2nd support level at 75.72 is marked as an overlap support that aligns close to the 38.20% Fibonacci Retracement level, reinforcing its significance as a key support zone.
To the upside, the 1st resistance level at 78.99 is identified as a multi-swing-high resistance. Higher up, the 2nd resistance level at 80.85 is marked as a pullback resistance that aligns close to the 161.80% Fibonacci Extension level, further highlighting its importance as a potential resistance zone.
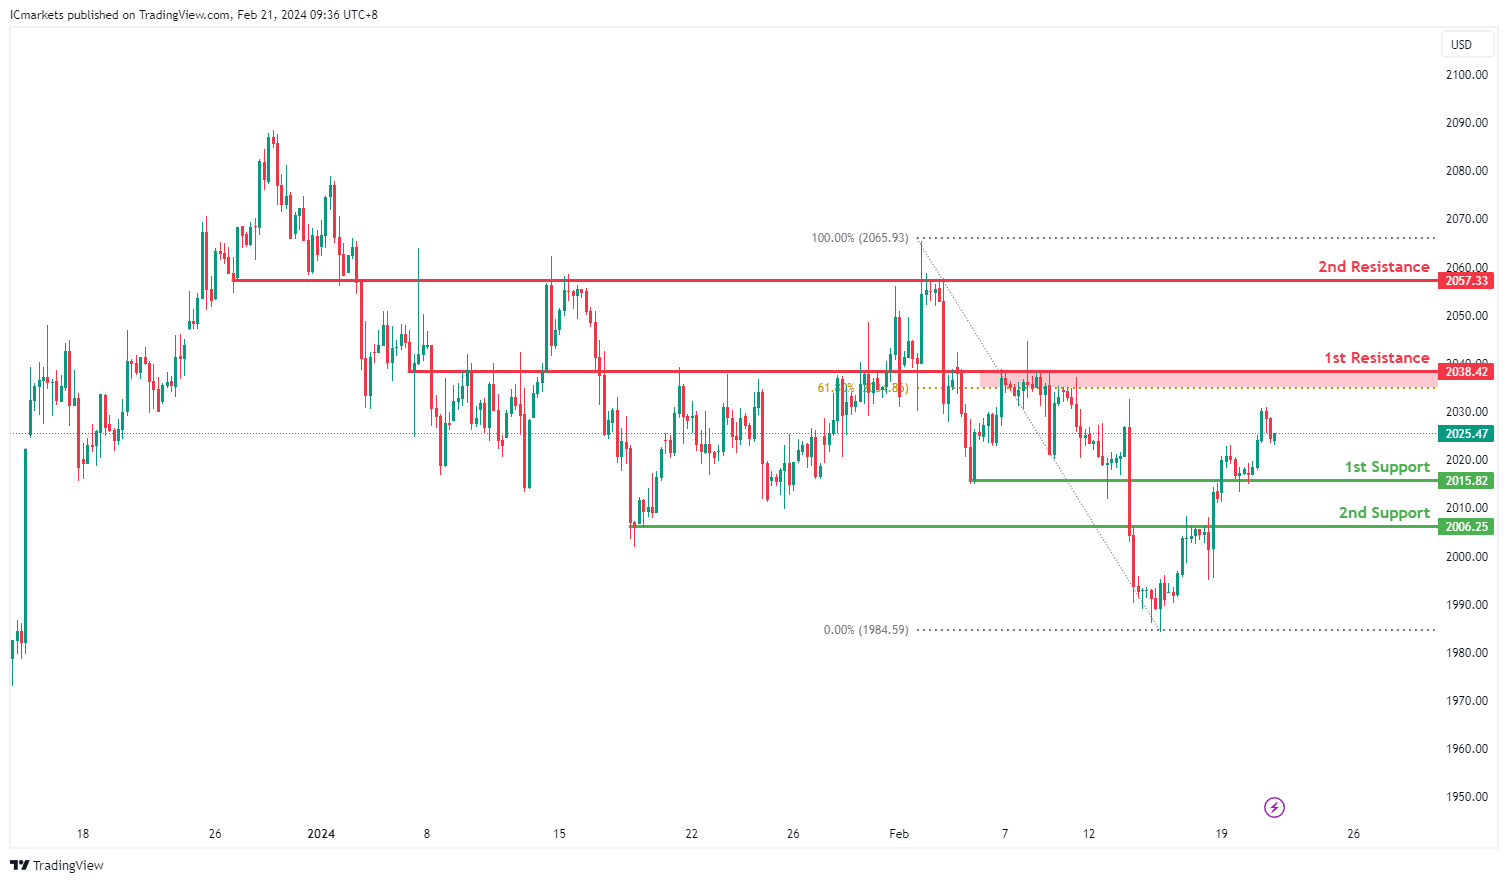
XAU/USD (GOLD):
The XAUUSD (Gold/US Dollar) chart currently demonstrates bullish momentum, suggesting a potential bullish bounce off the 1st support level followed by a movement towards the 1st resistance.
The 1st support level at 2015.82 is considered significant as it aligns with an overlap support, indicating a historical level where buying interest has been observed. This level may attract buyers, potentially leading to a bounce in the price.
Additionally, the 2nd support at 2006.25 is identified as a pullback support, further reinforcing its importance as a level where buyers may step in to support the price. This level indicates a potential retracement area where buying interest could be renewed.
On the resistance side, the 1st resistance level at 2038.42 is characterized as an overlap resistance, suggesting its significance as a historical barrier where selling pressure may increase. This level could act as a hurdle for further upward movement in the price of gold.
Similarly, the 2nd resistance at 2057.33 is identified as an overlap resistance, indicating its importance as a level where selling interest may intensify, potentially limiting upward price movement.
Japan’s exports rises 11.9% yoy in Jan, imports down -9.6% yoy
Japan's export recorded 11.9% yoy increase to JPY 7333B in January, marking the second consecutive month of growth. However, imports saw a contrasting trend, decreasing by -9.6% yoy to JPY 9091B. This resulted in a trade deficit of JPY -1758B for the month.
A notable highlight from the trade data was Japan's trade surplus with the US, amounting to JPY 415B, as exports reached an all-time high for the month at JPY 1.42T.
Conversely, Japan faced a JPY -959.52B trade deficit with China, another significant trading partner. Despite this deficit, exports to China were supported by strong demand for chip-making equipment and cars.
On seasonally adjusted basis, exports registered decline of -3.6% mom to JPY 8765B, while imports fell more sharply by -10.5% mom to JPY 8230B. This shift led to trade surplus of JPY 235B.
Australia’s Q4 wage growth hits 4.2%, driven by sharp public sector increase
Australia's wage price index rose 0.9% qoq in Q4, decelerating from the previous quarter's 1.3% qoq increase, but in line with market expectations. Annually, wage growth ticked up from 4.1% yoy to 4.2% yoy, marking the highest rate since Q1 2009.
A closer look at sector-specific data reveals that private sector annual wage growth slowed slightly from 4.3% yoy to yoy. In contrast, public sector wage growth accelerated sharply from 3.5% yoy to 4.3% yoy, the highest rate since Q1 2010.
The surge in public sector wages underscores the impact of cyclical patterns of enterprise bargaining, as highlighted by Michelle Marquardt, ABS head of prices statistics. She noted, "In the December quarter 2023, 38 percent of public sector jobs saw a wage rise, considerably higher than the 29 percent from the same quarter in the previous year."
Furthermore, average hourly wage change for these jobs escalated to 4.3%, surpassing 2.8% recorded at the same time last year and achieving the highest level since September 2008.
Australia Westpac leading index falls to -0.25%, sub-par growth to continue
Australia's economy is bracing for continued "sub-par growth" into 2024, as indicated by the downturn in the Westpac Leading Index, which dipped from -0.01% to -0.25% in January. Westpac anticipates the economic growth rate to hover around an annualized 1.3% in the first half of this year, marking an improvement from the latter half of 2023's 0.8%, yet remaining significantly below the usual trend rate of about 2.5%.
In the realm of monetary policy, Westpac's analysis suggests a measured approach by RBA. The central bank is expected to take additional time to gain "sufficient confidence" that inflation will revert to target range within a reasonable timeframe. Economic indicators leading up to the March meeting are projected to reinforce a narrative of "weak growth and demand environment domestically," which would justify RBA's decision to maintain its current policy stance.
This cautious period of observation is likely to precede any shift towards a more definitive "on hold" position by the Board, with considerations for interest rate cuts anticipated to emerge further down the line.
Bank of Canada’s Policy Pirouette Not Yet Complete
Summary
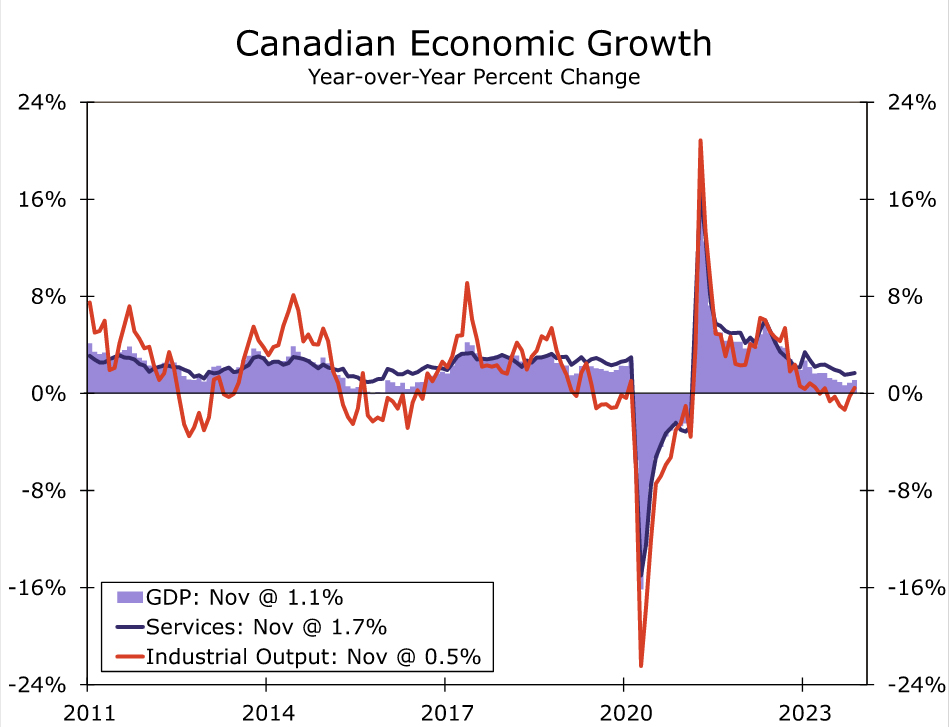
- Canadian economic trends have been mixed, but softer on balance. GDP shrank in Q3 but appears to have rebounded in Q4. Still, given a softening labor market, modest growth in household income and rising interest rates, and a subdued outlook for business and investment spending, we expect Canadian GDP growth to slow moderately to 0.9% in 2024.
- With the economy downshifting to a lower gear, the Bank of Canada shifted focus at their January monetary policy announcement. The central bank held rates steady and, acknowledging slower growth and some improvement in inflation, said it has shifted from discussing whether the policy rate is restrictive enough to restore price stability, to how long it needs to stay at the current level.
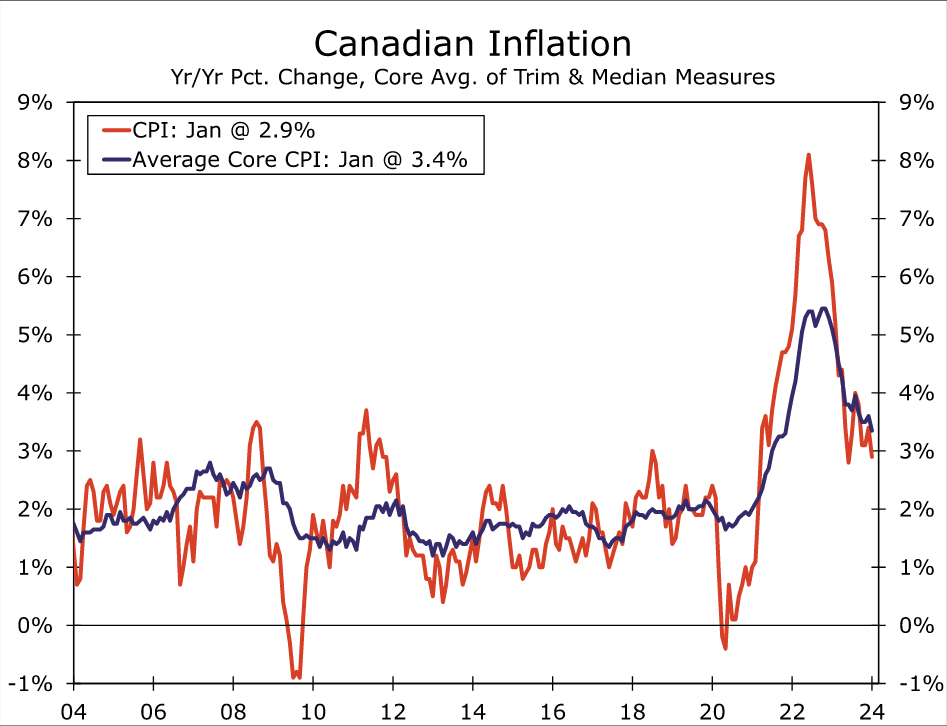
- The Bank of Canada received encouraging news from the January CPI, which showed both core and headline inflation slowing more than expected. However, some measures of services inflation remain elevated, while the three-month annualized change of the core CPI is still some way above the 2% inflation target.
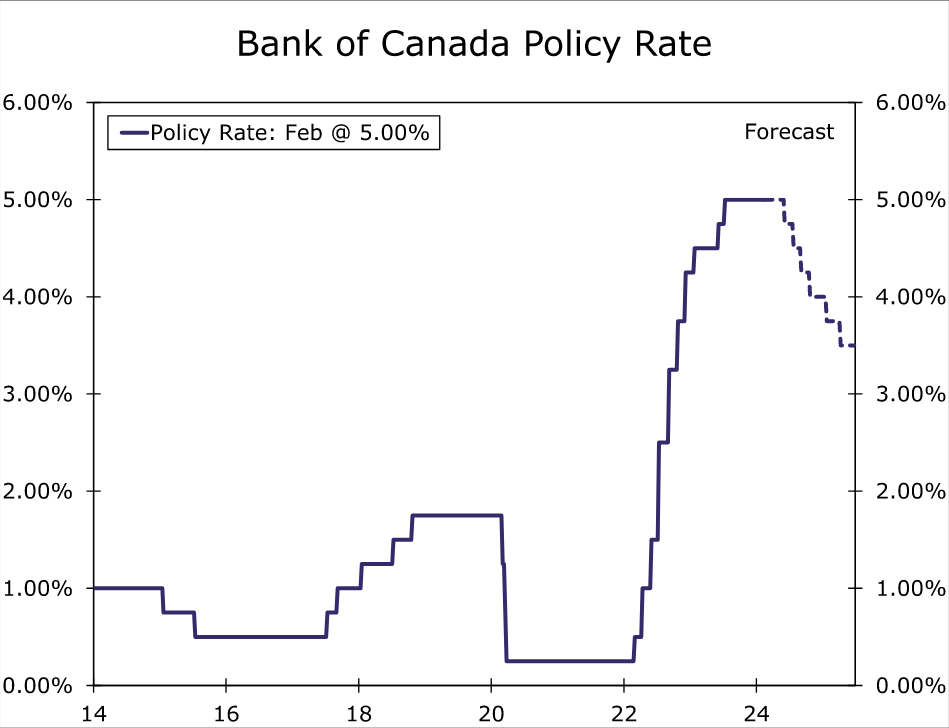
- We still think it is too early for the central bank to cut rates just yet. While an April move is potentially in play if growth softens further and inflation slows further, we still view June as the more likely timing for an initial 25 bps rate cut. More broadly, we forecast a cumulative 100 bps of rate cuts this year, which would see the policy rate finish 2024 at 4.00%.
Canadian Economy Softening, Slowly and Quite Surely
The news from Canada's economy has been mixed in recent months but, we believe, remains consistent with an overall ebbing in the pace of economic expansion. Indeed, Canadian GDP shrank during the third quarter, before perking up a bit during Q4. In November, Canada's GDP rose 0.2% month-over-month, a bit more than expected, while Statistics Canada advance estimate is for a further 0.3% gain in December. If realized, that would see Q4 GDP expand by around 1.2% quarter-over-quarter annualized, essentially reversing the decline in the third quarter.
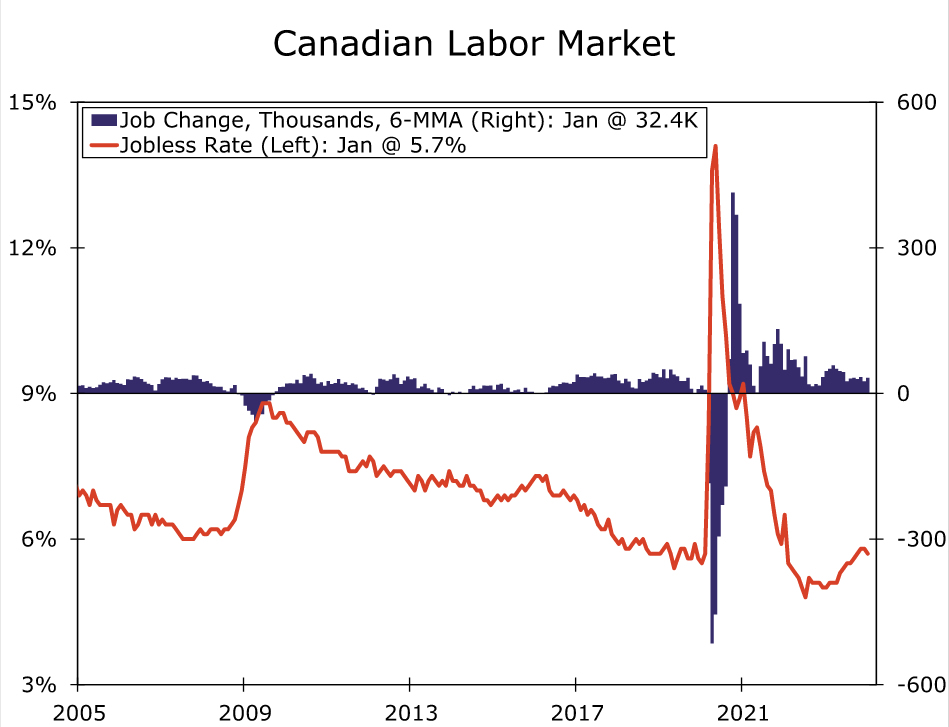
The increase in fourth quarter GDP may, however, prove to be only a brief interruption to generally disappointing growth performance. Notably, the labor market still appears to be following a gradually softening trend. The latest jobs report for January did show a jump in employment, of 37,300, although the gain the was driven by part-time and public-sector jobs. Full-time employment actually fell by 11,600 in January, a second straight decline, while private-sector employees rose by a modest 7,400. The unemployment rate fell slightly to 5.7%, but is still up from a low of 4.9% in mid-2022. Thus, despite the flattering headlines, we still view the January report as consistent with a gradual softening in labor market conditions.
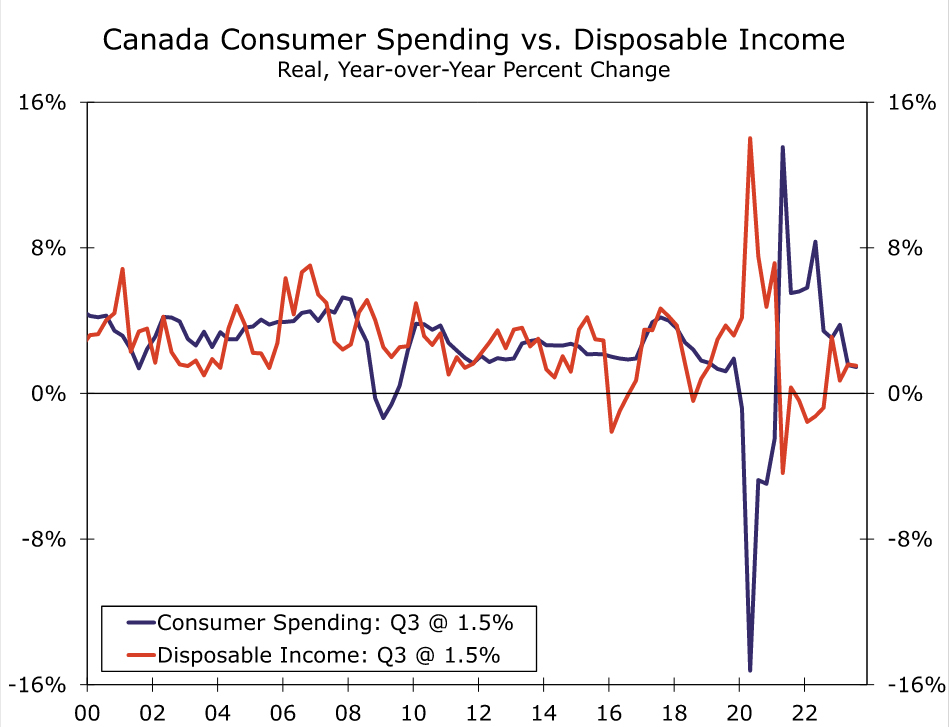
Other household finance fundamentals are also consistent with only moderate gains in consumer spending, in our view. Slower inflation has seen growth in real household disposable income return to positive territory although, at 1.5% year-over-year in Q3-2023, the growth in real income is only just keeping pace with a similar sized gain in consumer spending over the past four quarters. In addition, a significant rise in household debt servicing costs poses a potential headwind for consumer spending. By Q3-2023, interest costs as a proportion of household disposable income had risen to 9.3%, while total debt servicing costs had risen to 15.2%, both multi-year highs. Overall, we see few reasons to expect a strong upswing in consumer spending over the next several quarters.
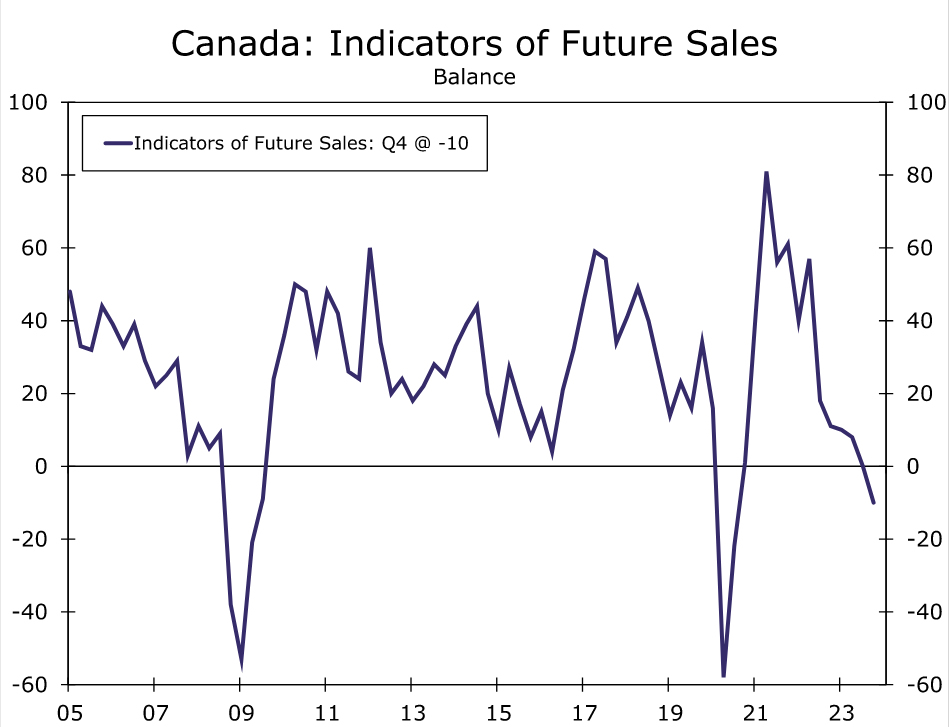
Meanwhile, the outlook for businesses also continues to cool. In the Bank of Canada's Q4 business survey, the central bank's overall Business Outlook Indicator improved slightly, albeit remaining at depressed levels. In contrast, the Indicator of Future Sales softened further to a net balance of -10 which, apart from the pandemic, is the weakest reading since 2009. Elsewhere, growth in corporate profits remains on an overall slowing trend and industrial capacity utilization has dropped below 80%, factors which could restrain investment spending going forward. Given the consumer and business backdrop, and even with the prospect of a soft landing for the U.S. economy, we forecast Canadian GDP growth to slow slightly to 0.9% in 2024, from 1.1% in 2023.
Bank of Canada's Monetary Policy Pivot Underway
With the Canadian economy downshifting to a lower gear, Bank of Canada (BoC) policymakers announced a shift in focus at their January monetary policy meeting. The BoC held its policy rate at 5.00% and said it would continue with its policy of quantitative tightening. Regarding activity, the central bank said that with “weak growth, supply has caught up with demand and the economy now looks to be operating in modest excess supply.” For 2024 the central bank forecasts GDP growth of 0.8%, slightly below our own forecast. The central bank also said that labor market conditions have eased, but that wage growth remains elevated.
The BoC's inflation assessment was less sanguine. The central bank observed that shelter costs remain the biggest contributor to above target inflation and that, while corporate pricing behavior is normalizing and evidence of reduced price pressures is becoming more widespread, core measures of inflation are not showing sustained declines. Accordingly, the BoC said it is “still concerned about risks to the outlook for inflation, particularly the persistence in underlying inflation” and that it “wants to see further and sustained easing in core inflation.”
In a significant shift in policy guidance, the BoC removed its tightening bias at its January meeting, with its formal announcement no longer indicating the central bank “remains prepared to raise the policy rate further if needed.” BoC Governor Macklem described this as a shift in focus for policymakers from discussing whether the policy rate is restrictive enough to restore price stability, to how long it needs to stay at the current level. In other words, the conversation has shifted from “how high” the policy rate needs to go, to “how long” it needs to stay at an elevated level. Macklem added that monetary policy is working to relieve price pressures, and that the central bank needs to “stay the course.”
Following the Bank of Canada's pivot, the latest news on the inflation front offers some encouragement that a policy rate cut might be coming closer in the months ahead. The latest inflation news was a favorable surprise, as the headline CPI slowed more than expected to 2.9% year-over-year, and the average core CPI also slowed more than forecast to 3.4%. That said, some other measures of services sector inflation continue to show some persistence, as shelter costs rose 6.2% and services inflation rose 4.2%. Meanwhile, the three-month annualized gain in the average core CPI, an important metric that is closely followed by the Bank of Canada, rose at a 3.2% pace. That was down from the 3.6% reading in December, but still ways above the central bank's 2% inflation target. As a result, we still think it is too early for the Bank of Canada to lower interest rates just yet. We expect the BoC to stay on hold through March and April, and do not see a rate cut coming before June. We believe Bank of Canada rate cuts will be contingent on continued soft economic growth, as well as labor market trends that begin to weigh more noticeably on wage and price growth. We also think the Bank of Canada will be more comfortable considering rate cuts if core inflation is trending more convincingly in a 2.5%-3.0% range, and once wage growth slows nearer 4%.
While it's possible those conditions could transpire by April, we believe it is more likely those conditions will be met by June, and our view remain for an initial 25 bps rate cut to be delivered at the June announcement. For all of 2024, we expect a cumulative 100 bps of rate cuts from the Bank of Canada, just a little less than the cumulative 125 bps of rate cuts from the Federal Reserve over the same period. Moreover, in both Canada and the United States we anticipate subdued economic growth, but no recession. Canada's economic and monetary policy backdrop has restrained the Canadian currency during the early part of 2024, a trend that could continue for the time being. Given a broadly similar growth and monetary policy outlook for Canada and the United States, its also possible the Canadian dollar could be an underwhelming performer over the medium-term. In fact, even by the end of 2024 we see only modest gains in the Canadian currency, forecasting a USD/CAD exchange rate CAD1.3300 by the end of this year.
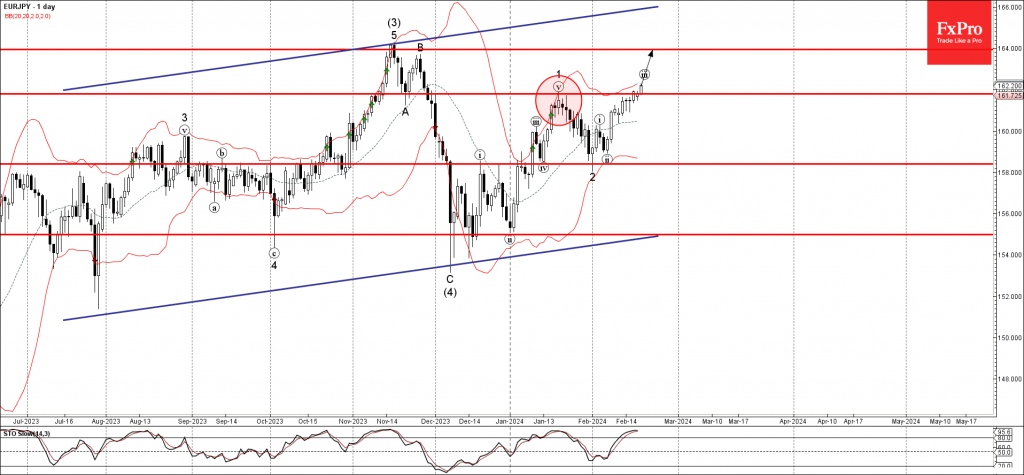
EURJPY Wave Analysis
- EURJPY broke resistance level 161.80
- Likely to rise to resistance level 164.00
EURJPY currency pair continues to rise steadily after the price broke the resistance level 161.80 (which stopped the previous minor impulse wave 1 in the middle of January).
The breakout of the resistance level 161.80 accelerated the active short-term impulse wave iii of the higher order intermediate impulse wave (5).
Given the predominant daily uptrend, EURJPY currency pair can be expected to rise further to the next resistance level 164.00, which stopped sharp wave (3) in November.