Sample Category Title
Bitcoin Completes Consolidation and Rushes to the High
Market Picture
The crypto market made an impressive move higher, rising 3.4% in 24 hours to $1.71 trillion. The rise to its highest level since 12 January came as the S&P500 and Nasdaq-100 indices hit all-time highs.
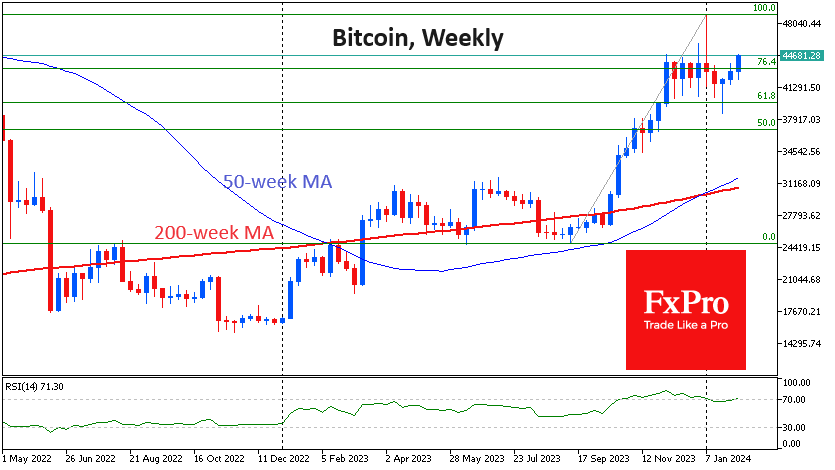
Bitcoin rose above its 50-day moving average, confirming the bullish medium-term trend and easing fears of a deeper correction. On a weekly basis, bitcoin is now above its December-January closing levels, although intra-week volatility briefly pushed the price higher earlier in the year. However, weekly closes are the more important benchmark for the markets.
Technically, bitcoin and the broader crypto market have gained strength after a long period of consolidation and are now poised to make new highs. The Fibonacci pattern is almost perfect: the rally from $25K to $49K ended with a 61.8% retracement of the initial move. Theoretically, a break of the highs at $49K would confirm the pattern and make $64K (161.8%) a target.
News Background
MicroStrategy bought an additional 850 BTC worth $37.2 million in January, bringing its reserves in the first cryptocurrency to 190,000 BTC (around $8.5 billion) at an average price of $31,224.
According to CoinLedger, the average realised gain for crypto investors in 2023 was $887.6, compared to a loss of $7,102 in the previous year.
The US SEC has delayed a decision on applications for spot Ethereum ETFs from Invesco and Galaxy. ‘The only date that matters for spot ETH ETFs at this point is 23 May. That’s the deadline for VanEck’s application’, notes Bloomberg.
Ethereum developers have successfully implemented the Dencun (Deneb-Cancun) update on the Holesky test network. It is expected to reduce commissions for L2 solutions based on roll-up technology by around ten times.
Thailand’s Ministry of Finance announced that crypto trading will be exempt from value-added tax. The agency aims to encourage the country’s transformation into a hub for digital assets and promote them as an alternative means of raising capital.
The CEO of South Korean cryptocurrency exchange Bitsonic, Jinwook Shin, was sentenced to seven years in prison for his involvement in a 10 billion won ($7.5 million) fraud scheme.
According to TheMinerMag, bitcoin mining by US miners fell to historic lows in January due to a 29-50% increase in electricity prices. High electricity costs are expected to continue until the end of the first quarter of 2024.
Australian Dollar Dips as China’s Inflation Declines
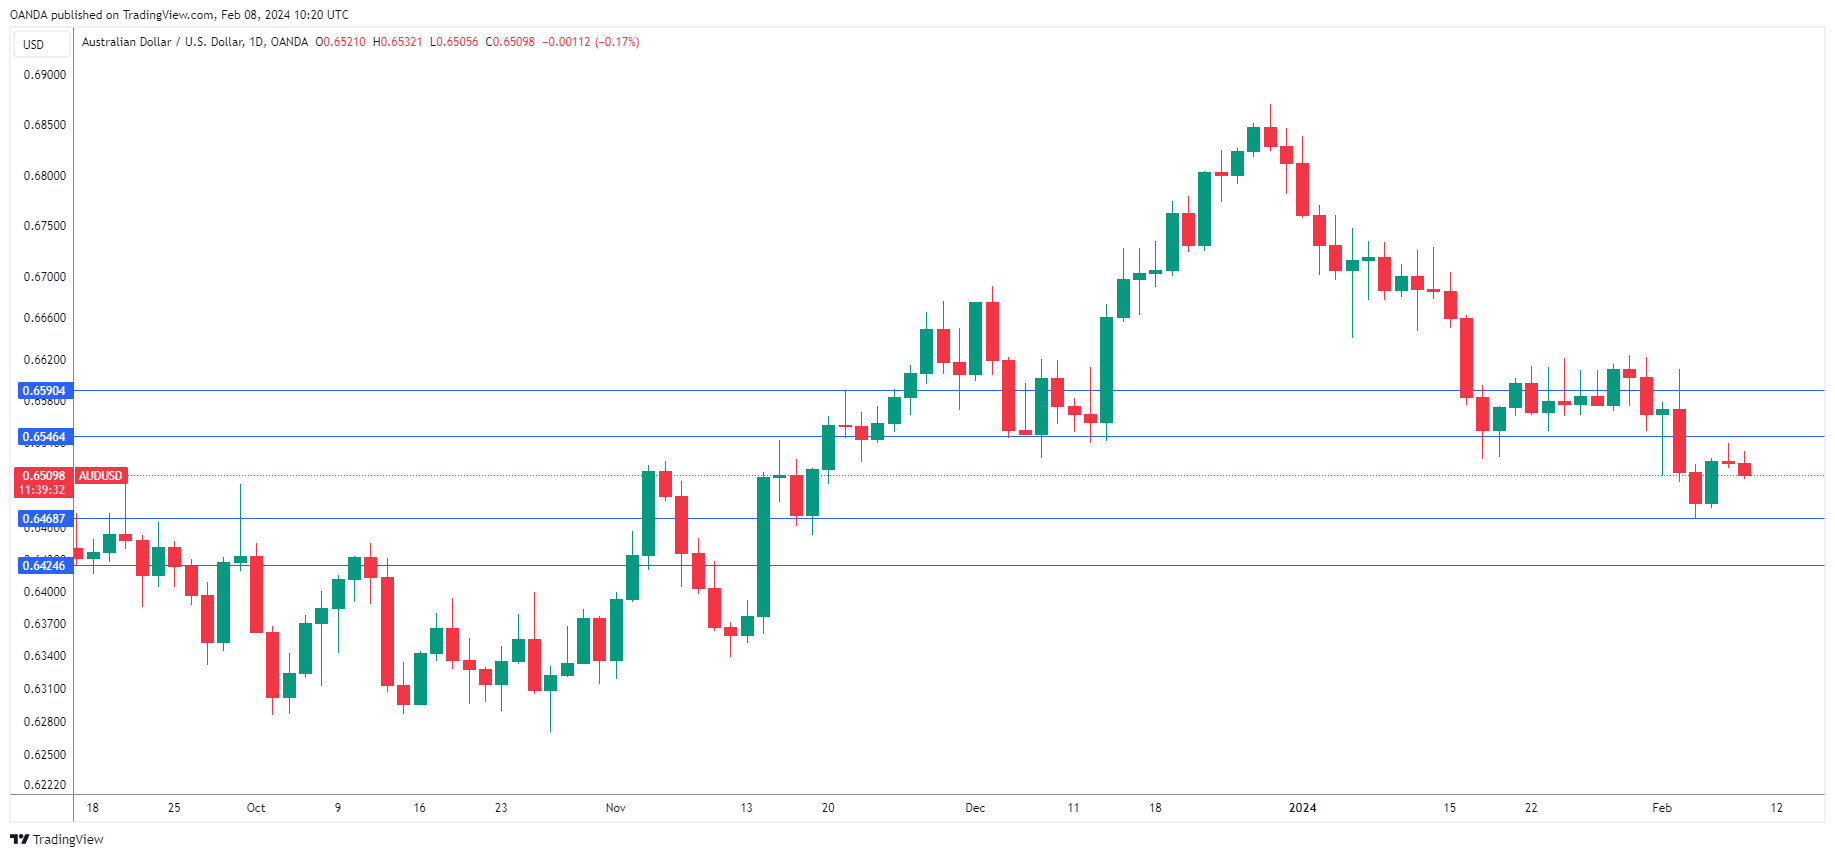
The Australian dollar has edged lower after China posted a soft inflation report. In the European session, AUD/USD is trading at 0.6509, down 0.18%.
The new year hasn’t brought much cheer to the Australian dollar, which hasn’t had a winning week in 2024. Earlier in the week, The Australian dollar dropped below the 0.65 line for the first time since mid-November. The slowdown in China, Australia’s largest export market, is weighing on the struggling Aussie.
China’s CPI falls to 14-year low
China’s consumer prices continued to slide and dropped in January by 0.8% y/y, the steepest decline since September 2009. This was lower than the market estimate of -0.5% and marked a fourth straight decline. The main driver of the downswing was lower food prices. Monthly, CPI rose 0.3%, up from 0.1% in December and below the market estimate of 0.4%. Producer prices fell by 2.5% y/y in January, the sharpest decline in four months.
The world’s second-largest economy is in a deflationary mode and there is the danger that deflation is becoming entrenched. Domestic consumption has weakened and confidence is falling, as evidenced by the massive drop in the Chinese stock market. Deflation was virtually unheard of prior to the Covid pandemic, but China’s shaky recovery has resulted in prolonged deflation.
The weak global economy has meant decreased demand for Chinese exports and this has hammered the manufacturing sector. Manufacturing activity contracted for a fourth straight month in January. The non-manufacturing PMI rose to 50.7 in January, up from 50.3, indicating stagnation.
China’s government has taken some steps to kick-start growth, such as slashing bank reserves and injecting those funds into the banking system, but more dramatic moves may be needed, such as lowering interest rates.
Reserve Bank of Australia Governor Bullock will testify before a House committee later today and traders will be looking for hints about the RBA’s future rate path. The RBA kept rates unchanged for a third time earlier this week and does not appear in any rush to lower rates.
AUD/USD Technical
- 0.6546 and 0.6590 are the next resistance lines
- 0.6468 and 0.6424 and providing support
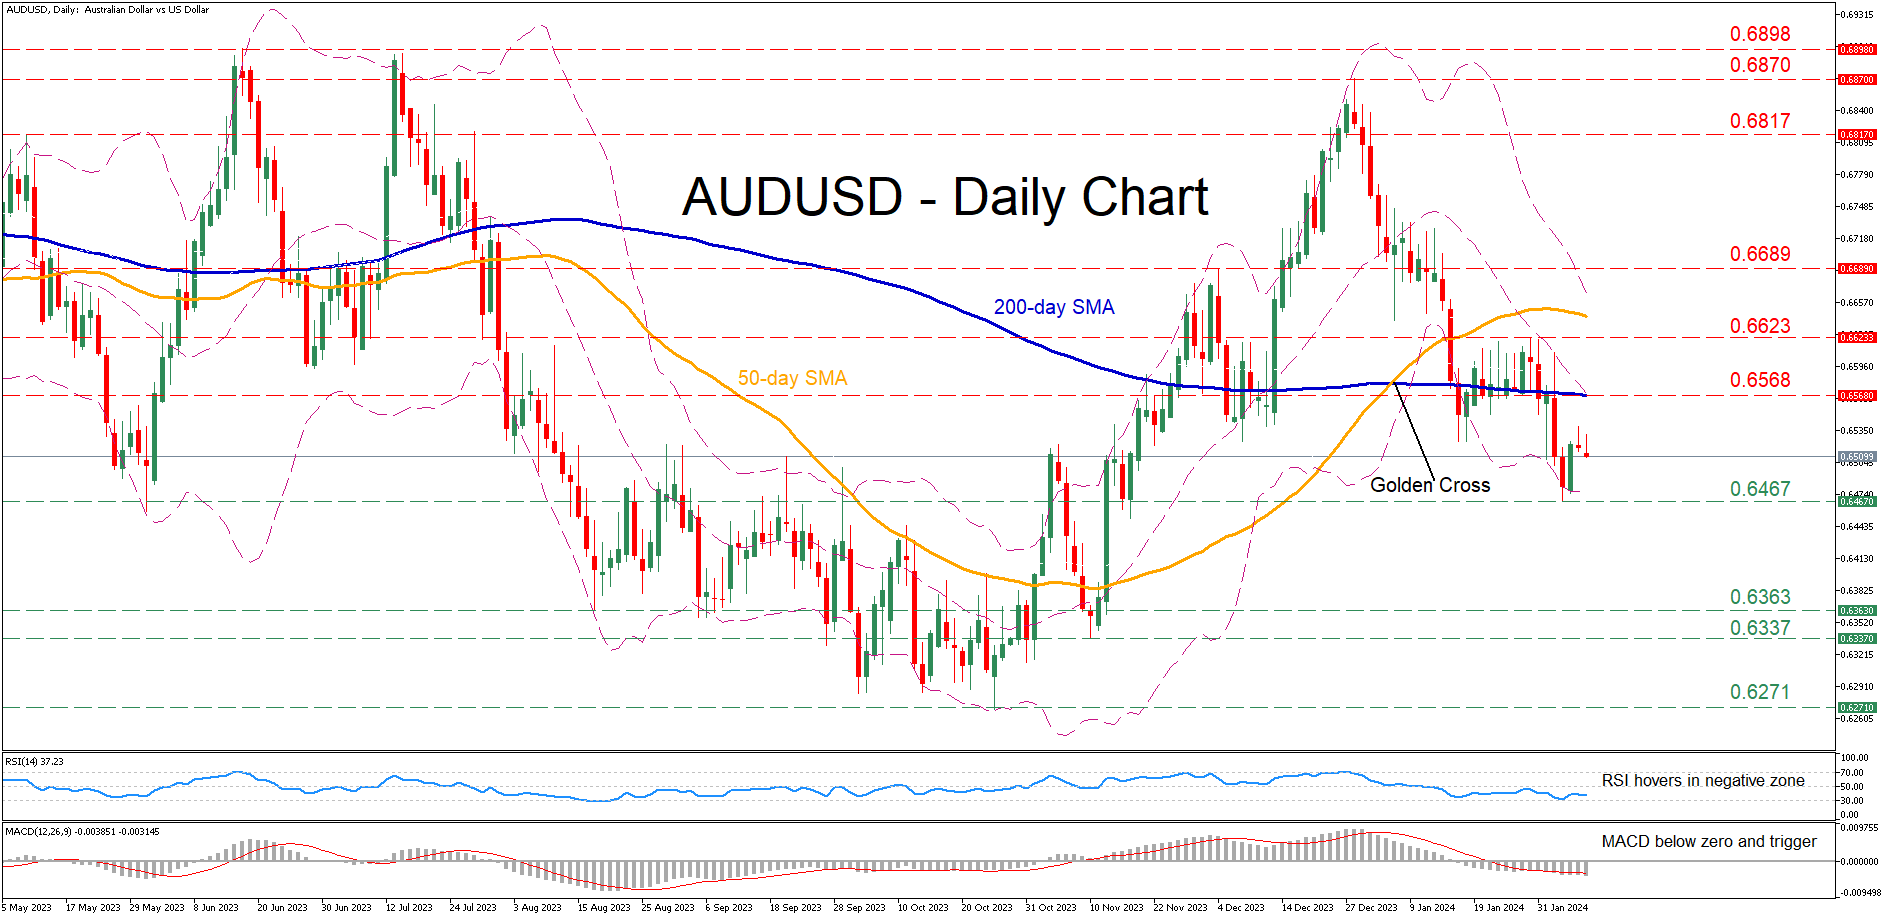
AUDUSD Bounces Off 2024 Low
- AUDUSD hits its lowest level since mid-November
- Although decline halts, rebound looks unconvincing
- Momentum indicators remain tilted to the downside
AUDUSD has been in a constant decline after peaking at 0.6870 in December, breaking below both its 50- and 200-day simple moving averages (SMAs). This week, the price fell to a fresh two-month bottom of 0.6467 before recouping some losses, while the short-term oscillators still suggest that bearish forces are holding the upper hand.
Should bearish pressures persist, the price could revisit its 2024 bottom of 0.6467. A violation of that region could open the door for the August low of 0.6363. Sliding beneath that floor, the pair may descend towards the November low of 0.6337.
On the flipside, if the pair extends its near-term recovery, there is no prominent resistance until the 200-day SMA, currently at 0.6568. Further advances could then cease at the recent resistance of 0.6623 ahead of the 0.6689 hurdle. Conquering the latter, the bulls could attack the May peak of 0.6817.
Overall, AUDUSD dropped to its lowest level in two months as its short-term retreat shows no signs of easing. For the bearish sentiment to alter, the price needs to initially reclaim the 200-day SMA.
NZD/USD Rate Recovering from Its Low of the Year amid News from Labour Market
Yesterday's news showed that New Zealand's labour market is stronger and more resilient than expected.
In the fourth quarter of 2023, employment grew by 0.4% in the fourth quarter (forecast = +0.3%, quarter earlier = -0.1%). The unemployment rate is 4%, forecast = 4.3%.
A strong labour market indicates a margin of safety in the economy. And that may suggest that the Reserve Bank of New Zealand's tight monetary policy to quell inflation may continue longer.
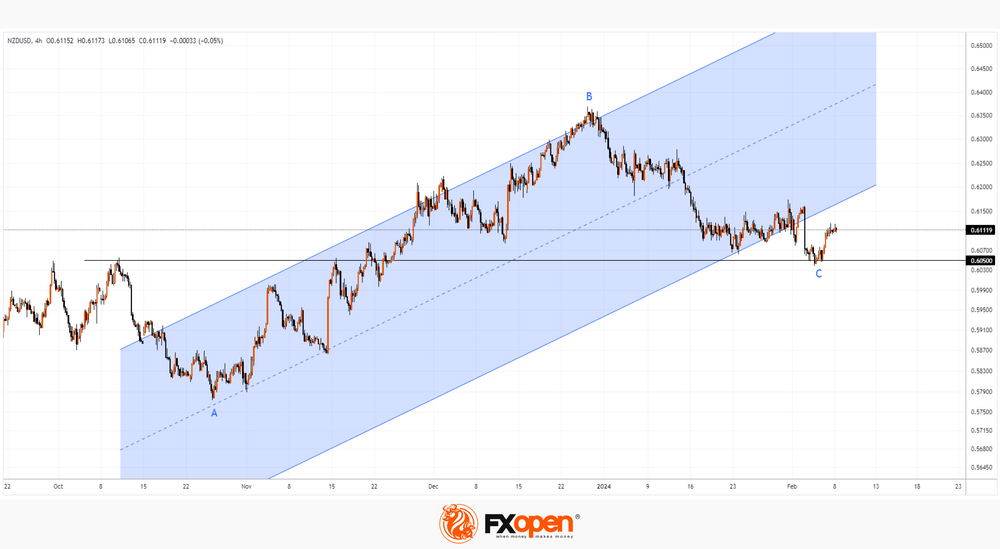
The news helped the NZD strengthen against other currencies. Moreover, an interesting situation develops on the NZD/USD chart:
→ based on the results of yesterday, the price recovered and strengthened above the low C, which today is the minimum of 2024.
→ Moreover, level C is in the region of 50% of the rollback from the impulse movement A→B.
→ At the same time, the chart shows signs of a failed bearish breakout of the level of 0.6050, which previously served as resistance.
Considering the above arguments, there is reason to believe that the bulls may try to resume the uptrend (shown by the blue channel) after the price of NZD/USD has fallen below its border (for now - not for long). The trigger for a new surge in volatility could be news about the state of the labour market in the US, data is expected today at 16:30 GMT+3.
Trade over 50 forex markets 24 hours a day with FXOpen. Take advantage of low commissions, deep liquidity, and spreads from 0.0 pips. Open your FXOpen account now or learn more about trading forex with FXOpen.
This article represents the opinion of the Companies operating under the FXOpen brand only. It is not to be construed as an offer, solicitation, or recommendation with respect to products and services provided by the Companies operating under the FXOpen brand, nor is it to be considered financial advice.
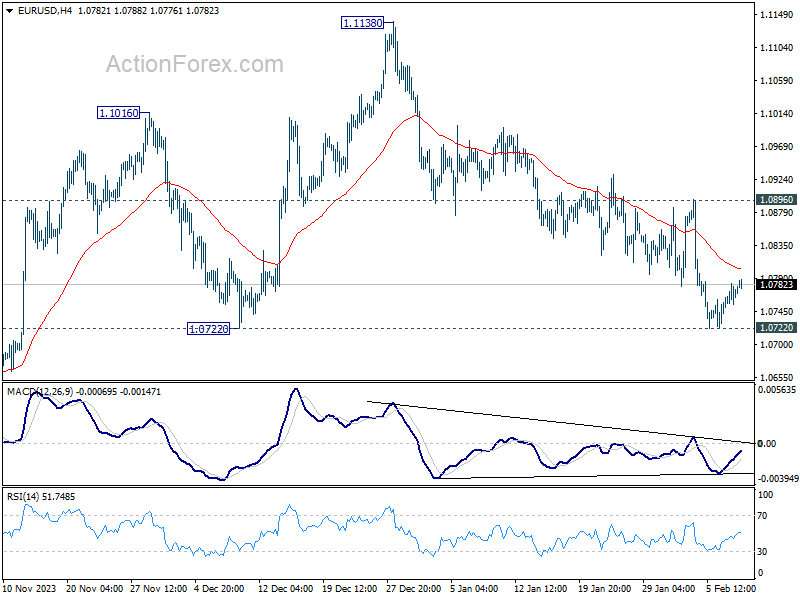
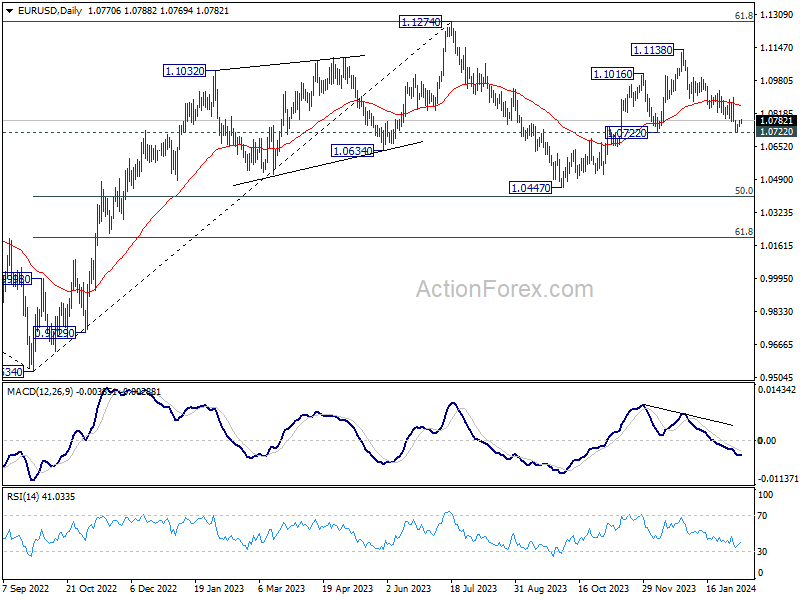
EUR/USD Daily Outlook
Daily Pivots: (S1) 1.0755; (P) 1.0770; (R1) 1.0787; More...
Intraday bias in EUR/USD remains neutral for the moment, with focus staying on 1.0722 structural support. Decisive break there will argue that whole rise from 1.0447 has completed. Deeper fall would then be seen to target this low. On the upside, break of 1.0896 resistance is needed to indicate short term bottoming. Otherwise, risk will stay on the downside in case of recovery.
In the bigger picture, price actions from 1.1274 are viewed as a corrective pattern to rise from 0.9534 (2022 low). Rise from 1.0447 is seen as the second leg. While further rally could cannot be ruled out, upside should be limited by 1.1274 to bring the third leg of the pattern. Meanwhile, sustained break of 1.0722 support will argue that the third leg has already started for 1.0447 and possibly below.
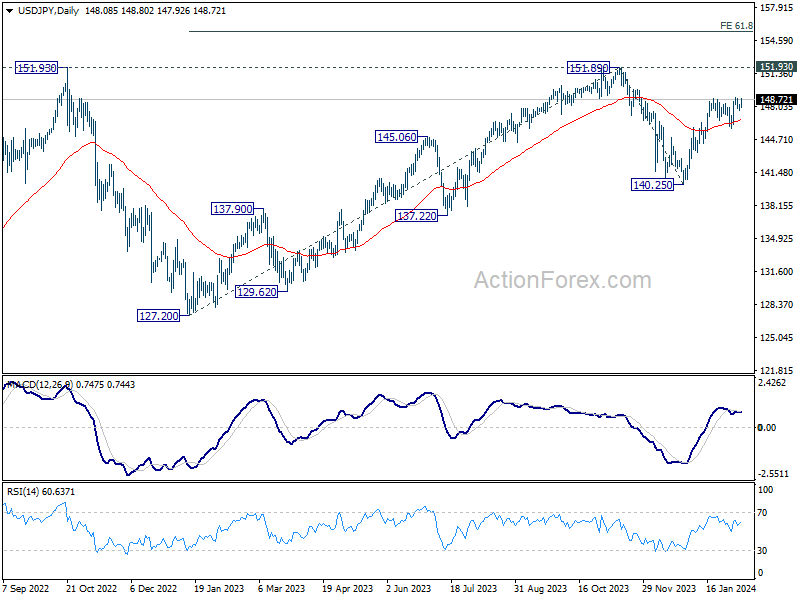
USD/JPY Daily Outlook
Daily Pivots: (S1) 147.79; (P) 148.02; (R1) 148.42; More...
Intraday bias in USD/JPY remains neutral with focus on 148.79 resistance. Firm break there will resume the rally from 140.25 to 151.89/93 key resistance zone. For now, further rise will remain in favor as long as 145.88 holds, in case of retreat.
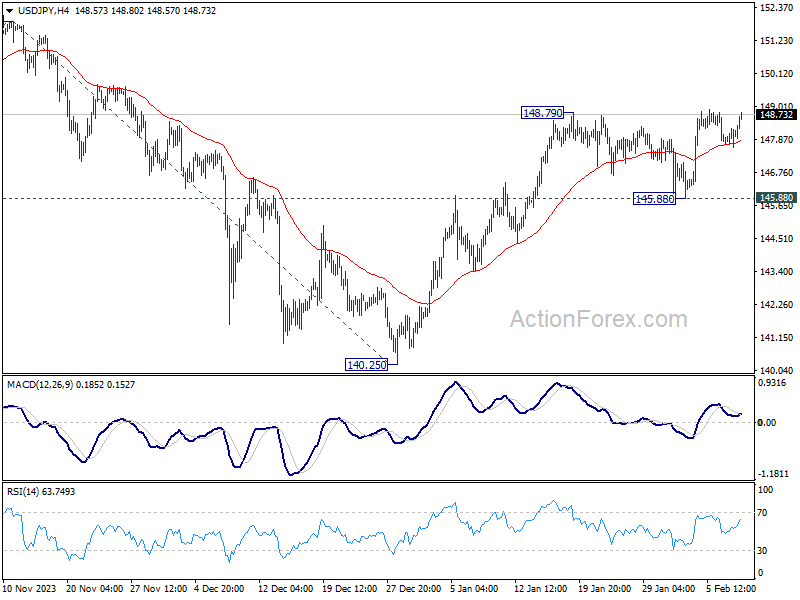
In the bigger picture, fall from 151.89 is seen as a correction to the rally from 127.20, which might have completed at 140.25 already. Firm break of 151.89/93 resistance zone will confirm up trend resumption next target will be 61.8% projection of 127.20 to 151.89 from 140.25 at 155.50. This will now remain the favored case as long as 140.25 support holds.
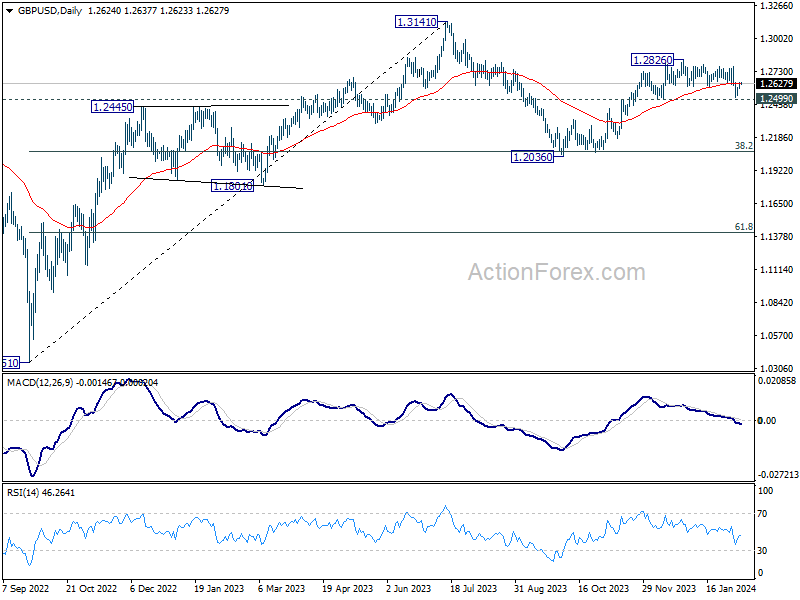
GBP/USD Daily Outlook
Daily Pivots: (S1) 1.2599; (P) 1.2620; (R1) 1.2650; More...
Intraday bias in GBP/USD remains mildly on the upside. Correction from 1.2826 might have completed with three waves down to 1.2517. Further rise would be seen to retest 1.2826 high. On the downside, however, decisive break of 1.2499 will argue that whole rise from 1.2036 has completed and turn near term outlook bearish.
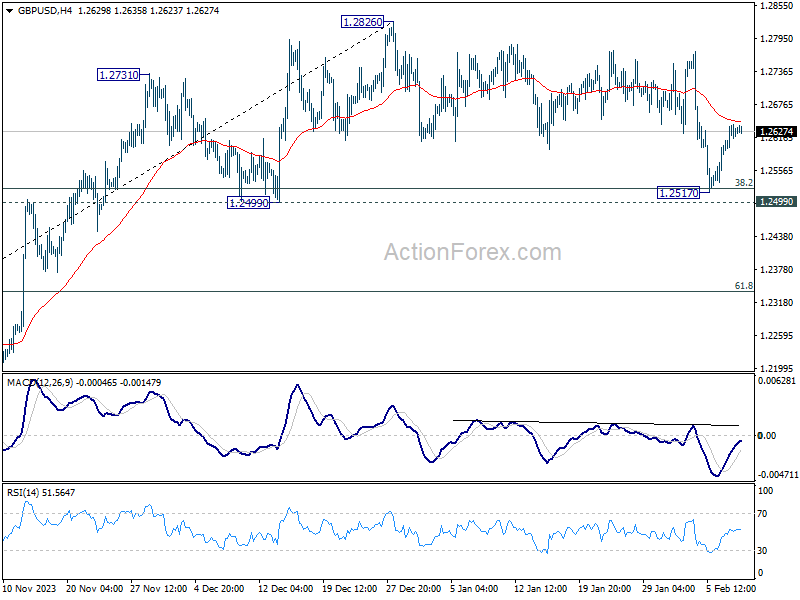
In the bigger picture, price actions from 1.3141 medium term top are seen as a corrective pattern to up trend from 1.0351 (2022 low). Rise from 1.2036 is seen as the second leg that's still in progress. Upside should be limited by 1.3141 to bring the third leg of the pattern. Meanwhile, break of 1.2499 support will argue that the third leg has already started for 38.2% retracement of 1.0351 (2022 low) to 1.3141 at 1.2075 again.
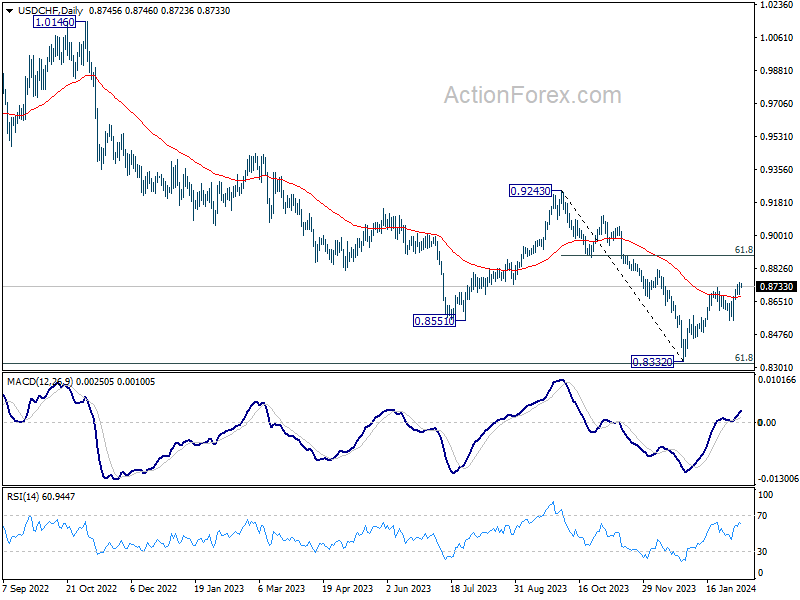
USD/CHF Daily Outlook
Daily Pivots: (S1) 0.8706; (P) 0.8730; (R1) 0.8770; More....
USD/CHF's rally from 0.8332 resumed after brief retreat, and intraday bias is back on the upside. Further rally should be seen to 61.8% retracement of 0.9243 to 0.8332 at 0.8995 next. On the downside, break of 0.8550 support is needed to indicate completion of the rebound. Otherwise, further rise is still expected in case of retreat.
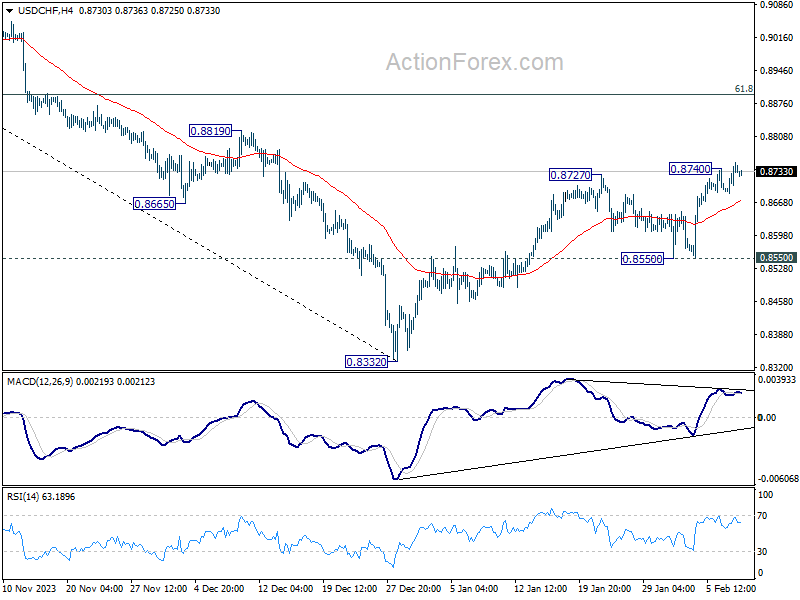
In the bigger picture, there is prospect of medium term bottoming at 0.8332 considering possible bullish convergence condition in W MACD, and the support from 0.8317 long term fibonacci support. Sustained trading above 55 D EMA (now at 0.8677) will affirm this case, and bring stronger rise back towards 0.9243 resistance, even as a corrective move.
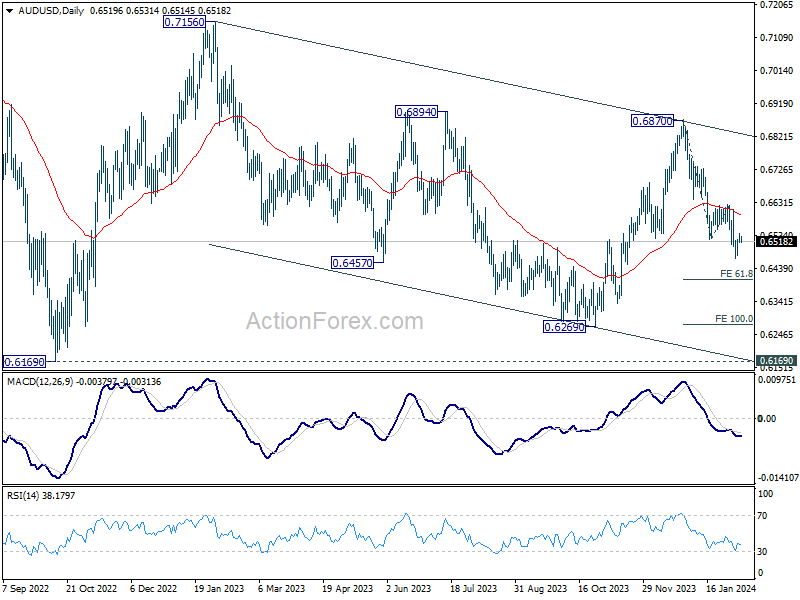
AUD/USD Daily Report
Daily Pivots: (S1) 0.6511; (P) 0.6526; (R1) 0.6535; More...
Intraday bias in AUD/USD remains neutral as consolidation from 0.6468 is extending. Stronger recovery cannot be ruled out, but outlook will stay bearish as long as 0.6621 resistance holds. On the downside, break of 0.6468 will resume the fall from 0.6870, as part of the down trend from 0.7156, to 61.8% projection of 0.6870 to 0.6524 from 0.6621 at 0.6407 next.
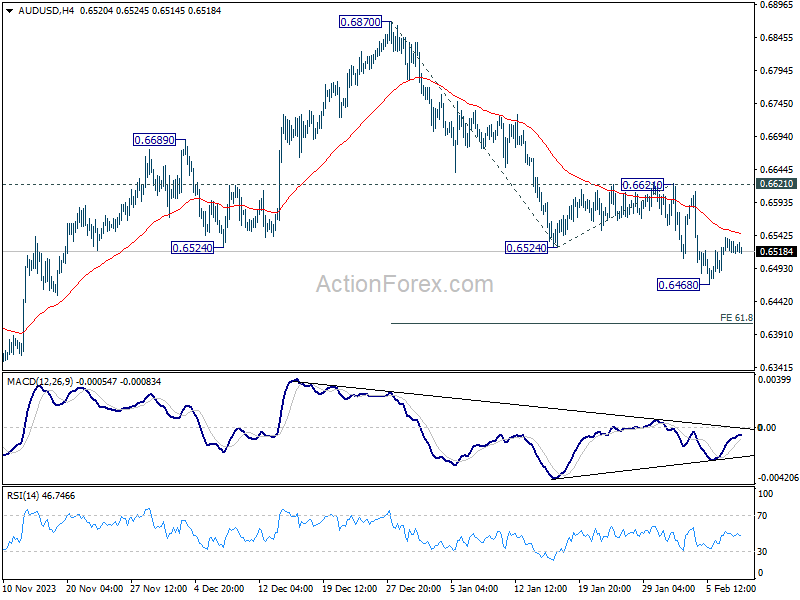
In the bigger picture, price actions from 0.6169 (2022 low) are seen as a medium term corrective pattern to the down trend from 0.8006 (2021 high). Fall from 0.7156 (2023 high) is seen as the second leg, which might still be in progress. Overall, sideway trading could continue in range of 0.6169/7156 for some more time. But as long as 0.7156 holds, an eventual downside breakout would be mildly in favor.
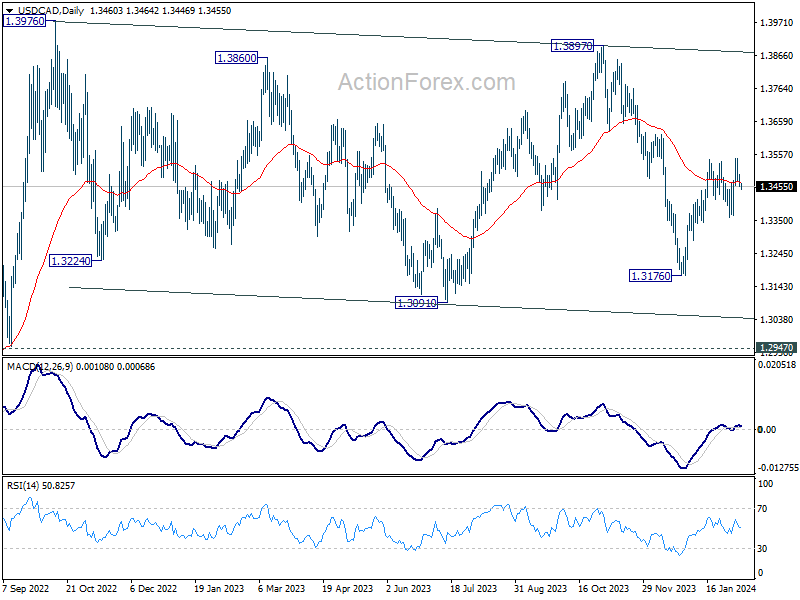
USD/CAD Daily Outlook
Daily Pivots: (S1) 1.3445; (P) 1.3472; (R1) 1.3488; More...
Intraday bias in USD/CAD remains neutral for the moment as sideway trading continues. On the upside, break of 1.3540 will resume the rise from 1.3176. That will also revive that case that whole fall from 1.3897 has completed, and target this resistance. Nevertheless, firm break of 1.3357 support will argue that rebound from 1.3176 has completed, and target this low for resuming whole fall from 1.3897.
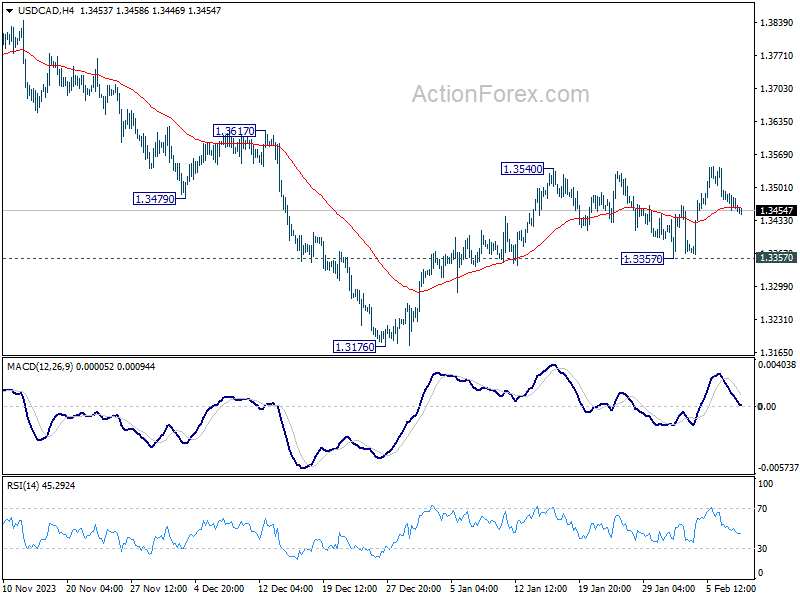
In the bigger picture, price actions from 1.3976 (2022 high) are viewed as a corrective pattern only. In case of another fall, strong support should emerge above 1.2947 resistance turned support to bring rebound. Overall, larger up trend from 1.2005 (2021 low) is still expected to resume through 1.3976 at a later stage.