Sample Category Title
BoJ’s Uchida signals no swift hikes after negative rate ends
In a speech today, BoJ Deputy Governor Shinichi Uchida articulated a scenario where, despite an end to the negative interest rate policy, rapid interest rate hikes remain unlikely.
"Even if the Bank were to terminate the negative interest rate policy, it is hard to imagine a path in which it would then keep raising the interest rate rapidly," he stated, suggesting a gradual adjustment process, while financial conditions wild remain "accommodative.
Uchida projected gradual increase in underlying inflation toward 2 percent target through fiscal 2025. This forecast anticipates core CPI (all items less fresh food) at 2.8% for fiscal 2023, with a subsequent moderation to 2.4% in fiscal 2024 and 1.8% in fiscal 2025.
Theses projections are based on the outlook that "while the pass-through of cost increases will continue to wane, prices such as of services will rise, accompanied by wage increases."
To achieve this economic outlook, Uchida emphasized, the virtuous cycle needs to intensify in both directions, from prices to wages and from wages to prices."
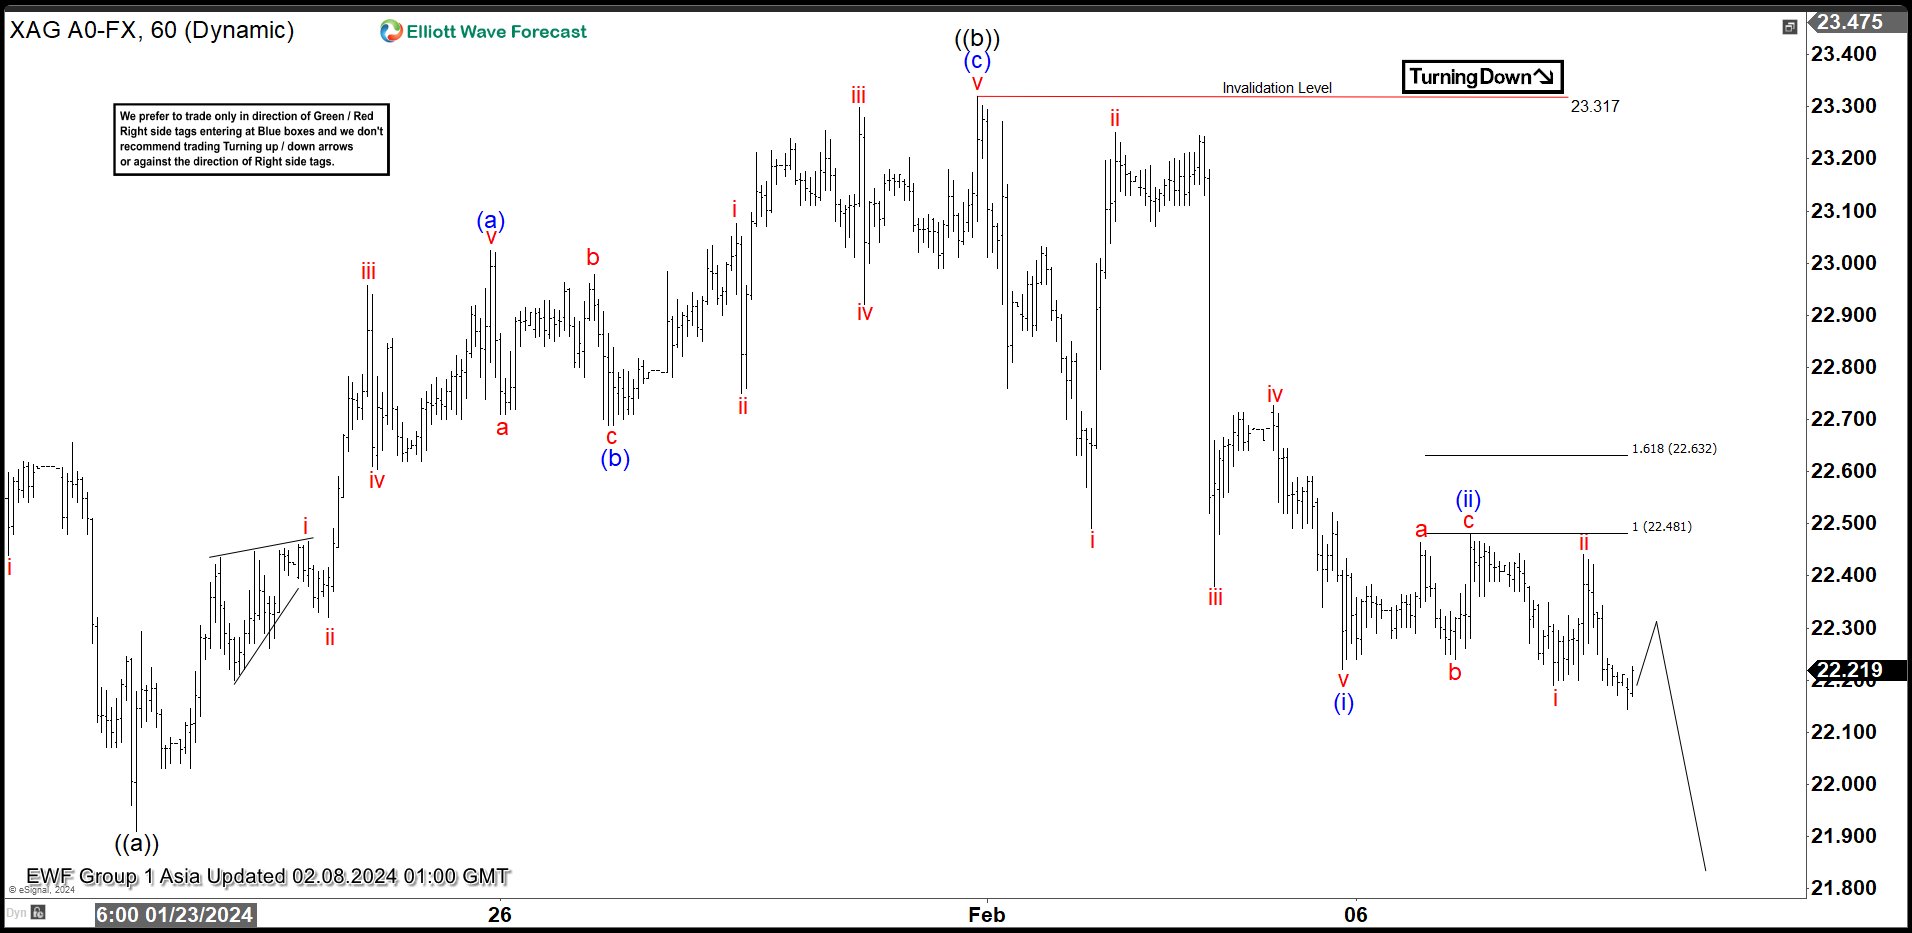
Silver (XAGUSD) Looking to Extend Lower in Sideways Price Action
Short Term Elliott Wave view in Silver (XAGUSD) suggests that the metal has traded sideways since the low in August 2022. The short term 1 hour chart below shows the move down from 12.4.2023 high which takes the form of a double three Elliott Wave structure. Down from 12.4.2023 high, wave W ended at 22.49 and rally in wave X ended at 24.6. Wave Y lower is in progress as a zigzag structure. Down from wave X, wave ((a)) ended at 21.91 as the 1 hour chart below shows. Up from there, wave (a) ended at 23.02 and pullback in wave (b) ended at 22.68. Wave (c) lower ended at 23.31 which completed wave ((b)) corrective rally.
Wave ((c)) lower is in progress as a 5 waves impulse Elliott Wave structure. Down from wave ((b)), wave (i) ended at 22.22 and rally in wave (ii) ended at 22.48. The metal then extended lower in wave (iii). Near term, as far as pivot at 23.3 high stays intact, expect rally to fail in 3, 7, 11 swing and the metal to extend lower. Potential target lower is 100% – 161.8% Fibonacci extension from 12.4.2023 high. This area comes at 19.1 – 21.2 where buyers can appear for further upside or 3 waves rally at least.
XAGUSD 60 Minutes Elliott Wave Chart
Silver (XAGUSD) Elliott Wave Video
https://www.youtube.com/watch?v=DONxHAdd8kc
Technical Outlook and Review
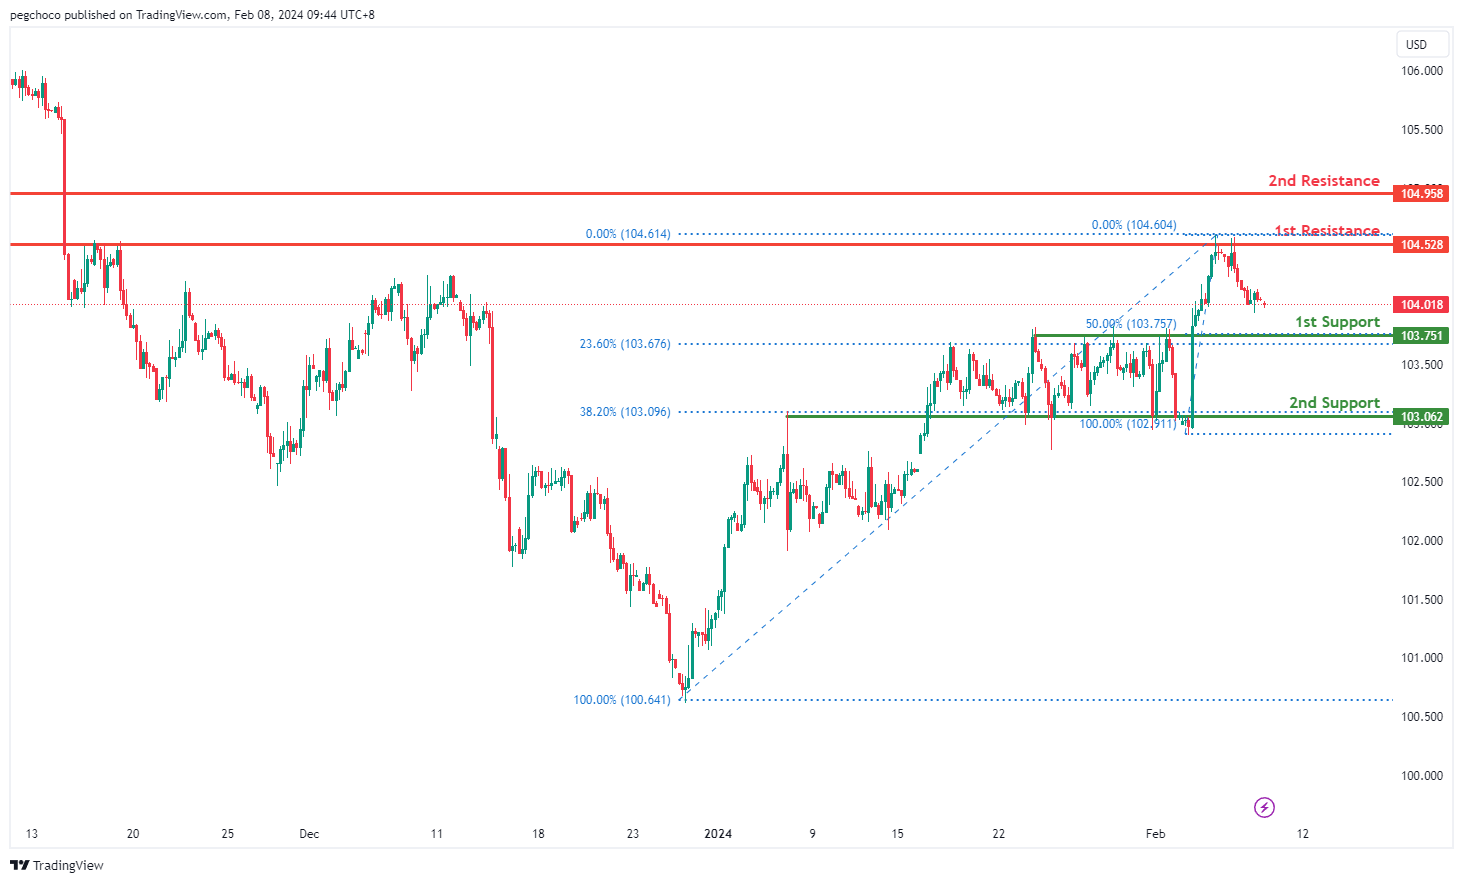
DXY:
The DXY chart currently indicates a bearish overall momentum, suggesting a downward trend. There’s a potential for a bearish continuation towards the 1st support level.
The 1st support at 103.73 is identified as a pullback support, with the presence of both the 50% and 23.60% Fibonacci Retracement levels, indicating Fibonacci confluence and strengthening its significance as a support level.
Furthermore, the 2nd support level at 103.06 is also recognized as a pullback support, coinciding with the 23.60% Fibonacci Retracement, further reinforcing its potential as a support zone.
On the resistance side, the 1st resistance level at 104.52 is categorized as an overlap resistance, suggesting its historical significance as a potential barrier for upward movement.
Similarly, the 2nd resistance at 104.95 is considered a pullback resistance, indicating its potential role in impeding further upward momentum.
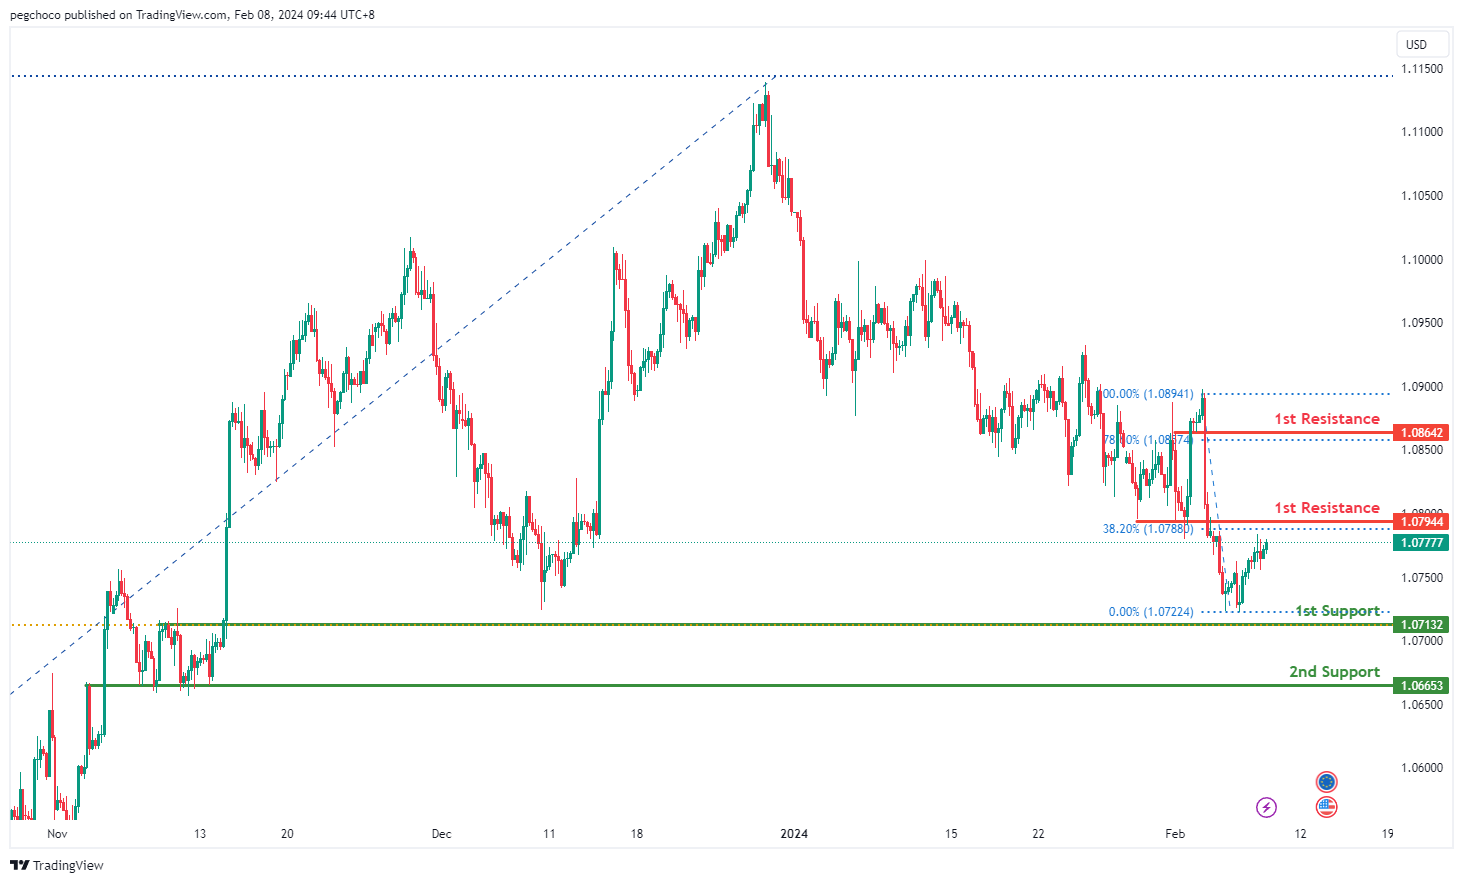
EUR/USD:
The EUR/USD chart currently demonstrates a bearish overall momentum, signaling a downward trend. There’s a potential for a bearish reaction off the 1st resistance level, leading to a drop towards the 1st support.
The 1st support at 1.0713 is identified as a pullback support, aligning with the 61.80% Fibonacci Retracement level, suggesting its significance as a potential support zone.
Additionally, the 2nd support level at 1.0665 is characterized as an overlap support, indicating its historical importance as a potential area where buying interest may emerge.
On the resistance side, the 1st resistance level at 1.0794 is categorized as an overlap resistance, coinciding with the 38.20% Fibonacci Retracement, suggesting its historical significance as a potential barrier for further upward movement.
Furthermore, the 2nd resistance at 1.0864 is identified as a pullback resistance, aligning with the 78.60% Fibonacci Retracement, indicating its potential role in impeding further upward momentum.
EUR/JPY:
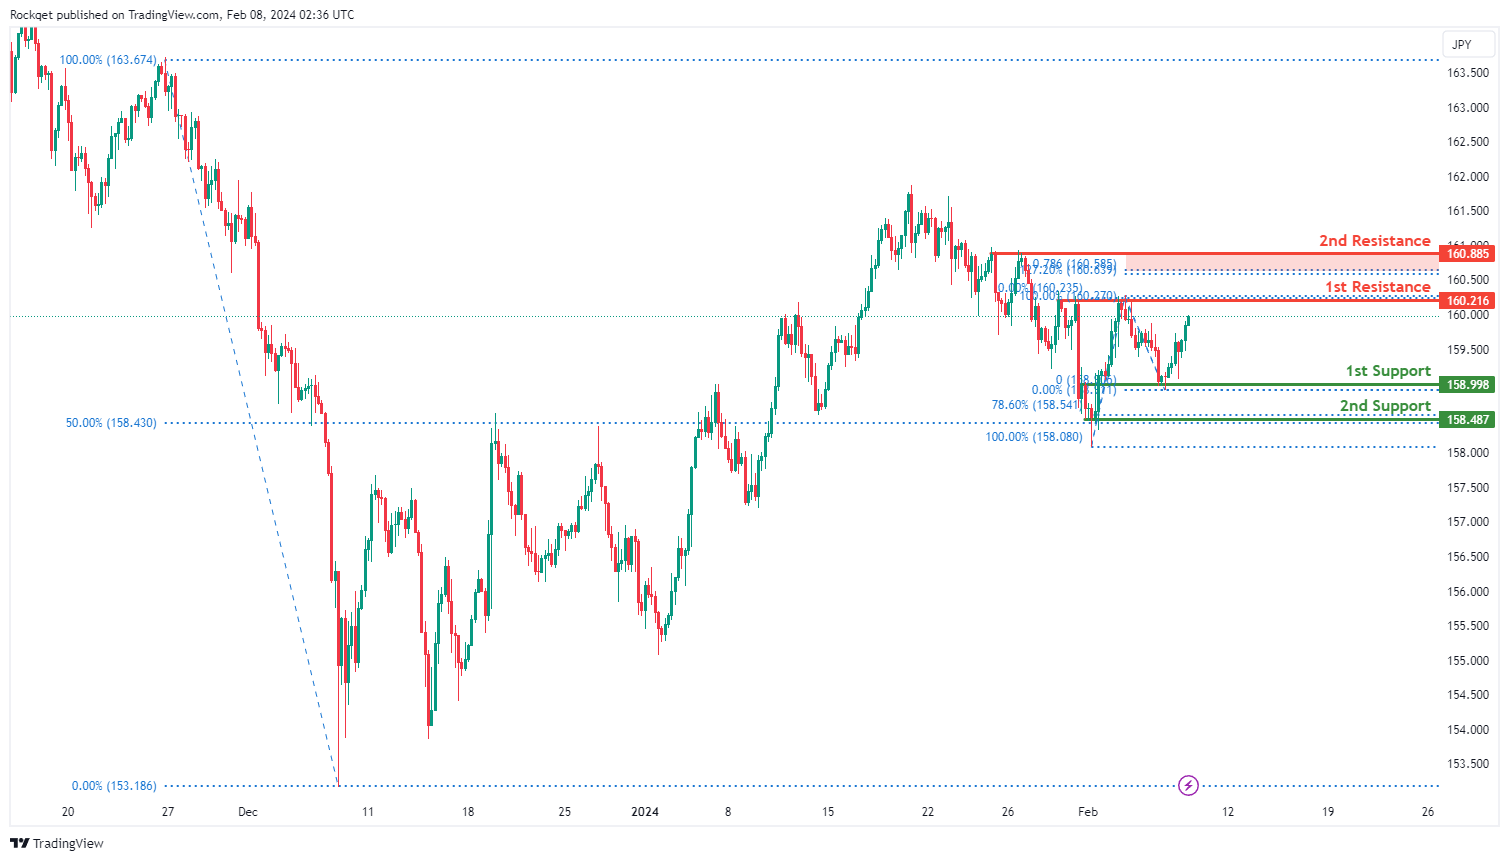
The EUR/JPY chart currently exhibits a bullish momentum, indicating an upward trend. Several factors contribute to this bullish sentiment, including pullback and swing low supports, as well as key Fibonacci retracement levels.
The 1st support level at 158.998 is significant due to its alignment with a pullback support and the 78.60% Fibonacci Retracement level. This suggests that historical buying interest has emerged at this level.
Additionally, the 2nd support at 158.487 coincides with a swing low support and the 50% Fibonacci Retracement, adding further strength to the potential support zone.
On the resistance side, the 1st resistance level at 160.216 is highlighted as a point of potential selling pressure, representing a pullback resistance.
Furthermore, the 2nd resistance at 160.885 serves as another barrier to bullish continuation, aligning with a pullback resistance and the 78.60% Fibonacci Projection
EUR/GBP:
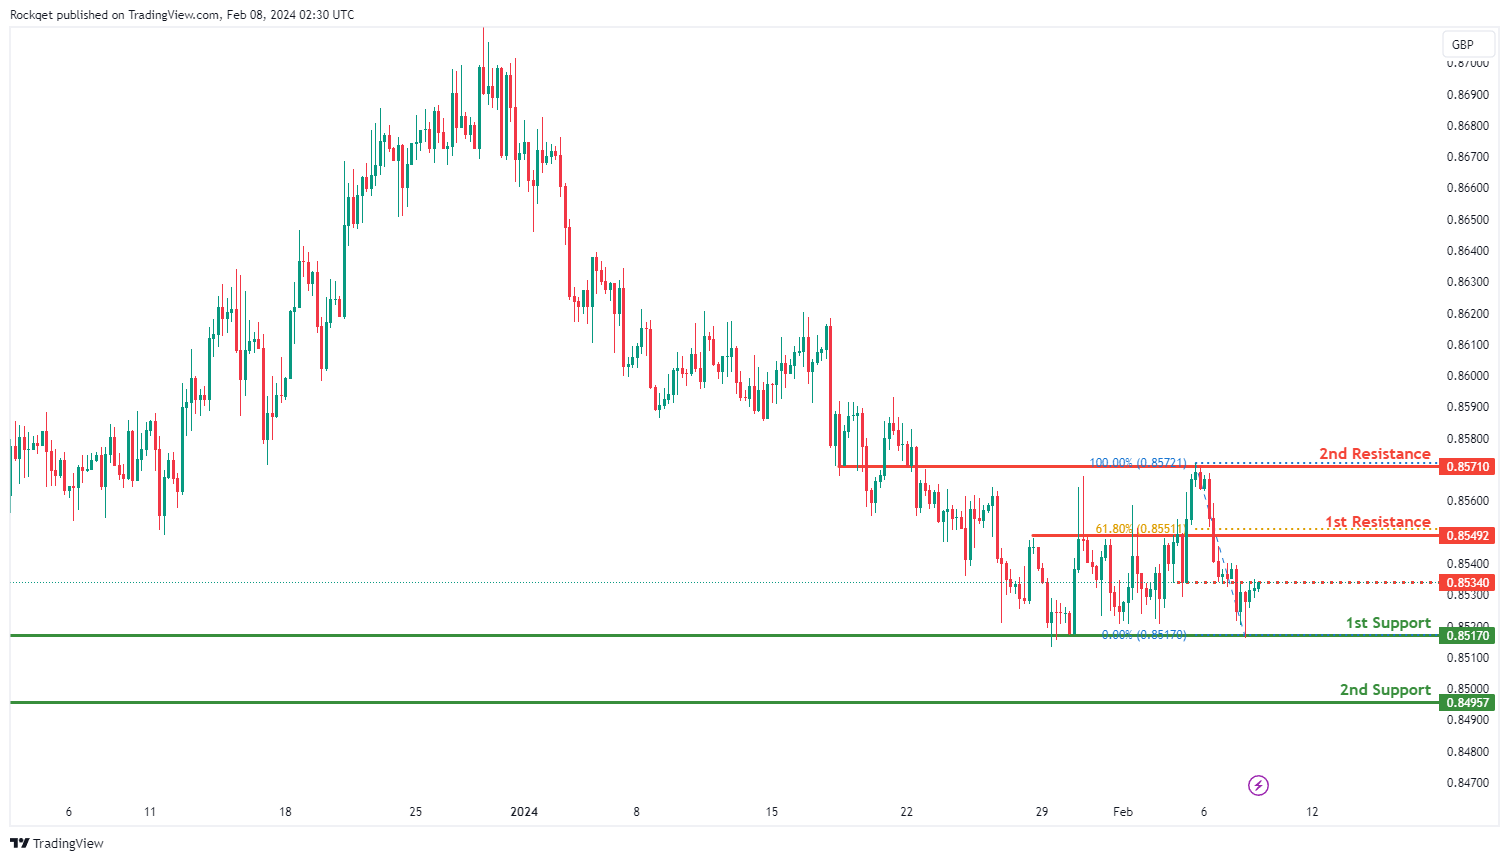
The EUR/GBP chart currently shows a weak bullish momentum with low confidence, suggesting a tentative upward movement. Despite the cautious sentiment, there are key levels that may influence price action.
The 1st support at 0.85170 is notable as it represents a multi-swing low support, indicating a level where buying interest has previously emerged.
Additionally, the 2nd support at 0.84957 is recognized as an overlap support, further reinforcing its significance as a potential area of price support.
On the resistance side, the 1st resistance at 0.85492 is identified as a key level where selling pressure may arise, aligning with an overlap resistance and the 61.80% Fibonacci Retracement. This level could serve as a barrier to bullish momentum.
Furthermore, the 2nd resistance at 0.85710 is another noteworthy level, characterized by an overlap resistance. An intermediate resistance level at 0.85340 is also identified, representing another point where selling interest may intensify.
GBP/USD:
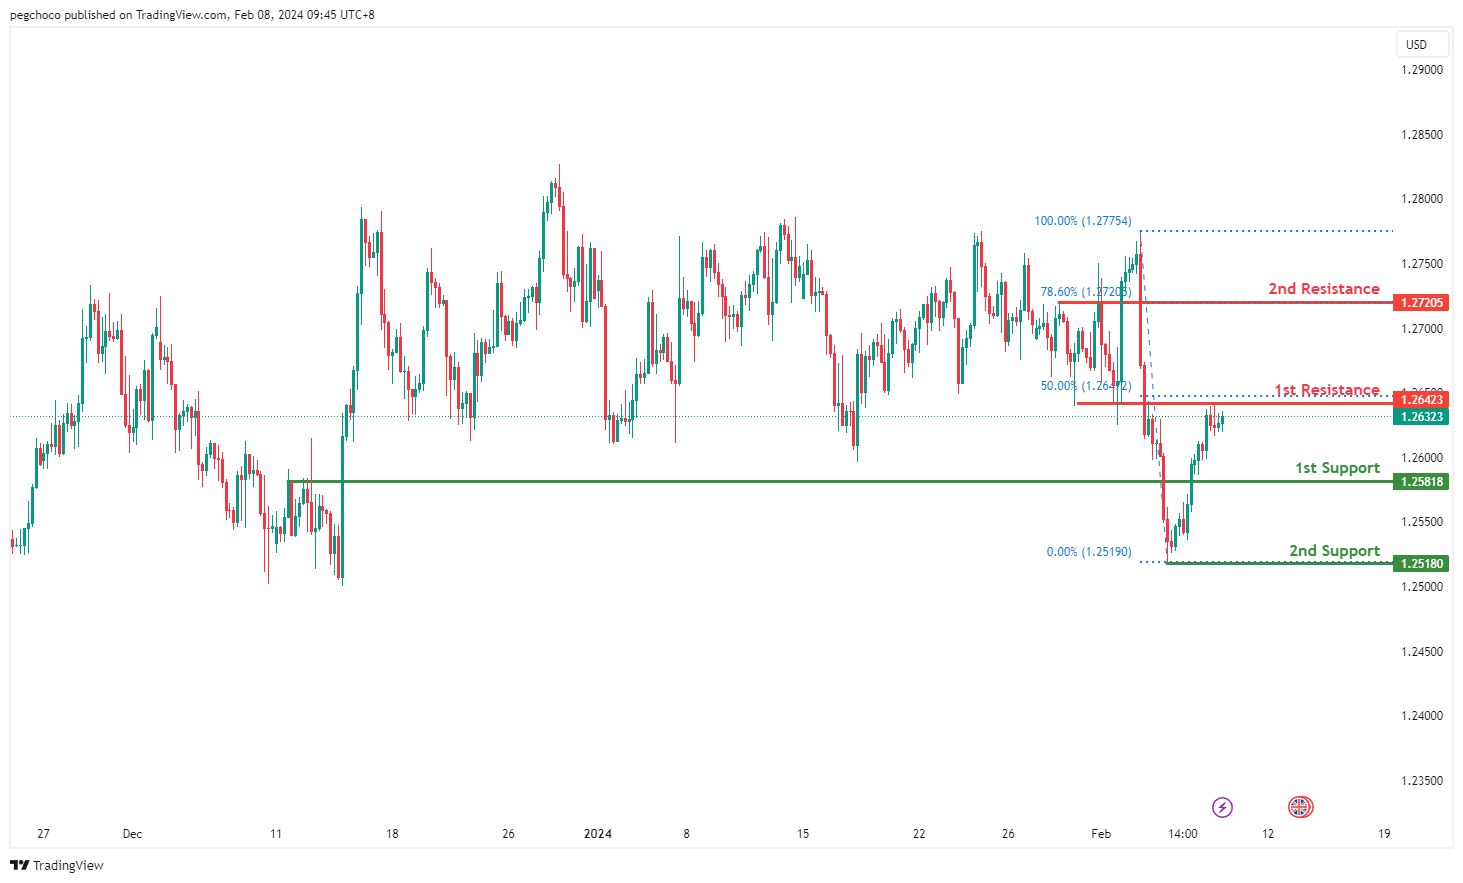
The GBP/USD chart currently indicates a bearish overall momentum, suggesting a downward trend. There’s a potential scenario where the price reacts bearishly off the 1st resistance level and declines towards the 1st support.
The 1st support level at 1.2581 is identified as a pullback support, indicating its significance as a potential area where buying interest could emerge.
Additionally, the 2nd support at 1.2518 is characterized as a swing low support, further reinforcing its importance as a potential support level.
On the resistance side, the 1st resistance level at 1.2642 is categorized as an overlap resistance, coinciding with the 50% Fibonacci Retracement, suggesting its historical significance as a potential barrier for further upward movement.
Furthermore, the 2nd resistance at 1.2720 is identified as a pullback resistance, aligning with the 78.60% Fibonacci Retracement, indicating its potential role in impeding further upward momentum.
GBP/JPY:
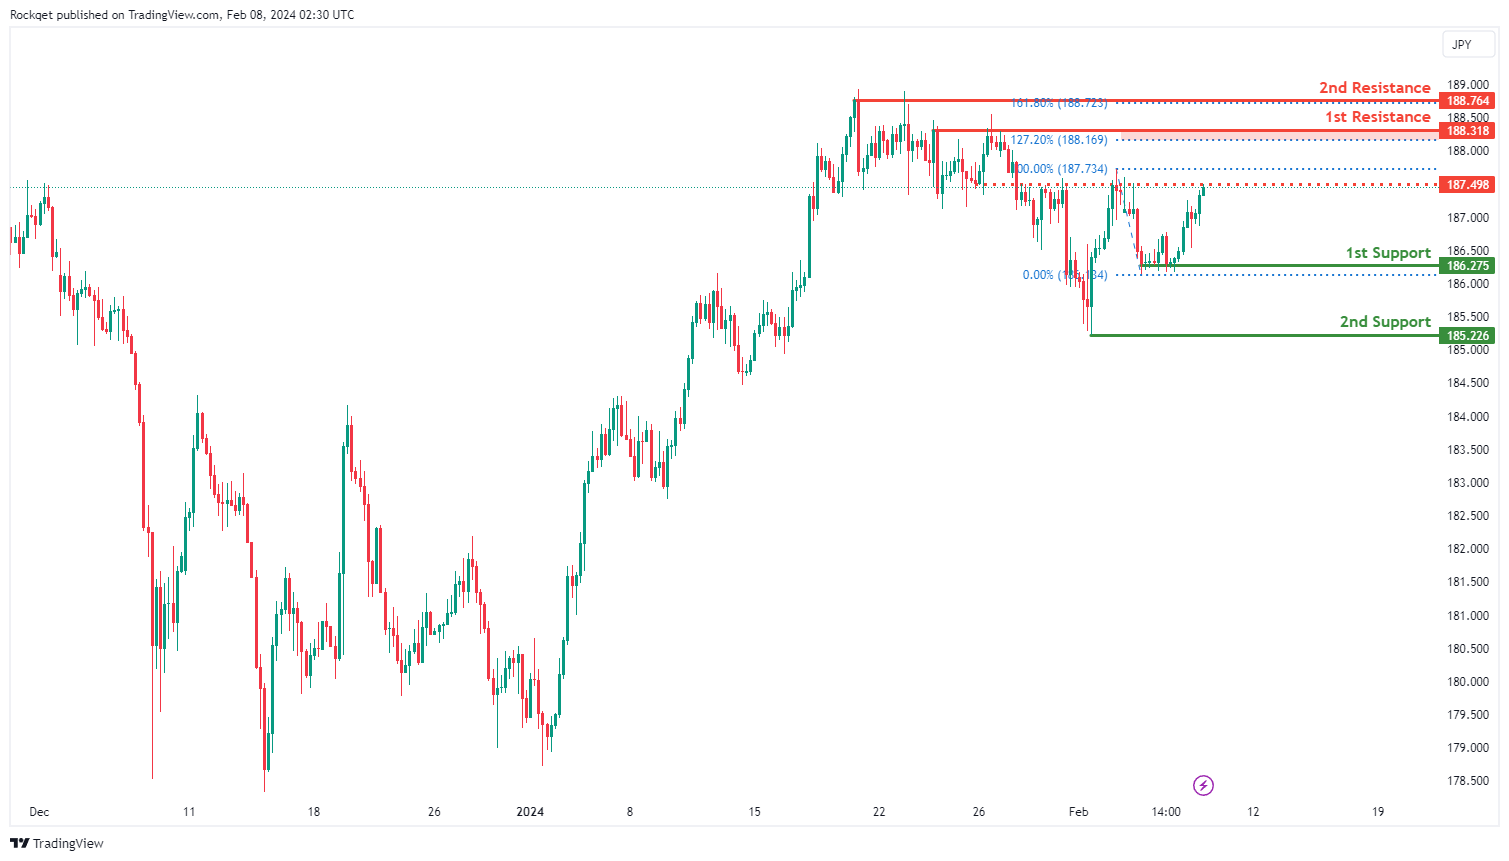
The GBP/JPY chart currently exhibits a bullish momentum, indicating a prevailing upward trend. Several key levels have been identified that could influence future price movements.
The 1st support level at 186.275 is significant as it represents a multi-swing low support, suggesting a strong historical level where buying interest has previously emerged.
Additionally, the 2nd support at 185.226 aligns with a swing low support, further reinforcing its potential as a level of price support.
On the resistance side, the 1st resistance at 188.318 is highlighted as a key level where selling pressure may intensify, coinciding with a pullback resistance and the 127.20% Fibonacci Extension. This level could act as a barrier to the bullish momentum.
Furthermore, the 2nd resistance at 188.764 represents a swing high resistance and aligns with the 161.80% Fibonacci Extension, adding further significance to this level. An intermediate resistance level at 187.50 is also identified, characterized by an overlap resistance.
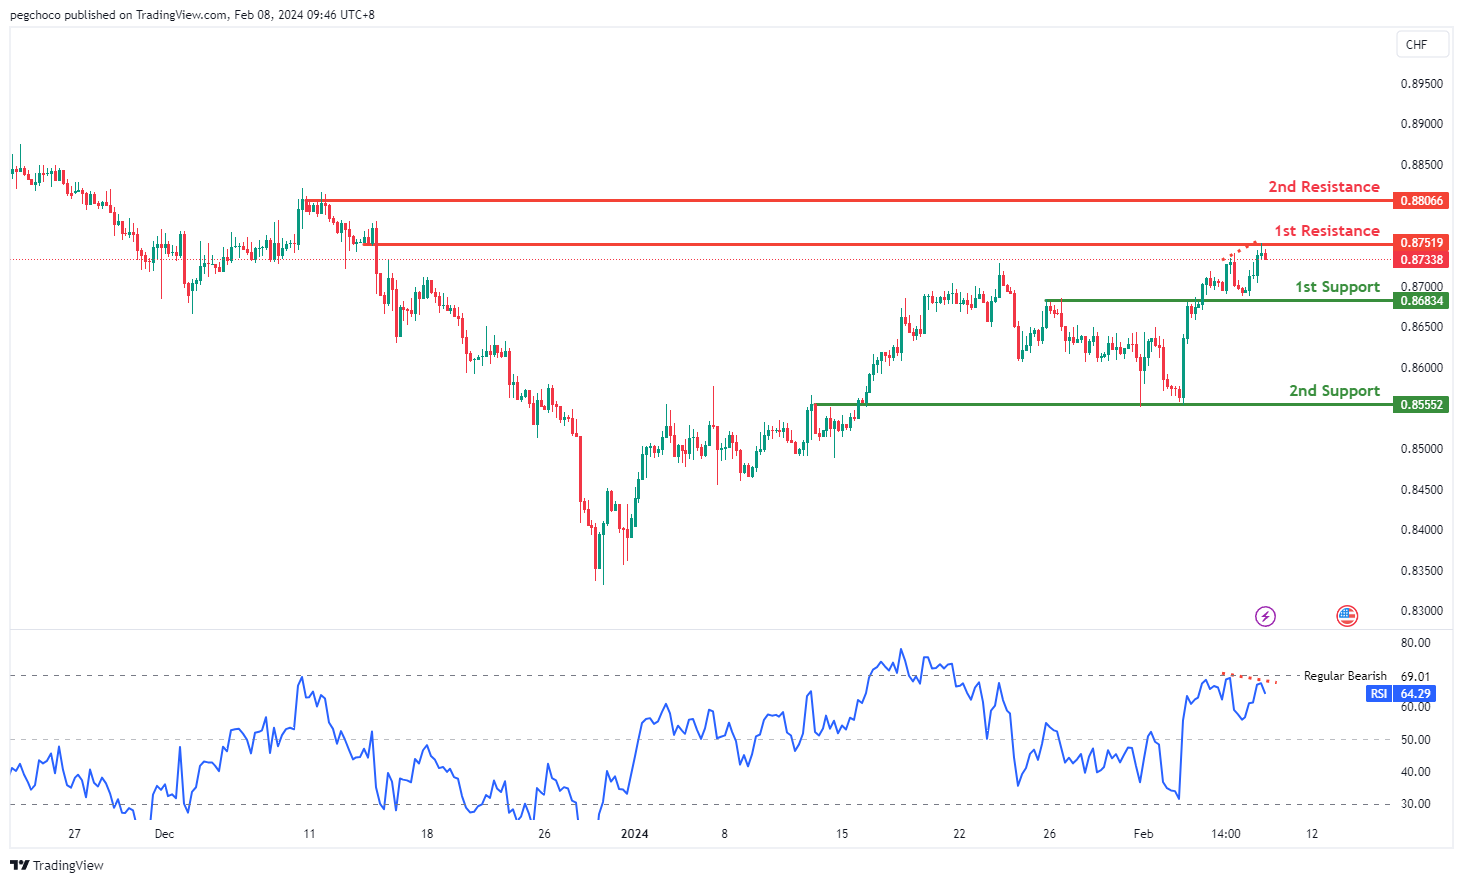
USD/CHF:
The USD/CHF chart currently demonstrates a bearish overall momentum, indicating a downward trend. There’s a possibility of a bearish reaction occurring at the 1st resistance level, leading to a decline towards the 1st support.
The 1st support level at 0.8683 is identified as an overlap support, suggesting its historical significance as a potential area where buying interest may emerge.
Similarly, the 2nd support at 0.8555 is characterized as another overlap support, further emphasizing its importance as a potential support zone.
On the resistance side, the 1st resistance level at 0.8751 is categorized as an overlap resistance, indicating its historical significance as a potential barrier for further upward movement.
Additionally, the 2nd resistance at 0.8806 is identified as a multi-swing high resistance, suggesting its role in impeding further upward momentum.
Moreover, the Relative Strength Index (RSI) is also displaying bearish divergence versus price, suggesting that a reversal might occur soon. This indicates a potential shift in momentum favoring further downward movement.
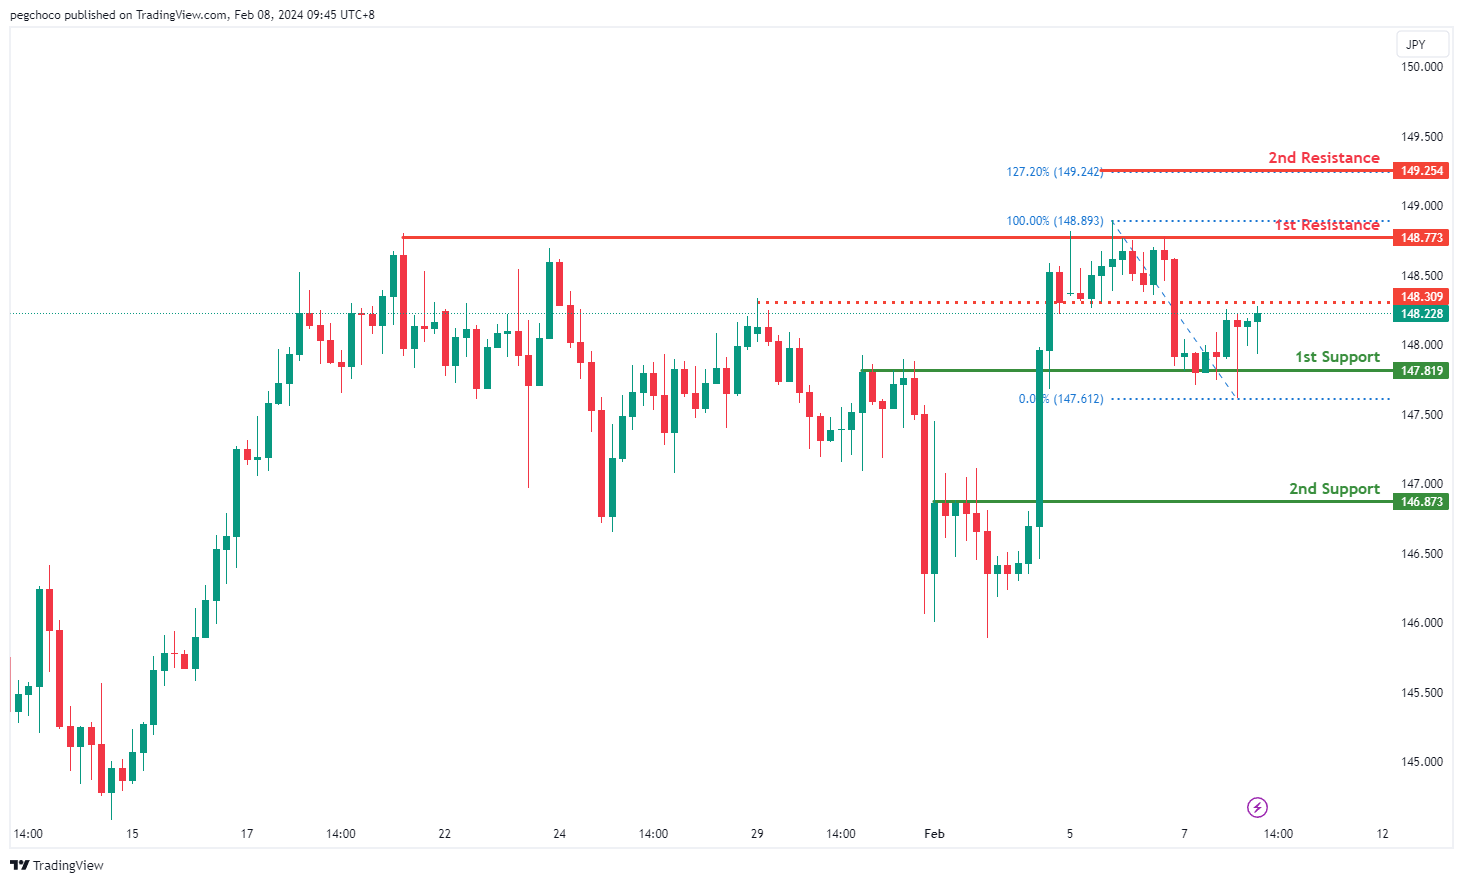
USD/JPY:
The USD/JPY chart currently indicates a bullish overall momentum, suggesting an upward trend. There’s a possibility of a bullish continuation towards the 1st resistance level.
The 1st support level at 147.81 is identified as an overlap support, indicating its historical significance as a potential area where buying interest may emerge.
Similarly, the 2nd support at 146.87 is characterized as a pullback support, reinforcing its importance as a level where buyers might step in.
On the resistance side, the 1st resistance level at 148.77 is categorized as a multi-swing high resistance, suggesting its historical significance as a barrier for further upward movement.
Additionally, the 2nd resistance level at 149.25 is identified based on the 127.20% Fibonacci Extension, indicating a potential area of resistance derived from Fibonacci analysis.
Moreover, the intermediate resistance at 148.30 is considered a pullback resistance, further adding to the potential barriers for upward movement.
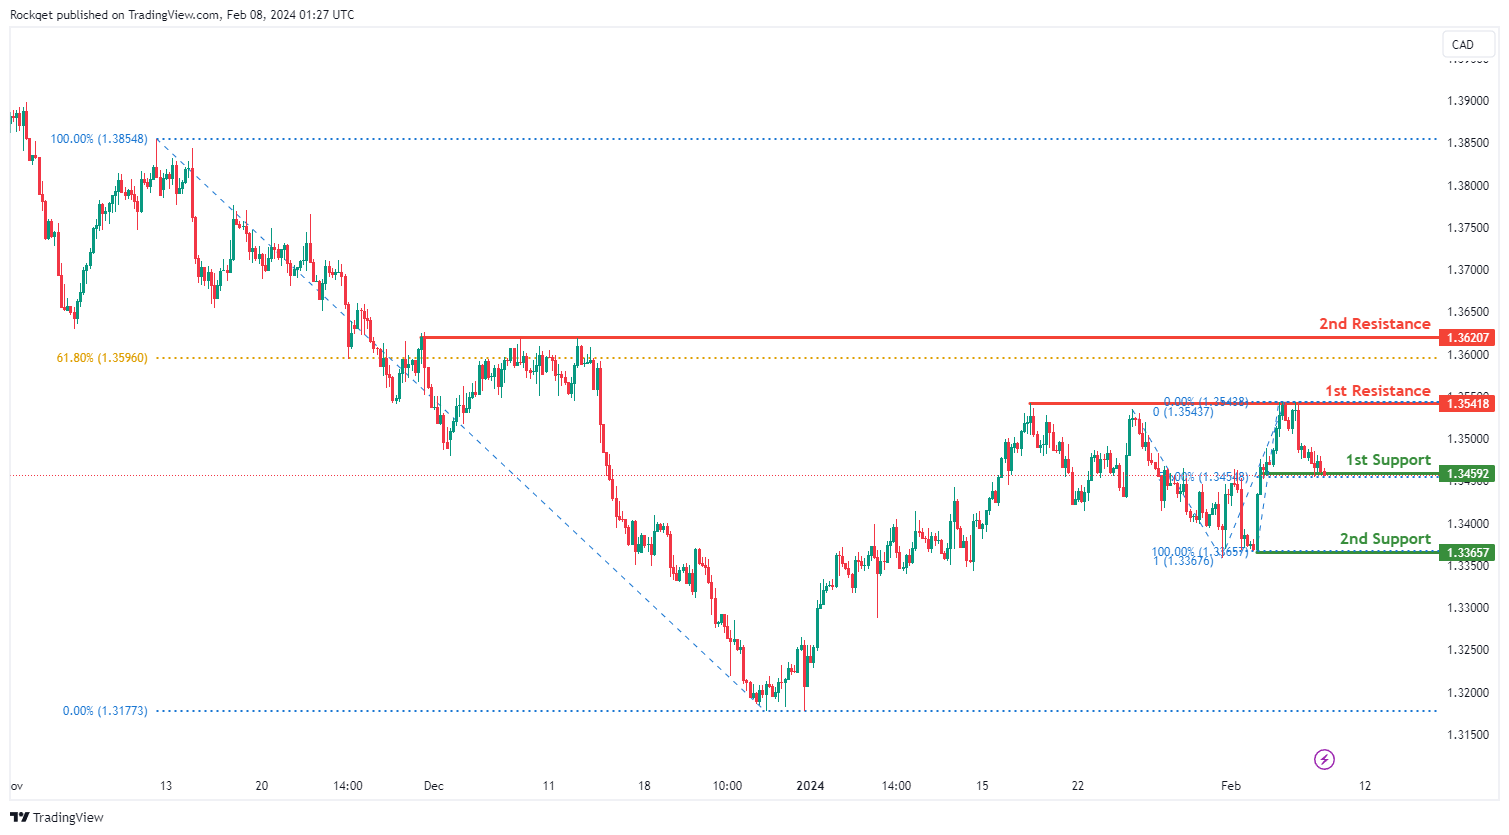
USD/CAD:
The USD/CAD chart currently exhibits an overall bearish momentum. In this context, there is a potential scenario for price to break bellow the 1st support and fall towards the 2nd support.
The 1st support level at 1.3459 is identified as a pullback support that aligns with the 50.00% Fibonacci Retracement level. Further below, the 2nd support level at 1.3365 is marked as a swing-low support that aligns with the 100.00% Fibonacci projection level, further emphasizing its importance as a potential support zone.
To the upside, the 1st resistance level at 1.3541 is identified as a pullback resistance. Higher up, the 2nd resistance level at 1.3620 is also noted as a pullback resistance that aligns close to the 61.80% Fibonacci Retracement level, further highlighting its importance as a potential resistance point.
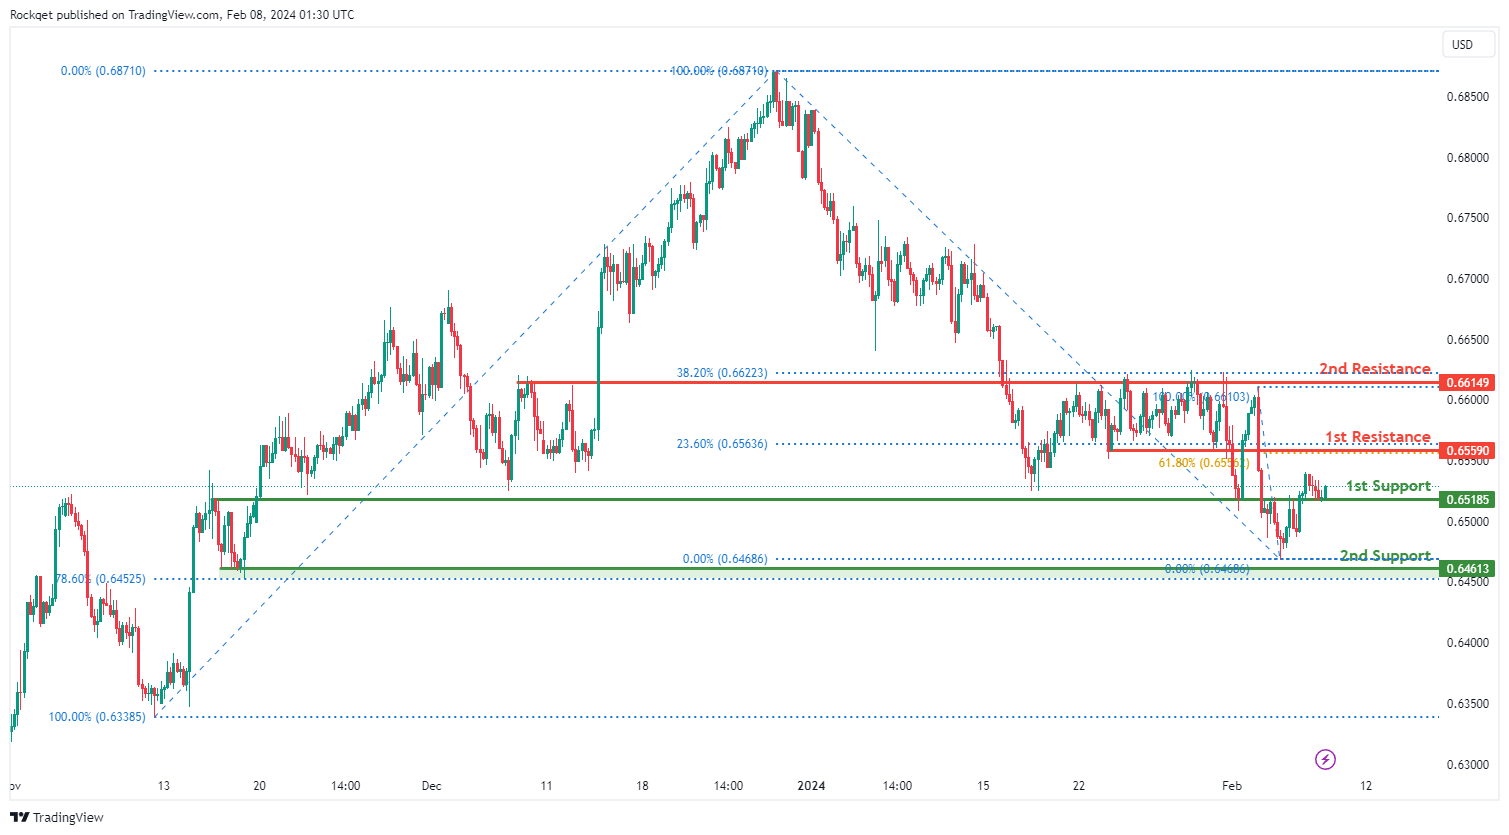
AUD/USD:
The AUD/USD chart currently exhibits an overall bullish momentum. In this context, there is a potential scenario for price to rise towards the 1st resistance.
The 1st resistance level at 0.6559 is identified as a pullback resistance that aligns with a confluence of Fibonacci levels i.e. the 23.60% and the 61.80% Retracement levels. Higher up, the 2nd resistance level at 0.6614 is also marked as a pullback resistance that aligns close to the 38.20% Fibonacci Retracement level, further highlighting its importance as a potential resistance point.
To the downside, the 1st support level at 0.6518 is identified as an overlap support. Further below, the 2nd support level at 0.6461 is noted as a pullback support that aligns close to the 78.60% Fibonacci Retracement level, further emphasizing its importance as a potential support zone.
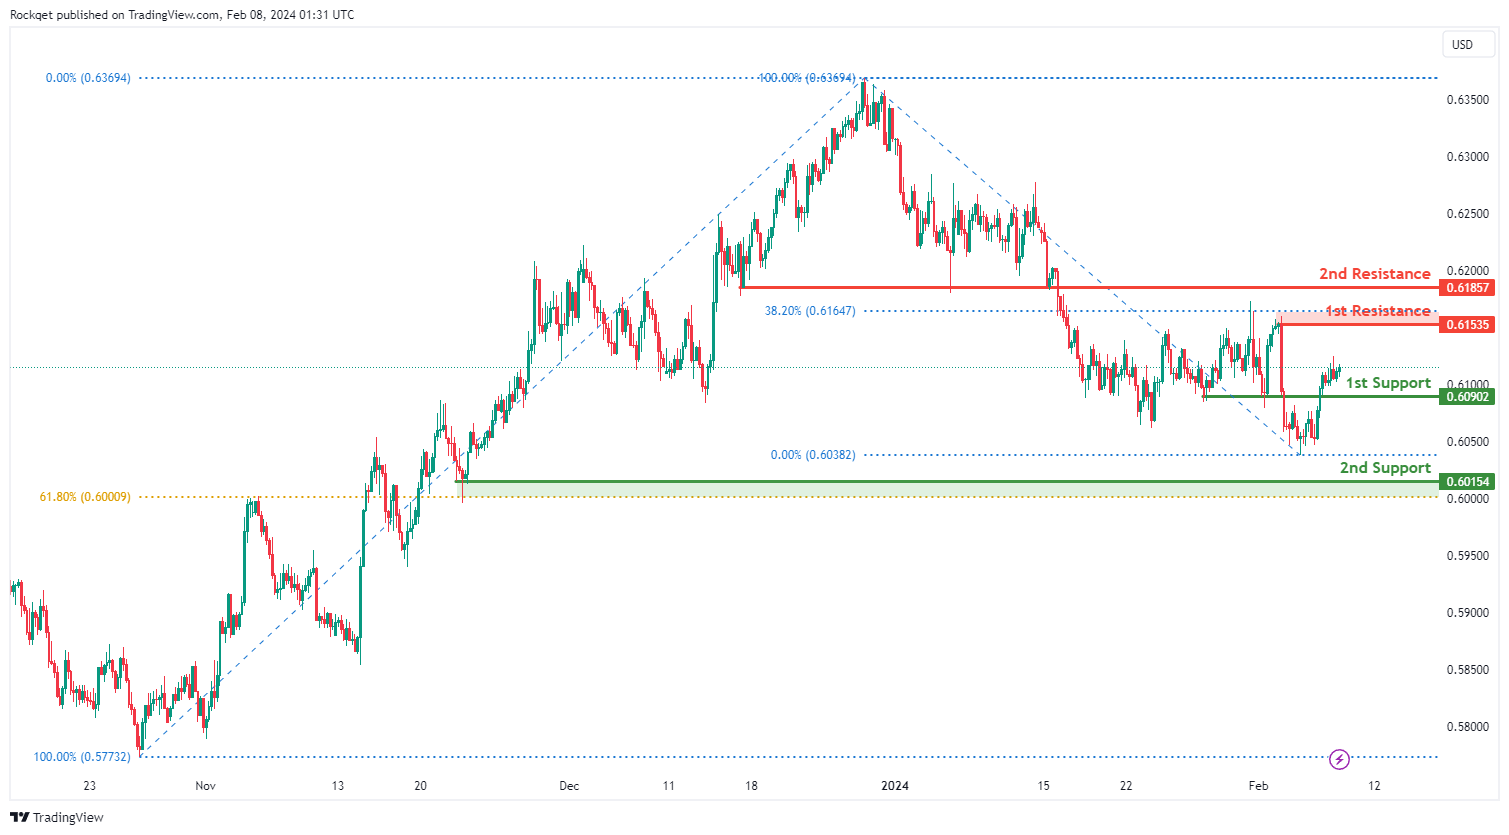
NZD/USD
The NZD/USD chart currently exhibits an overall bullish momentum. In this context, there is a potential scenario for price to rise towards the 1st resistance.
The 1st resistance level at 0.6153 is identified as a pullback resistance that aligns close to the 38.20% Fibonacci Retracement level. Higher up, the 2nd resistance level at 0.6185 is also marked as a pullback resistance, further highlighting its importance as a potential resistance point.
To the downside, the 1st support level at 0.6090 is identified as a pullback support. Further below, the 2nd support level at 0.6015 is also noted as a pullback support that aligns close to the 61.80% Fibonacci Retracement level, further emphasizing its importance as a potential support zone.
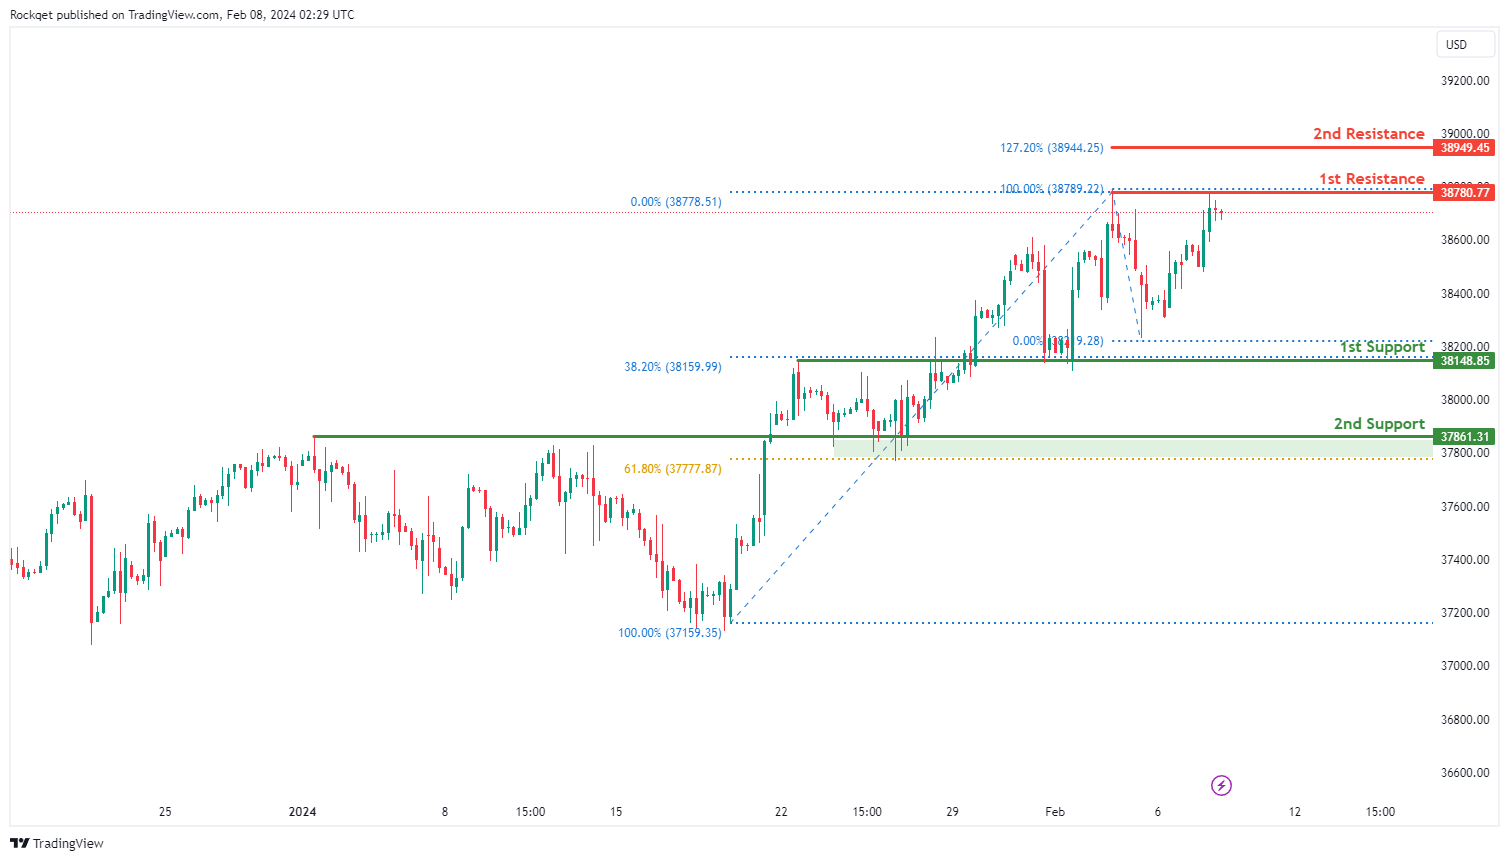
DJ30:
The DJ30 chart currently indicates a weak bearish momentum with low confidence, suggesting a tentative downward trend. Several key levels have been identified that could influence future price movements.
The 1st support level at 38,148.85 is significant as it represents an overlap support and coincides with the 38.20% Fibonacci Retracement, indicating a historical level where buying interest has previously emerged.
Additionally, the 2nd support at 37,861.31 aligns with an overlap support and the 61.80% Fibonacci Retracement, further reinforcing its potential as a level of price support.
On the resistance side, the 1st resistance at 38,780.77 is highlighted as a key level where selling pressure may intensify, representing a swing high resistance.
Furthermore, the 2nd resistance at 38,949.45 suggests a significant level of resistance, coinciding with the 127.20% Fibonacci Extension.
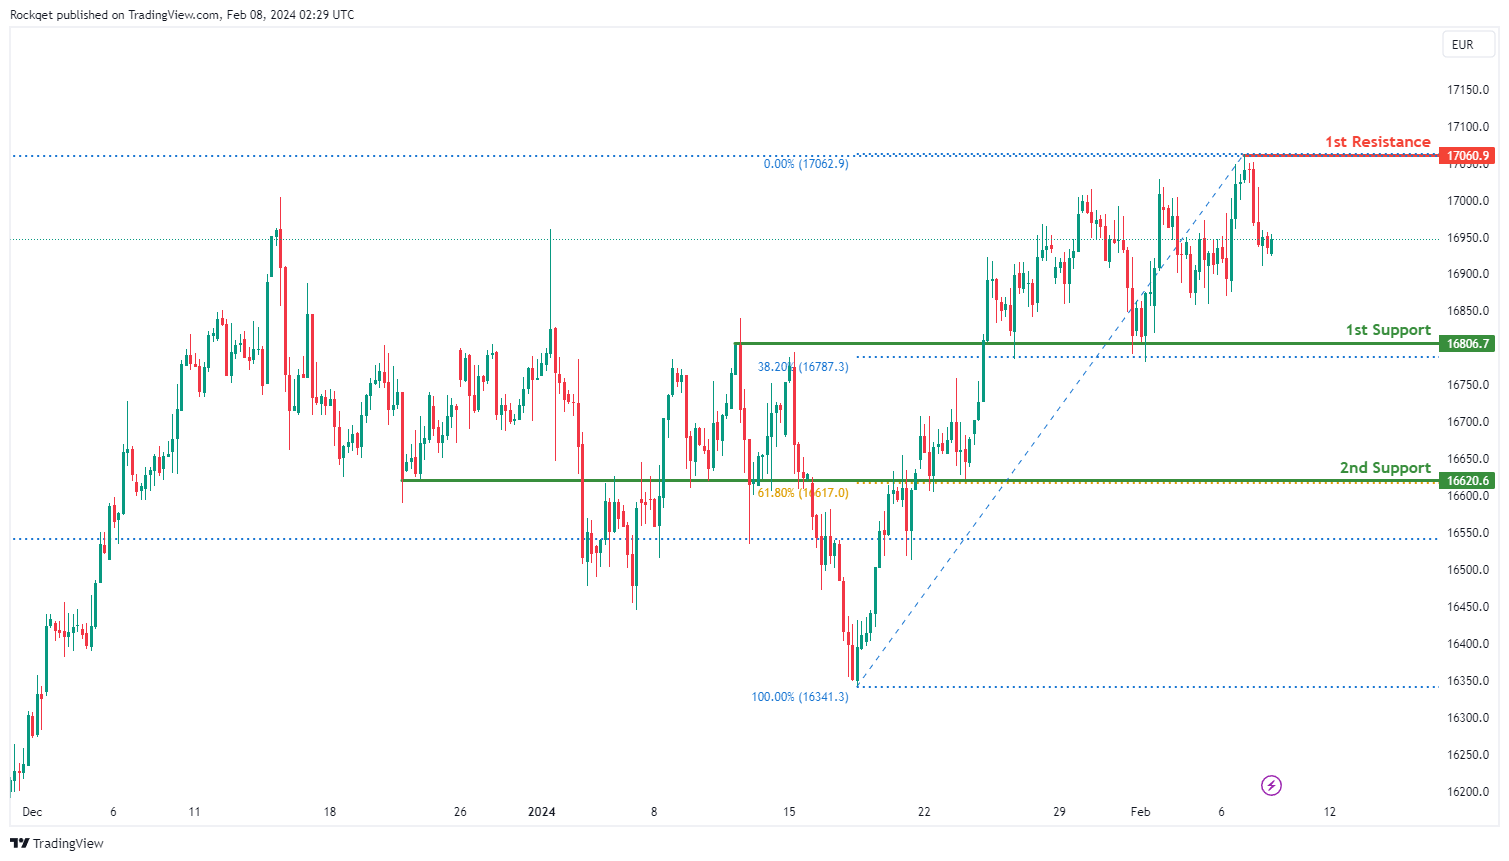
GER40:
The GER40 chart currently exhibits a bearish momentum, indicating a prevailing downward trend. Several factors contribute to this bearish sentiment, suggesting the potential for continued downward movement in the price.
The 1st support level at 16,806.7 is significant as it represents an overlap support and coincides with the 38.20% Fibonacci Retracement, indicating a historical level where buying interest has previously emerged.
Additionally, the 2nd support at 16,620.6 aligns with an overlap support and the 61.80% Fibonacci Retracement, adding further strength to the potential support zone.
On the resistance side, the 1st resistance at 17,060.9 is highlighted as a significant level where selling pressure may intensify, representing a swing high resistance. Furthermore, this level coincides with the 127.20% Fibonacci Extension, adding additional significance to this resistance level.
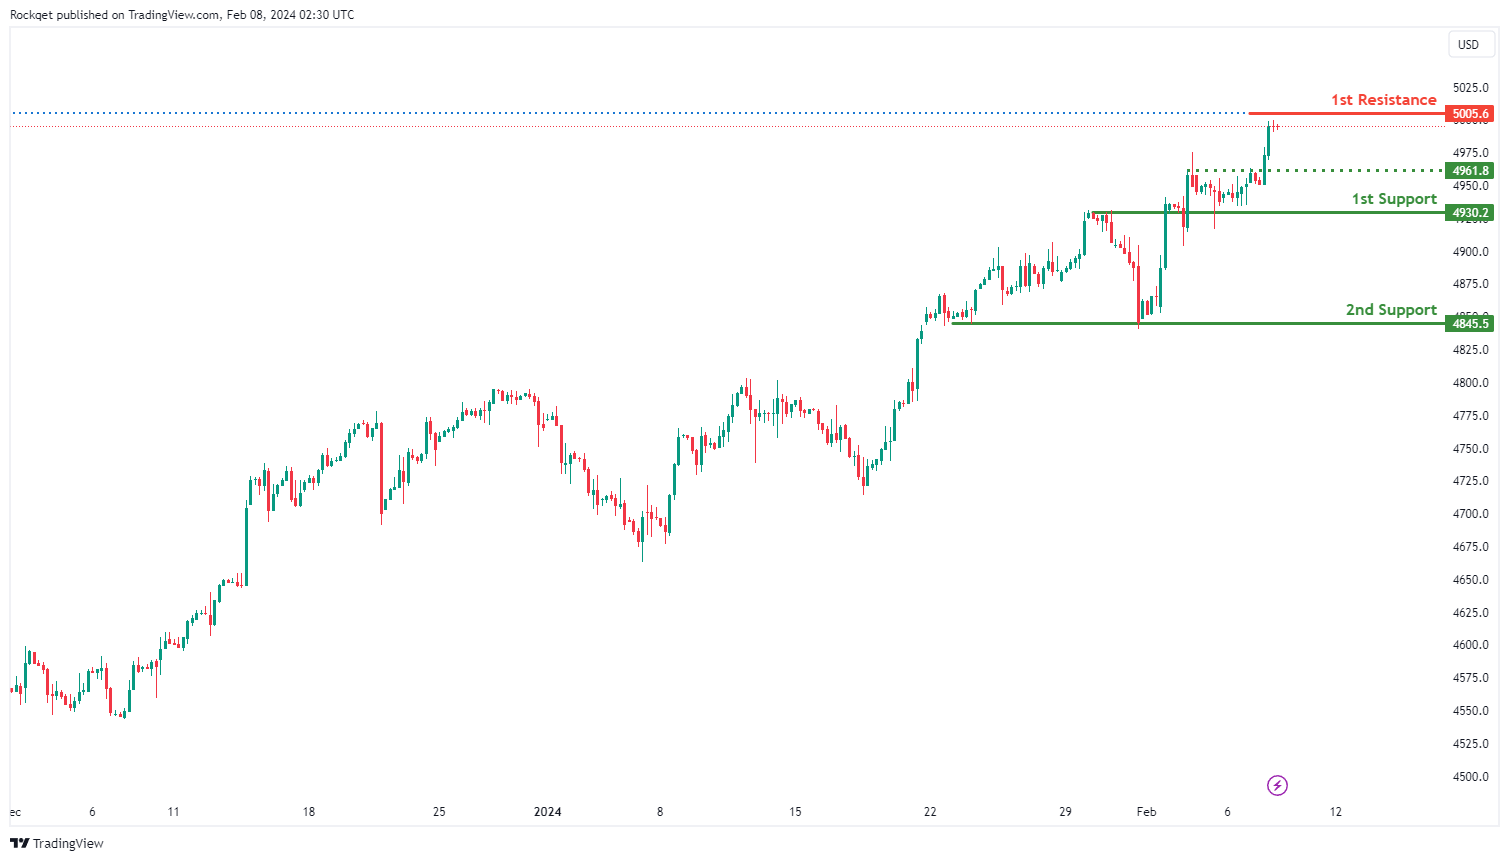
US500:
The US500 chart currently demonstrates a bullish overall momentum, indicating a prevailing upward trend. Multiple factors contribute to this bullish sentiment, supporting the potential for sustained upward movement in the price.
The 1st support level at 4930.2 is considered significant as it represents an overlap support and coincides with the 50% Fibonacci Retracement, indicating a historical level where buying interest has previously emerged.
Additionally, the 2nd support at 4845.5 is a swing low support, further strengthening the potential support zone.
An intermediate support level at 4961.8 is identified, aligning with a pullback support, providing additional reinforcement to the bullish scenario.
On the resistance side, the 1st resistance at 5005.6 is highlighted as a significant level where selling pressure may intensify. This resistance level corresponds to the 78.60% Fibonacci Projection, adding further significance to this resistance level.
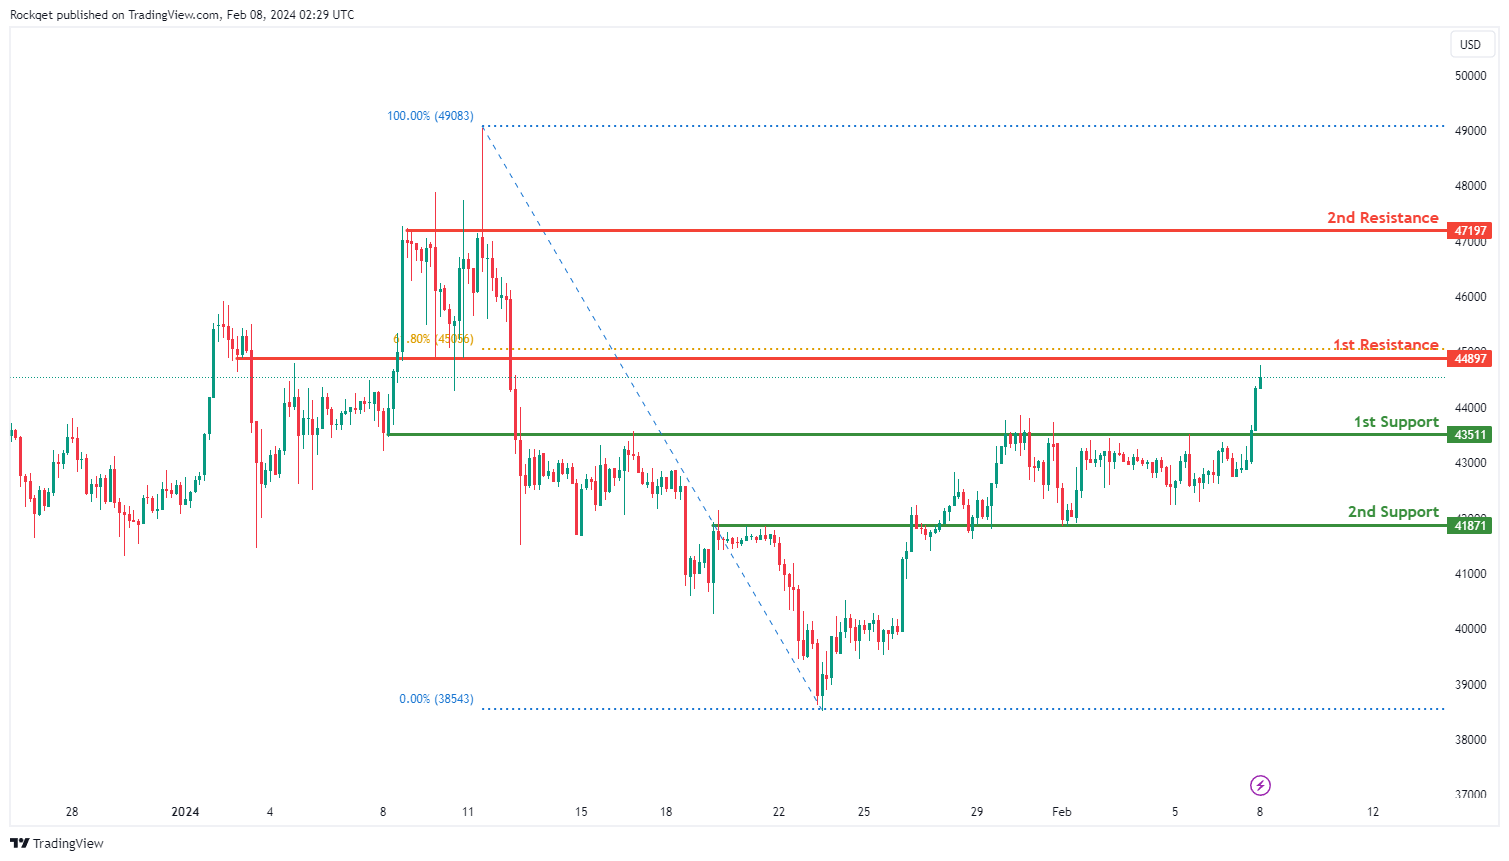
BTC/USD:
The BTC/USD chart currently exhibits a bullish overall momentum, suggesting a prevailing upward trend. Several factors contribute to this bullish sentiment, supporting the potential for continued upward movement in the price.
The 1st support level at 43511 is identified as an overlap support, indicating a historical level where buying interest has previously emerged.
Additionally, the 2nd support at 41871 reinforces the potential support zone as another overlap support.
On the resistance side, the 1st resistance at 44897 is highlighted as a significant level where selling pressure may intensify. This resistance level also aligns with the 61.80% Fibonacci Retracement, adding further significance to its potential as a barrier to the bullish momentum.
Furthermore, the 2nd resistance at 47197 is recognized as a multi-swing high resistance level, indicating a historically significant obstacle to price movement.
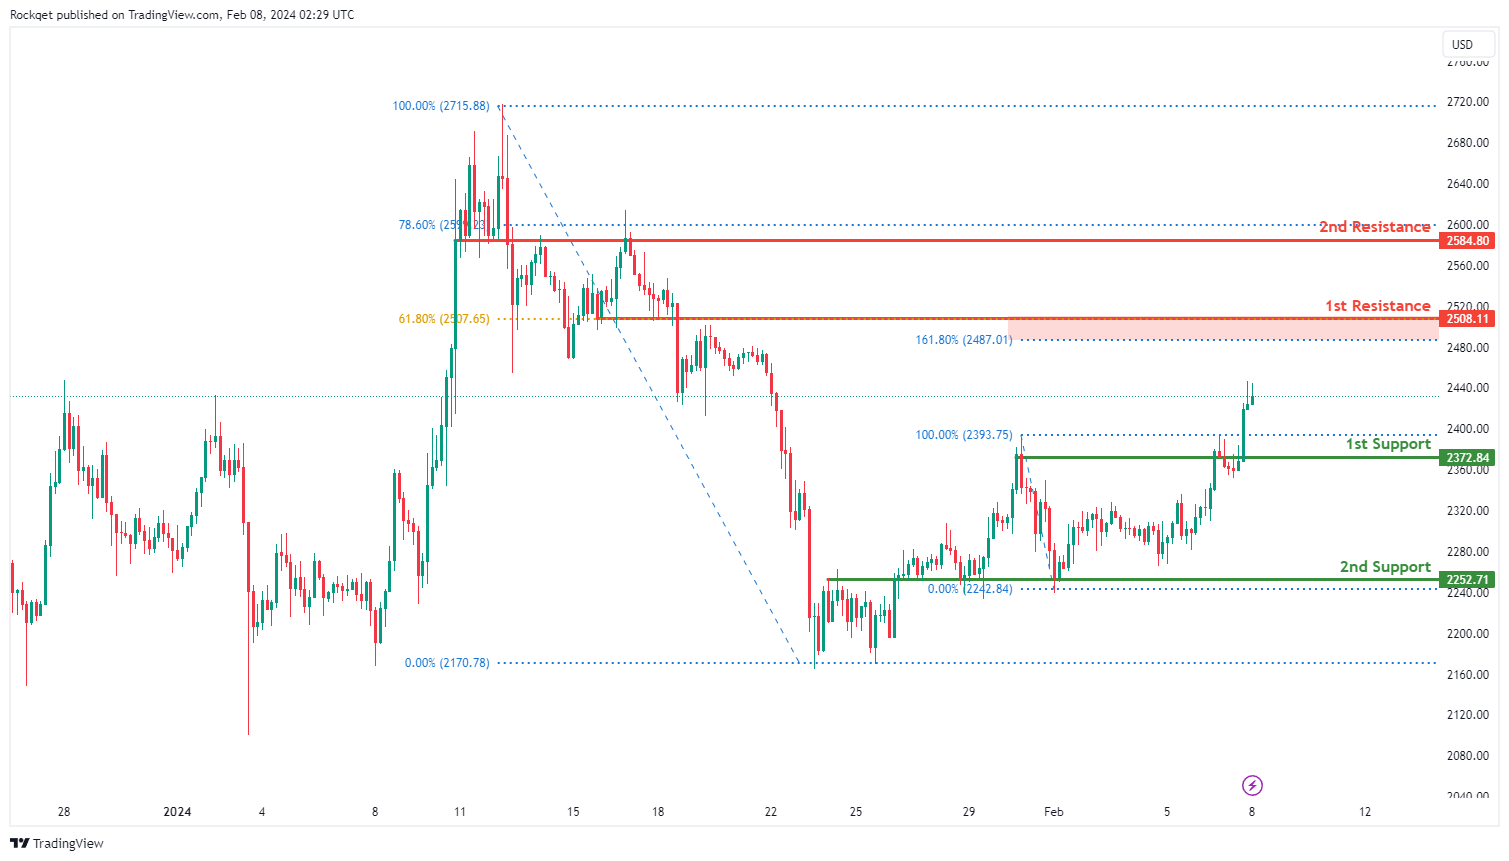
ETH/USD:
The ETH/USD chart currently demonstrates a bullish overall momentum, indicating a prevailing upward trend. Several factors contribute to this bullish sentiment, supporting the potential for continued upward movement in the price.
The 1st support level at 2372.84 is recognized as an overlap support, indicating a historical level where buying interest has previously emerged. Additionally, the 2nd support at 2252.71 reinforces the potential support zone as another overlap support.
On the resistance side, the 1st resistance at 2508.11 is highlighted as a significant level where selling pressure may intensify. This resistance level aligns with the 61.80% Fibonacci Retracement and the 161.80% Fibonacci Extension, adding further significance to its potential as a barrier to the bullish momentum.
Furthermore, the 2nd resistance at 2584.80 is recognized as an overlap resistance, coinciding with the 78.60% Fibonacci Retracement, reinforcing its importance as a resistance level.
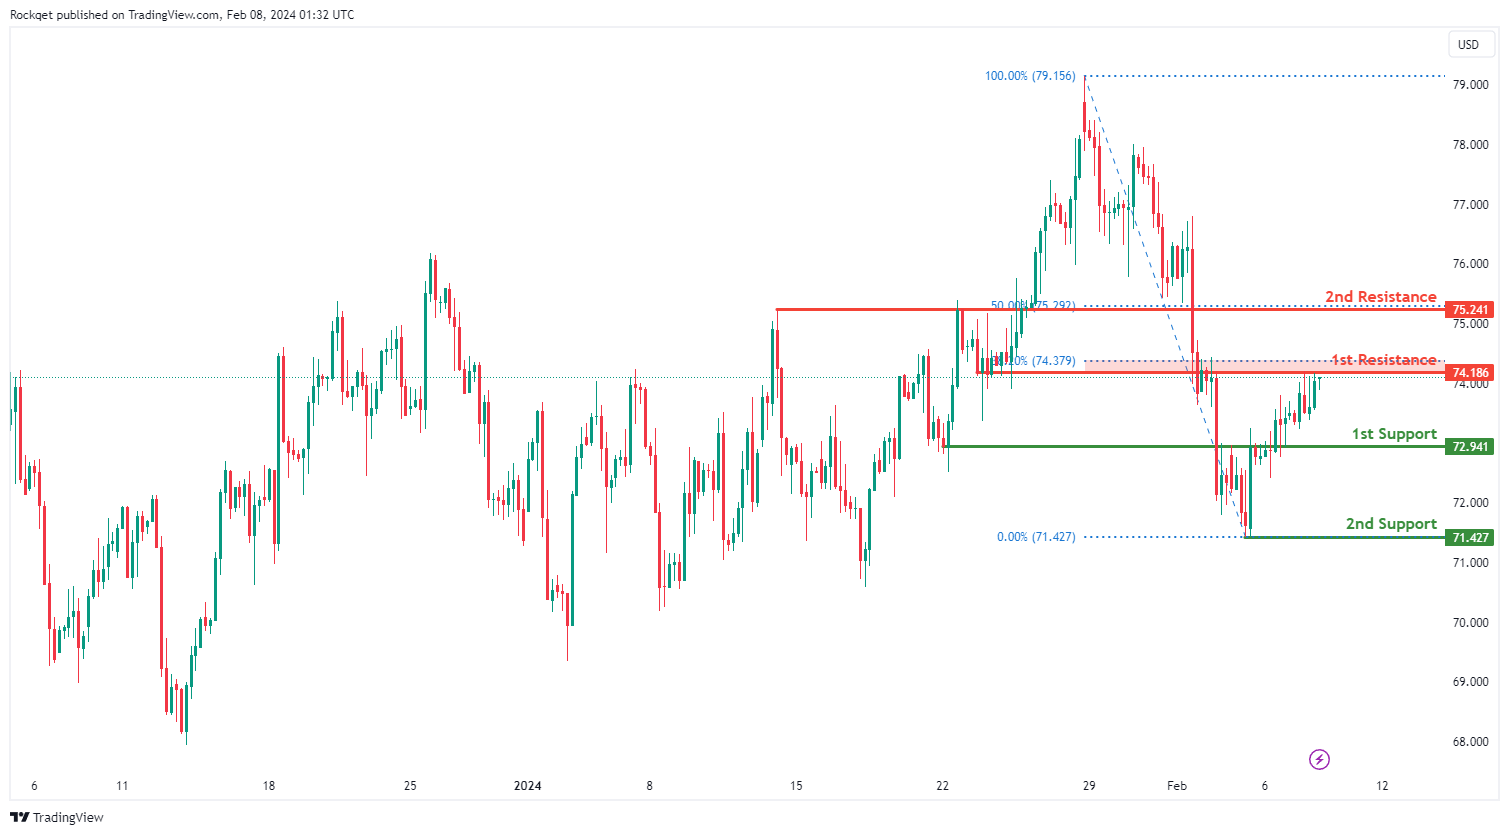
WTI/USD:
The WTI (West Texas Intermediate) chart currently exhibits an overall bullish momentum. In this context, there is a potential scenario for price to rise towards the 1st resistance.
The 1st resistance level at 74.18 is identified as an overlap resistance that aligns close to the 38.20% Fibonacci Retracement level. Higher up, the 2nd resistance level at 75.24 is marked as a pullback resistance that aligns with the 50.00% Fibonacci Retracement level, further highlighting its importance as a potential resistance zone.
To the downside, the 1st support level at 72.94 is identified as an overlap support. Further below, the 2nd support level at 71.42 is identified as a pullback support, reinforcing its significance as a key support level.
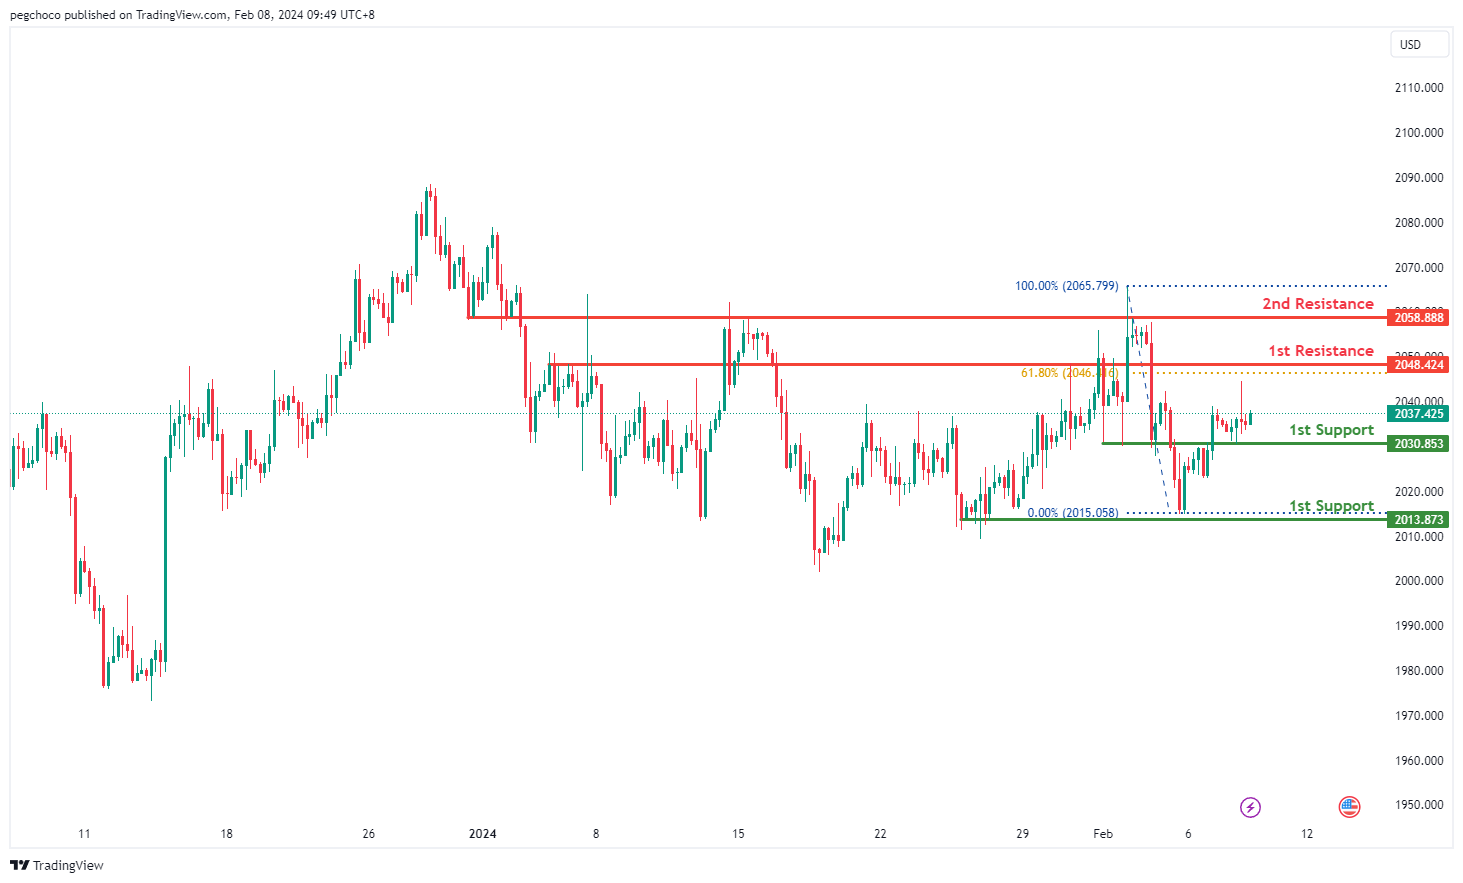
XAU/USD (GOLD):
The XAUUSD chart currently demonstrates bullish momentum, indicating an upward trend. There’s a potential for a bullish continuation towards the 1st resistance level.
The 1st support level at 2030.85 is identified as an overlap support, suggesting its historical significance as a level where buying interest may emerge.
Similarly, the 2nd support at 2013.87 is characterized as a multi-swing low support, reinforcing its importance as a level where buyers might enter the market.
On the resistance side, the 1st resistance level at 2048.42 is categorized as a pullback resistance, indicating its historical significance as a barrier for further upward movement. This level aligns with the 61.80% Fibonacci Retracement, adding to its significance.
Additionally, the 2nd resistance level at 2058.88 is identified as an overlap resistance, further adding to its potential as a barrier for further upside movement.
China’s deepening deflation: CPI hits 14-year low in Jan
China's CPI took a notable dip in January, registering decrease of -0.8% yoy, marking a significant deepening of deflationary pressures from the previous month's -0.3% and falling short of expectation -0.5% yoy. This downturn represents the fourth consecutive negative reading and the most substantial fall observed since 2009, over fourteen years ago.
The decline was particularly pronounced in food prices, which was down -5.9% yoy. Meanwhile, core CPI, which excludes volatile energy and food prices, rose by a modest 0.4% yoy, slowing from December's 0.6% yoy increase. Despite the annual downturn, CPI saw a slight month-on-month increase of 0.3%, albeit below the anticipated 0.4% growth.
The NBS attributed January's inflation figures to the high base effect associated with the Spring Festival, or Lunar New Year, which occurred in January the previous year. This annual holiday, which shifts between January and February depending on the lunar calendar, significantly impacts consumption patterns and inflation metrics due to its influence on consumer spending and business operations.
In parallel, PPI fell by -2.5% yoy in January, showing a modest improvement from the -2.7% yoy observed in the previous month and slightly better than -2.6% forecast. This marks the 16th consecutive month of annual declines for PPI, with factory-gate prices decreasing by -0.2% mom, following -0.3% mom drop in December.
BoC cites difficulty in predicting appropriate timing of rate cuts
BoC's deliberations from the January meeting saw the governing council expressing that it was "difficult to foresee when it would be appropriate to begin cutting interest rates."
The possibility of additional rate hikes was not dismissed, with members indicating that such measures could be warranted should new inflationary surprises emerge. However, the focus of future policy discussions would likely "shift to how much longer to maintain the policy rate at 5% to sustain the disinflationary process."
Inflation's persistent high levels and broad impact have prompted the council to emphasize their ongoing concerns regarding "persistence of underlying inflation" in their communications.
The members collectively agreed on the necessity for "further evidence of progress toward price stability," seeking definitive signs of a downturn in core inflation rates.
To gauge the effectiveness of their monetary policy and the evolving economic landscape, the Governing Council plans to closely monitor core inflation alongside several critical indicators. These include the equilibrium between supply and demand within the economy, corporate pricing strategies, inflation expectations, and the ratio of wage growth to productivity.
Fed’s Barkin endorses patience regarding rate cuts
Richmond Fed President Thomas Barkin has voiced a call for patience concerning interest rate cuts, in the face of prevailing economic uncertainties.
"I am very supportive of being patient to get to where we need to get," Barkin articulated during an event overnight.
Barkin highlighted the ongoing efforts to combat inflation, acknowledging that while progress has been made towards balancing the trade-offs between economic growth and inflation control, "a reasonable amount of uncertainty" remains.
He pointed out that the inflationary challenges are not confined to goods alone but extend to services and rental sectors.
"Declaring victory is very enticing, but you're never going to hear me do that," Barkin asserted.
Fed’s Collins: Sustained, broadening inflation progress needed before methodical policy relaxation
Boston Fed President Susan Collins emphasized the need for "sustained, broadening signs of progress" in inflation reduction before contemplating any "methodical" adjustments to interest rate policy.
"As we gain more confidence in the economy achieving the Committee's goals... I believe it will likely become appropriate to begin easing policy restraint later this year," she stated in a speech overnight.
She advocates for a gradual approach to interest rate adjustments, allowing for "flexibility to manage risks, while promoting stable prices and maximum employment."
Collins also highlighted the resilience of the US economy, as evidenced by recent GDP and labor market data, suggesting that the anticipated slowdown in economic activity "may take some time".
"The path the economy takes toward the Fed's mandated goals may continue to be bumpy and uneven, and we should not overreact to individual data points," she advised.
A critical factor in Collins's assessment is wage dynamics, with a specific interest in wage trends that align with long-term price stability. While acknowledging that not all economic indicators might perfectly converge, "seeing sustained, broadening signs of progress should provide the necessary confidence I would need to begin a methodical adjustment to our policy stance."
Fed’s Kugler highlights inflation risks stemming from consumer behavior, job market, and global tensions
In a speech overnight, Fed Governor Adriana Kugler said she's satisfied with the disinflationary progress, and expects it to "continue". However, she was quick to temper this optimism with a note of caution, emphasizing that Fed's work in combating inflation is far from over. The unpredictability of consumer behavior stands as a reminder of unforeseen developments to "slow progress on inflation."
Kugler also pointed to the recent employment report, which showed unexpected strength. While a strong labor market is generally a positive sign, in the context of Fed's efforts to cool inflation, such robustness could complicate the path to achieving a balanced demand-supply equation in both product and labor markets.
Fed Governor underscored the importance of monitoring geopolitical risks, particularly highlighting how the ongoing conflict in Ukraine and tensions in the Middle East could exacerbate inflationary pressures through "higher commodity prices" and global trade "disruptions", "in turn pushing up goods inflation in the US".
"At some point, the continued cooling of inflation and labor markets may make it appropriate to reduce the target range for the federal funds rate," she noted. Conversely, "if progress on disinflation stalls, it may be appropriate to hold the target range steady at its current level for longer to ensure continued progress on our dual mandate."
GBP/USD – A Bearish Reversal at a Key Fib Level?
- Fed policymakers sticking to the script
- US data continues to point to a strong economy
- Fib rebound may suggest we’ve seen a correction in GBPUSD
It isn’t the busiest week as far as UK and US economic data is concerned but there are still a few pieces worth keeping an eye on. As well as, of course, the scattering of central bank speak.
So far, policymakers appear to remain consistent with the message from the last meeting despite Friday’s surprisingly strong jobs report.
The services PMI on Monday was also far better than expected, further supporting the view that the economy is far from suffering under the weight of high interest rates.
Have we just seen a correction in GBPUSD?
But perhaps it’s the technicals that could prove to be more interesting this week.
GBPUSD Daily
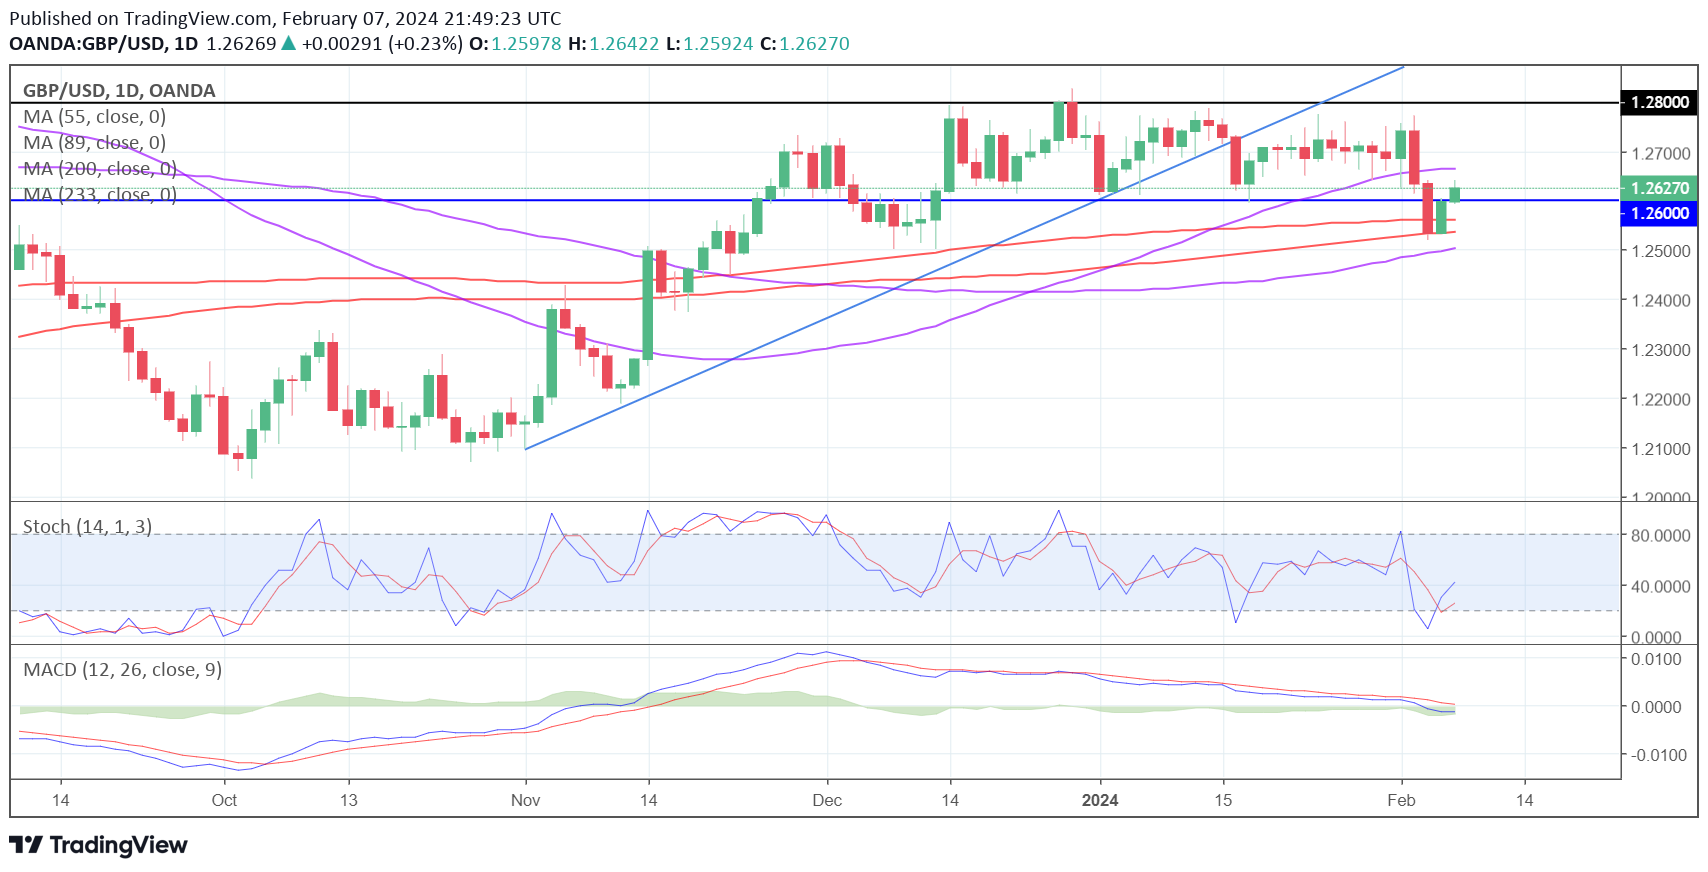
Source – OANDA
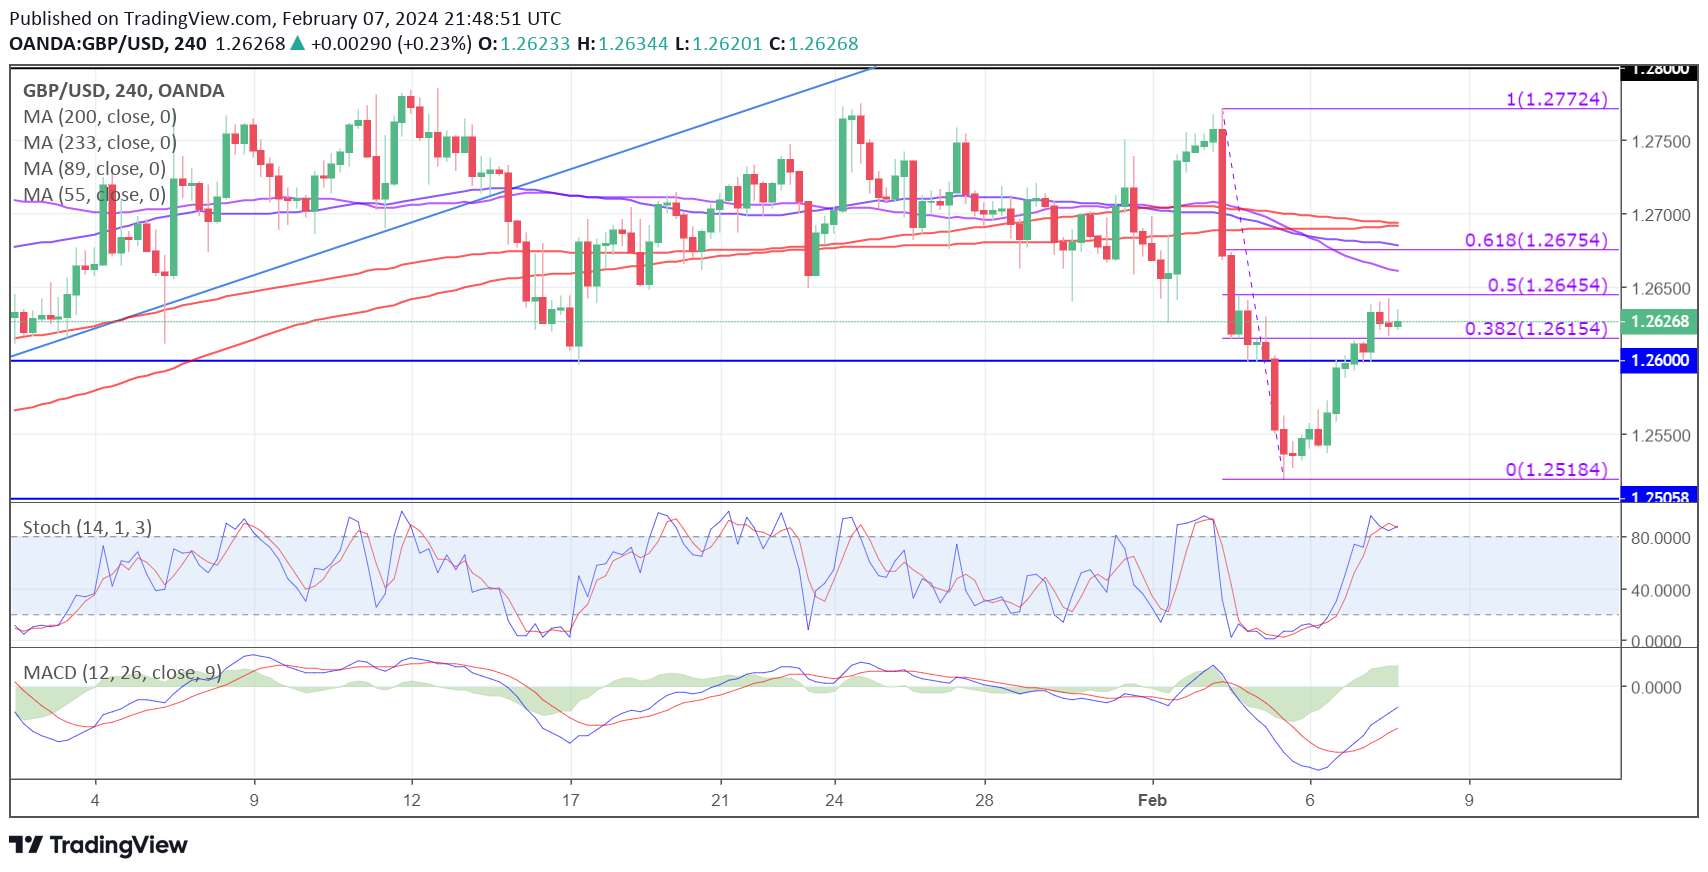
On Monday the pair broke below the neckline of a quadruple top formation around 1.26. While it has since pulled back, it could just be a corrective move and the rotation off the 50% Fibonacci retracement level today may support that view.
GBPUSD 4-Hour
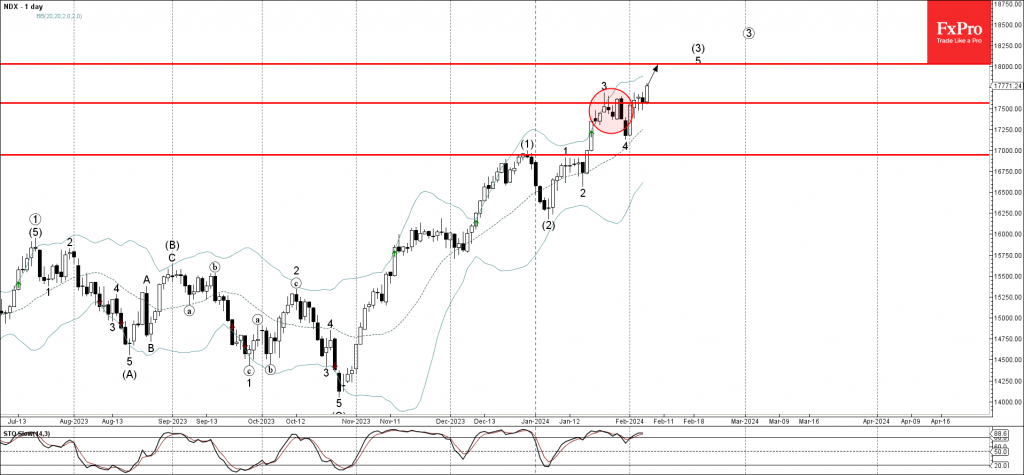
Nasdaq-100 Wave Analysis
- Nasdaq-100 rising inside impulse wave 5
- Likely to rise to resistance level 18000.00
Nasdaq-100 index rising steadily after the price reversed up from the support level 17565.00, former resistance which stopped wave 3 in January.
The upward reversal from the support level 17565.00 continues the active impulse wave 5 of the intermediate impulse sequence (3) from the start of the year.
Given the clear daily uptrend, Nasdaq-100 index can be expected to rise further to the next resistance level 18000.00, target for the completion of the active impulse wave 5.