
Sample Category Title
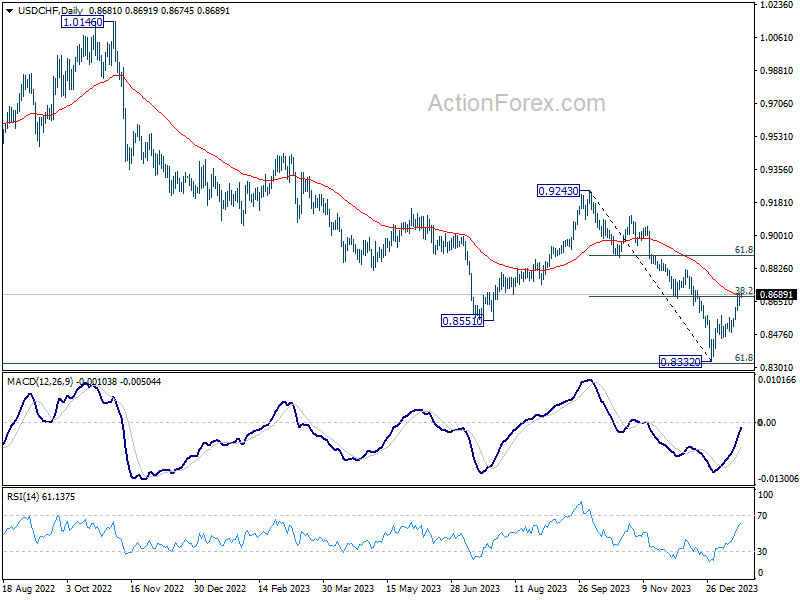
USD/CHF Daily Outlook
Daily Pivots: (S1) 0.8644; (P) 0.8670; (R1) 0.8707; More....
Outlook in USD/CHF remains unchanged with focus on 0.8665 support turned resistance. Decisive break there will turn near term outlook bullish for 61.8% retracement of 0.9243 to 0.8332 at 0.8995. Nevertheless, break of 0.8565 minor support will turn intraday bias back to the downside for retesting 0.8332 low.
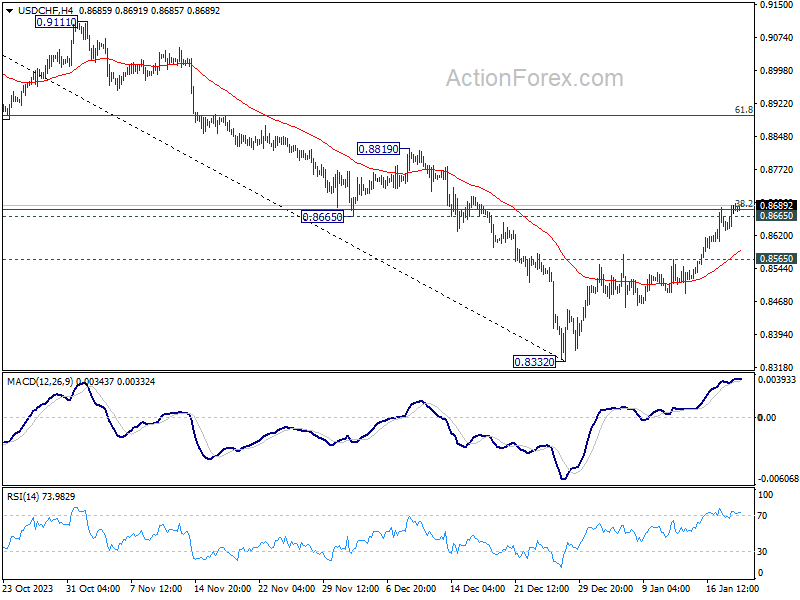
In the bigger picture, outlook in USD/CHF will stay bearish as long as 0.9243 resistance holds. Larger down trend from 1.0146 (2022 high) should resume through 0.8332 low at a later stage.
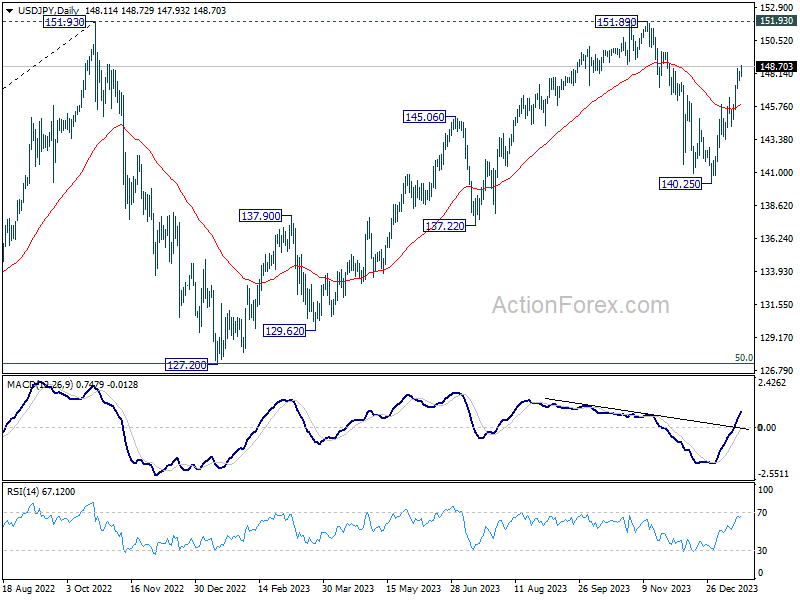
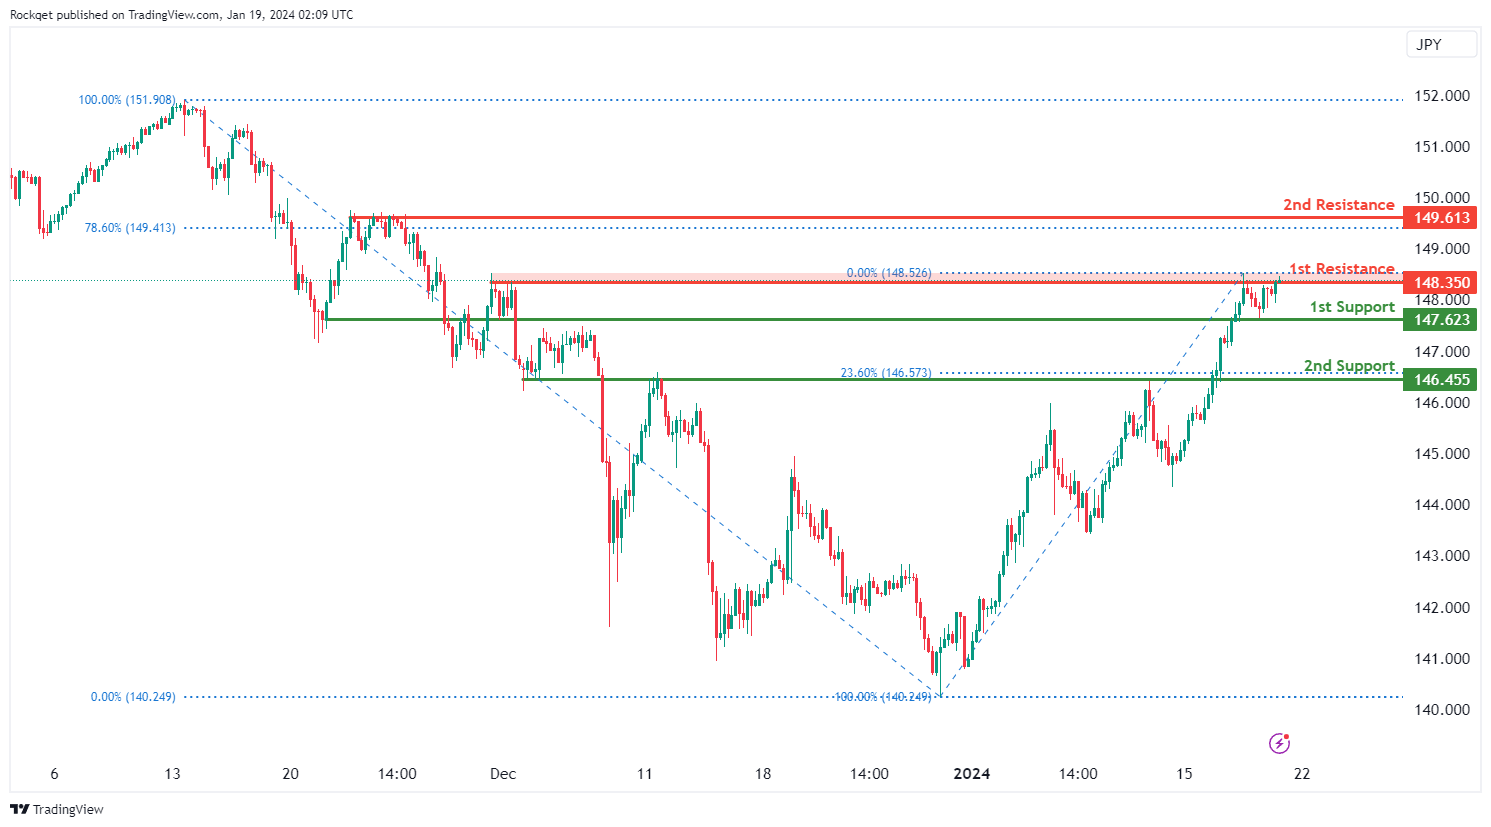
USD/JPY Daily Outlook
Daily Pivots: (S1) 147.78; (P) 148.05; (R1) 148.44; More...
USD/JPY's rally resumed after brief retreat and intraday bias is back on the upside. Current rise from 140.25 should target a retest on 151.89/93 key resistance zone. On the downside, below 147.64 minor support will turn intraday bias neutral again and bring consolidations, before staging another rise.
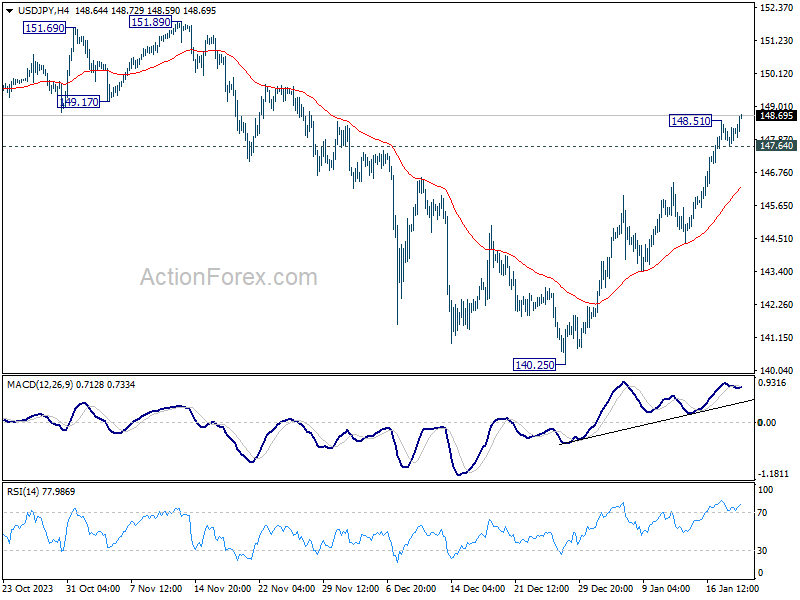
In the bigger picture, stronger than expected rebound from 140.25 dampened the original bearish review. Strong support from 55 W EMA (now at 141.89) is also a medium term bullish sign. Fall from 151.89 could be a correction to rise from 127.20 only. Decisive break of 151.89/93 will confirm resumption of long term up trend. This will now be the favored case as long as 140.25 support holds.
Yen’s Decline Persists Following Japan CPI Release, Dollar Upholds Its Lead
Yen' decline resume today after release of Japan's latest CPI data, which suggests that BoJ is not be under immediate pressure to exit its negative interest rate policy. . Economists have noted a crucial aspect of Japan's inflation dynamics: while cost-push inflation is clearly easing, the transition to demand-pull inflation remains unconfirmed. The market's attention is now turning to BoJ's meeting next week, where new economic forecasts will be published. Although many analysts consider April as the most likely month for a rate hike, this remains contingent on the upcoming projections.
Amidst the Yen's decline, USD/JPY is approaching 150 psychological level, prompting verbal interventions from Japanese financial authorities. Finance Minister Shunichi Suzuki reiterated the importance of stable currency movements that reflect economic fundamentals. He assured that the government would continue to closely monitor forex markets. However, these comments have not provided a sustainable boost to Yen.
For the week, Dollar remains the strongest performer, but its rally is pausing with the rebound in stocks overnight. However, there is no indication of a reversal in Dollar's strength at this stage. Sterling and Euro are following as the second and third strongest currencies, respectively. Yen remains at the bottom of the performance chart, trailed by New Zealand Dollar and Swiss Franc. Australian Dollar is also showing softness, while Canadian Dollar displays mixed performance.
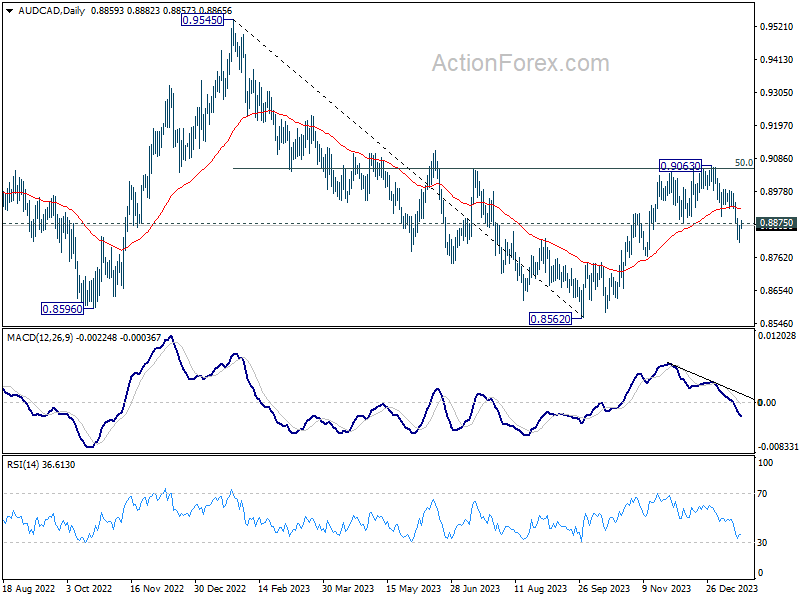
Technically, AUD/CAD's break of 0.8875 support indicates that rebound from 0.8562 has completed at 0.9063, after hitting 50% retracement of 0.9545 to 0.8562 at 0.9054. Further decline is now expected as long as 55 D EMA (now at 0.8920) holds. Next target is a retest on 0.8562 low. It's still a early to assess, but further downside acceleration would raise the chance of breaking through 0.8562 to resume larger down trend from 0.9991 (2021 high).
In Asia, at the time of writing, Nikkei is up 1.34%. Hong Kong HSI is down -0.66%. China Shanghai SSE is down -0.60%. Singapore Strait Times is up 0.31%. Japan 10-year JGB yield is up 0.0133 at 0.668. Overnight, DOW rose 0.54%. S&P 500 rose 0.88%. NASDAQ rose 1.35%. 10-year yield rose 0.038 to 4.144.
Fed's Bostic foresees rate cuts in Q3, sets high bar for earlier action
Atlanta Fed Raphael Bostic said overnight that he now projects Fed to begin cutting interest rates in the third quarter of this year, a shift in timing from his previous expectation of the fourth quarter.
This adjustment is a response to the recent economic data, as he explained, "Because I'm data dependent, I have incorporated the unexpected progress on inflation and economic activity into my outlook, and thus moved up my projected time to begin normalizing the federal funds rate to the third quarter of this year from the fourth quarter."
While Bostic does not entirely dismiss the possibility of an earlier rate cut, potentially as soon as July, he emphasizes that the criteria for such a decision would be stringent. "The bar will be high," he stated, indicating that any move to cut rates before the third quarter would require substantial and convincing evidence.
He elaborated on this point, saying, "If we continue to see a further accumulation of downside surprises in the data, it's possible for me to get comfortable enough to advocate normalization sooner than the third quarter." However, he stresses that the evidence supporting such a decision would need to be compelling.
Japan's CPI core dips to 2.3%, remains above BoJ's target for 21st month
Japan's CPI core, excluding fresh food, decelerated slightly in December, moving from 2.5% yoy to 2.3% yoy, aligning with market expectations. This slowdown brings core inflation rate to its lowest since June 2022, yet it notably remains above BoJ's 2% target for the 21st consecutive month.
Overall headline CPI also showed a slowdown, decreasing from 2.8% yoy to 2.6% yoy. Additionally, CPI core-core, which excludes both food and energy, saw a modest decline, moving from 3.8% yoy to 3.7% yoy.
A notable aspect of CPI data is the stability of services prices, which rose by 2.3% yoy, maintaining the pace from the previous month. This rate marks the fastest increase in services prices in three decades when periods affected by sales tax hikes are excluded.
A significant factor contributing to the slowdown in inflation was the substantial drop in energy prices, which decreased by -11.6% yoy. This decline was driven by reductions in electricity and city gas prices, which fell by -20.5% yoy and -20.6% yoy, respectively, largely due to government subsidies.
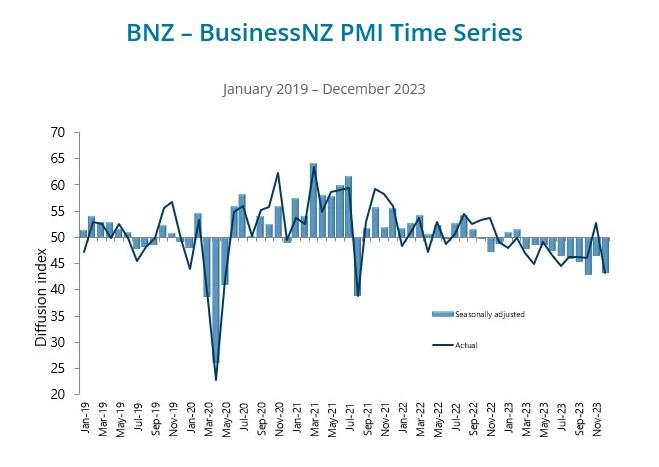
NZ BNZ manufacturing falls to 43.1, 10th month of contraction
New Zealand's BusinessNZ Performance of Manufacturing Index fell from 46.5 to 43.1 in December. This latest figure marks a continued contraction in the manufacturing sector, which has now been shrinking for ten consecutive months.
The index components reveal a widespread decline across various manufacturing activities. Production fell from 43.5 to 40.5. Employment decreased from 47.9 to 46.7. New orders dropped from 47.4 to 44.0. Similarly, finished stocks and deliveries both saw declines, from 50.4 to 45.9 and 47.8 to 43.4, respectively.
Manufacturers' feedback further underscored the industry's challenges, with 61% of the comments in December being negative. This is a slight increase from 58.7% in November, though an improvement from 65.1% in October. The predominant concerns revolved around a lack of demand and sales, which have been significant hurdles for many manufacturers.
Stephen Toplis, BNZ's Head of Research, echoed these sentiments in his assessment of the PMI data. "The December PMI reaffirms our view that economic conditions remain very difficult," he stated. Toplis anticipates that while the economy and the manufacturing sector might gain some momentum by the end of 2024, the immediate future appears challenging, particularly with pressures in retail spending and construction activity.
Looking ahead
UK retail sales and German PPI will be released in European session. Later in the day, Canada will publish retail sales. US will release existing home sales and U of Michigan consumer sentiment.
USD/JPY Daily Outlook
Daily Pivots: (S1) 147.78; (P) 148.05; (R1) 148.44; More...
USD/JPY's rally resumed after brief retreat and intraday bias is back on the upside. Current rise from 140.25 should target a retest on 151.89/93 key resistance zone. On the downside, below 147.64 minor support will turn intraday bias neutral again and bring consolidations, before staging another rise.
In the bigger picture, stronger than expected rebound from 140.25 dampened the original bearish review. Strong support from 55 W EMA (now at 141.89) is also a medium term bullish sign. Fall from 151.89 could be a correction to rise from 127.20 only. Decisive break of 151.89/93 will confirm resumption of long term up trend. This will now be the favored case as long as 140.25 support holds.
Economic Indicators Update
| GMT | Ccy | Events | Actual | Forecast | Previous | Revised |
|---|---|---|---|---|---|---|
| 21:30 | NZD | Business NZ PMI Dec | 43.1 | 46.7 | 46.5 | |
| 23:30 | JPY | National CPI Y/Y Dec | 2.60% | 2.80% | ||
| 23:30 | JPY | National CPI ex Fresh Food Y/Y Dec | 2.30% | 2.30% | 2.50% | |
| 23:30 | JPY | National CPI ex Food & Energy Y/Y Dec | 3.70% | 3.80% | ||
| 04:30 | JPY | Tertiary Industry Index M/M Nov | -0.70% | 0.20% | -0.80% | -0.20% |
| 07:00 | GBP | Retail Sales M/M Dec | -0.50% | 1.30% | ||
| 07:00 | EUR | Germany PPI M/M Dec | -0.50% | -0.50% | ||
| 07:00 | EUR | Germany PPI Y/Y Dec | -7.90% | -7.90% | ||
| 07:30 | CHF | Producer and Import Prices M/M Dec | -0.60% | -0.90% | ||
| 07:30 | CHF | Producer and Import Prices Y/Y Dec | -1.30% | |||
| 13:30 | CAD | Retail Sales M/M Nov | 0.00% | 0.70% | ||
| 13:30 | CAD | Retail Sales ex Autos M/M Nov | -0.10% | 0.60% | ||
| 15:00 | USD | Existing Home Sales Dec | 3.82M | 3.82M | ||
| 15:00 | USD | Michigan Consumer Sentiment Index Jan P | 69.6 | 69.7 |
The Beats of Their Own Drums
Australia has been later to the inflation surge and disinflation than peer economies. So the RBA will be later than its peers to cut rates, too. Central banks can move policy according to domestic needs rather than be led by the Fed. Exchange rates are likely to respond.
The world is entering 2024 with global inflation declining, but still high. Goods price inflation has retreated as pandemic-related disruptions to supply chains have resolved. Services inflation is still high in many economies but it, too, is decelerating as domestic economies and especially labour markets soften. This means that, in most cases, a near-term rebound in domestic inflation is not a material concern.
Markets are looking ahead to the point that central banks can start cutting interest rates from current contractionary policy stances. This is likely to happen once they are confident inflation will return to target soon. They do not have to wait until inflation actually reaches the target. This is an implication of the lagged effects of monetary policy: central banks need to be forward-looking, reacting to shifts in the outlook and the risks around that outlook, and not necessarily to the latest data surprise.
Several major central banks have started communicating publicly about the timing of future rate cuts. In some cases, including the Federal Reserve and the ECB, this has been to hose down market expectations that these policymakers consider overly enthusiastic. Nonetheless, these policymakers are acknowledging that rate cuts are coming within the year.
Australia has been later to the inflation surge and disinflation than peer economies. We were later to open up after the pandemic, and for institutional reasons, some of the other supply shocks have had a more drawn-out effect here as well. For example, while Russia invaded Ukraine in February 2022, it was July 2023 before Australian households started seeing the effects of higher energy prices in their electricity bills. The extraordinary surge in labour supply here has both delayed and dampened the upswing in wages growth; our wage bargaining institutions have played a role here as well.
As a result, the RBA will be later than its peers to cut rates, too. We currently expect that the RBA will reach that point around its September meeting. This is noticeably later than market pricing for the Fed or the ECB.
We are often asked whether the RBA (or the central bank of any other small open economy) can operate on such different timing. The answer is that they can. When the exchange rate floats, monetary policy can move quite independently in response to domestic needs. Global factors will have a common influence on the actions of all monetary policymakers, as we saw during the pandemic. But as long as the exchange rate floats, central banks can respond to the domestic implications of that common factor, not to the responses of their larger counterparts.
An examination of recent history makes this clear. Central banks do move their policy rates on different timetables. For example, in early 2008 and in the mid 2010s, the RBA and the Federal Reserve were moving in opposite directions. The domestic situations differed and so did the monetary policy response.
The floating exchange rate regime makes this possible because the exchange rate then adjusts to absorb the shifts in investment flows attracted by changing relative yields. Yes, higher rates relative to the major economies attract capital flows, but they also push the exchange rate up. This makes the trade more expensive, and so less attractive. So there are limits to the speculative capital flows that will be induced by the interest differential, if that is the kind of thing that worries you.
That exchange rate adjustment is in fact part of the transmission mechanism of monetary policy and works to support what the central bank is trying to achieve. If the rate differential increases (or in the near term for Australia, becomes less negative than before), and the exchange rate appreciates, that tends to put downward pressure on the domestic prices of internationally traded goods and services. This includes domestically produced tradable items, which must compete with foreign producers. The result is lower inflation, at least for a time.
There are situations when this adjustment is uncomfortable. But this is more of an issue for emerging markets, where sudden shifts in capital flows can cause market disruption. Countries with dominant trading relationships with another economy might be reluctant to see too much appreciation against its currency, because of the impact on exporting businesses. That isn’t the situation for Australia in relation to the United States.
We therefore do not see any barriers to the RBA operating on its own timetable, driven by its own view of the domestic inflation outlook, different from that in the United States. This timing difference also underpins our view that the Australian dollar will appreciate over 2024, especially against the US dollar.
Of course, if everyone expects central banks to act as we expect, that will already be priced into exchange rates and there is no further impetus for them to move. When we talk about year-end expectations for an exchange rate, though, it’s a more subtle story of the balance of risks and where markets are more likely to be surprised relative to current pricing. Once the US Fed starts to move, that source of uncertainty is removed – and shifts in beliefs about RBA timing will be the remaining source of pricing action from interest differentials.
There are many risks around this central view, including geopolitical events and the headwinds to growth in China. Short-term movements in exchange rates can be driven by risk sentiment. In Australia’s case, the outlook for key commodity prices also tends to shape the outlook for the exchange rate. The outlook for both interest and exchange rates will always evolve with events.
The important thing to remember is that the rates outlook in each economy depends on the economic outlook in that economy. Central banks don’t have to follow the Fed mechanically. They can work to the beat of their own drum.
A Decent Rebound But More Data Needed to Justify Market Optimism
Stock markets are modestly higher on Thursday, recovering some of Wednesday's losses as investors seemingly struggle to determine where things stand.
There's clearly a desperate desire to cling on to the optimism that enabled such a strong end to the year but unlike in that period, the data isn't really playing ball. The releases we've seen so far this month have been fine and in the main, perfectly in keeping with the expectations people had coming into 2024. But is that enough?
Pricing on interest rates was very aggressive at the end of 2023 and perhaps the data needed to keep overdelivering to keep the party going. There's still a sense that it could again which is why there's seemingly so much reluctance to allow markets to correct in any significant way but at some point, the data needs to justify such loyalty or investors may start to worry that central banks won't be swayed.
Promising jobs and housing data from the US
Data from the US today has been a little positive, although, in the case of jobless claims, it's hard to say at this stage how much. Initial claims unexpectedly fell below 200,000 but arguably more promising, continuing claims have continued to edge down which suggests the market for those laid off has improved slightly.
The housing data trend is also looking better than it has for some time which suggests, as interest rates start to fall, we should see a pickup in the market once again.
Markets look kindly on weaker Australian jobs data
Australian jobs data overnight was a good reminder that, as far as the economy is concerned, bad news is good news for investors. Ultimately, it's inflation that will determine whether central banks start cutting rates but not every country will manage to get inflation to target while the economy performs well, as it looks like the US is on course to do.
As a result, weaker labor market figures and general economic performance is being well received at the moment in the hope that it convinces policymakers that they have succeeded in cooling demand and will achieve their goal of price stability. The Aussie dollar declines suggested the jobs data succeeded a little in that.
Oil could continue to consolidate despite choppiness
Oil prices are continuing to consolidate, with Brent still very choppy between $75 and $80. There are various upside and downside risks for the oil price, the upside currently being very prominent given events in the Middle East but as things stand, there's little signal of a significant shift in prices either way. It will happen eventually but there may be more consolidation ahead in the near term, barring a significant catalyst one way or another.
Gold nears $2,000 as traders pare back rate expectations
Gold has drifted lower over the last couple of days before running into some support around $2,000. Traders have slightly pared back expectations for rate cuts this year compared with the end of 2023 which has weighed on the yellow metal and could continue to do so if the data doesn't perform. A move below $2,000 could be a significant psychological blow but as things stand, the trend and momentum aren't looking particularly favorable.
Bitcoin optimism cools after ETF decision
Bitcoin has fallen quite a lot over the last week but continues to trade above $42,000, a level it's repeatedly tested in recent days. Optimism has naturally cooled a little since the ETF approvals as traders look to what's next that will be the catalyst for a rally higher. The halving in April is the obvious event that springs to mind, albeit with no guarantee for the price, but in the short term, the environment more broadly may have a bigger role to play.
Technical Outlook and Review
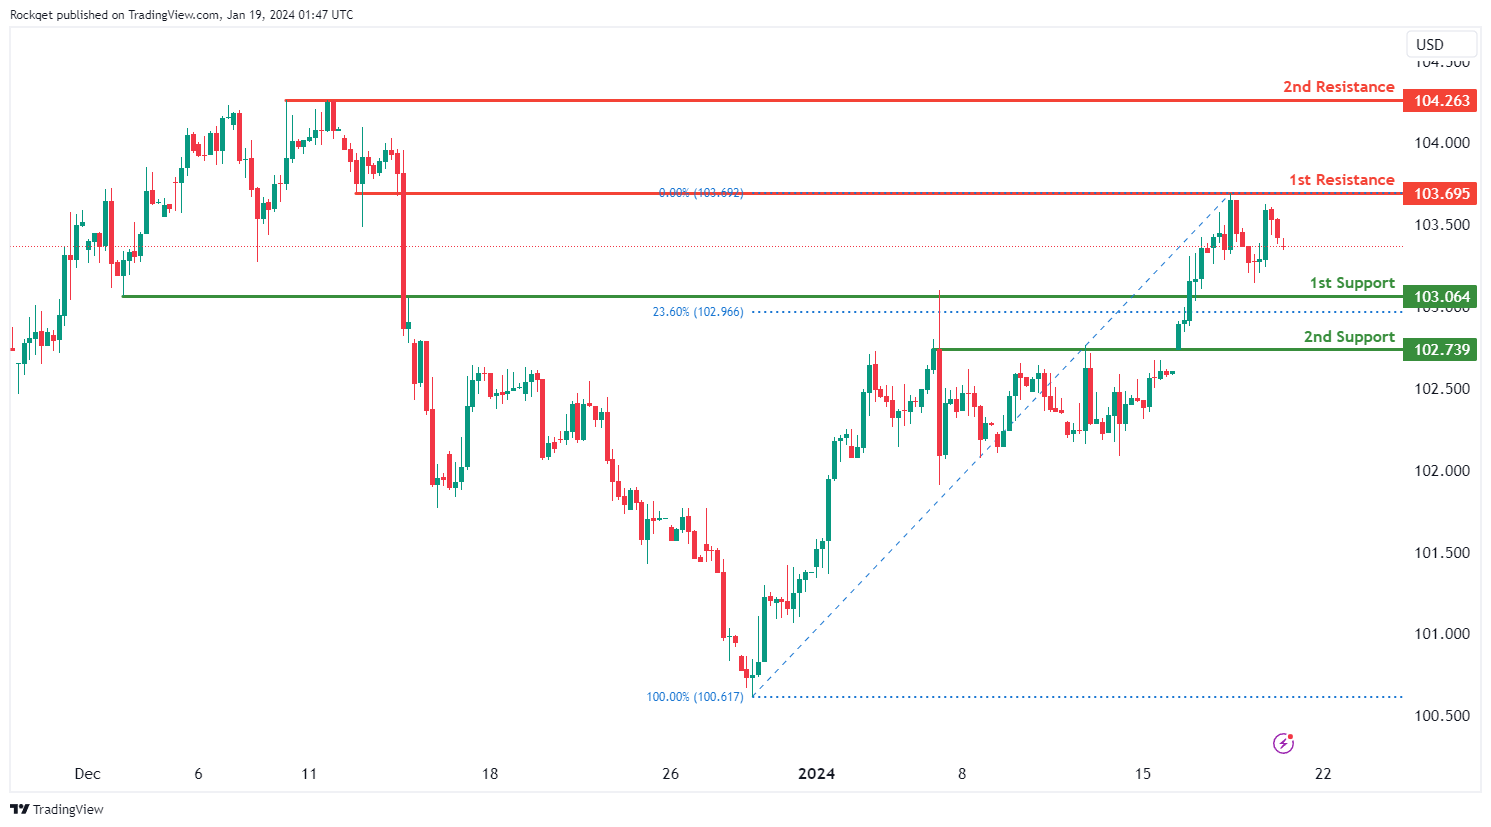
DXY:
The DXY (US Dollar Index) chart currently exhibits an overall bullish momentum. However, there is a potential scenario for price to drop towards the 1st support before resuming the uptrend.
The 1st support level at 103.06 is identified as an overlap support that aligns close to the 23.60% Fibonacci retracement level. Further below, the 2nd support level at 102.73 is also marked as an overlap support, further reinforcing its importance as a key support level.
To the upside, the 1st resistance level at 103.69 is identified as an overlap resistance. Higher up, the 2nd resistance level at 104.26 is noted as a pullback resistance, further reinforcing its significance as a potential resistance zone.
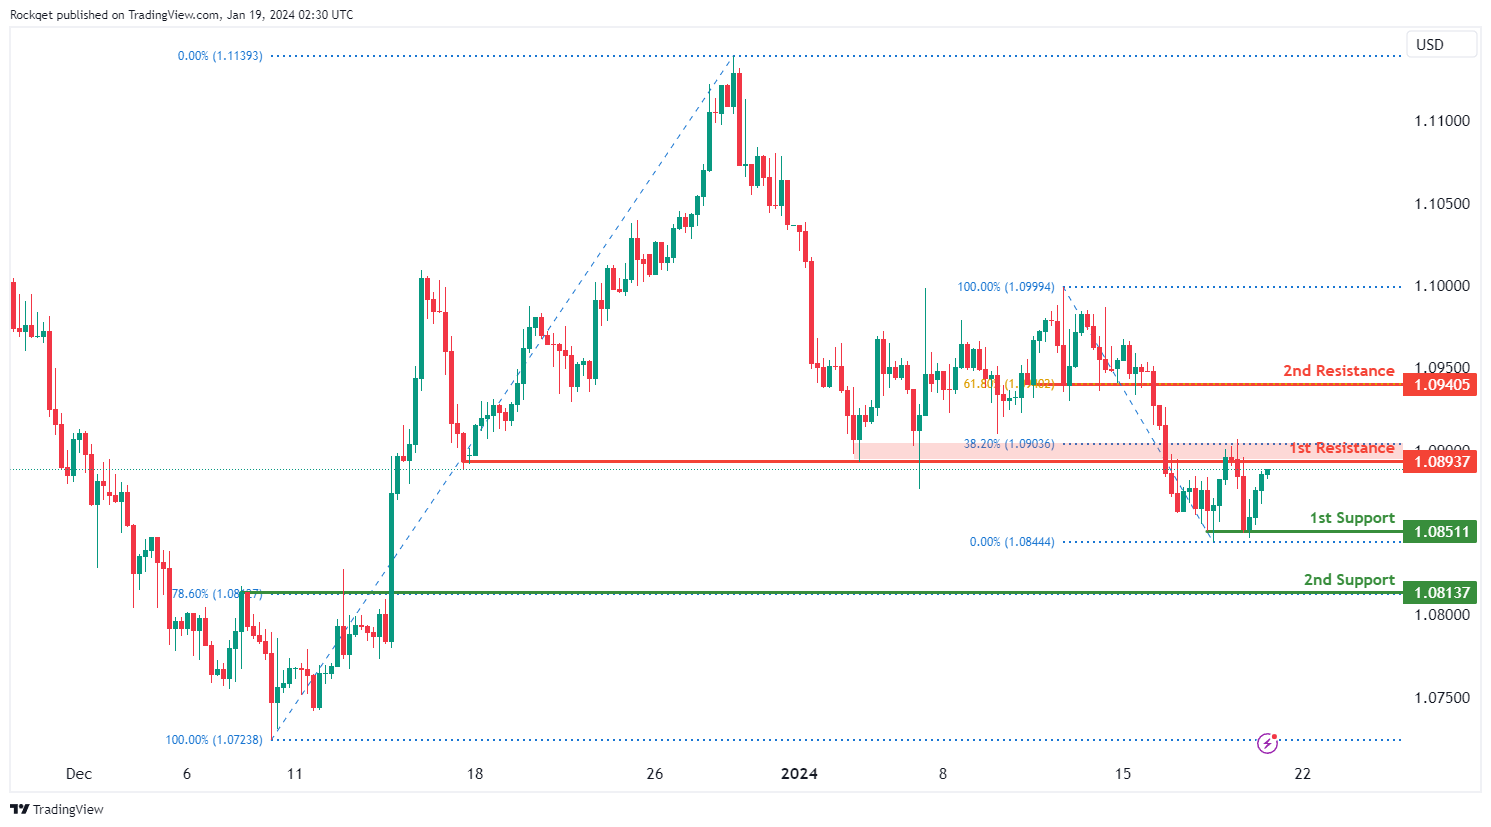
EUR/USD:
The EUR/USD chart currently exhibits an overall bearish momentum. However, there is a potential scenario for price to rise towards the 1st resistance before resuming the downtrend.
The 1st resistance level at 1.0893 is identified as a pullback resistance that aligns close to the 38.20% Fibonacci retracement level. Higher up, the 2nd resistance level at 1.0940 is also noted as a pullback resistance that aligns with the 61.80% Fibonacci retracement level, suggesting a potential barrier for further upside movement.
To the downside, the 1st support level at 1.0851 is also noted as a pullback support. Further below, the 2nd support level at 1.0813 is also marked as a pullback support that aligns with the 78.60% Fibonacci retracement level, further reinforcing its importance as a key support level.
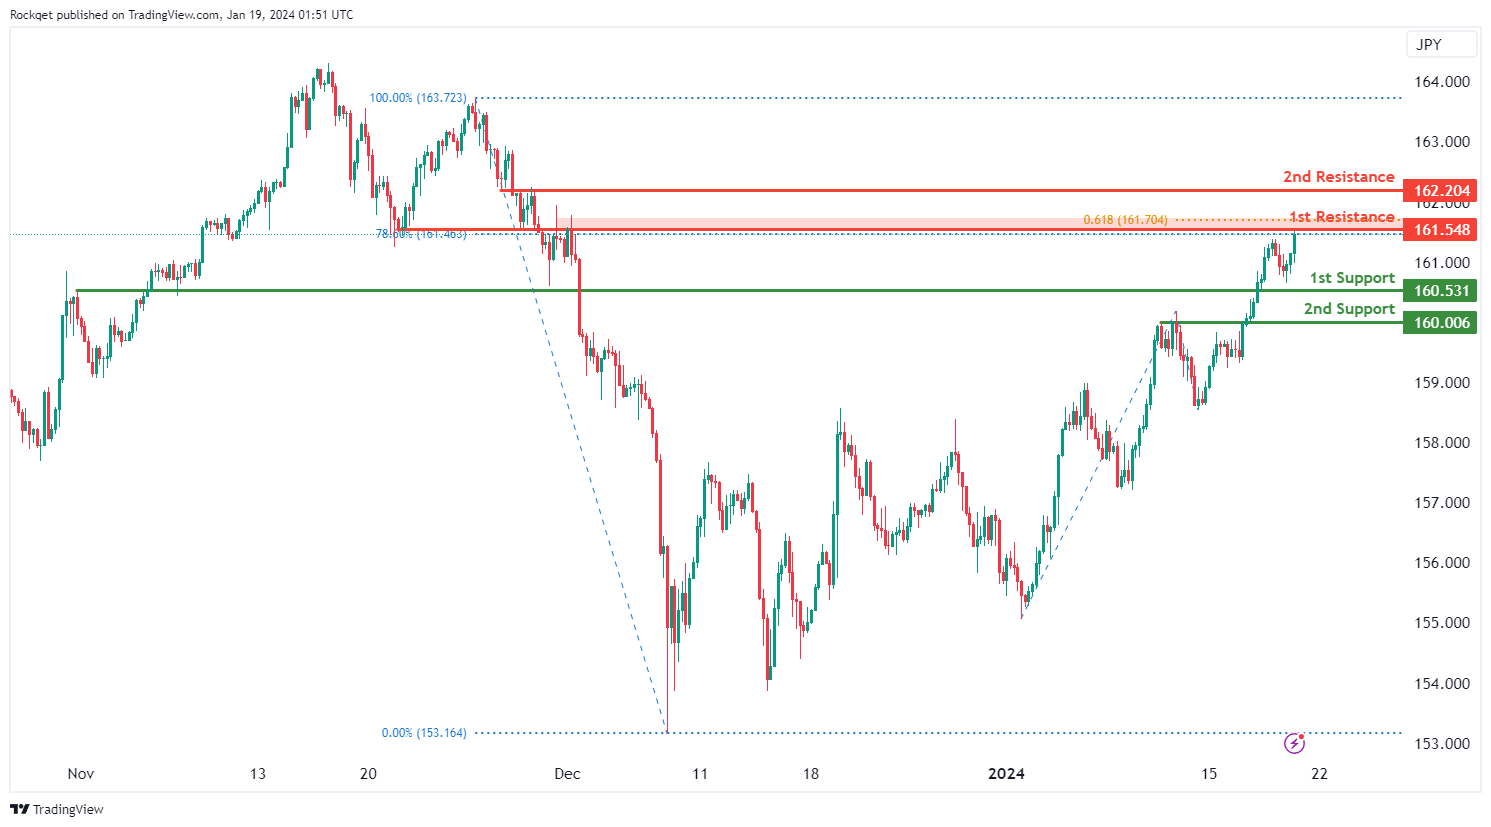
EUR/JPY:
The EUR/JPY chart currently exhibits an overall bullish momentum. In this context, there is a potential scenario for price to break above the 1st resistance and rise towards the 2nd resistance.
The 1st resistance level at 161.54 is identified as an overlap resistance that aligns with a confluence of Fibonacci levels i.e. the 78.60% retracement and the 61.80% projection. Higher up, the 2nd resistance level at 162.20 is also noted as an overlap resistance, further reinforcing its significance as a potential resistance zone.
To the downside, the 1st support level at 160.53 is identified as an overlap support. Further below, the 2nd support level at 160.00 is marked as a pullback support, further reinforcing its importance as a key support level.
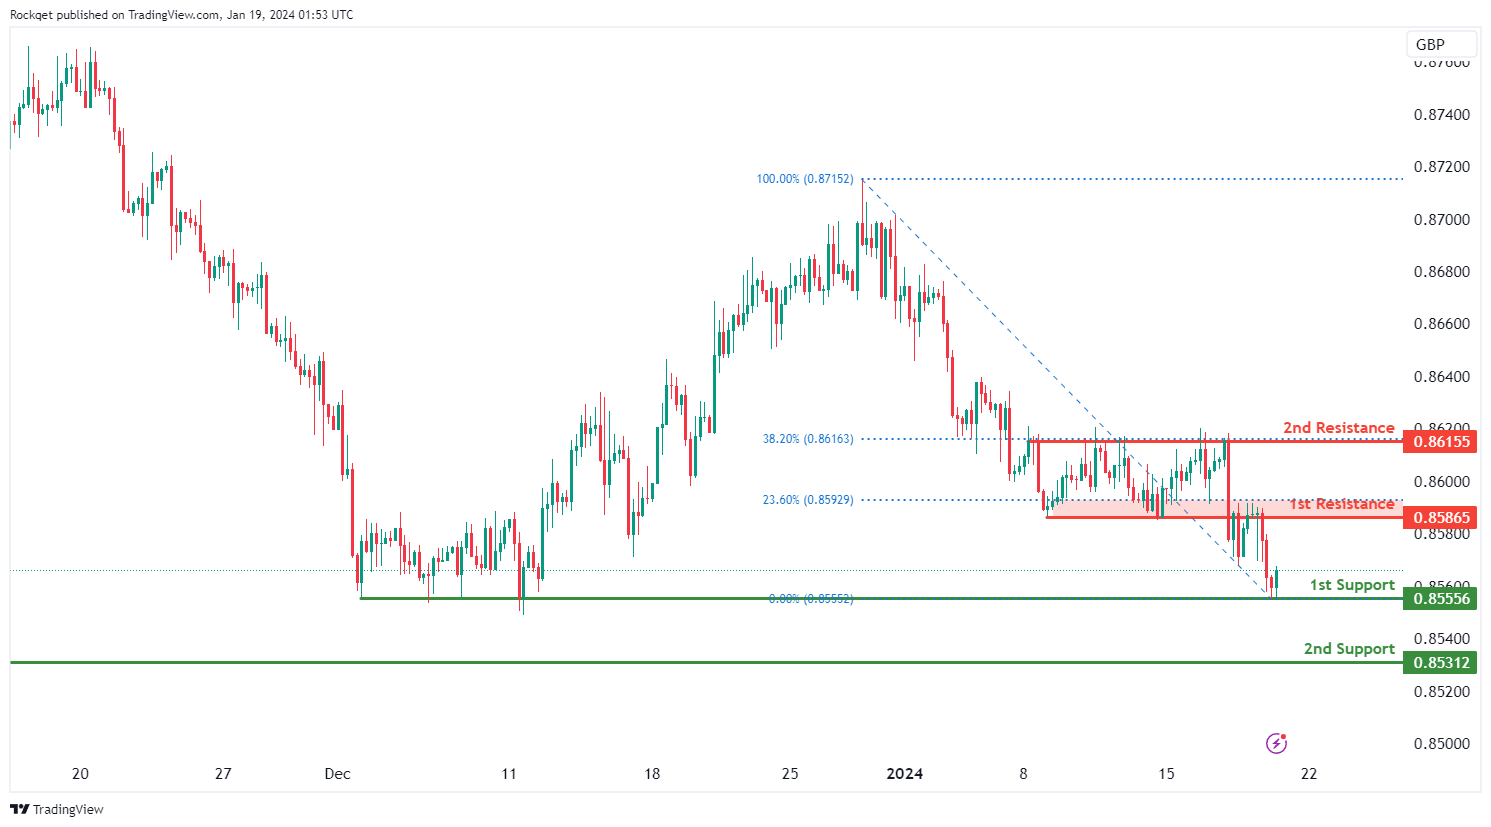
EUR/GBP:
The EUR/GBP chart currently exhibits an overall bearish momentum. However, there is a potential scenario for price to rise towards the 1st resistance before resuming the downtrend.
The 1st resistance level at 0.8586 is identified as an overlap resistance that aligns close to the 23.60% Fibonacci retracement level. Higher up, the 2nd resistance level at 0.8615 is noted as a pullback resistance that aligns with the 38.20% Fibonacci retracement level, suggesting a potential barrier for further upside movement.
To the downside, the 1st support level at 0.8555 is identified as a pullback support. Further below, the 2nd support level at 0.8531 is marked as a swing-low support, further reinforcing its importance as a key support level.
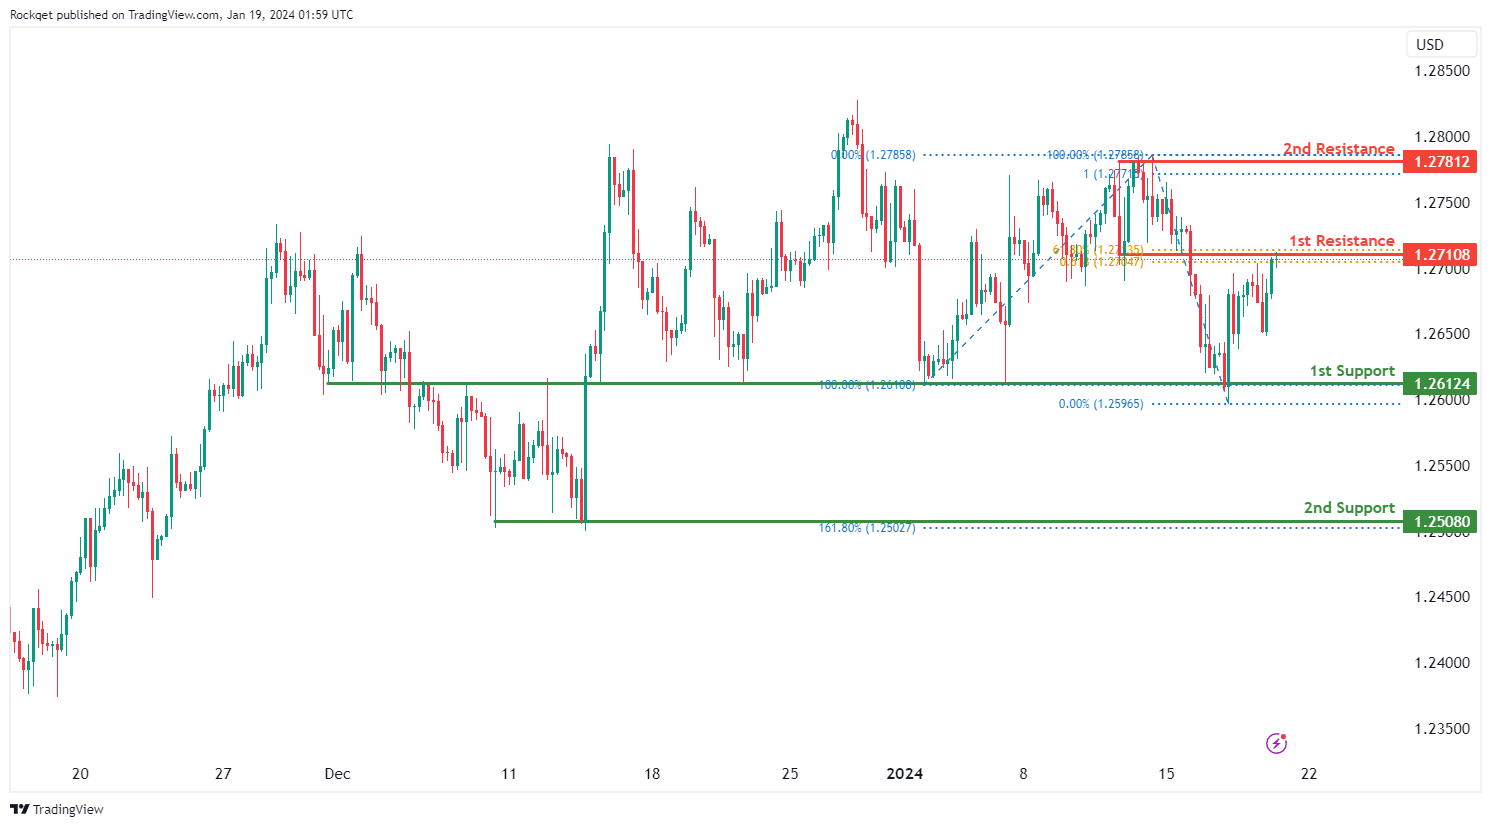
GBP/USD:
The GBP/USD chart currently exhibits a neutral bias. In this context, there is a potential scenario for price to fluctuate between the 1st resistance and 1st support.
The 1st resistance level at 1.2710 is identified as an overlap resistance that aligns with a confluence of Fibonacci levels i.e. the 61.80% retracement and the 61.80% projection. Higher up, the 2nd resistance level at 1.2781 is noted as a swing-high resistance, suggesting a potential barrier for further upside movement.
To the downside, the 1st support level at 1.2612 is identified as an overlap support. Further below, the 2nd support level at 1.2508 is marked as a swing-low support that aligns with the 161.80% Fibonacci extension level, further reinforcing its importance as a key support level.
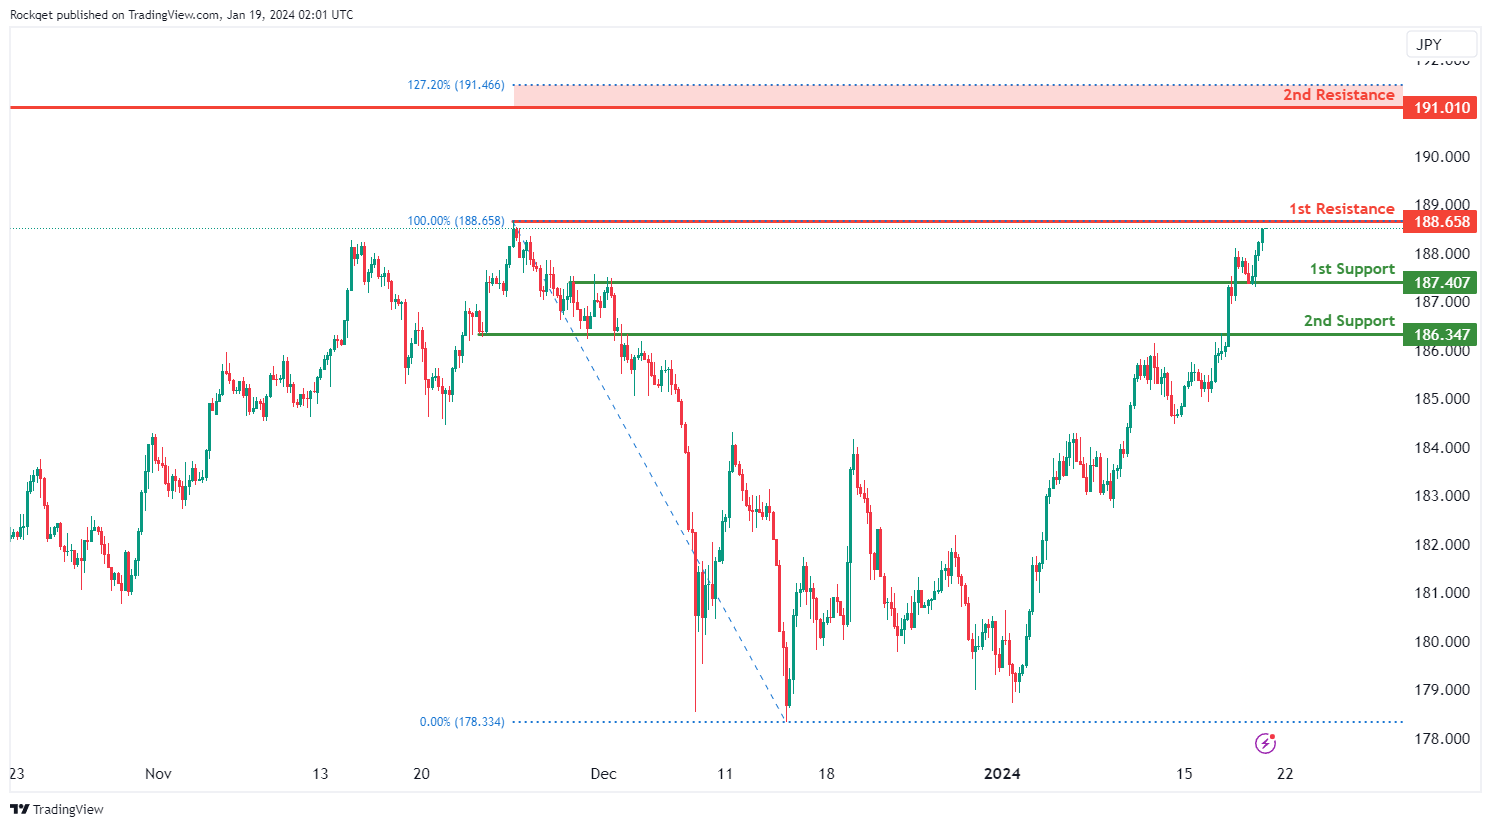
GBP/JPY:
The GBP/JPY chart currently exhibits an overall bullish momentum. In this context, there is a potential scenario for price to rise towards the 1st resistance.
The 1st resistance level at 188.65 is identified as a swing-high resistance. Higher up, the 2nd resistance level at 191.01 is noted as a pullback resistance that aligns close to the 127.20% Fibonacci extension level, further reinforcing its significance as a potential resistance zone.
To the downside, the 1st support level at 187.40 is identified as an overlap support. Further below, the 2nd support level at 186.34 is also marked as an overlap support, further reinforcing its importance as a key support level.
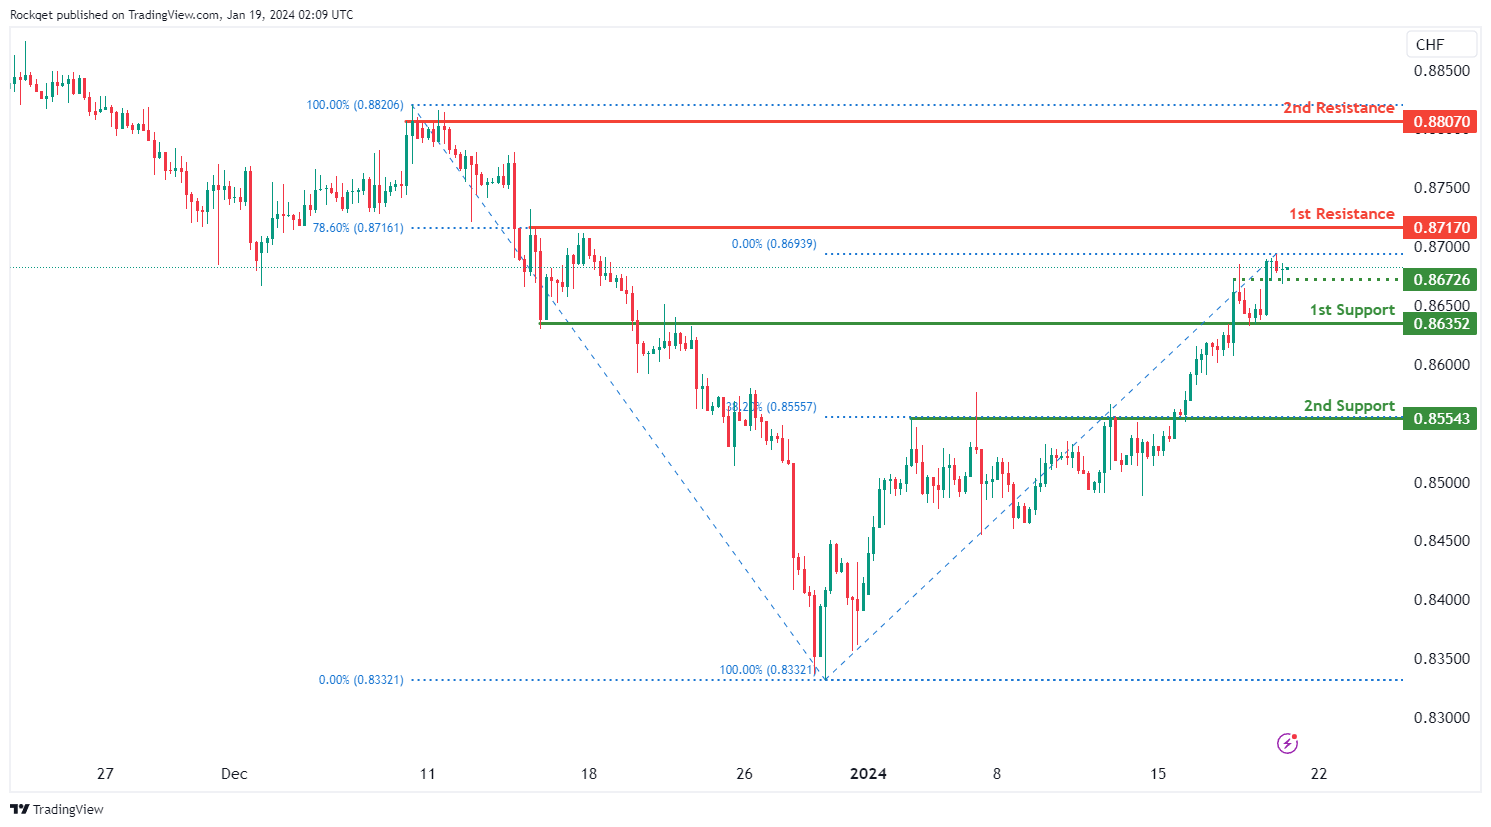
USD/CHF:
The USD/CHF chart currently exhibits an overall bullish momentum. However, there is a potential scenario for price to rise towards the 1st resistance.
The 1st resistance level at 0.8717 is identified as a pullback resistance that aligns with the 78.60% Fibonacci retracement level. Higher up, the 2nd resistance level at 0.8807 is also noted as a pullback resistance, further reinforcing its significance as a potential resistance zone.
To the downside, the intermediate support level at 0.8672 is identified as an overlap support while the 1st support level at 0.8635 is also noted as an overlap support. Further below, the 2nd support level at 0.8554 is marked as a pullback support that aligns with the 38.20% Fibonacci retracement level, further reinforcing its importance as a key support level.
USD/JPY:
The USD/JPY chart currently exhibits an overall bullish momentum. However, there is a potential scenario for price to break above the 1st resistance and rise towards the 2nd resistance.
The 1st resistance level at 148.35 is identified as a pullback resistance. Higher up, the 2nd resistance level at 149.61 is also noted as a pullback resistance that aligns close to the 78.60% Fibonacci retracement level, further reinforcing its significance as a potential resistance zone.
To the downside, the 1st support level at 147.62 is identified as an overlap support. Further below, the 2nd support level at 146.45 is also marked as an overlap support that aligns with the 23.60% Fibonacci retracement level, further reinforcing its importance as a key support level.
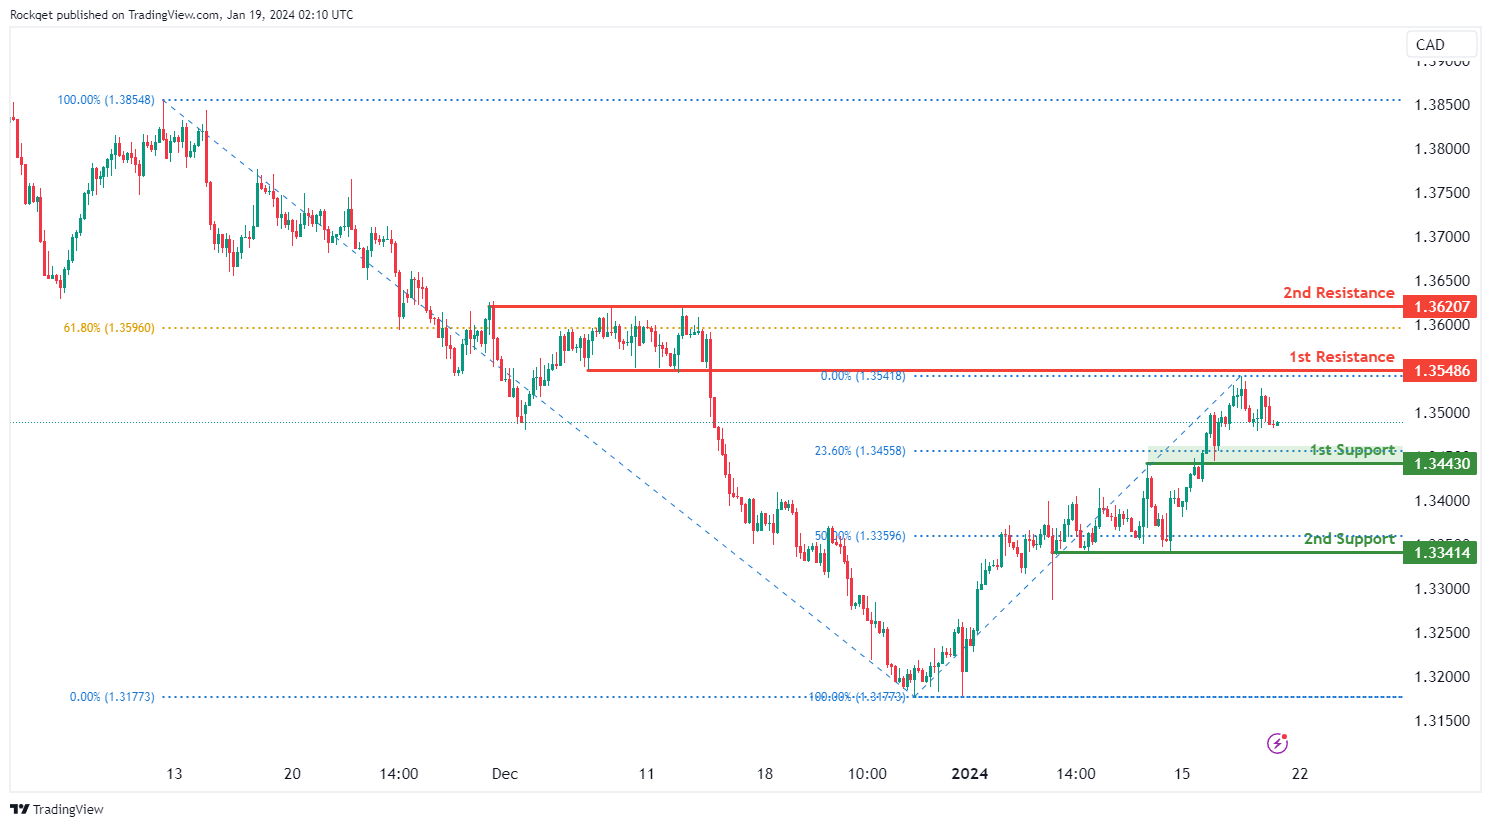
USD/CAD:
The USD/CAD chart currently exhibits an overall bullish momentum. However, there is a potential scenario for price to drop towards the 1st support before resuming the uptrend.
The 1st support level at 1.3443 is identified as an overlap support that aligns close to the 23.60% Fibonacci retracement level. Further below, the 2nd support level at 1.3341 is marked as a pullback support that aligns close to the 50.00% Fibonacci retracement level, further reinforcing its importance as a key support level.
To the upside, the 1st resistance level at 1.3548 is identified as a pullback resistance. Higher up, the 2nd resistance level at 1.3620 is also noted as a pullback resistance that aligns close to the 61.80% Fibonacci retracement level, further reinforcing its significance as a potential resistance zone.
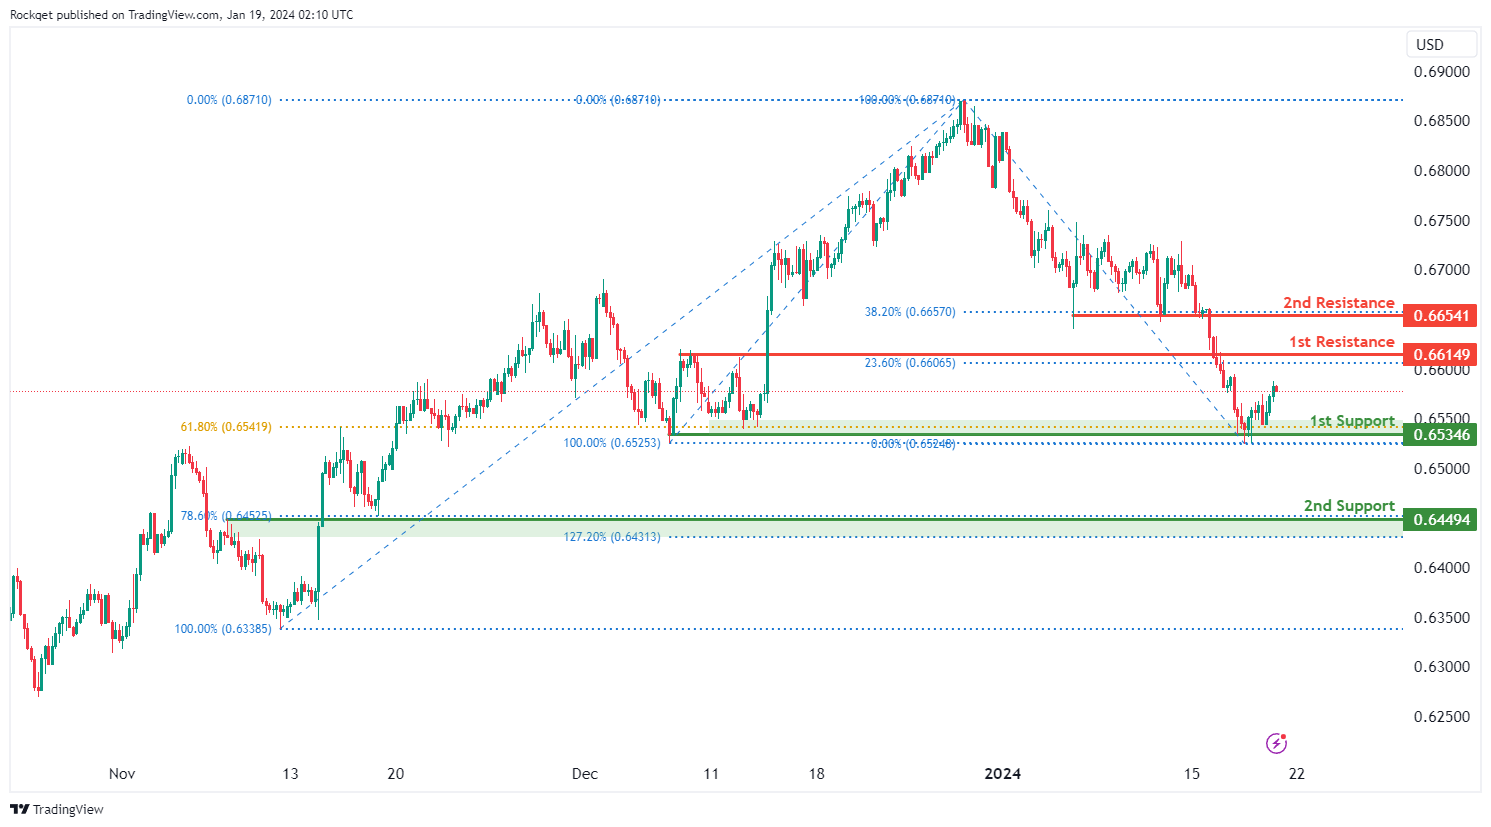
AUD/USD:
The AUD/USD chart currently exhibits an overall bearish momentum. However, there is a potential scenario for price to rise towards the 1st resistance before resuming the downtrend.
The 1st resistance level at 0.6614 is identified as a pullback resistance that aligns with the 23.60% Fibonacci retracement level. Higher up, the 2nd resistance level at 0.6654 is also noted as a pullback resistance that aligns with the 38.20% Fibonacci retracement level, suggesting a potential barrier for further upside movement.
To the downside, the 1st support level at 0.6534 is identified as a pullback support that aligns with the 61.80% Fibonacci retracement level. Further below, the 2nd support level at 0.6449 is marked as an overlap support that aligns with a confluence of Fibonacci levels i.e. the 78.60% retracement and the 127.20% extension, further reinforcing its importance as a key support level.
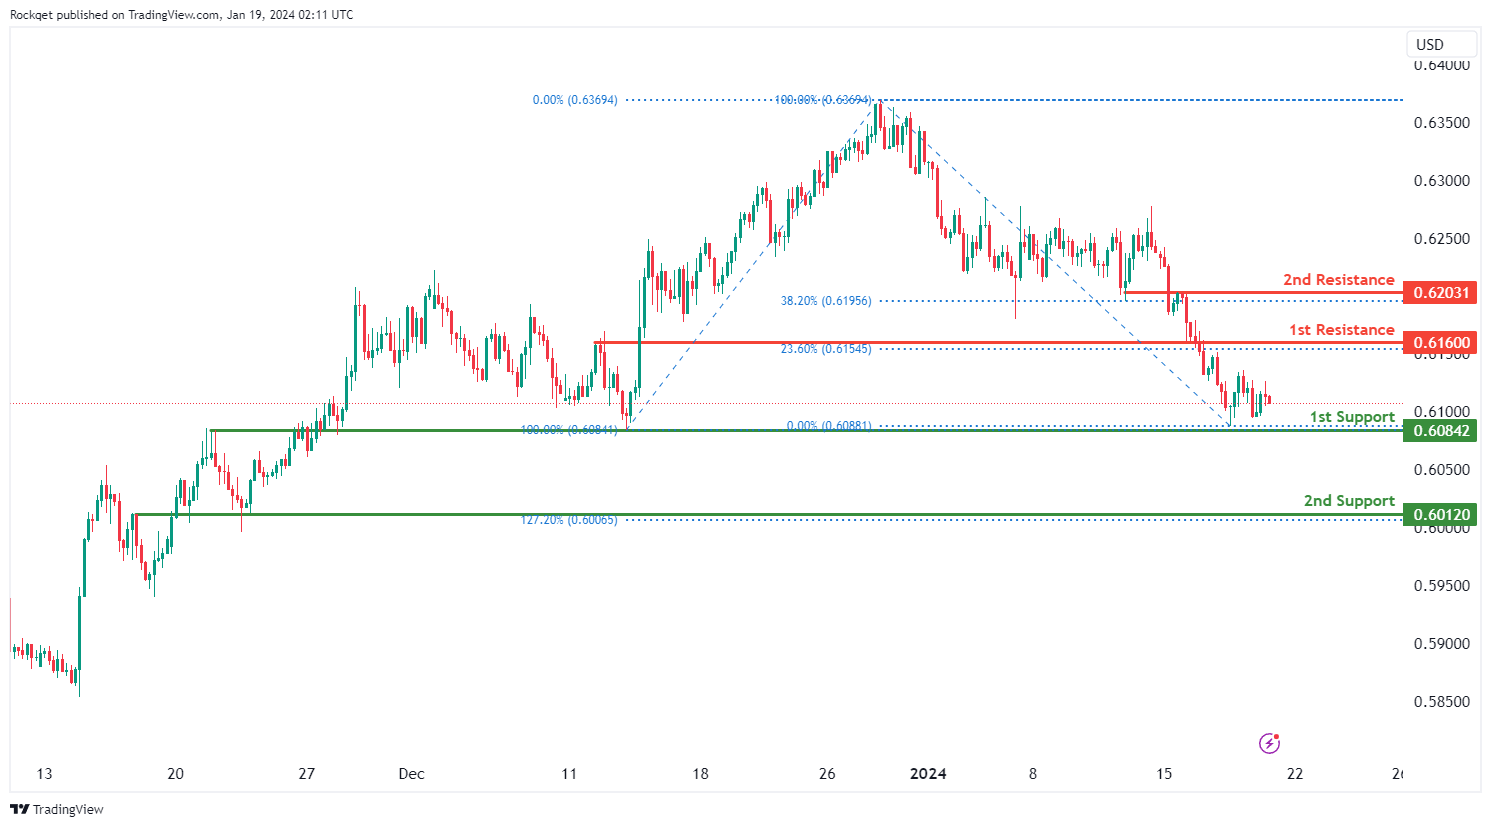
NZD/USD
The NZD/USD chart currently exhibits an overall bearish momentum. However, there is a potential scenario for price to rise towards the 1st resistance before resuming the downtrend.
The 1st resistance level at 0.6160 is identified as a pullback resistance that aligns with the 23.60% Fibonacci retracement level. Higher up, the 2nd resistance level at 0.6203 is noted as an overlap resistance that aligns with the 38.20% Fibonacci retracement level, suggesting a potential barrier for further upside movement.
To the downside, the 1st support level at 0.6084 is identified as an overlap support. Further below, the 2nd support level at 0.6012 is also marked as an overlap support that aligns with the 127.20% Fibonacci extension level, further reinforcing its importance as a key support level.
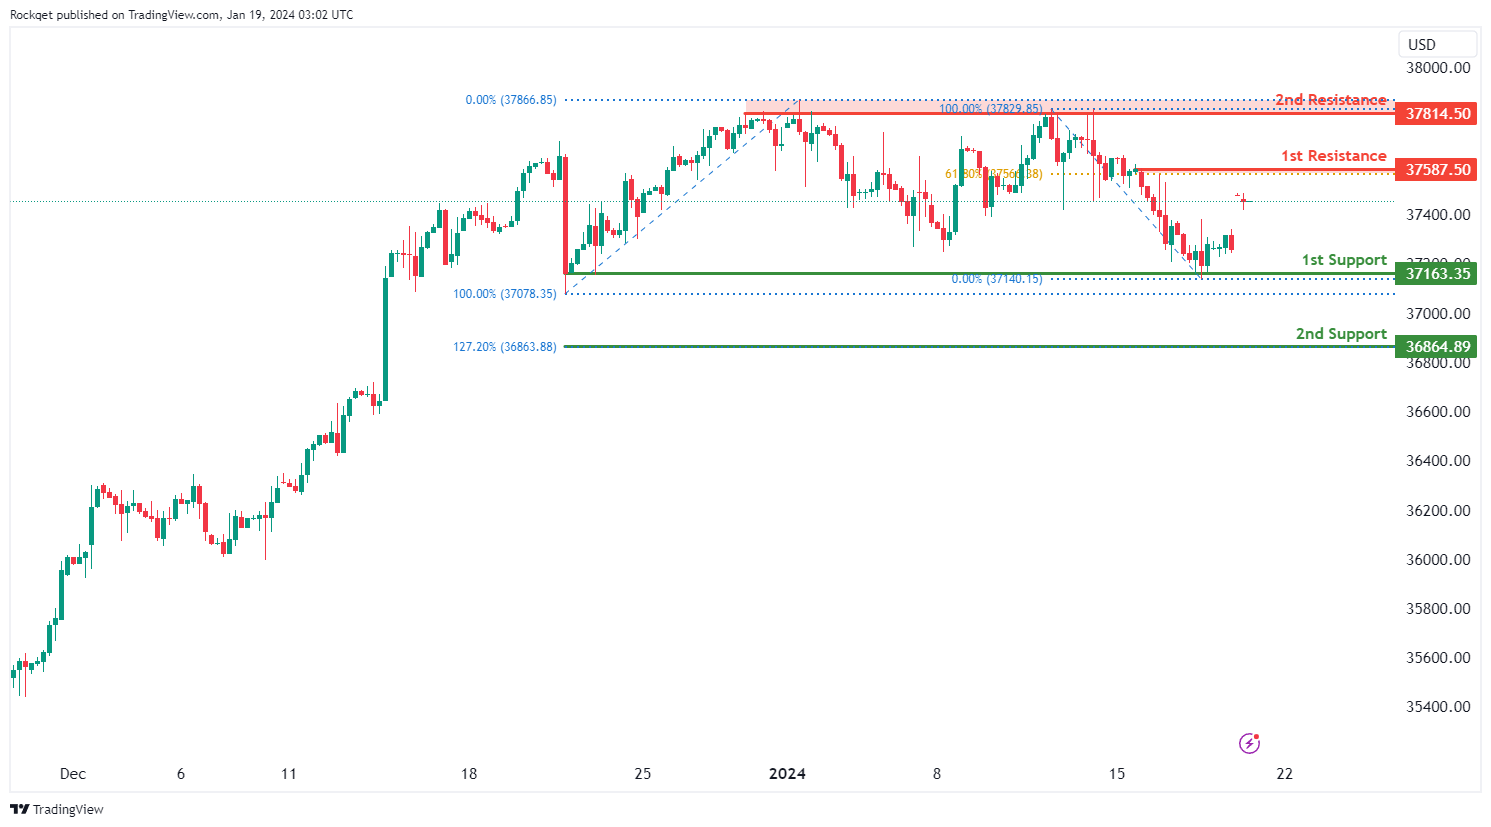
DJ30:
The DJ30 (Dow Jones) chart currently exhibits a neutral bias. In this context, there is a potential scenario for price to fluctuate between the 1st resistance and 1st support.
The 1st resistance level at 37,587.50 is identified as a pullback resistance that aligns with the 61.80% Fibonacci retracement level. Higher up, the 2nd resistance level at 37,814.50 is noted as a multi-swing-high resistance, suggesting a potential barrier for further upside movement.
To the downside, the 1st support level at 37,163.35 is identified as pullback support. Further below, the 2nd support level at 36,864.89 is marked as a support level that aligns with the 127.20% Fibonacci extension level, further reinforcing its importance as a key support level.
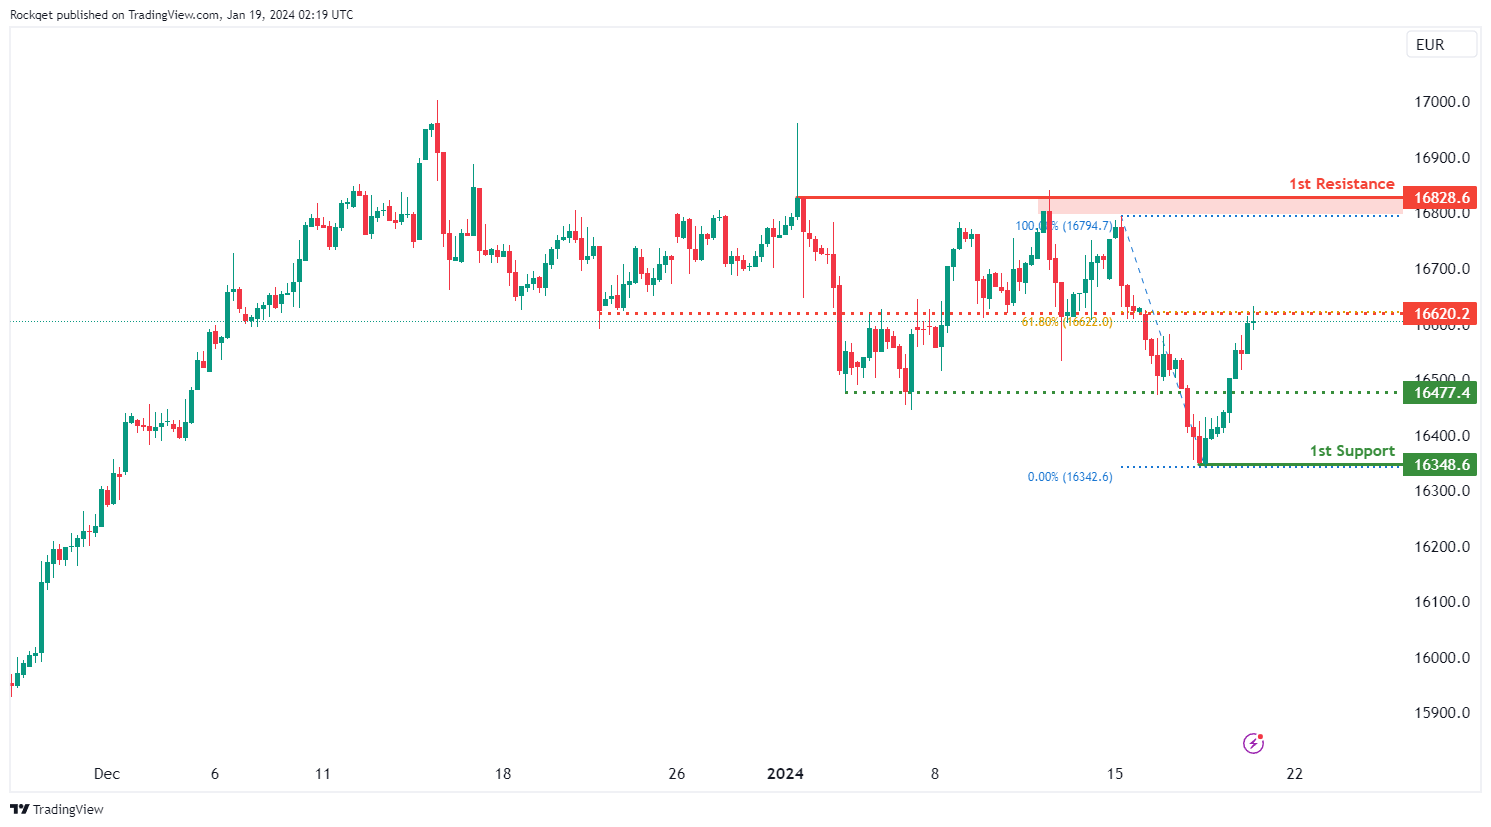
GER40:
The GER40 (DAX) chart currently exhibits an overall bullish momentum. In this context, there is a potential scenario for price to rise towards the 1st resistance should it break above the intermediate resistance.
The intermediate resistance level at 16,620.20 is identified as an overlap resistance that aligns with the 61.80% Fibonacci retracement level. Higher up, the 2nd resistance level at 16,828.60 is noted as a pullback resistance, further reinforcing its significance as a potential resistance zone.
To the downside, the intermediate support level at 16,477.40 is identified as a pullback support. Further below, the 1st support level at 16,348.60 is noted as a swing-low support, further reinforcing its importance as a key support level.
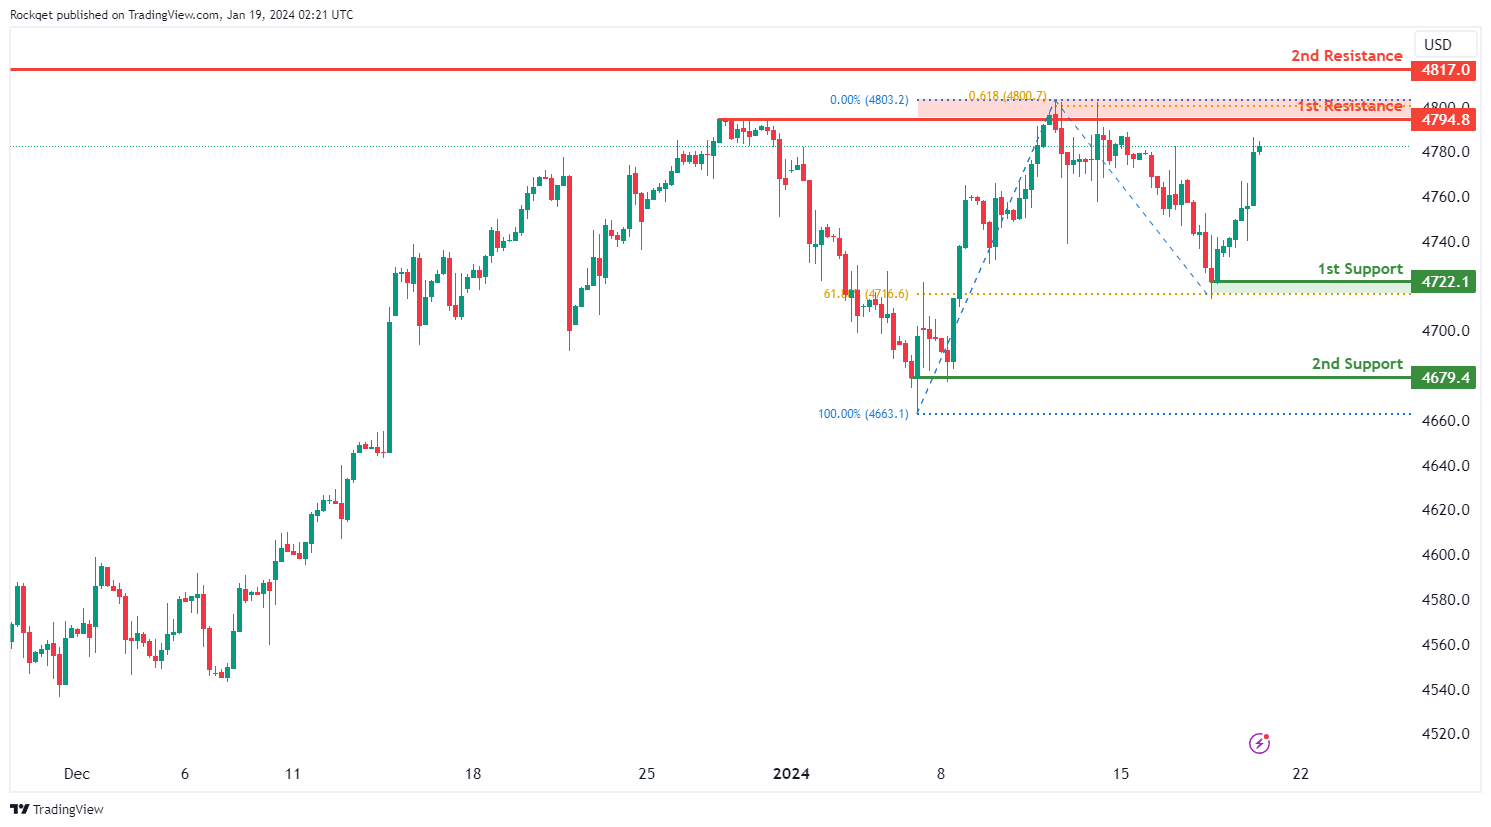
US500:
The US500 (S&P 500) chart currently exhibits an overall bullish momentum. In this context, there is a potential scenario for price to rise towards the 1st resistance.
The 1st resistance level at 4,794.80 is identified as a multi-swing-high resistance that aligns close to the 61.80% Fibonacci projection level. Higher up, the 2nd resistance level at 4,817.00 is noted as a swing-high resistance at the all-time high, further reinforcing its significance as a potential resistance zone.
To the downside, the 1st support level at 4,722.10 is identified as a swing-low support that aligns with the 61.80% Fibonacci retracement level. Further below, the 2nd support level at 4,679.40 is also noted as a swing-low support, further reinforcing its importance as a key support level.
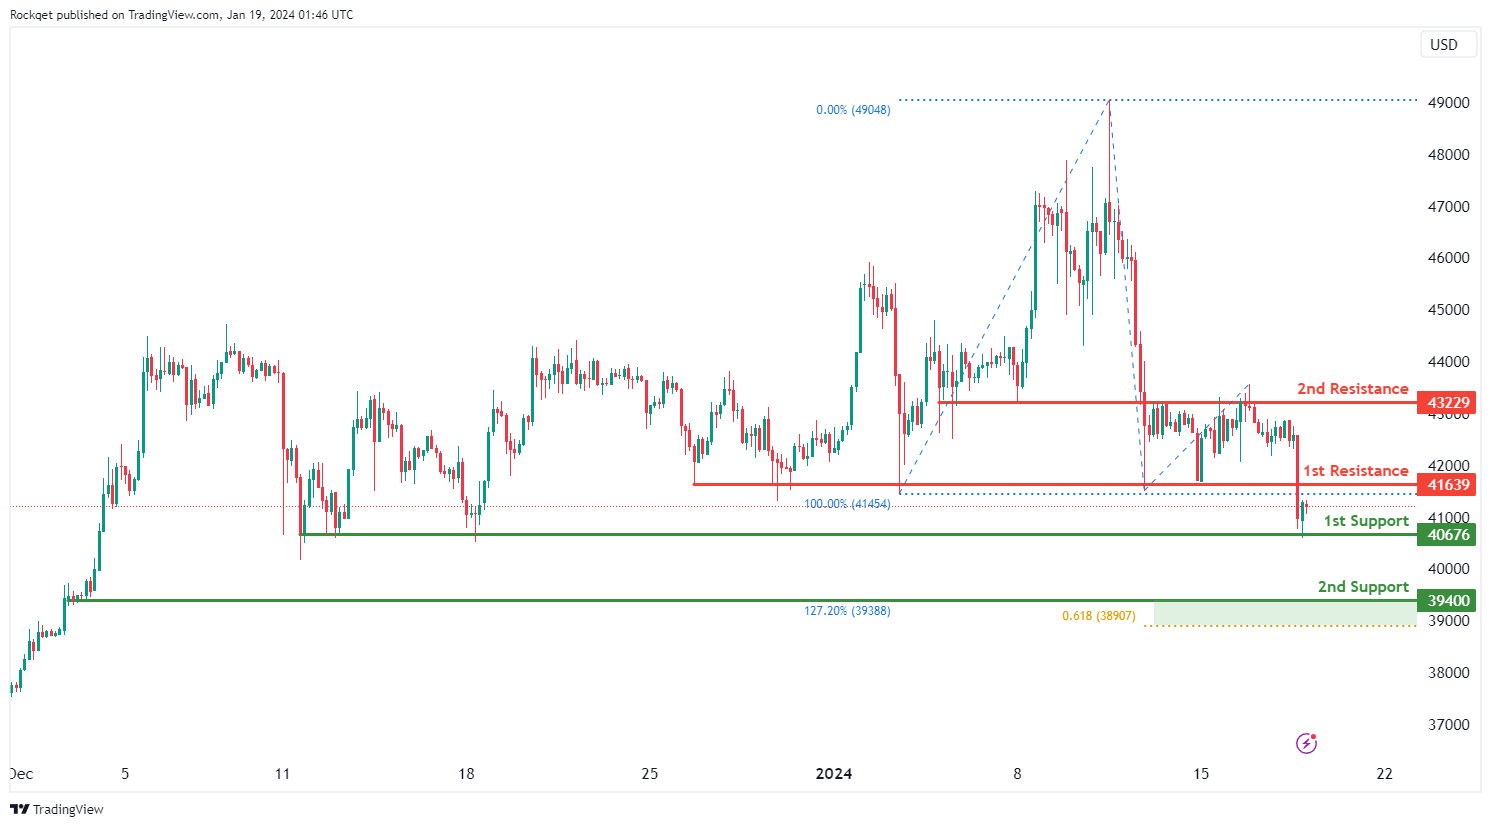
BTC/USD:
The BTC/USD (Bitcoin) chart currently exhibits a neutral bias. In this context, there is a potential scenario for price to fluctuate between the 1st resistance and 1st support.
The 1st resistance level at 41,639.00 is identified as a pullback resistance. Higher up, the 2nd resistance level at 43,229.00 is noted as an overlap resistance, suggesting a potential barrier for further upside movement.
To the downside, the 1st support level at 40,676.00 is identified as a pullback support. Further below, the 2nd support level at 39,400.00 is marked as a pullback support that aligns with a confluence of Fibonacci levels i.e. the 127.20% extension and the 61.80% projection, further reinforcing its importance as a key support level.
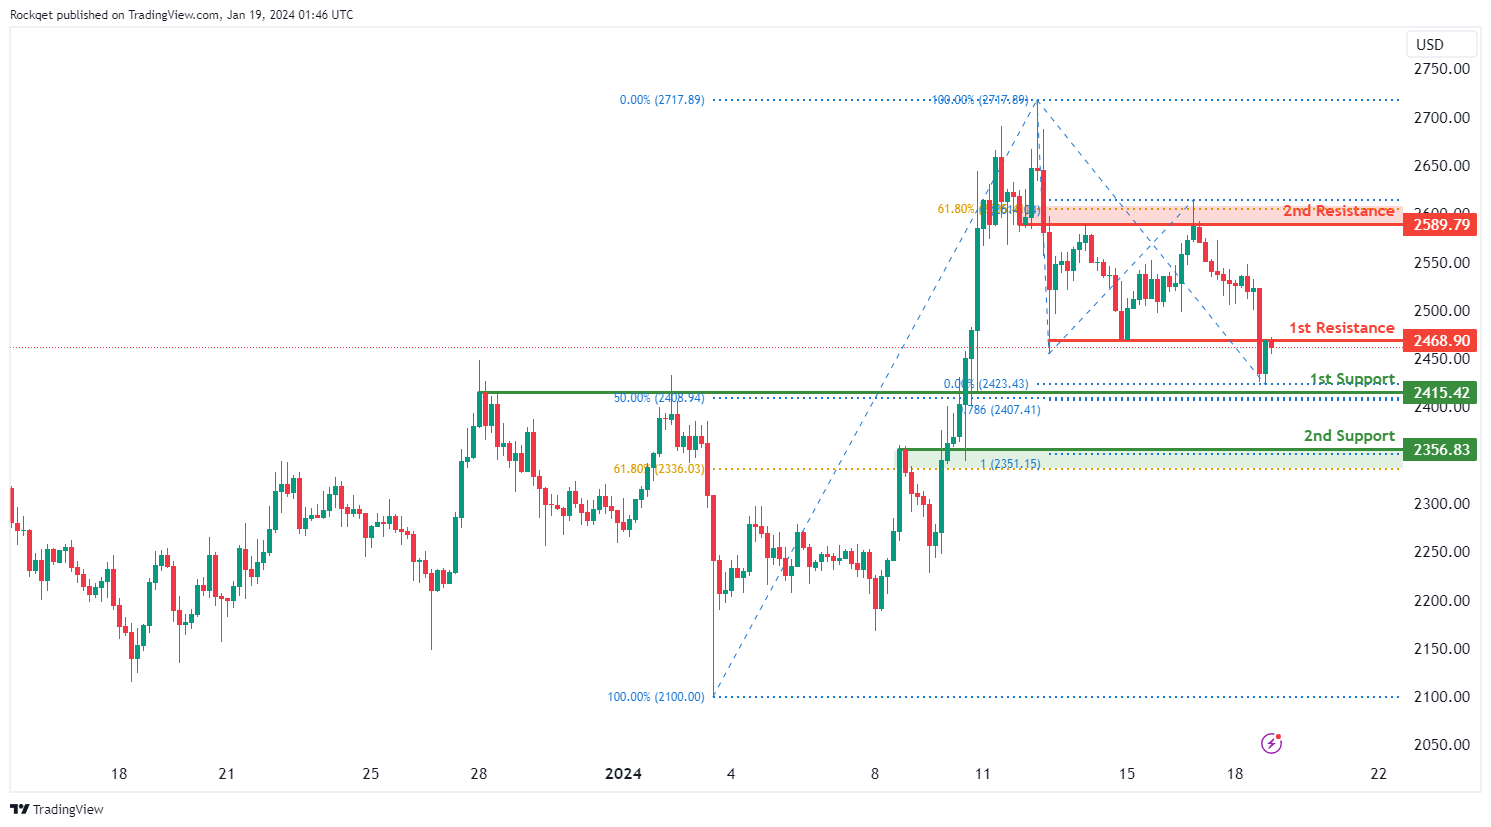
ETH/USD:
The ETH/USD (Ethereum) chart currently exhibits an overall bearish momentum. However, there is a potential scenario for price to rise towards the 1st resistance before resuming the downtrend.
The 1st resistance level at 2,468.90 is identified as an overlap resistance. Higher up, the 2nd resistance level at 2,589.79 is also noted as an overlap resistance that aligns close to the 61.80% Fibonacci retracement level, suggesting a potential barrier for further upside movement.
To the downside, the 1st support level at 2,415.42 is identified as a pullback support that aligns with a confluence of Fibonacci levels i.e. the 50.00% retracement and the 78.60% projection. Further below, the 2nd support level at 2,356.83 is also marked as a pullback support that aligns with a confluence of Fibonacci levels i.e. the 61.80% retracement and the 100.00% projection, further reinforcing its importance as a key support level.
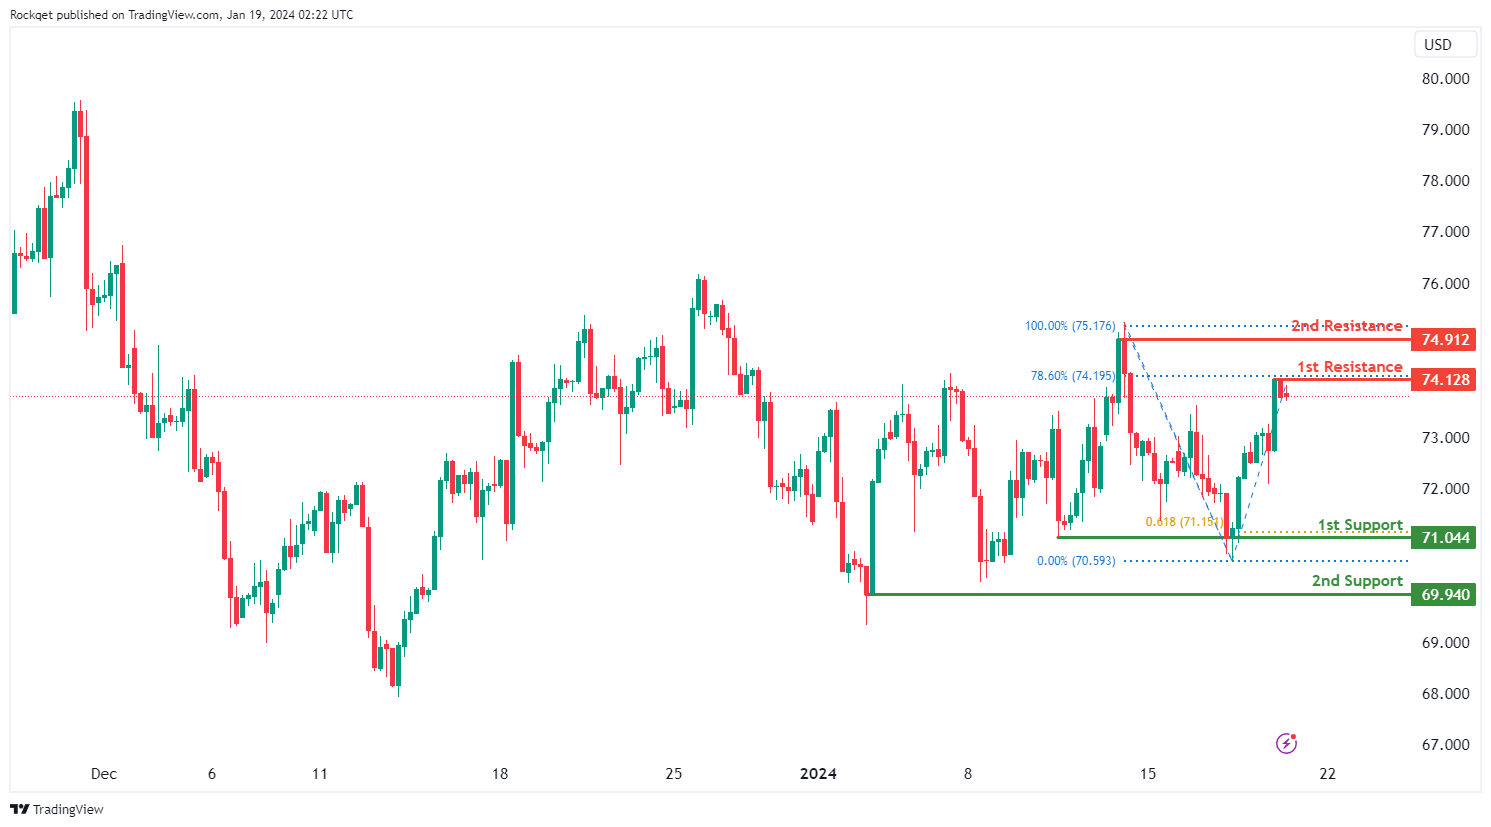
WTI/USD:
The WTI (West Texas Intermediate) chart currently exhibits a neutral bias, indicating a potential for price to fluctuate between the 1st resistance and the 1st support.
The 1st resistance level at 74.12 is identified as a pullback resistance that aligns with the 78.60% Fibonacci retracement level. Higher up, the 2nd resistance level at 74.91 is noted as a swing-high resistance, suggesting a potential barrier for further upside movement.
To the downside, the 1st support level at 71.04 is identified as a multi-swing-low support that aligns with the 61.80% Fibonacci projection level. Further below, the 2nd support level at 69.94 is marked as a swing-low support, further reinforcing its importance as a key support level.
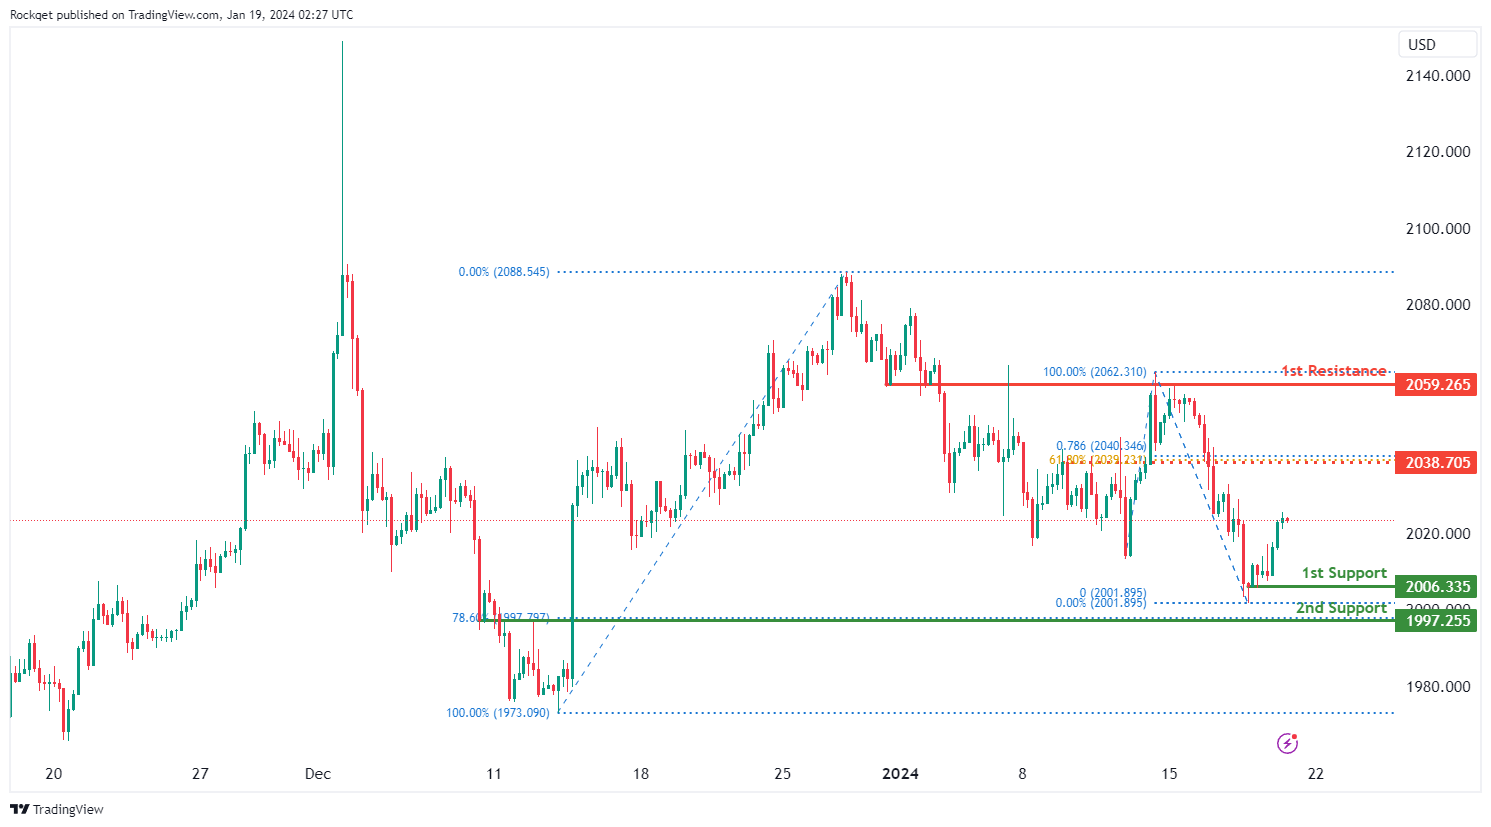
XAU/USD (GOLD):
The XAU/USD (Gold) chart currently exhibits an overall bearish momentum. However, there is a potential scenario for price to rise towards the intermediate resistance before resuming the downtrend.
The intermediate resistance level at 2,038.70 is identified as a pullback resistance that aligns with a confluence of Fibonacci levels i.e. the 61.80% retracement and the 78.60% projection. Higher up, the 1st resistance level at 2,059.26 is marked as an overlap resistance, indicating a significant potential resistance point.
On the support side, the 1st support level at 2,006.33 is identified as a pullback support. Further below, the 2nd support level at 1,997.25 is categorized as an overlap support that aligns with the 78.60% Fibonacci retracement level, further reinforcing its significance as a potential support zone.
NZ BNZ manufacturing falls to 43.1, 10th month of contraction
New Zealand's BusinessNZ Performance of Manufacturing Index fell from 46.5 to 43.1 in December. This latest figure marks a continued contraction in the manufacturing sector, which has now been shrinking for ten consecutive months.
The index components reveal a widespread decline across various manufacturing activities. Production fell from 43.5 to 40.5. Employment decreased from 47.9 to 46.7. New orders dropped from 47.4 to 44.0. Similarly, finished stocks and deliveries both saw declines, from 50.4 to 45.9 and 47.8 to 43.4, respectively.
Manufacturers' feedback further underscored the industry's challenges, with 61% of the comments in December being negative. This is a slight increase from 58.7% in November, though an improvement from 65.1% in October. The predominant concerns revolved around a lack of demand and sales, which have been significant hurdles for many manufacturers.
Stephen Toplis, BNZ's Head of Research, echoed these sentiments in his assessment of the PMI data. "The December PMI reaffirms our view that economic conditions remain very difficult," he stated. Toplis anticipates that while the economy and the manufacturing sector might gain some momentum by the end of 2024, the immediate future appears challenging, particularly with pressures in retail spending and construction activity.
Japan’s CPI core dips to 2.3%, remains above BoJ’s target for 21st month
Japan's CPI core, excluding fresh food, decelerated slightly in December, moving from 2.5% yoy to 2.3% yoy, aligning with market expectations. This slowdown brings core inflation rate to its lowest since June 2022, yet it notably remains above BoJ's 2% target for the 21st consecutive month.
Overall headline CPI also showed a slowdown, decreasing from 2.8% yoy to 2.6% yoy. Additionally, CPI core-core, which excludes both food and energy, saw a modest decline, moving from 3.8% yoy to 3.7% yoy.
A notable aspect of CPI data is the stability of services prices, which rose by 2.3% yoy, maintaining the pace from the previous month. This rate marks the fastest increase in services prices in three decades when periods affected by sales tax hikes are excluded.
A significant factor contributing to the slowdown in inflation was the substantial drop in energy prices, which decreased by -11.6% yoy. This decline was driven by reductions in electricity and city gas prices, which fell by -20.5% yoy and -20.6% yoy, respectively, largely due to government subsidies.
Fed’s Bostic foresees rate cuts in Q3, sets high bar for earlier action
Atlanta Fed Raphael Bostic said overnight that he now projects Fed to begin cutting interest rates in the third quarter of this year, a shift in timing from his previous expectation of the fourth quarter.
This adjustment is a response to the recent economic data, as he explained, "Because I'm data dependent, I have incorporated the unexpected progress on inflation and economic activity into my outlook, and thus moved up my projected time to begin normalizing the federal funds rate to the third quarter of this year from the fourth quarter."
While Bostic does not entirely dismiss the possibility of an earlier rate cut, potentially as soon as July, he emphasizes that the criteria for such a decision would be stringent. "The bar will be high," he stated, indicating that any move to cut rates before the third quarter would require substantial and convincing evidence.
He elaborated on this point, saying, "If we continue to see a further accumulation of downside surprises in the data, it's possible for me to get comfortable enough to advocate normalization sooner than the third quarter." However, he stresses that the evidence supporting such a decision would need to be compelling.
USD/JPY Extends Rally But Can Bulls Push It To 150?
Key Highlights
- USD/JPY started a strong increase above the 145.00 resistance.
- A key bullish trend line is forming with support at 146.90 on the 4-hour chart.
- EUR/USD declined further and traded below the 1.0880 support.
- Gold prices trimmed gains and revisited the $2,000 support zone.
USD/JPY Technical Analysis
The US Dollar started a fresh increase from the 142.50 zone against the Japanese Yen. USD/JPY broke many hurdles near 145.00 to enter a positive zone.
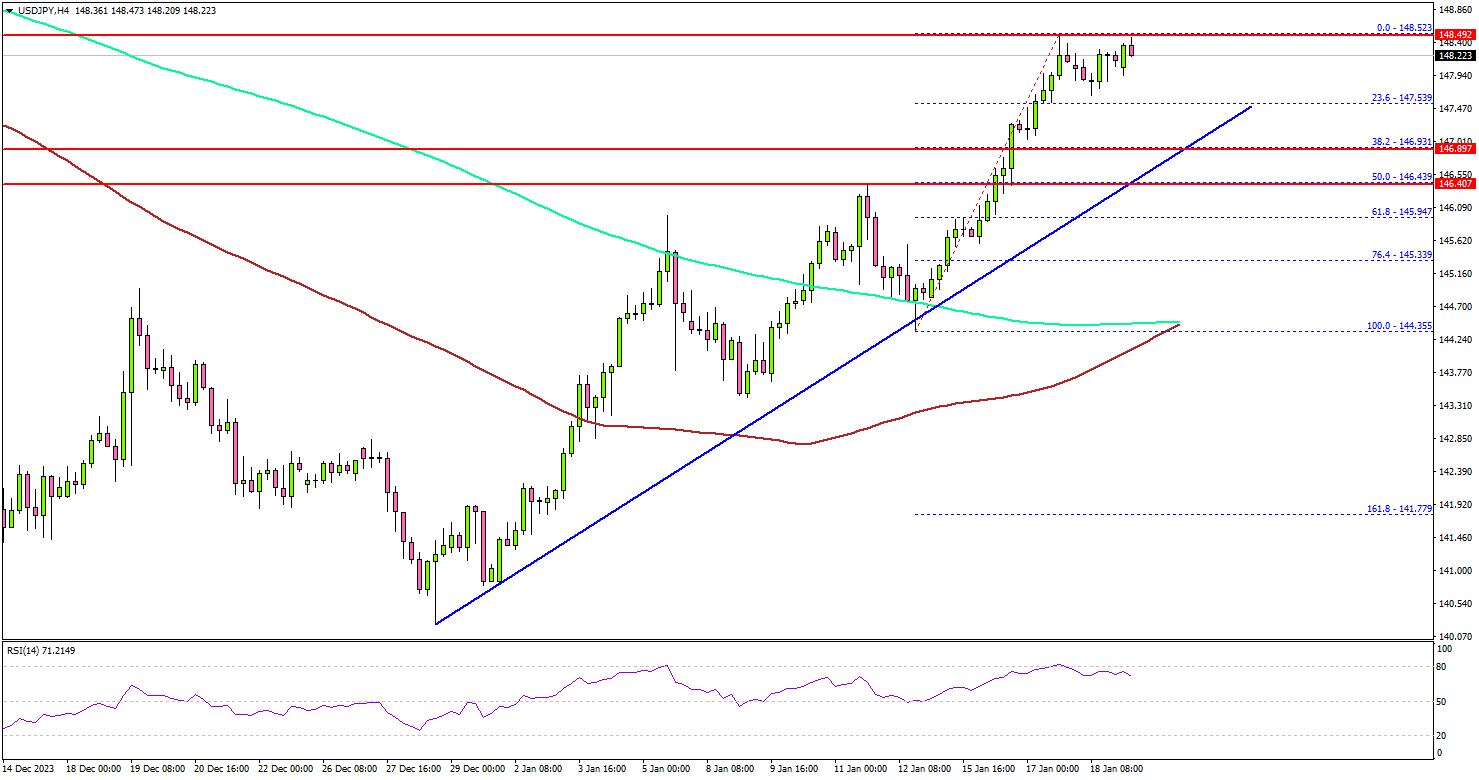
Looking at the 4-hour chart, the pair settled above the 146.50 level, the 100 simple moving average (red, 4 hours), and the 200 simple moving average (green, 4 hours). The bulls even pushed it above the 148.00 level.
It is now consolidating gains, with immediate resistance near the 148.50 level. The next key resistance is near the 149.20 zone. A close above the 149.20 zone could open the doors for more upsides. The next stop for the bulls might be 150.00.
If there is a downside correction, the pair might find support near the 147.00 level. There is also a key bullish trend line forming with support at 146.90 on the same chart.
The next major support sits near the 50% Fib retracement level of the upward move from the 144.35 swing low to the 148.52 high at 146.45. A downside break below the 146.45 zone could spark a sustained decline.
The next major support is 145.40 or the 76.4% Fib retracement level of the upward move from the 144.35 swing low to the 148.52 high, below which the pair might decline and test the 100 simple moving average (red, 4 hours) at 144.40.
Looking at EUR/USD, the pair struggled to start a steady increase and extended its decline below the 1.0880 support zone.
Economic Releases
- UK Retail Sales for Dec 2023 (YoY) - Forecast +1.1%, versus +0.1% previous.
- UK Retail Sales for Dec 2023 (MoM) - Forecast -0.5%, versus +1.3% previous.
- Michigan Consumer Sentiment Index for Jan 2024 (Prelim) – Forecast 70.0, versus 69.7 previous.