Sample Category Title
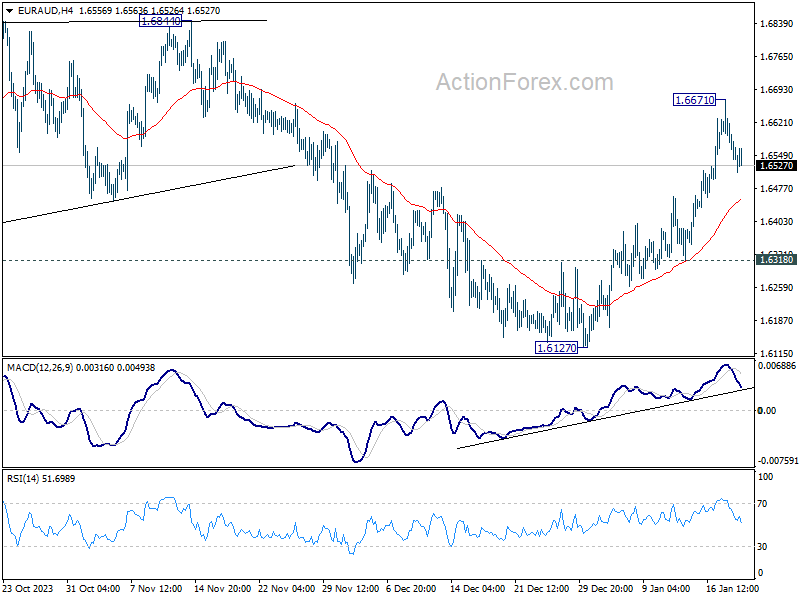
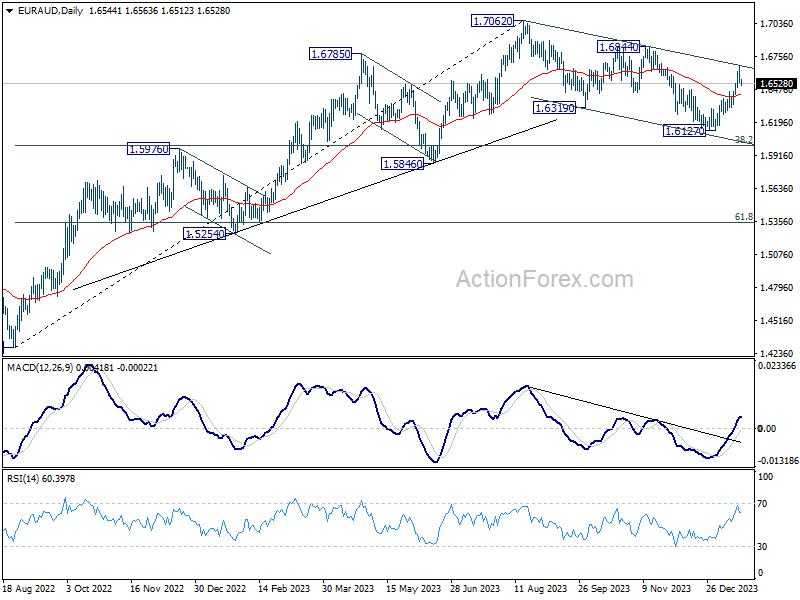
EUR/AUD Daily Outlook
Daily Pivots: (S1) 1.6499; (P) 1.6588; (R1) 1.6633; More...
Intraday bias in EUR/AUD is turned neutral first with current retreat. Some consolidations would be seen below 1.6671 temporary top. But further rally will remain in favor as long as 0.6318 support holds. Correction from 1.7062 should have completed with three waves down to 1.6127. Above 1.6671 will target 1.6844 resistance for confirmation.
In the bigger picture, fall from 1.7062 medium term top is seen as correction to the up trend from 1.4281 (2022 low). Break of 1.6844 resistance will argue that this up trend is ready to resume through 1.7062 high. In case of another fall, strong support should be seen around 1.5846 and 38.2% retracement of 1.4281 to 1.7062 at 1.6000 bring rebound.
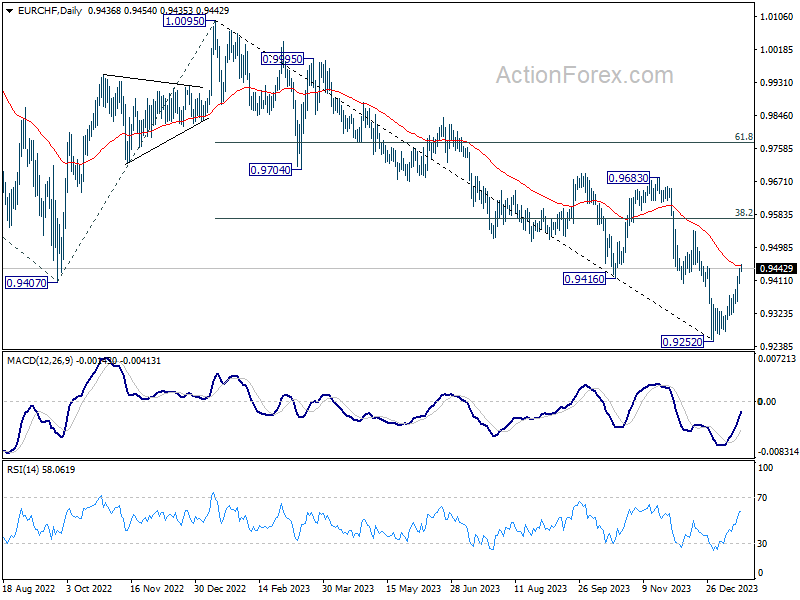
EUR/CHF Daily Outlook
Daily Pivots: (S1) 0.9416; (P) 0.9431; (R1) 0.9456; More...
EUR/CHF's rally from 0.9252 is still in progress and intraday bias stays on the upside. Sustained trading above 55 D EMA (now at 0.9449) will target 38.2% retracement of 1.0095 to 0.9252 at 0.9574. On the downside, though, break of 0.9357 minor support will turn bias back to the downside for retesting 0.9252 low instead.
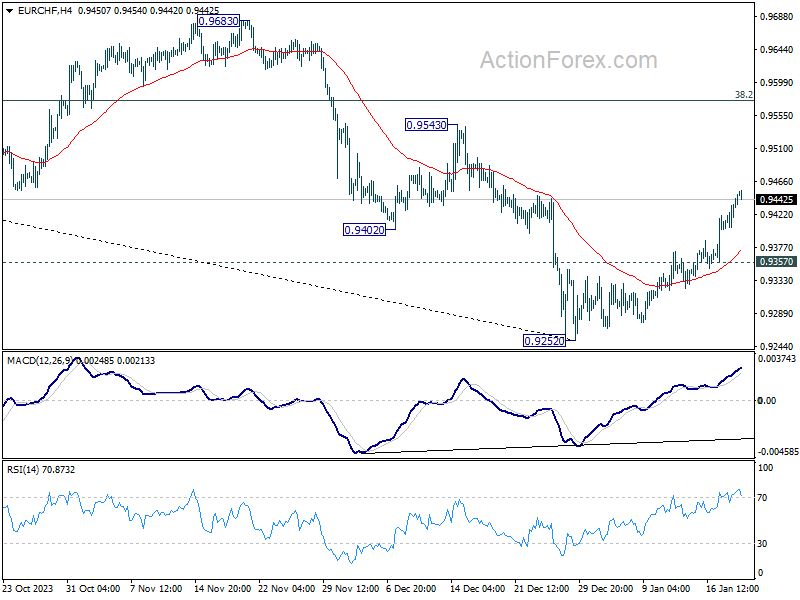
In the bigger picture, medium term outlook remains bearish as long as 0.9683 resistance holds. Current fall from 1.2004 (2018 high) is part of the multi-decade down trend. Another decline is in favor after rebound from 0.9252 completes.
GBP/USD Recovers While EUR/GBP Dives Below Support
GBP/USD is attempting a recovery wave above the 1.2690 resistance. EUR/GBP declined steadily below the 0.8585 and 0.8570 support levels.
Important Takeaways for GBP/USD and EUR/GBP Analysis Today
- The British Pound is attempting a fresh increase above 1.2650.
- There is a key contracting triangle forming with support near 1.2690 on the hourly chart of GBP/USD at FXOpen.
- EUR/GBP is trading in a bearish zone below the 0.8585 pivot level.
- There is a connecting bearish trend line forming with resistance near 0.8570 on the hourly chart at FXOpen.
GBP/USD Technical Analysis
On the hourly chart of GBP/USD at FXOpen, the pair declined after it failed to clear the 1.2800 resistance. As mentioned in the previous analysis, the British Pound even traded below the 1.2715 support against the US Dollar.
Finally, the pair tested the 1.2600 zone and is currently attempting a fresh increase. The bulls were able to push the pair above the 50-hour simple moving average and 1.2740. The pair even climbed above the 50% Fib retracement level of the downward move from the 1.2785 swing high to the 1.2596 low.
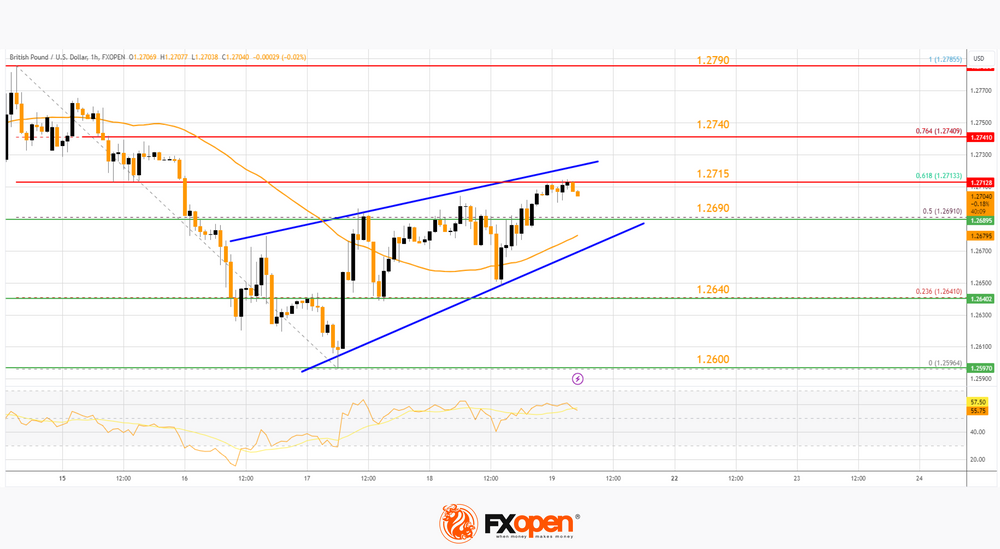
On the upside, the GBP/USD chart indicates that the pair is facing resistance near 1.2715. It coincides with the 61.8% Fib retracement level of the downward move from the 1.2785 swing high to the 1.2596 low.
The next major resistance is near 1.27640. A close above the 1.2740 resistance zone could open the doors for a move toward 1.2790. Any more gains might send GBP/USD toward 1.2840.
On the downside, there is a key support forming near a contracting triangle at 1.2690. If there is a downside break below 1.2690, the pair could accelerate lower. The first major support is near the 1.2640 level.
The next key support is seen near 1.2600, below which the pair could test 1.2550. Any more losses could lead the pair toward the 1.2500 support.
EUR/GBP Technical Analysis
On the hourly chart of EUR/GBP at FXOpen, the pair started a major decline from well above 0.8600. The Euro traded below the 0.8585 and 0.8575 support levels against the British Pound.
The EUR/GBP chart suggests that the pair even declined below the 0.8570 level and tested 0.8555. It is now consolidating losses and trading below the 50-hour simple moving average. The pair is now facing resistance near a connecting bearish trend line at 0.8570.
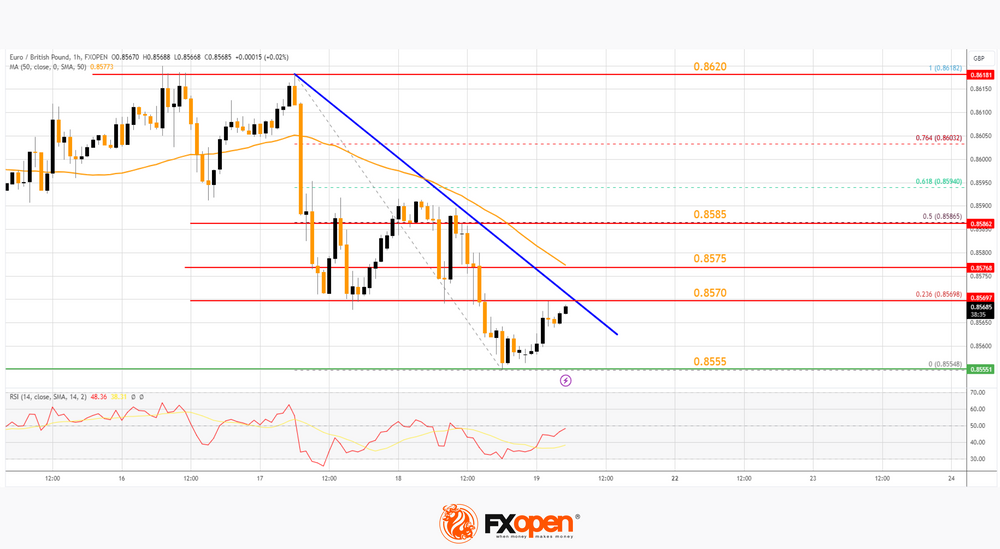
It is close to the 23.6% Fib retracement level of the downward move from the 0.8618 swing high to the 0.8554 low. The next major resistance could be 0.8575 and the 50-hour simple moving average.
The main resistance is near the 50% Fib retracement level of the downward move from the 0.8618 swing high to the 0.8554 low at 0.8585. A close above the 0.8585 level might accelerate gains. In the stated case, the bulls may perhaps aim for a test of 0.8620. Any more gains might send the pair toward the 0.8650 level.
Immediate support sits near 0.8555. The next major support is near 0.8540. A downside break below the 0.8540 support might call for more downsides. In the stated case, the pair could drop toward the 0.8500 support level.
This article represents the opinion of the Companies operating under the FXOpen brand only. It is not to be construed as an offer, solicitation, or recommendation with respect to products and services provided by the Companies operating under the FXOpen brand, nor is it to be considered financial advice.
Fin Min Suzuki Restarted Verbal Intervention
Markets
US and European yields yesterday maintained Wednesday’s gains. Data were mostly ‘second tier’ but supported the picture of a resilient US economy. Building permits and housing starts were better than expected. Weekly US jobless claims at 187k even printed at a historically very low level. The Philly Fed Business outlook also improved, admittedly less than hoped for. Atlanta president Fed’s Bostic, usually not considered as a hawk within the MPC, joined recent comments advocating patience for the Fed to embark for the upcoming easing cycle. He first wants to have a clearer view on the potential impact of political uncertainty in the US and global geopolitical tensions and more evidence that inflation is on track to reach the 2% target. Based on current information, Bostic sees a first Fed rate cut in the Q3. The US yield steepened with the 2-y -0.8 bps but the long end adding 5.4 bps (30-y). The Minutes of the December ECB meeting also showed discomfort within the ECB on markets’ aggressive rate cut bets. The ECB in particular wants more clarity that wage growth slows enough to allow inflation to ease to the 2% target. The German yield curve showed a similar pattern compared to the US with the 2-y declining 1.2 bps while the 30-y rose 4.9 bps. At 2.35%, the German 10-y yield surpassed the 38% retracement level of the October/December decline. If confirmed, this ratifies a the bottoming out pattern. The rise in (LT) yields this time had no negative impact on equites. Amongst others, positive headlines from the chip sector (TSMC) supported tech stocks. The Nasdaq added 1.35%. The Eurostoxx 50 gained 1.13%. The dollar also maintained Wednesday’s gains, but for now not much more than that (DXY 103.54, EUR/USD 1.0876). Sterling remained well bid. EUR/GBP dropped to 0.856.
Asian equities this morning mostly join the rebound on WS yesterday, China again being a notable exception to the rule. US yields this morning again add about 2 bps. The dollar trades little changed (EUR/USD 1.088). The yen continues to underperform (USD/JPY 148.7). Japanese national inflation data (CPI ex fresh food at 2.3% from 2.5%) eased as expected, further allowing the BoJ to maintain its wait-and-see approach at next week’s meeting. After recent fast decline of the yen, Fin Min Suzuki restarted verbal interventions, warning the government is closing monitoring the FX market. Later today, the calendar is thin. Michigan consumer confidence is expected to improve (slightly) (70.1 from 69.7). Interesting to see consumers’ assessment in the wake of strong holiday retail sales. Also keep a close eye at inflation expectations. We expect no big moves in yields. The bottoming out process is gaining credence. A constructive risk sentiment suggests it might be a bit too early for the dollar to start a new upleg.
This morning, UK retail sales (ex fuel) dropped 3.3% M/M, much more than expected, giving a conflicting message after stronger than expected CPI earlier this week. EUR/GBP in a first reaction jumps from 0.857 to 0.858.
News & Views
Poland and the European Commission are looking for ways to unlock funds totaling over €100bn even if judicial reforms get vetoed by Polish president Duda. The new pro-European Tusk government pledged to meet the EC’s conditions to release €76.5bn in regular EU funds and €35.4bn in post-pandemic recovery funds. But in proposing the needed reforms, they are likely to be held back by Duda, a PiS nominee in office until 2025. The president already used his veto powers in other matters. Especially for the recovery funds, time is of the essence. Poland needs to access them before they expire in 2026. The country has already requested €7bn and hopes to receive a total of €23bn this year. The topic is politically sensitive. Hungary is also required to implement reforms to address graft and rule of law concerns. An advisor to PM Orban already accused the EU of using double standards.
Germany’s construction union has demanded a monthly wage increase of €500 for its 930 000 workers ahead of talks with employers due to start February 22. That would lift wages as much as 21% in what could potentially worry the ECB that fast growing wages are not easing enough just yet. President Lagarde at the WEF earlier this week singled out wages as one of the key factors they are looking at before concluding that inflation is on a sustained trend downwards. The huge pay demand comes as real wages declined rapidly since the last collective wage bargaining agreement in 2021. With increases back then ranging from 6.2-8.5%, inflation in 2022 (7.9%) and 2023 (5.9%) hollowed everything and more out in the subsequent years.
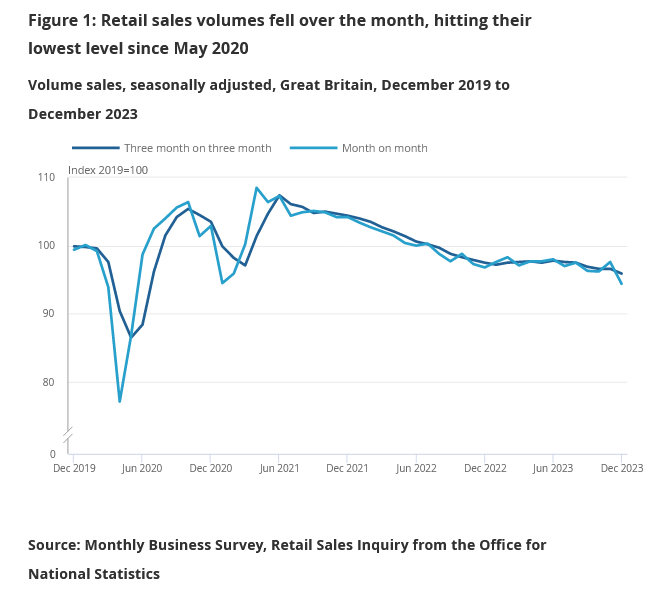
UK retail sales volume down -3.2% mom in Dec, sales value falls -3.6% mom
UK retail sales volume fell -3.2% mom in December, much worse than expectation of -0.5% mom. That's also the largest monthly fall since January 2021. Excluding fuel, sales volume fell -3.3% mom. Automotive fuel sales volumes fell by -1.9% mom. On an annual basis, sales volumes fell by 2.8% in 2023 and were their lowest level since 2018.
In value term, Retail sales value fell -3.6% mom. Ex-fuel sales value fell -3.6% mom.
Full UK retail sales release here.
Why Sell Technology Stocks When You Can Buy Them?
Forget about the Federal Reserve (Fed) dovish expectations that should be dialed back because the American economy is too strong to require a rate cut as early as March from the Fed. Forget that strong US economic data is not good news for the market. And forget about the fact that the rally in tech stocks should temper, to let the rest of the market catch up with the Magnificent 7. Because it isn’t happening. Nasdaq 100 hit a fresh ATH yesterday, even though the latest US data showed that the initial jobless claims fell more than expected to the lowest level in more than a year, the mortgage rates slipped after a two-week rise, and home data was better than expected, as well.
In the bonds space, the US 10-year TIP auction saw a strong demand and settled at a 1.8% yield, versus more than 2% in the previous two auctions, suggesting that investors continue to see a potentially high inflation, while betting that the Fed should start cutting rates in a few months. Another paradox.
One weak spot is the US manufacturing sector. The weaker-than-expected Philly Fed manufacturing index came as another proof that manufacturing in the US remains weak. But who cares; US consumers spend and that’s keeping the US economy robust. The Atlanta Fed’s GDPNow forecast predicts a 2.4% growth for the Q4 in the US.
The US 2-year yield was steady below 4.40%, while the 10-year yield advanced to 4.16%. There is a stronger case for the US 10-year yield to surpass the 2-year yield: the Fed cut bets and the strong economic data are supportive for the end of the 2-10-year yield inversion.
In equities, a set of stronger-than-expected US data could’ve led to a further selloff in US equities, but it didn’t. And higher US yields could’ve led to a further selloff in equities, but they didn’t.
TSM, the main chipmaker of Apple and Nvidia, jumped nearly 10% yesterday, after the company said that it expects a return to solid growth this quarter. Nvidia hit a fresh record. Reflation trade is not happening, long technology is the most crowded trade of the moment. The Nasdaq 100 net long positions are at the highest levels in nearly two years. The stretched long positioning makes Nasdaq stocks vulnerable to selloff, but the softening Fed expectations and robust AI-demand should keep the technology space well-funded.
In the FX
The US dollar index consolidates gains near its 200-DMA. The fundamentals and the technicals are in a comfortable place for an extension of the recent rebound. The EURUSD is rangebound between its 50 and 200-DMAs, near the limit of the major 38.2% retracement on October to January rally, which should distinguish between the continuation of the positive trend or a medium term bearish reversal. I think that the latter is more likely.
The USDJPY continues to extend gains above the 148 level, boosted by the latest inflation data from Japan that showed that inflation fell to a 17-month low of 2.6% in December from 2.8% printed a month earlier, and core inflation dropped to an 18-month low of 2.3%. The tertiary activity industry index unexpectedly dropped in November, as well. Weak economic data, combined with the earthquake at the wake of New Year encourages investors to trim their bets for Bank of Japan (BoJ) normalization and pushes the USDJPY higher, along with a broad-based USD strength. The BoJ meets next week and will certainly push back on the normalization bets. Yet at the current levels, the USDJPY is subject to verbal intervention from the BoJ to cool down the selling pressure. Therefore, buying the USDJPY at the current levels is risky.
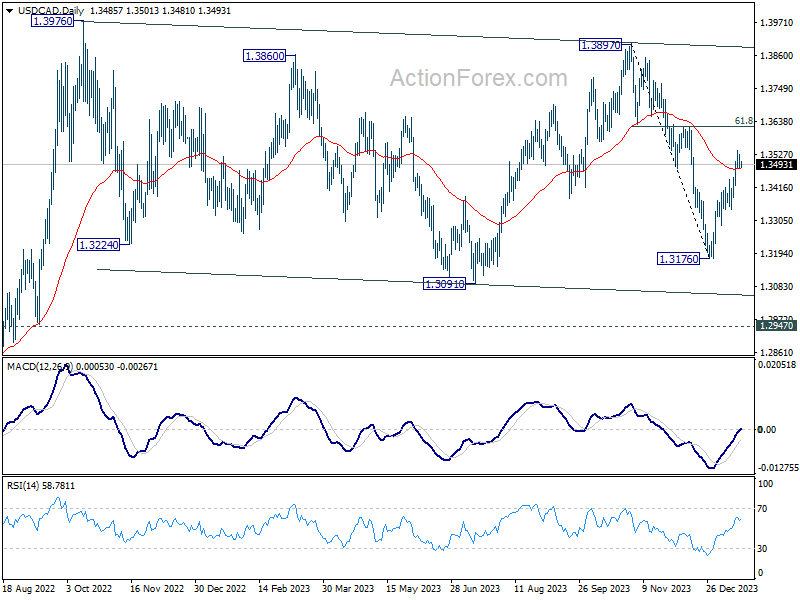
USD/CAD Daily Outlook
Daily Pivots: (S1) 1.3470; (P) 1.3498; (R1) 1.3515; More...
Intraday bias in USD/CAD remains neutral as consolidation continues below 1.3540 temporary top. Further rally is expected as long as 1.3342 support holds. Above 1.3540 will resume the rise from 1.3176 to 1.3617 cluster resistance (61.8% retracement of 1.3897 to 1.3176 at 1.3622). Decisive break there will pave the way to 1.3897/3976 key resistance zone.
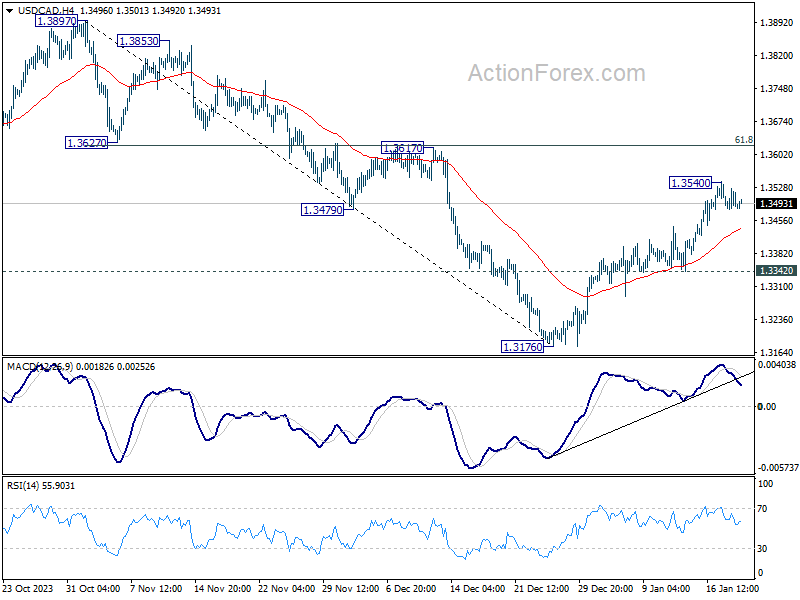
In the bigger picture, price actions from 1.3976 (2022 high) are viewed as a corrective pattern only. In case of another fall, strong support should emerge above 1.2947 resistance turned support to bring rebound. Overall, larger up trend from 1.2005 (2021 low) is still expected to resume through 1.3976 at a later stage.
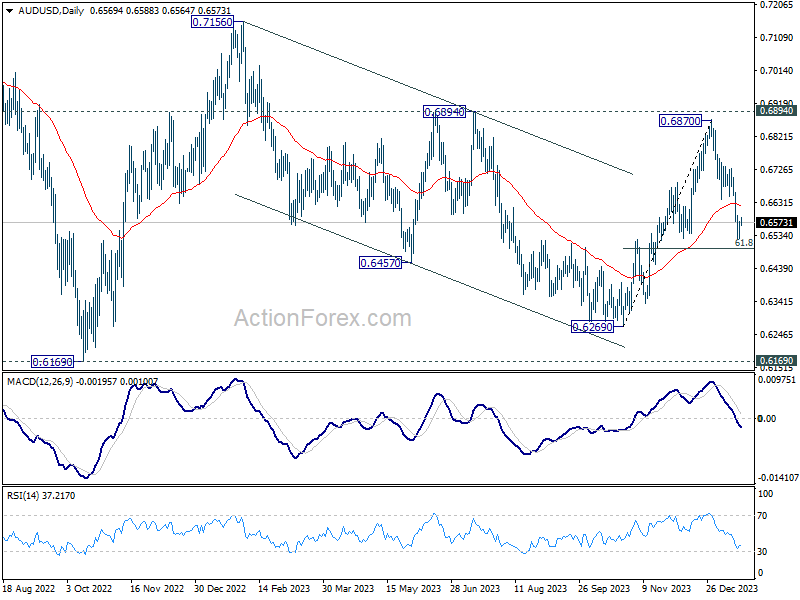
AUD/USD Daily Report
Daily Pivots: (S1) 0.6541; (P) 0.6558; (R1) 0.6591; More...
Intraday bias in AUD/USD is turned neutral with current recovery. Some consolidations would be seen first, but outlook will stay bearish as long as 0.6639 support turned resistance holds. Below 0.6524 temporary low ill resume the fall from 0.6870 to 61.8% retracement of 0.6269 to 0.6870 at 0.6497. Sustained break there will argue that whole rebound from 0.6269 has completed, and bring deeper fall to this support.
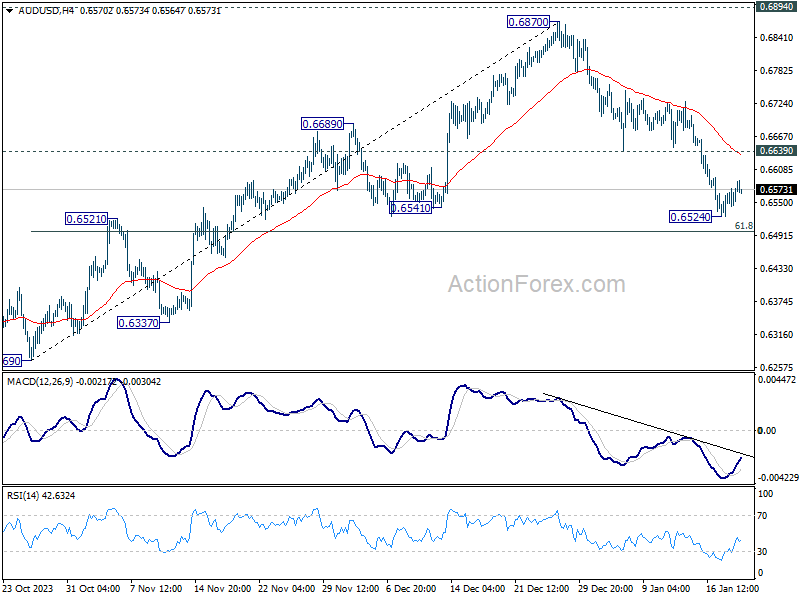
In the bigger picture, price actions from 0.6169 (2022 low) are seen as a medium term corrective pattern to the down trend from 0.8006 (2021 high). Sideway trading could continue in range of 0.6169/7156 for some more time. But as long as 0.7156 holds, an eventual downside breakout would be mildly in favor.
EUR/USD Daily Outlook
Daily Pivots: (S1) 1.0846; (P) 1.0877; (R1) 1.0906; More...
Intraday bias in EUR/USD remains neutral as consolidation continues above 1.0843 temporary ow. Outlook remains bearish with 1.0995 resistance intact. On the downside, break of 1.0843 will resume the fall from 1.1138 to 1.0722 support. Sustained break there will argue that whole rise from 1.0447 has completed, and target this low.
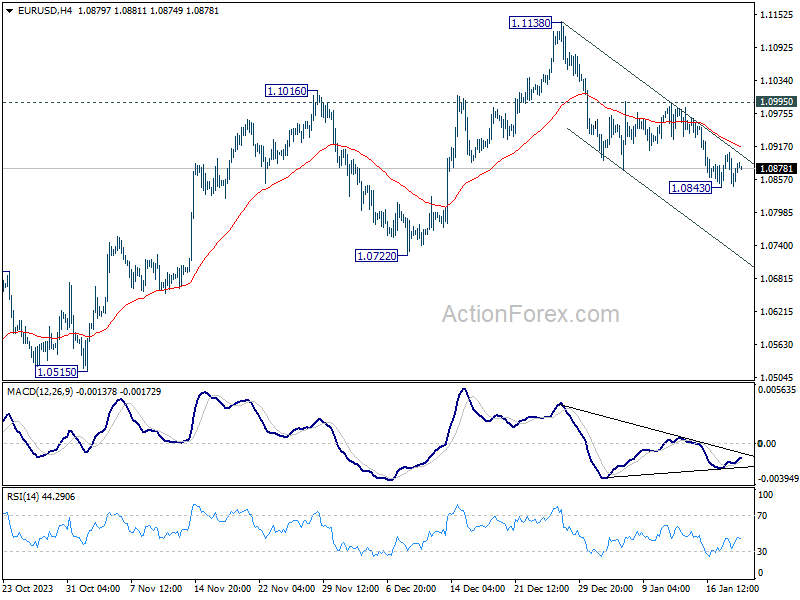
In the bigger picture, price actions from 1.1274 are viewed as a corrective pattern to rise from 0.9534 (2022 low). Rise from 1.0447 is seen as the second leg. While further rally could cannot be ruled out, upside should be limited by 1.1274 to bring the third leg of the pattern. Meanwhile, sustained break of 1.0722 support will argue that the third leg has already started for 1.0447 and below.
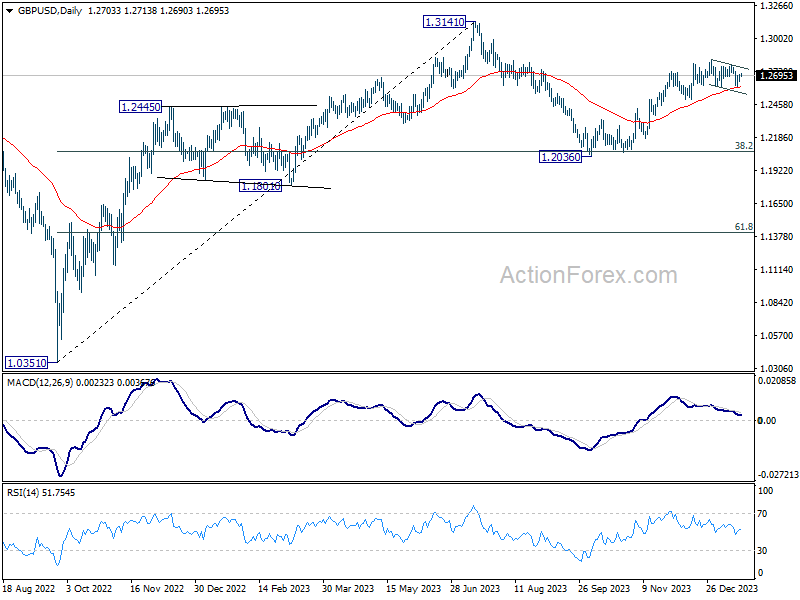
GBP/USD Daily Outlook
Daily Pivots: (S1) 1.2666; (P) 1.2688; (R1) 1.2727; More...
Intraday bias in GBP/USD stays neutral at this point. On the downside, firm break of 1.2595 support will resume the decline from 1.2826 to 1.2499 support. Nevertheless, strong rebound from current level will retain near term bullishness. Decisive break of 1.2826 will resume whole rally from 1.2036.
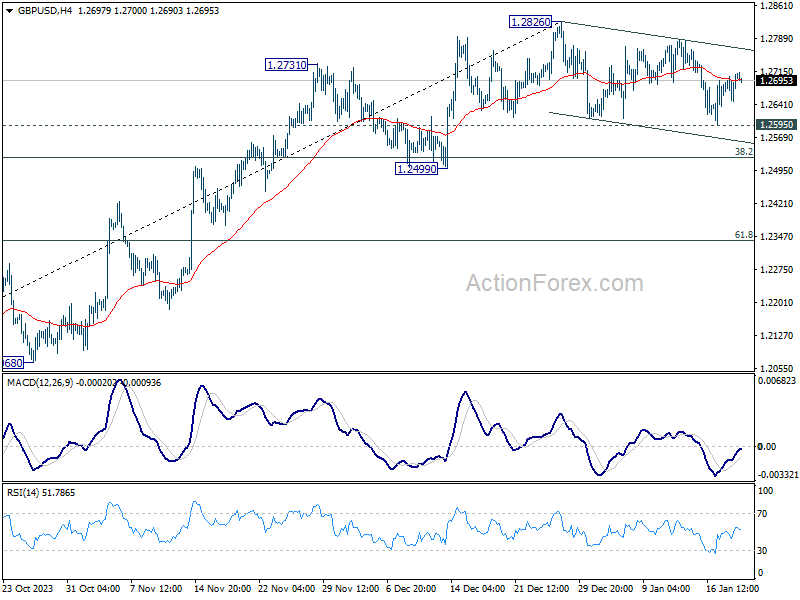
In the bigger picture, price actions from 1.3141 medium term top are seen as a corrective pattern to up trend from 1.0351 (2022 low). Rise from 1.2036 is seen as the second leg that's in progress. Upside should be limited by 1.3141 to bring the third leg of the pattern. Meanwhile, break of 1.2499 support will argue that the third leg has already started for 38.2% retracement of 1.0351 (2022 low) to 1.3141 at 1.2075 again.