Sample Category Title
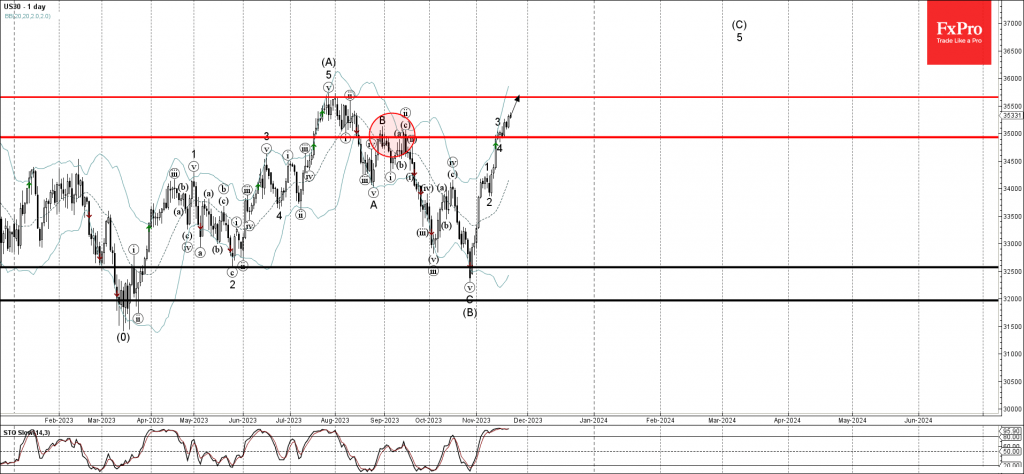
Dow Jones Wave Analysis
- Dow Jones broke key resistance level 35000.
- Likely to rise to resistance level 3565.00
Dow Jones index recently broke the key resistance level 35000.00 (which has been reversing the price from the start of September).
The breakout of the resistance level 35000.00 accelerated the active minor impulse wave 5 of the higher order impulse wave (C) from the end of October.
Given the prevailing risk on sentiment seen across the equity markets today, Dow Jones index can be expected to rise further to the next resistance level 3565.00 (former multi-month high from the end of July).
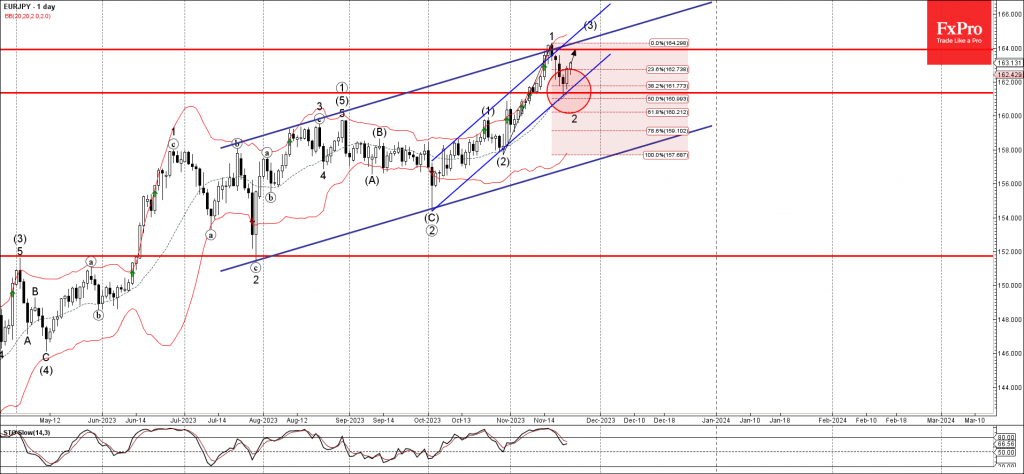
EURJPY Wave Analysis
- EURJPY reversed from support level 161.35
- Likely to rise to resistance level 164.00
EURJPY currency pair recently reversed up from the key support level 161.35, coinciding with the 20-day moving average support trendline of the daily up channel from October and the 50% Fibonacci correction of the upward impulse from August.
The upward reversal from the support level 161.35 stopped the earlier minor correction 2 from the middle of November.
Given the clear daily uptrend, EURJPY currency pair can be expected to rise further to the next resistance level 164.00, which stopped the previous impulse wave 1.
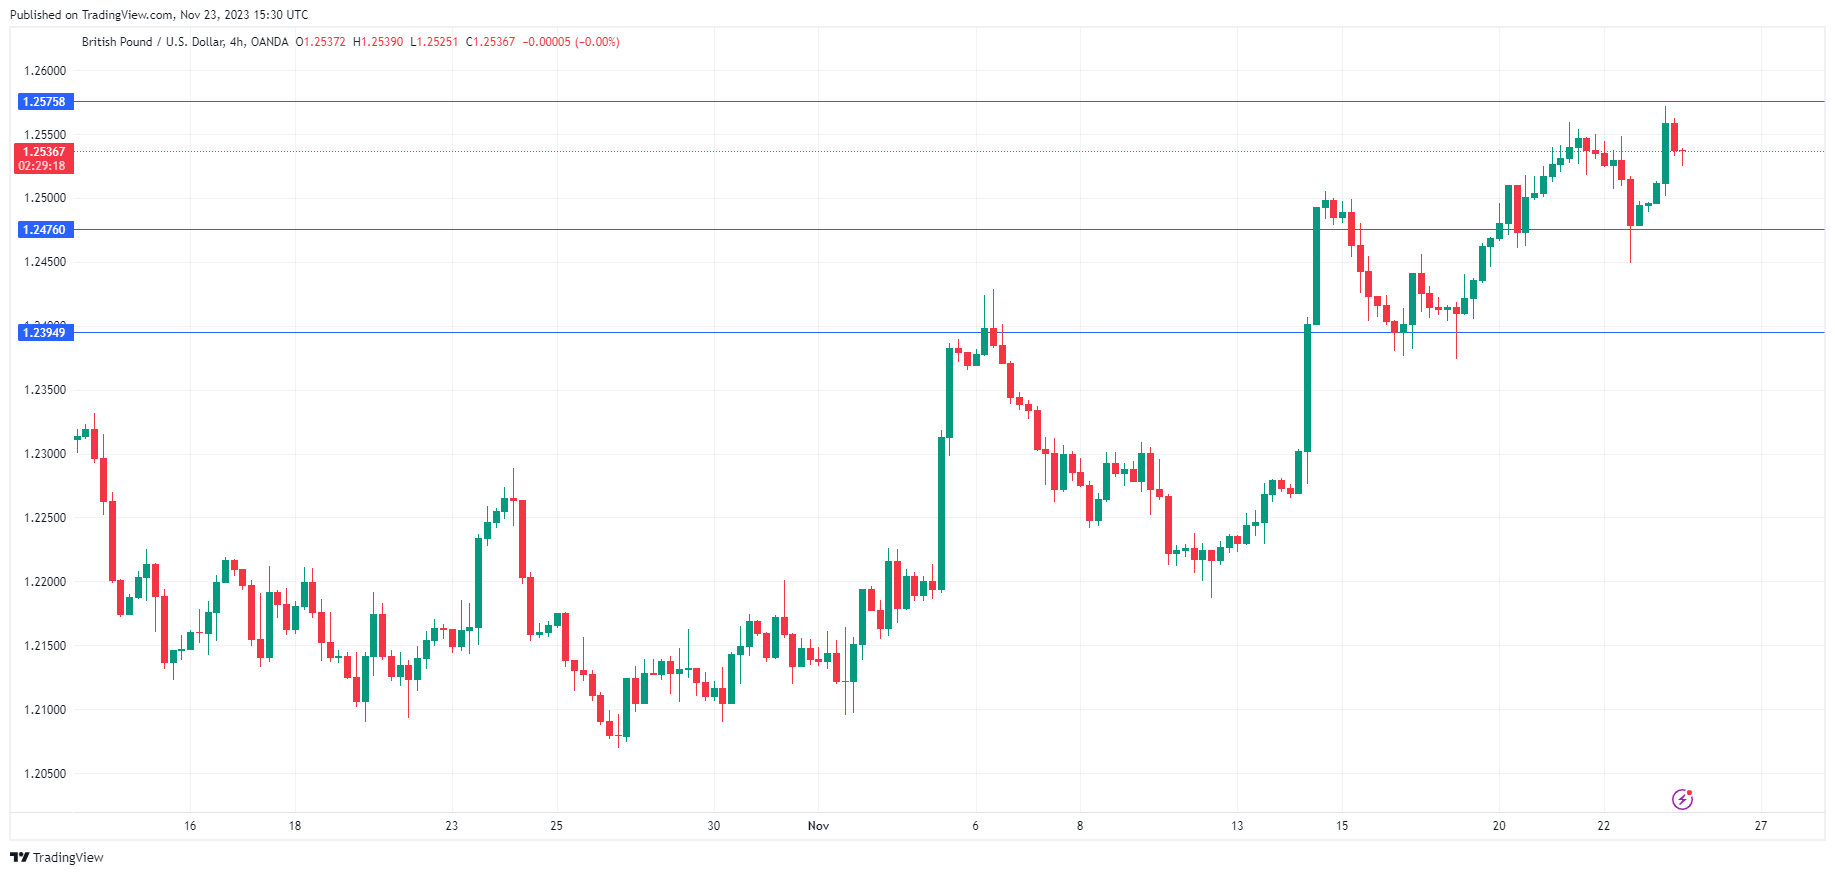
British Pound Hits 10-Week high as PMIs Accelerate
- UK PMIs accelerate
The British pound has gained ground on Thursday. In the North American session, GBP/USD is trading at 1.2536, up 0.34%. Earlier today, the pound touched a high of 1.2569, its highest level since September 6th.
UK PMIs improve
The UK released manufacturing and services PMIs earlier today, and both PMIs improved and beat expectations, which has given the British pound a boost.
The manufacturing PMI rose to 46.7 in November (Oct. 44.8), above the market consensus of 45. The services PMI improved to 50.5 (Oct. 49.5), beating the market consensus of 49.5. Manufacturing continues to decline, but the silver lining was that this release was the slowest decline in five months. Still, employment levels and new orders continue to fall, a result of weak demand. The services PMI managed to push into growth territory, but barely. The 50 line separates contraction from expansion.
The weak PMIs are further evidence of a weak UK economy, which has cooled down due to the Bank of England’s aggressive tightening. That has pushed inflation lower, although the current clip of 4.6% remains more than double the 2% target.
The markets are hopeful of rate cuts next year, even though BoE Governor Andrew Bailey continues to insist the BoE has no plans to trim rates. With inflation still high and the battle far from won, Bailey would risk losing credibility if he were to hint at rate cuts and then have to raise rates if inflation unexpectedly climbed higher.
US markets are closed for Thanksgiving, but the markets will be keeping a close eye on US manufacturing and services PMIs, which will be released on Friday. Both PMIs are expected around the 50.0 line, which separates contraction from expansion. If the reports are weaker than expected, we could see the US dollar slip, as expectations will likely rise regarding rate cuts next year.
GBP/USD Technical
- GBP/USD put pressure on resistance at 1.2575 earlier. Above, there is resistance at 1.2687
- 1.2476 and 1.2394 are the next support levels
ETHUSD Breaks Above Trendline But Fails to Rally
- ETHUSD conquers downward sloping trendline
- Meets strong resistance though at crucial technical level
- Momentum indicators warn for impending pullback
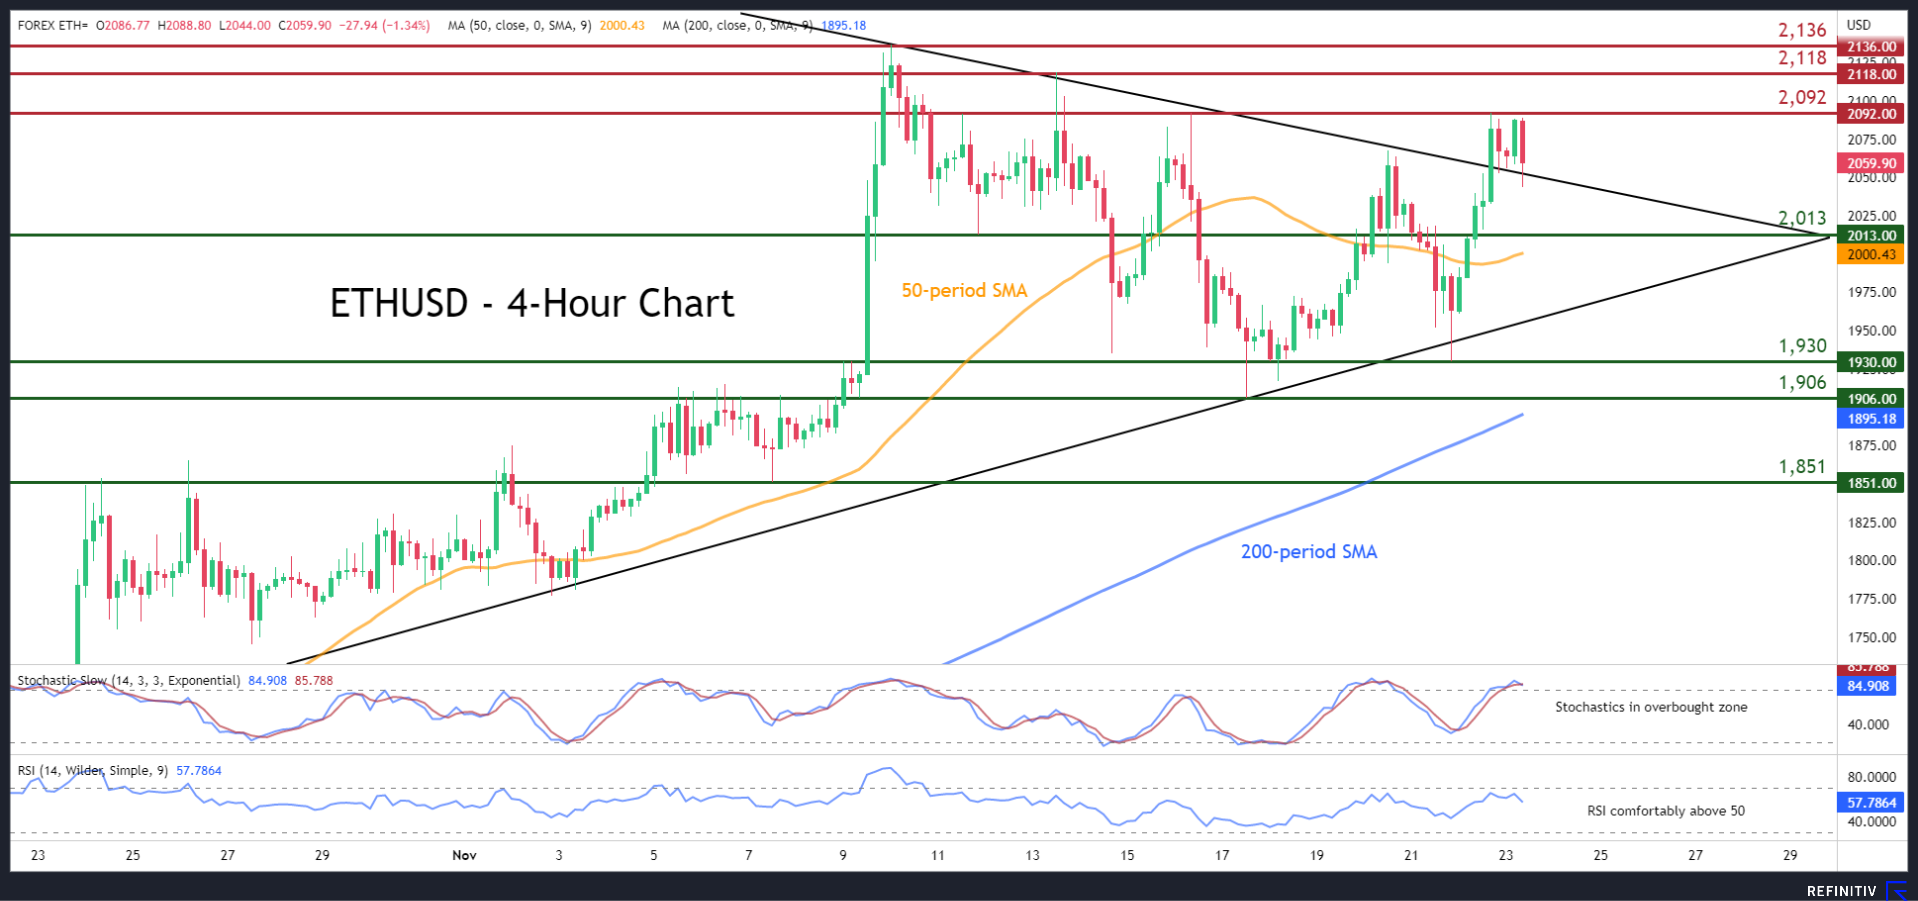
ETHUSD (Ethereum) had been forming a structure of lower highs in the four-hour chart since its peak at 2,136 on November 10. However, yesterday, the price managed to violate the descending trendline that connects its recent highs, but the bulls seem unable to reclaim the strong resistance of 2,092 for now.
As both the stochastic oscillator and the RSI show signs of waning positive momentum, the price could reverse back towards the 2,013 handle. Breaking below that zone, Ethereum could test 1,930 ahead of the 1,906 support level registered on November 17. Further declines might then cease at the 1,851 barrier.
On the flipside, if buying pressures intensify, the recent resistance of 2,092 could prove to be the first barricade for the price to overcome. A break above that region may trigger an advance towards 2,118. Piercing through the latter, the price could revisit its November peak of 2,136.
In brief, ETHUSD spiked aggressively above its descending trendline, but the move was not enough to spark a rally to the upside. Hence, the repeated failure to claim the 2,092 mark could potentially lead to a significant retreat.
NZD/USD Rises Ahead of Retail Sales
- New Zealand retail sales expected to decline by 0.8%
- US markets closed for Thanksgiving
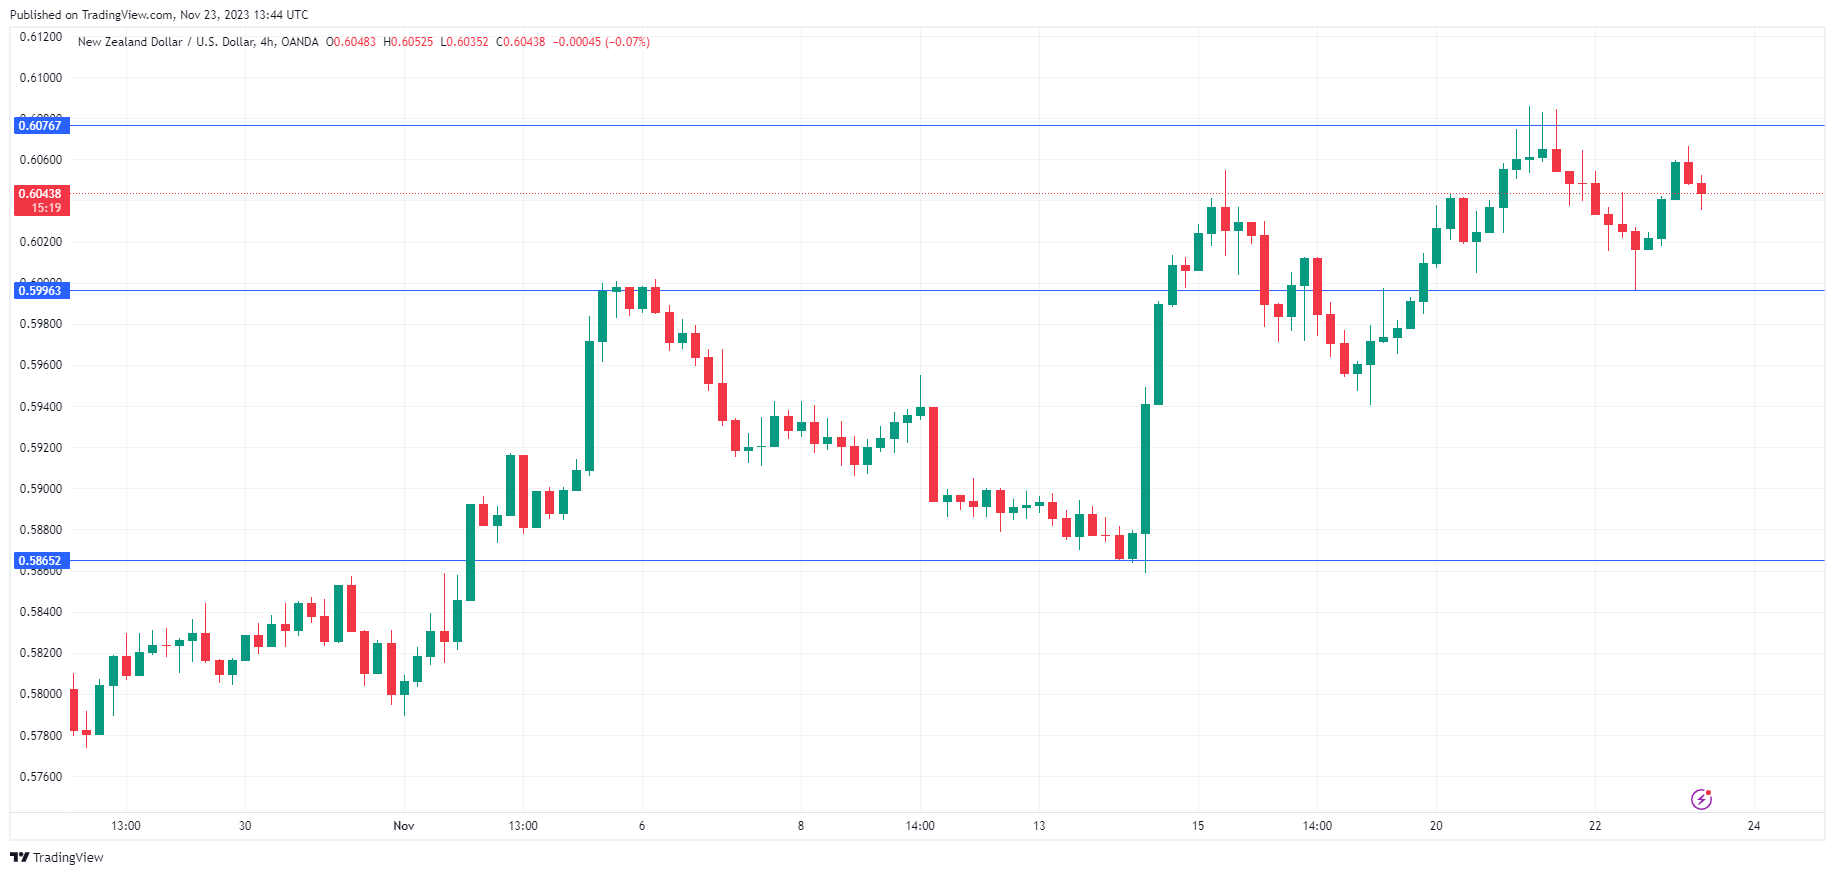
The New Zealand dollar is in positive territory on Thursday. Early in the North American session, NZD/USD is trading at 0.6042, up 0.34%.
Will New Zealand retail sales continue declining?
Retail sales are a key gauge of consumer spending and the New Zealand consumer has been holding tightly to the purse strings. In the second quarter, retail sales fell 1% q/q, with most retail industries showing lower sales volumes. This marked a third consecutive losing quarter. The markets are bracing for another decline for Q3, with a consensus estimate of -0.8%.
The soft retail sales data isn’t really surprising as consumers are being squeezed by high inflation and elevated borrowing costs. The decrease in household purchasing power has meant a decline in spending. High interest rates are still filtering through the economy, which could further dampen consumer spending in the fourth quarter.
The Reserve Bank of New Zealand has put a pause on rates for three straight times, which has naturally raised speculation that the central bank has completed its tightening cycle, which has brought the cash rate to 5.5%. Inflation in the third quarter eased from 6.0% to 5.6% y/y in the third quarter and this decline means that there is a strong likelihood that the RBNZ will hold rates at the November 27th meeting.
US markets are closed for the Thanksgiving holiday, which means we’re unlikely to see much movement today with the US dollar. That could change on Friday, with the release of US manufacturing and services PMIs. The consensus estimates for November stand at 49.8 for manufacturing (Oct: 50.0) and 50.4 for services (Oct. 49.8). If either of the PMIs miss expectations, that could translate into volatility from the US dollar.
NZD/USD Technical
- NZD/USD is putting pressure on resistance at 0.6076. The resistance line 0.6161
- There is support at 0.5996 and 0.5885
USD/JPY Mid-Day Outlook
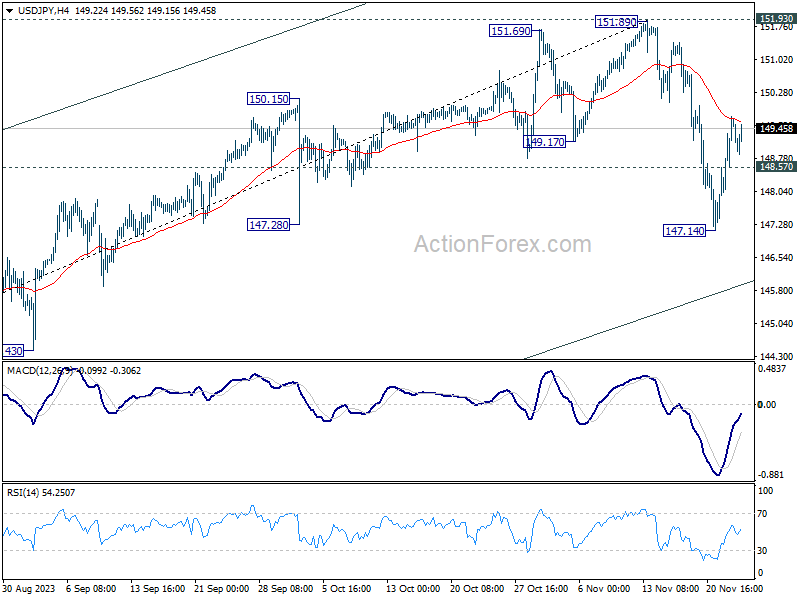
Daily Pivots: (S1) 148.46; (P) 149.10; (R1) 150.19; More...
Intraday bias in USD/JPY stays neutral first. On the downside, break of 148.57 minor support will indicate rejection by 55 4H EMA, and turn bias back to the downside for 147.14 and below, to resume the fall from 151.89. However, sustained break of 55 4H EMA (now at 149.62) will revive near term bullishness, and target a retest on 151.89/93 resistance zone.
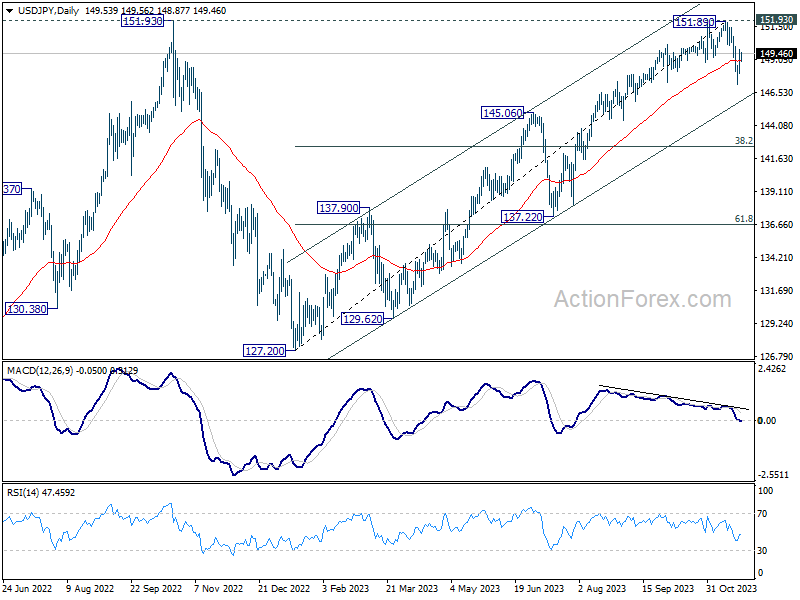
In the bigger picture, rise from 127.20 (2023 low) is seen as the second leg of the pattern from 151.93 resistance (2022 high). Decisive break of 145.06 resistance turned support will confirm that this second leg has completed, after rejection by 151.93. Deeper fall would be seen through 38.2% retracement of 127.20 to 151.89 at 142.45 to 61.8% retracement at 136.63. Nevertheless strong bounce from 145.06 will retain medium term bullishness for another test on 151.93 at a later stage.
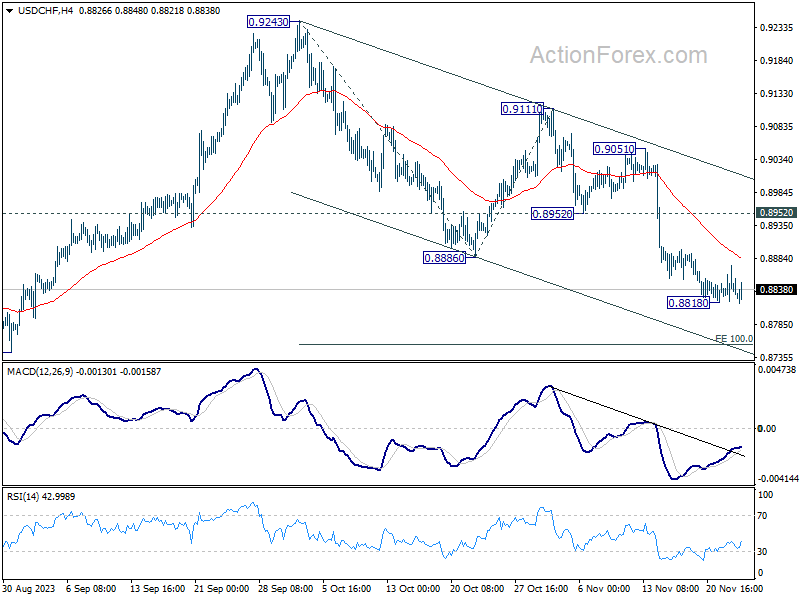
USD/CHF Mid-Day Outlook
Daily Pivots: (S1) 0.8814; (P) 0.8845; (R1) 0.8869; More....
Intraday bias in USD/CHF stays neutral for the moment. Consolidation form 0.8818 could extend further and stronger recovery cannot be ruled out. But near term outlook will stay bearish as long as 0.8952 support turned resistance holds. On the downside, below 0.8818 will resume whole decline from 0.9243 to 100% projection of 0.9243 to 0.8886 from 0.9111 at 0.8754 next.
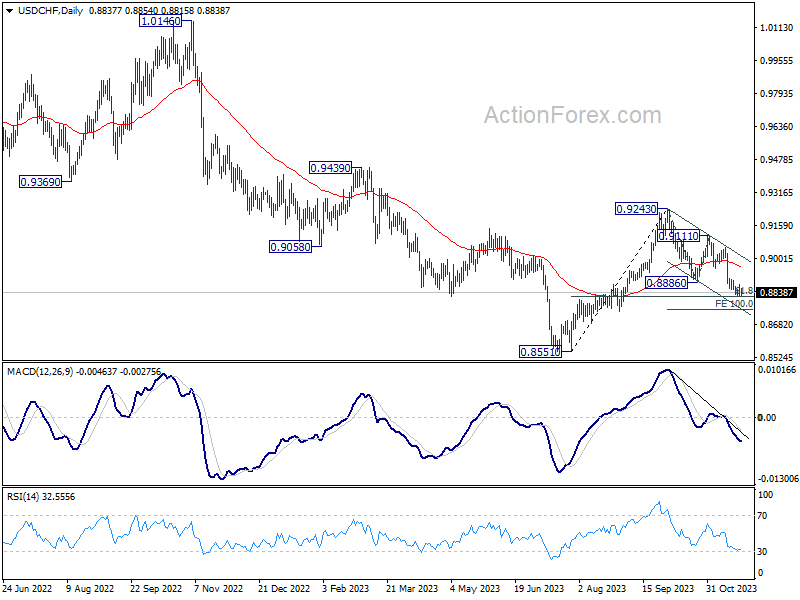
In the bigger picture, price actions from 0.8551 are currently seen as part of a corrective pattern to the decline from 1.0146 (2022 high). Fall from 0.9243 is seen as the second leg for now. Deeper fall would be seen to 61.8% retracement of 0.8551 to 0.9243 at 0.8815. Sustained break there will bring retest of 0.8551 low. For now, this will remain the favored case as long as 0.9111 resistance holds.
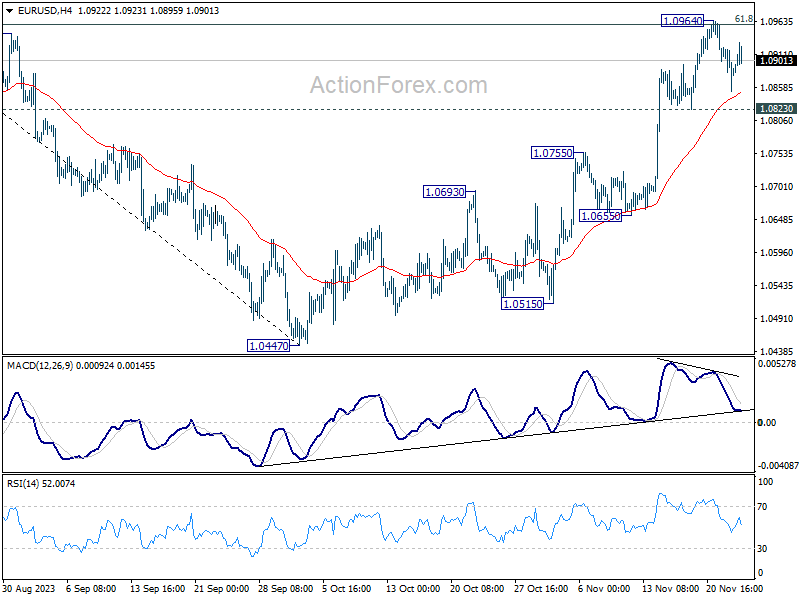
EUR/USD Mid-Day Outlook
Daily Pivots: (S1) 1.0854; (P) 1.0888; (R1) 1.0924; More...
Intraday bias in EUR/USD remains neutral at this point, as consolidation from 1.0964 is extending. Further rally is in favor as long as 1.0823 support holds. Sustained break of 61.8% retracement of 1.1274 to 1.0447 at 1.0958 will resume the rise from 1.0447 to retest 1.1274 high. However, firm break of 1.0823 will indicate short term topping, and turn bias back to the downside for deeper decline.
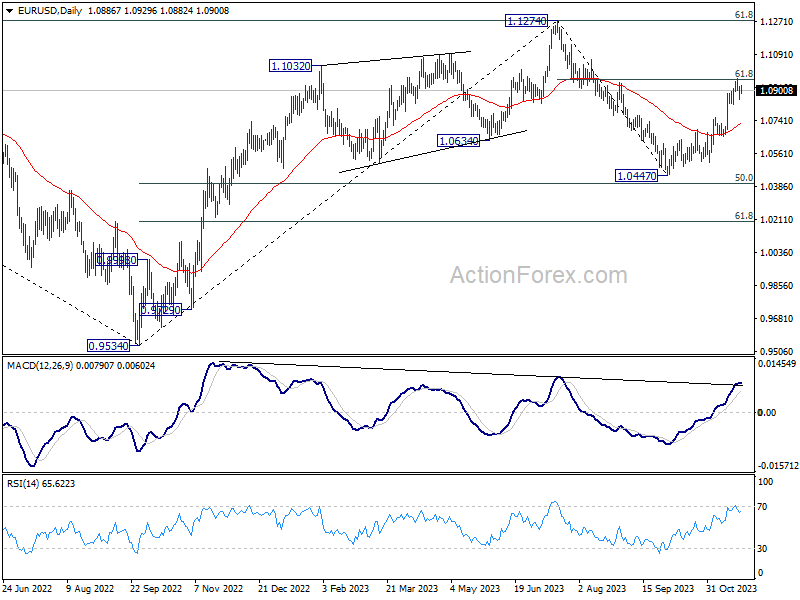
In the bigger picture, price actions from 1.1274 are viewed as a corrective pattern to rise from 0.9534 (2022 low). Rise from 1.0447 is tentatively seen as the second leg. Hence while further rally could be seen, upside should be limited by 1.1274 to bring the third leg of the pattern.
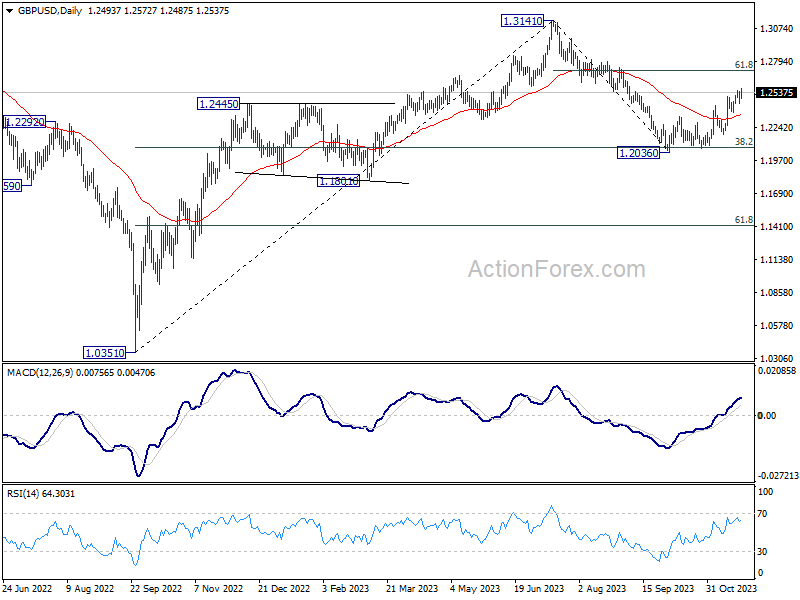
GBP/USD Mid-Day Outlook
Daily Pivots: (S1) 1.2445; (P) 1.2498; (R1) 1.2546; More...
Intraday bias in GBP/USD is back on the upside with break of 1.2557 temporary top. Rise from 1.2036 is resuming for 61.8% retracement of 1.3141 to 1.2036 at 1.2716 next. On the downside, though, below 1.2447 minor support will turn intraday bias again first, and probably bring lengthier consolidations.
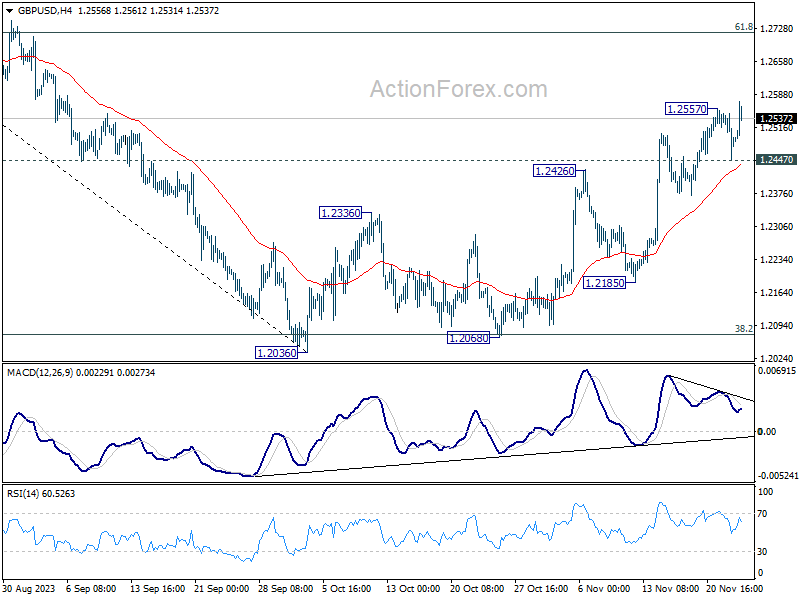
In the bigger picture, price actions from 1.3141 are seen as a corrective pattern to rise from 1.0351 (2022 low). Strong rebound from 38.2% retracement of 1.0351 (2022 low) to 1.3141 at 1.2075 argues that current rise from 1.2036 is the second leg. However, while further rally could be seen, upside should be limited by 1.3141 to bring the third leg of the pattern.