Sample Category Title
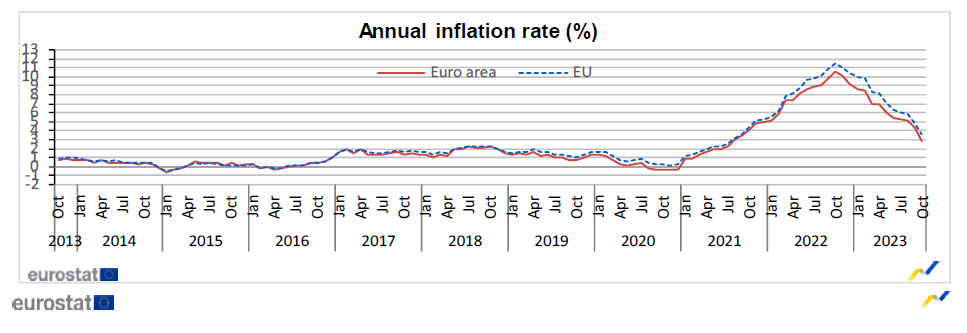
Eurozone CPI finalized at 2.9% yoy in Oct, core at 4.2% yoy
Eurozone CPI was finalized at 2.9% yoy in October, down from September's 4.3% yoy. CPI core (excluding energy, food, alcohol & tobacco) was finalized at 4.2% yoy, down from previous reading of 4.5% yoy. The highest contribution came from services (+1.97%), followed by food, alcohol & tobacco (+1.48%), non-energy industrial goods (+0.90%) and energy (-1.45%).
EU CPI was finalized at 3.6% yoy, down from prior month's 4.9% yoy. The lowest annual rates were registered in Belgium (-1.7%), the Netherlands (-1.0%) and Denmark (-0.4%). The highest annual rates were recorded in Hungary (9.6%), Czechia (9.5%) and Romania (8.3%). Compared with September, annual inflation fell in twenty-two Member States and rose in five.
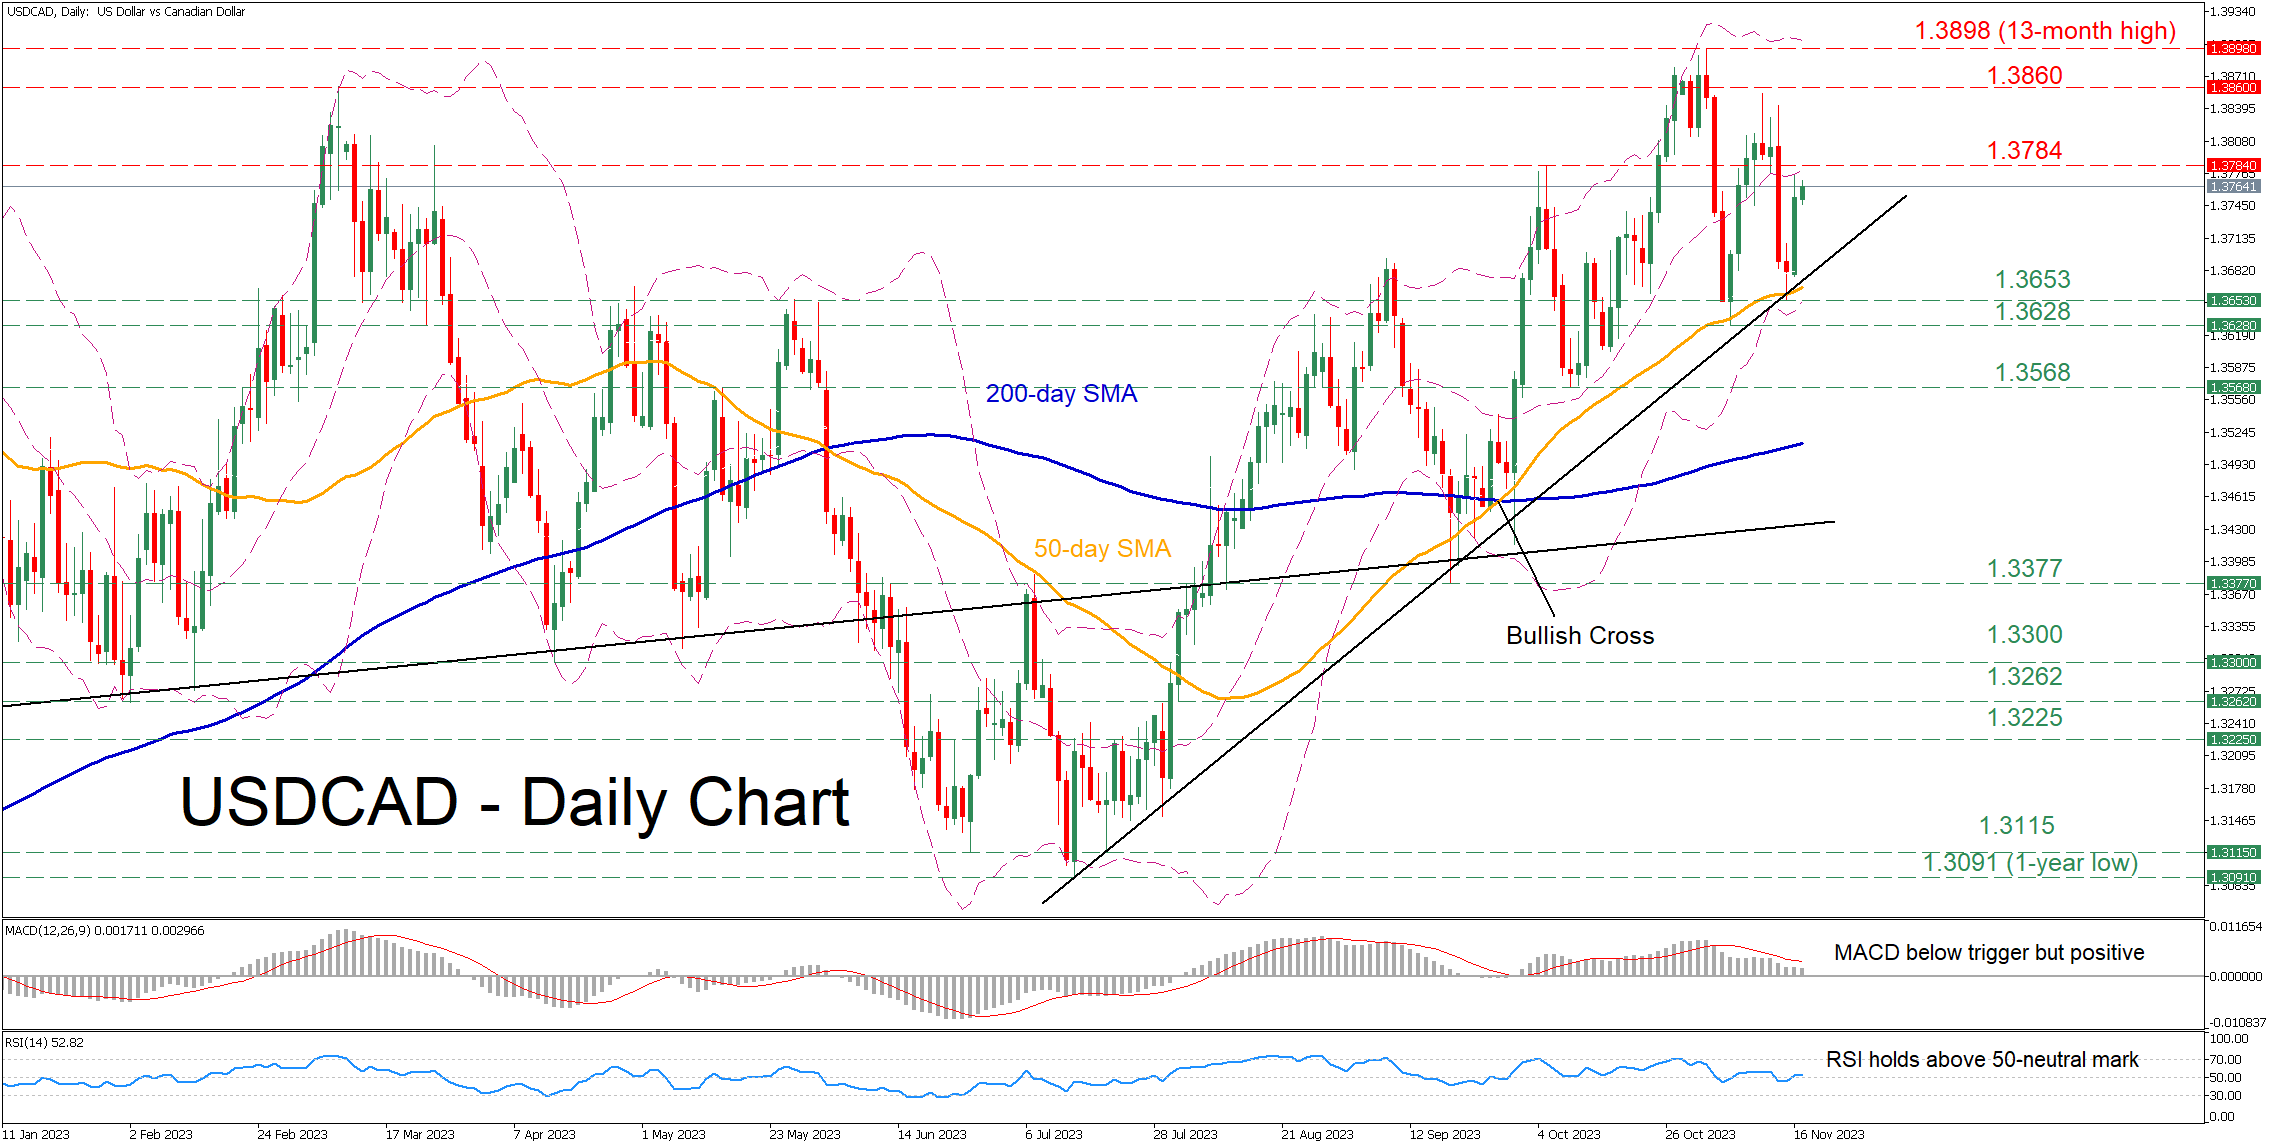
USDCAD Bounces Off 50-day SMA
- USDCAD experienced a setback, falling below the 1.3800 handle
- But quickly found its feet at the 50-day SMA and recouped some losses
- Momentum indicators suggest a cautiously bullish tone
USDCAD had been in a steady advance since July, posting a fresh 13-month peak of 1.3898 on November 2. Since then, the pair has experienced two rounds of weakness, but both attempted declines got curbed by the ascending 50-day simple moving average (SMA).
Given that the momentum indicators are tilted to the upside, the bulls could initially attack the October resistance of 1.3784. A violation of that zone could trigger an advance towards the March peak of 1.3860. Failing to halt there, the price could revisit its 2023 peak of 1.3898, which is also a 13-month high.
On the flipside, should the price reverse lower, the recent support of 1.3653, which overlaps with the 50-day SMA, could act as the first line of defense. Sliding beneath that floor, the pair could test the November bottom of 1.3628. Further retreats could then cease at the October low of 1.3568.
In brief, USDCAD has been experiencing some volatile moves lately, which is also evident by the widening Bollinger bands. However, the bullish medium-term structure of higher lows remains intact as the 50-day SMA has repeatedly repelled any declines.
Easing U.S. Inflation Pushes Gold Higher
Gold rose above 1,980 on Thursday, having a weekly rise of over 2%, boosted by declining inflation and indications of diminishing economic growth in the U.S. These factors have supported market beliefs that the Federal Reserve has completed its rate hiking cycle.
Possible effects for traders
This week's data revealed that the U.S. Consumer Price Index remained unchanged in October, with the core rate rising below the forecast only by 0.2%. Additionally, Producer Price Index figures dropped to their lowest in three and a half years. Finally, U.S. Jobless Claims figures were higher than expected. The data proves the Federal Reserve's inflation containment efforts to be effective. Thus, market participants don't expect more rate increases from the U.S. central bank. Investors believe that the rate hiking cycle has ended, and the opportunity cost for gold, a non-yielding asset, has decreased.
XAUUSD was relatively flat during the Asian and early European trading sessions. Market participants now focus on the upcoming U.S. Building Permits report at 1:30 p.m. UTC. Lower-than-expected figures may push the gold price towards 2,000. However, XAUUSD may correct downwards if the numbers are higher than expected. 'Spot gold may break a resistance at $1,989 per ounce and rise into a range of 1,999–2,003, driven by a wave 3' said Reuters analyst Wang Tao.
Hawkish BOE Policy May Support the British pound
The British pound (GBP) declined by 0.1% on Thursday, even though U.S. Jobless Claims figures were higher than expected.
Possible effects for traders
On Thursday, the U.S. Dollar Index (DXY) declined slightly, weakened by the higher-than-anticipated weekly U.S. Jobless Claims. Also, the market believes the Federal Reserve (Fed) will be more dovish with the monetary policy from now on, so the U.S. dollar is declining. Expectations of interest rate cuts by the U.S. central bank favour the British pound, as rate futures suggest that the Fed may begin to cut rates sooner than the Bank of England (BOE). The BOE's Deputy Governor, Dave Ramsden, said yesterday that the U.K. monetary policy must remain restrictive for a prolonged duration.
During the early European trading session, GBPUSD declined as the U.K. Retail Sales figures came out lower than anticipated. Today, traders should focus on the upcoming U.S. Building Permits report at 1:30 p.m. UTC. If the figures exceed expectations, GBPUSD may drop below 1.23400. Contrarily, lower-than-expected Building Permits numbers could sustain the current short-term upward trend in GBPUSD.
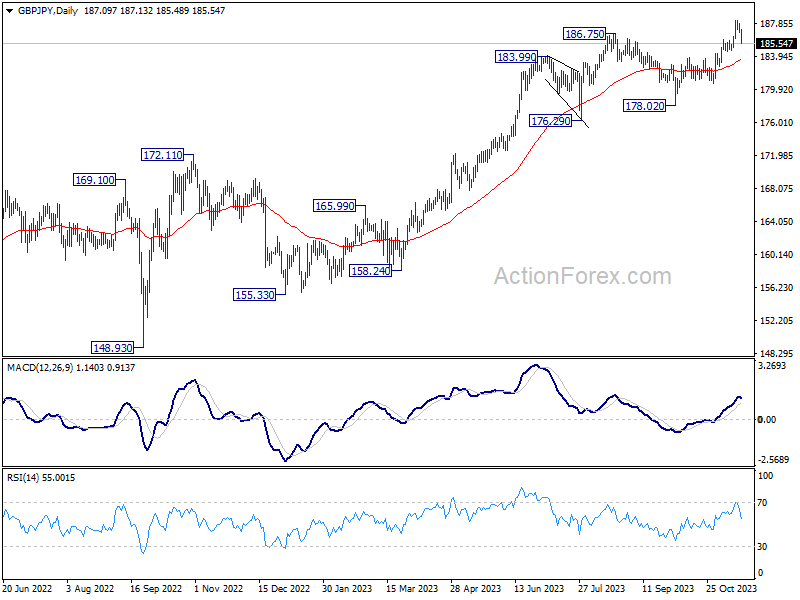
GBP/JPY Daily Outlook
Daily Pivots: (S1) 186.64; (P) 187.32; (R1) 187.82; More...
Intraday bias in GBP/JPY is now on the downside with break of 55 4H EMA. Deeper decline is underway to 183.79 resistance turned support. Rebound from there would retain near term bullishness for another rise through 188.26 later. However, firm break of 183.79 will indicate that larger correction is underway.
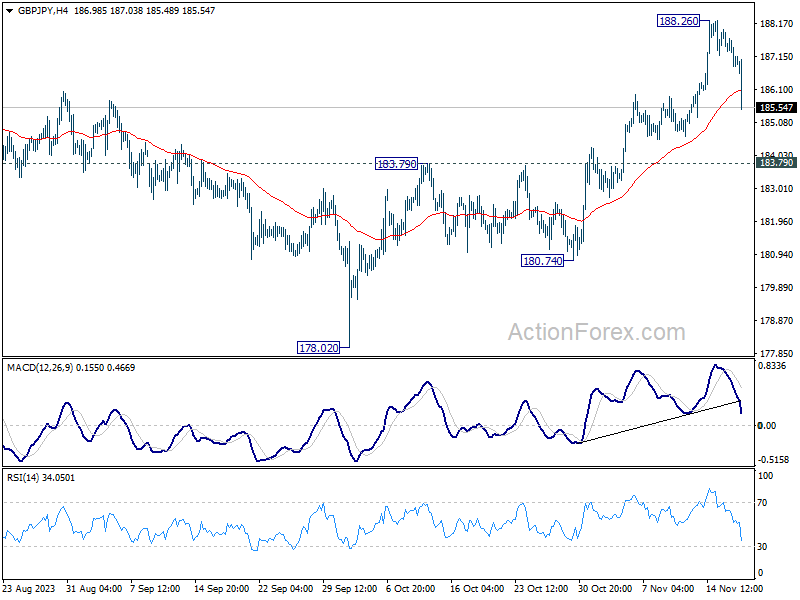
In the bigger picture, as long as 178.02 support holds, larger up trend from 123.94 (202 low) should still be in progress, next target is 195.86 (2015 high). For now, outlook will stay bullish as long as 183.79 resistance turned support holds, in case of deep pullback.
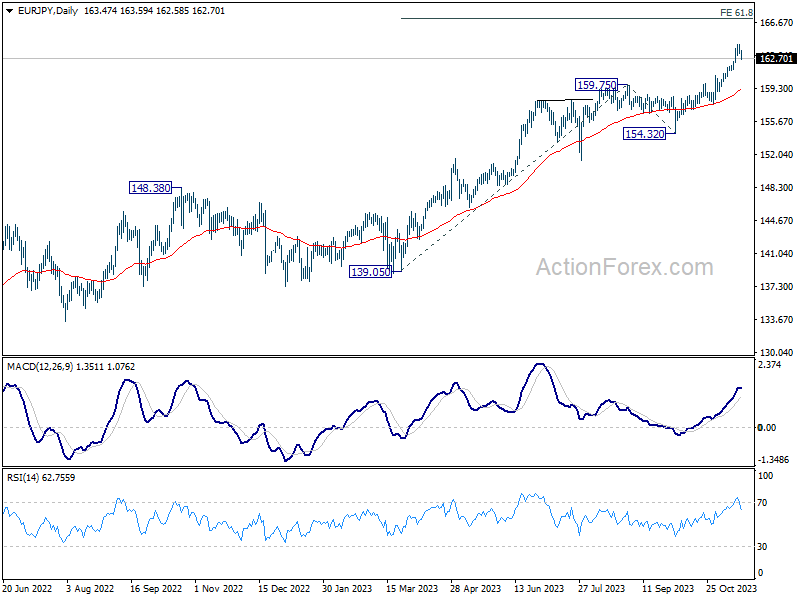
EUR/JPY Daily Outlook
Daily Pivots: (S1) 163.12; (P) 163.72; (R1) 164.18; More....
A temporary top is formed at 164.29 in EUR/JPY with current retreat. Intraday bias is turned neutral for consolidations first. Downside of retreat should be contained well above 159.75 resistance turned support to bring another rally. On the upside, break of 164.29 will resume larger up trend to 61.8% projection of 139.05 to 159.75 from 154.32 at 167.11.
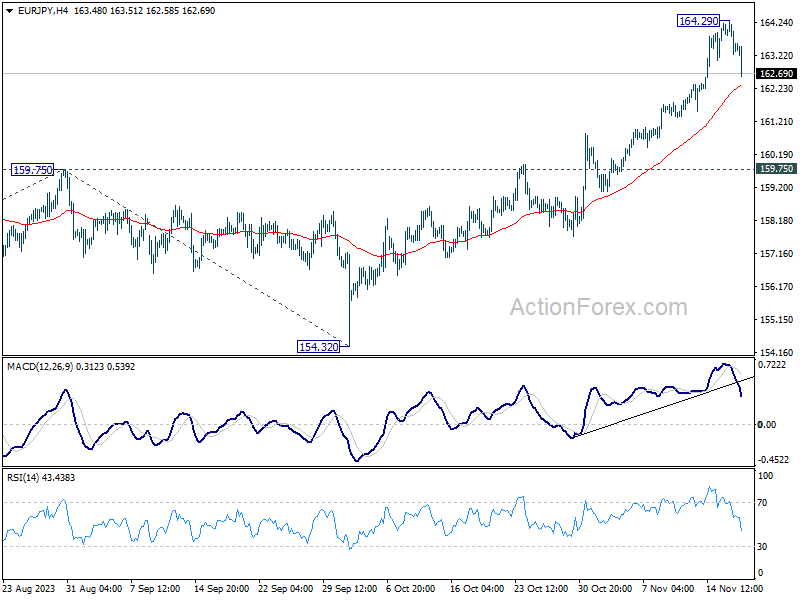
In the bigger picture, rise from 114.42 (2020 low) is in progress. Next target is 169.96 (2008 high). On the downside, break of 159.75 resistance turned support is needed to be the first sign of medium term topping. Otherwise, outlook will remain bullish even in case of deep pullback.
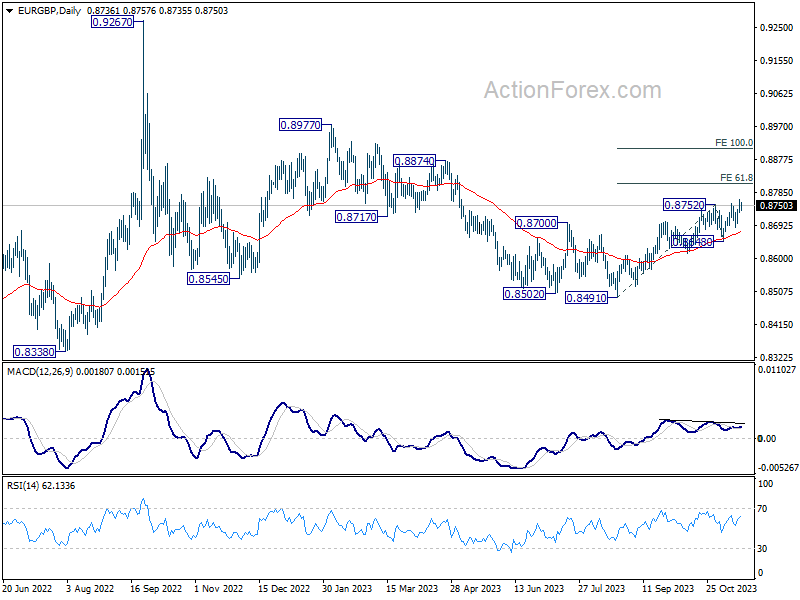
EUR/GBP Daily Outlook
Daily Pivots: (S1) 0.8727; (P) 0.8747; (R1) 0.8761; More....
Intraday bias in EUR/GBP remains on the upside at this point. Current rise is part of the whole rally from 0.8491. Next target is 61.8% projection of 0.8491 to 0.8752 from 0.8648 at 0.8809. On the downside, break of 0.8687 support is needed to indicate short term topping. Otherwise, further rally remains in favor in case of retreat.
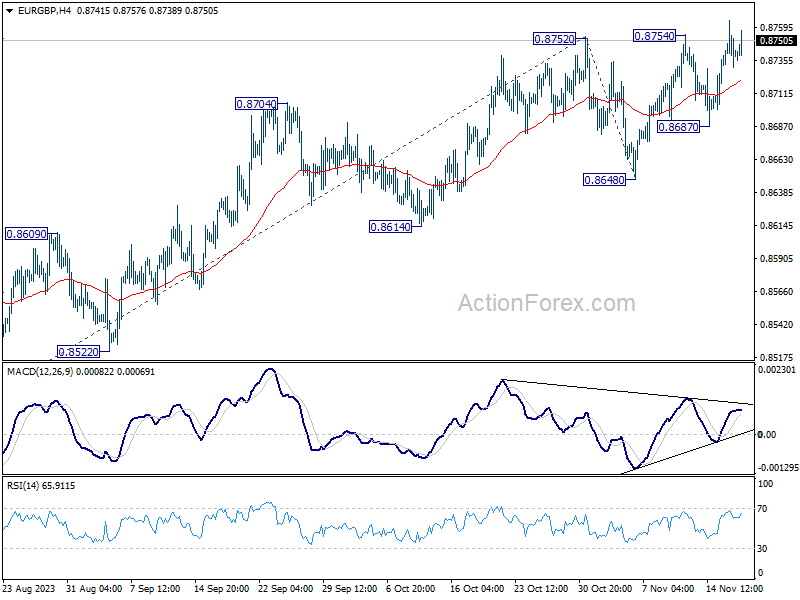
In the bigger picture, current development suggests that whole down trend from 0.9267 (2022 high) has completed with three down to to 0.8491. Rise from 0.8491 is seen as another leg inside that pattern from 0.9499 (2020 high). Further rally should be seen to 0.8977 resistance and above. This will remain the favored case as long as 0.8648 support holds.
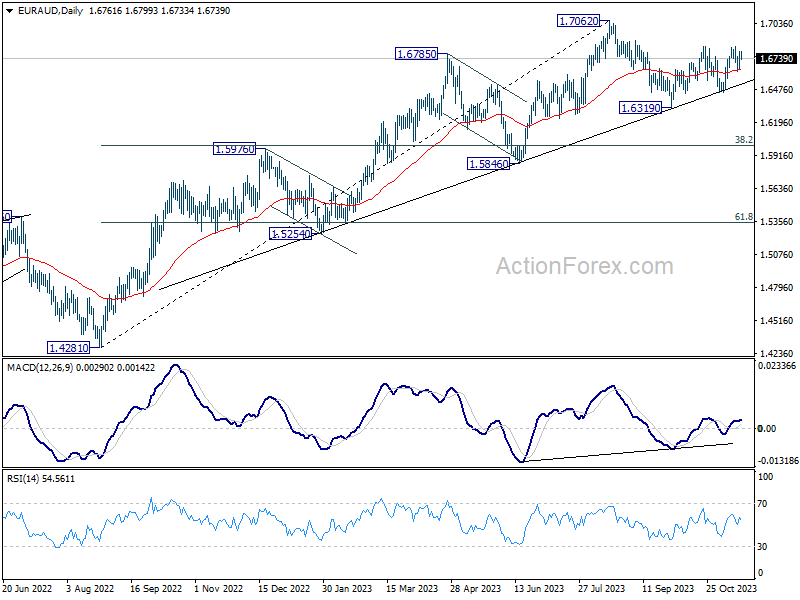
EUR/AUD Daily Outlook
Daily Pivots: (S1) 1.6676; (P) 1.6737; (R1) 1.6833; More...
Intraday bias in EUR/AUD remains neutral for the moment. On the upside, sustained break of 1.6843 will resume the rebound from 1.6319 for retesting 1.7062 high next. On the downside, however, below 1.6631 minor support will turn bias back to the downside for 1.6449 support instead.
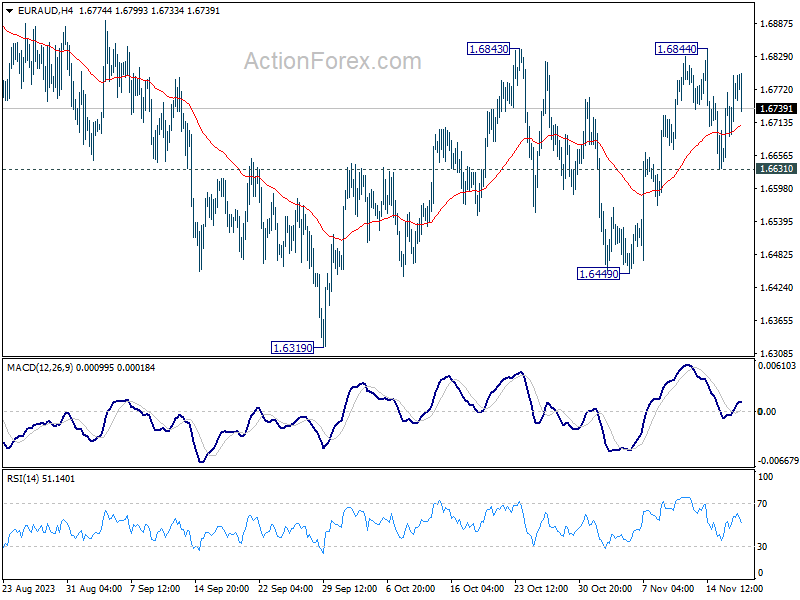
In the bigger picture, while 1.7062 is a medium term top, there is no clear sign of trend reversal as EUR/AUD continues to draw strong support from the medium term trend line. Break of 1.7062 will resume the larger up trend from 1.4281 (2022 low) to 1.7691 fibonacci level. Nevertheless, break of 1.6449 support will argue that deeper correction is underway to 38.2% retracement of 1.4281 to 1.7062 at 1.6000.
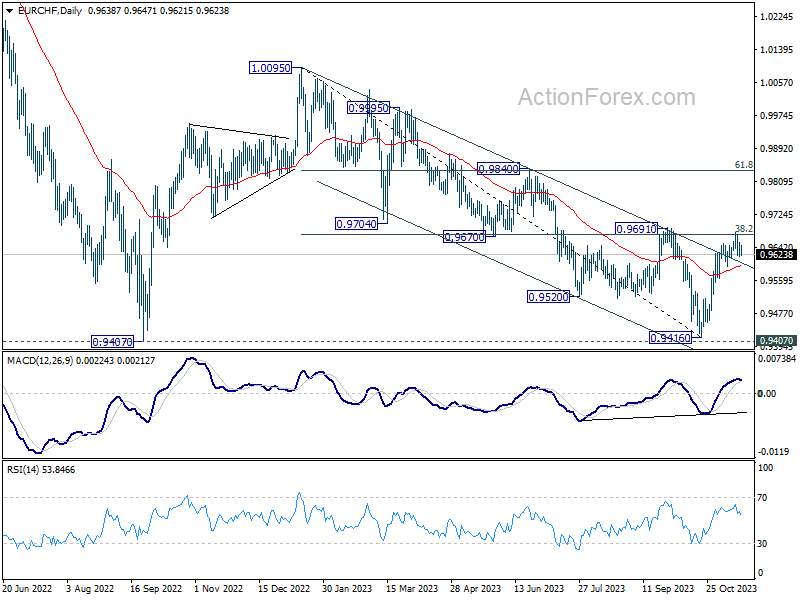
EUR/CHF Daily Outlook
Daily Pivots: (S1) 0.9628; (P) 0.9642; (R1) 0.9658; More...
Intraday bias in EUR/CHF remains neutral for consolidation below 0.9678. Further rally is expected as long as 0.9595 support holds. Firm break of 0.9678/91 resistance zone will argue that whole decline from 1.0095 has completed, just ahead of 0.9407 support (2022 low). Nevertheless, break of 0.9595 support will indicate short term topping, and turn bias back to the downside for deeper pull back.
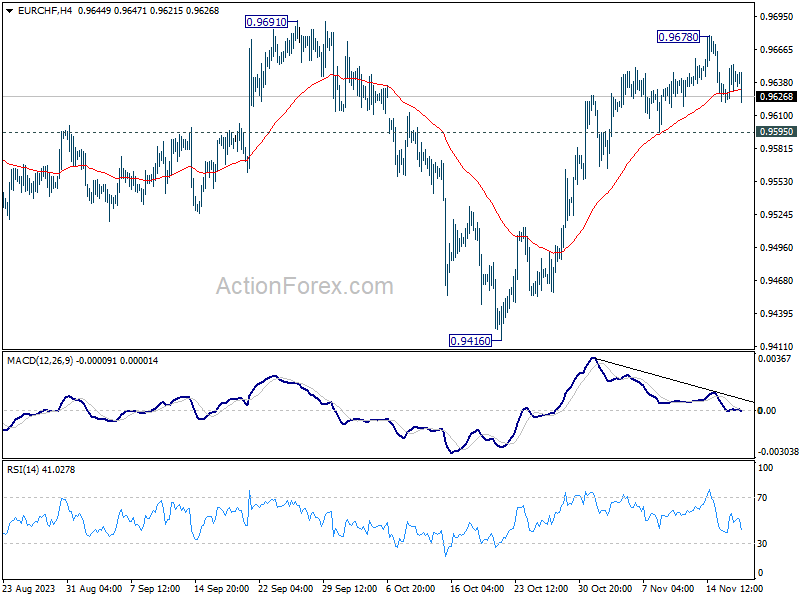
In the bigger picture, fall from 1.0095 (2023 high) might have completed at 0.9416, just ahead of 0.9407 support (2022 low). Sustained break of 0.9691 cluster resistance (38.2% retracement of 1.0095 to 0.9416 at 0.9675) will pave the way to 61.8% retracement at 0.9836 and above. However, rejection by 0.9691 will maintain medium term bearishness for another test on 0.9407 at least.
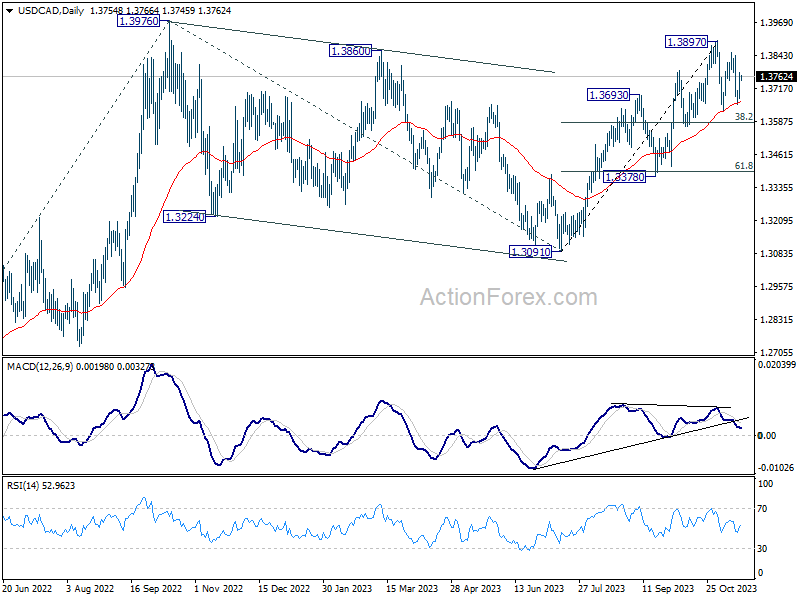
USD/CAD Daily Outlook
Daily Pivots: (S1) 1.3696; (P) 1.3737; (R1) 1.3795; More...
USD/CAD is staying in consolidation from 1.3897 and intraday bias remains neutral at this point. While another fall cannot be ruled out, downside should be contained by 38.2% retracement of 1.3091 to 1.3897 at 1.3589 to bring rebound. Break of 1.3897 is expected at a later stage to resume larger rally.
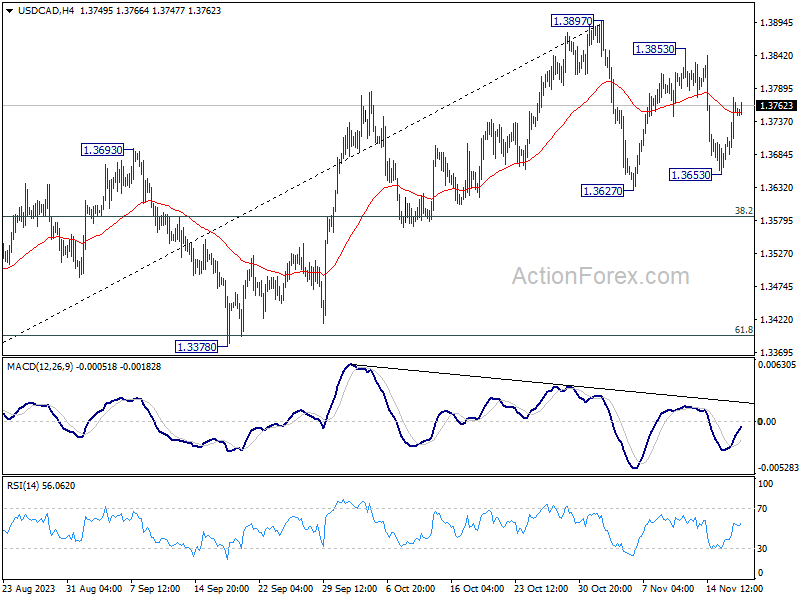
In the bigger picture, corrective pattern from 1.3976 (2022 high) should have completed with three waves down to 1.3091. Decisive break of 1.3976 high will confirm resumption of up trend from 1.2005 (2021 low). Next target is 61.8% projection of 1.2401 to 1.3976 from 1.3091 at 1.4064. This will remain the favored case as long as 1.3378 support holds.