Sample Category Title
Dollar Braces for Another Round of Nonfarm Payrolls
- US employment growth expected to slow down in October
- Dollar retreats ahead of the event but outlook remains bright
- Nonfarm payrolls to be released at 12:30 GMT Friday
US outperforms
It’s been a strong year for the United States. Despite a sharp slowdown in manufacturing and sky-high interest rates limiting access to credit, the US economy accelerated over the summer, with GDP growth clocking in at an annualized pace of 4.9% in the third quarter.
Heavy government spending has been the driving force behind this strength. The Biden administration is running an enormous budget deficit, which has shielded economic growth and helped prevent a recession.
But this gaping deficit has also propelled US borrowing costs higher. Yields on government bonds hit 5% in October, as the markets had difficulty absorbing all the debt supply that the Treasury unleashed to fund its spending spree.
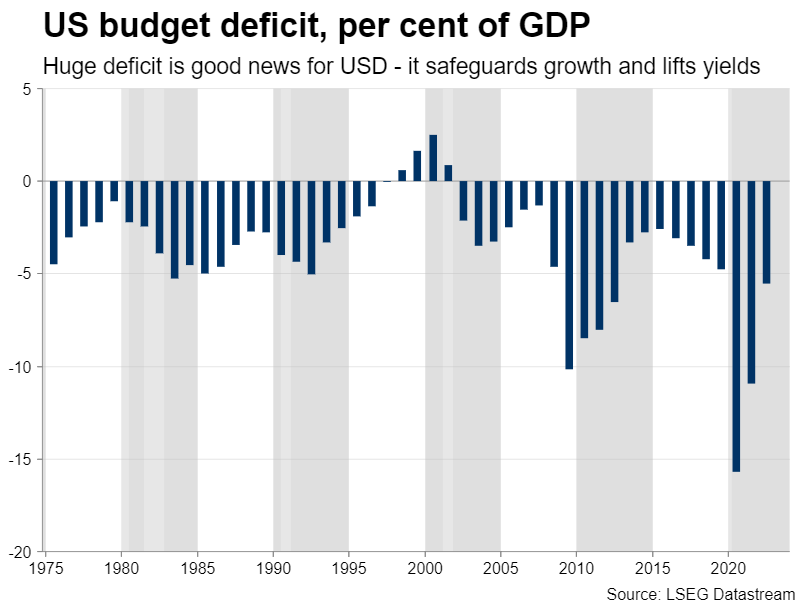
Both developments have helped the dollar become a more attractive investment destination, as the US currently boasts the strongest growth among the major economies and offers the highest interest rates on its debt.
Employment growth set to cool
The upcoming jobs data will shed some light on the health of the labor market, which has remained exceptionally tight so far. Nonfarm payrolls are projected to have risen by 170k in October, nearly half the 336k recorded last month, but still a solid number overall.
Meanwhile, the unemployment rate is expected unchanged at 3.8%, while wage growth is seen slowing down in annual terms, falling to 4.0% from 4.2% previously.
As for any surprises, most early indicators point towards a slight disappointment in this employment report. Business surveys from S&P Global showed that the rate of employment growth slowed sharply in October.
Similarly, the strikes at car manufacturing plants will subtract around 25k - 30k from payrolls growth, because workers who did not receive a salary during the period when the jobs data were collected are treated as unemployed.
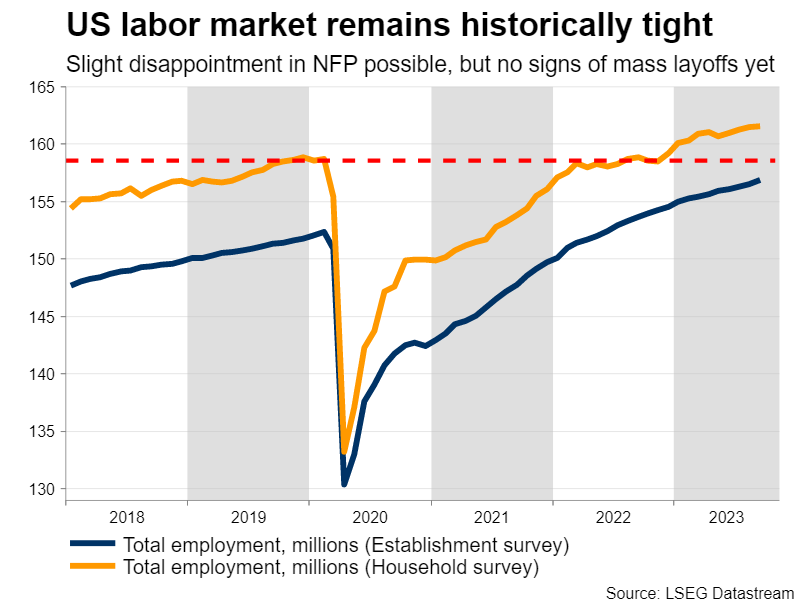
That said, there weren’t any signs of mass layoffs either in the US, as applications for unemployment benefits remained historically low in October. In other words, employment growth is gradually losing steam, but companies are not firing workers yet. It seems that the labor market has started to plateau.
Note that one of the most important early indicators of jobs growth, the ISM non-manufacturing survey, won’t be released until after the official employment data on Friday. Hence, investors have one less data point than usual to predict nonfarm payrolls with.
Can the dollar resume its rally?
An employment report that falls short of forecasts could inflict some damage on the dollar, but is unlikely to change the broader positive trend. Both growth fundamentals and interest rate differentials favor the US dollar at this stage, especially when compared with currencies such as the euro or the Japanese yen.
The euro has been haunted by recession concerns as growth in Europe has rolled over, the yen has been devastated by the Bank of Japan’s refusal to raise interest rates, while the instability in China could keep commodity-linked currencies under pressure.
Therefore, there’s no appealing alternative to the dollar at this stage. Bond investors can earn an annual return of almost 5% in the United States, which is the highest of the major economies once inflation is accounted for. With bond supply set to remain ample in the coming quarters and the economy looking solid, US yields could stay elevated, adding support to the dollar.
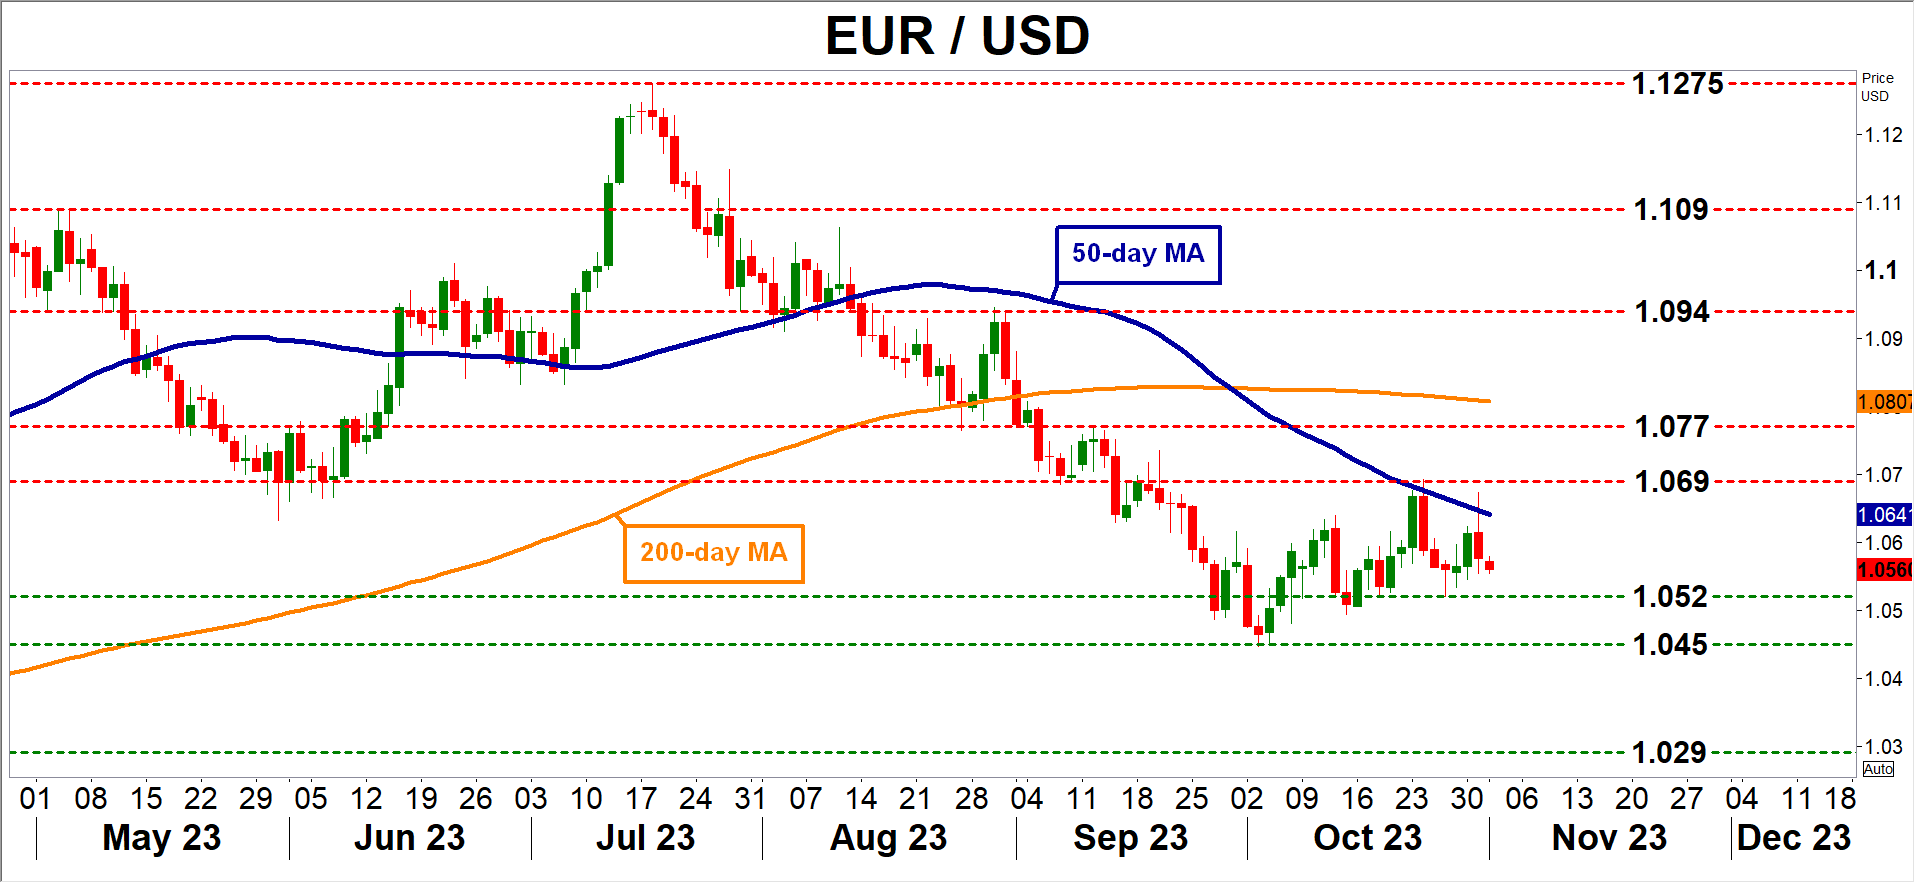
Looking at the charts, euro/dollar has been in a sustained decline since mid-July, and despite the latest bounce, the pair has been rejected twice from its 50-day moving average this month. In case of further losses, the 1.0520 zone could come into play. On the other hand, buyers would need to pierce above the 50-day average at 1.0640 and then challenge 1.0690 to improve their chances for a trend reversal.
USD/CAD Analysis: New High of the Year
As the chart shows, yesterday, the USD/CAD rate exceeded 1.389 for the first time in 2023. This happened against the backdrop of news regarding the economies of the USA and Canada:
→ Statistics Canada estimates that GDP contracted in the third quarter. Technically, it can be stated that the Canadian economy has entered a technical recession, as this is the second consecutive negative change in GDP for the quarter.
→ The US Employment Cost Index rose 1.1% in the third quarter after rising 1.0% in the second quarter, the Labour Department reported Tuesday. This is a sign of a strong labour market, but at the same time, it indicates the preconditions for rising inflation, since the costs to the employer may fall on the consumer.
How the Fed assesses inflation will become known today at 21:30 GMT+3 from Powell’s speech. Also, volatility in the USD/CAD market may increase the speech of Bank of Canada Governor Tiff Macklem at 23:15 GMT+3.
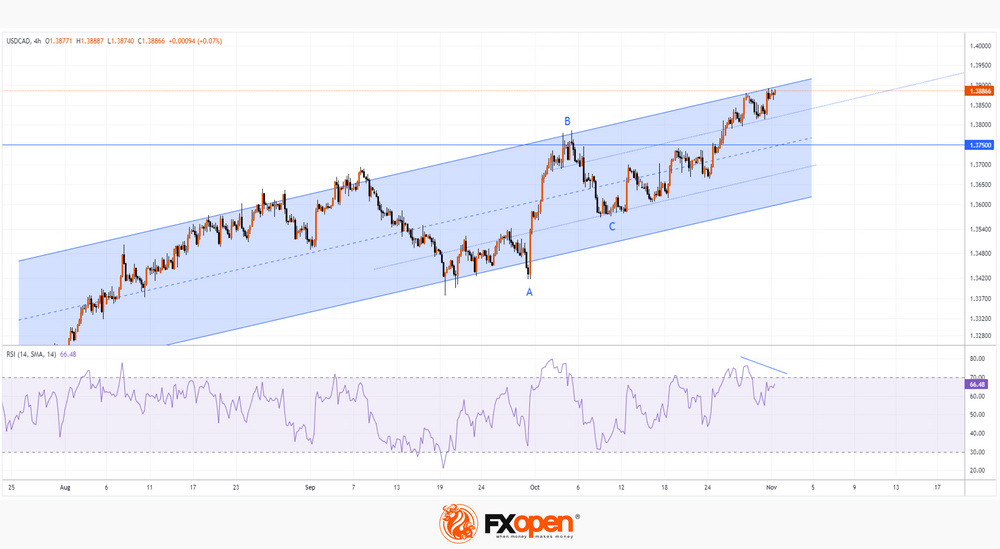
The chart shows that the USD/CAD rate is in an upward trend because:
→ exchange rate dynamics develop within the channel shown in blue — the strength of the USD relative to the CAD suggests that the US economy is in a stronger state than the Canadian one;
→ the magnitude of the B-C rollback is about 50% of the growth progress of A-B.
Since the USD/CAD price is near the upper boundary of the channel, this means that the market is vulnerable to a pullback. This probability is also indicated by potential price divergence with the RSI indicator.
If a rollback occurs, it may be shallow, for example, to the support zone formed by the median line of the blue channel and the level of 1.375, which previously served as an important resistance.
Be prepared for a spike in volatility tonight.
This article represents the opinion of the Companies operating under the FXOpen brand only. It is not to be construed as an offer, solicitation, or recommendation with respect to products and services provided by the Companies operating under the FXOpen brand, nor is it to be considered financial advice.
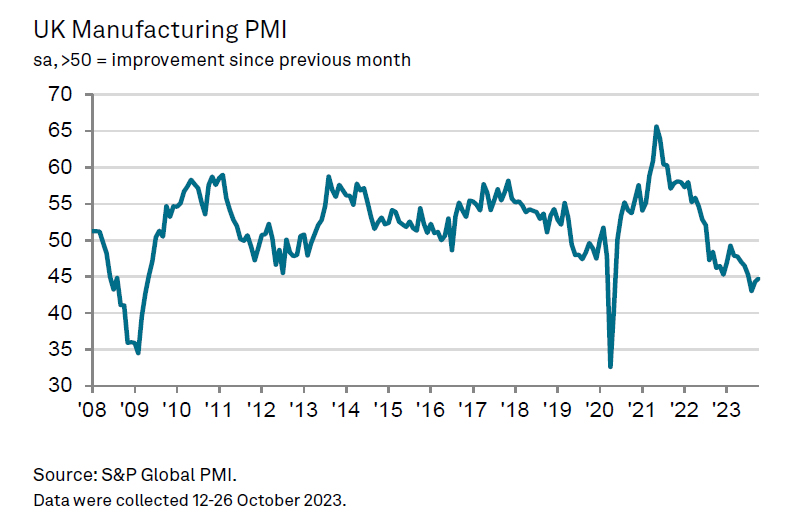
UK manufacturing downturn persists: PMI edges up but optimism plummets
UK PMI Manufacturing data was finalized at 44.8 in October, marking a modest improvement from September's 44.3. However, the report by S&P Global underscores some concerning aspects: declining output, a drop in new orders, and shrinking employment. Furthermore, business optimism has plunged to a ten-month low.
Rob Dobson, Director at S&P Global Market Intelligence, underscored the severity of the situation. "The UK manufacturing downturn persisted at the outset of the final quarter, exacerbating the economy's flirtation with recession," he said.
"The ongoing contraction in production for eight straight months, the longest since the 2008-09 period, is primarily due to subdued domestic and international demand, resulting in a continued downturn in new order intakes."
Dobson highlighted the skewed risks towards a negative outlook, with businesses' growing caution leading to employment cuts, reduced purchasing, and lower inventory levels.
Although there's a silver lining with a slight ease in input prices and output charges, Dobson warned that this faint inflation relief comes with an increased risk of recession, stemming from the prevailing weak demand.
NZDUSD Hovers Near 2023 Lows
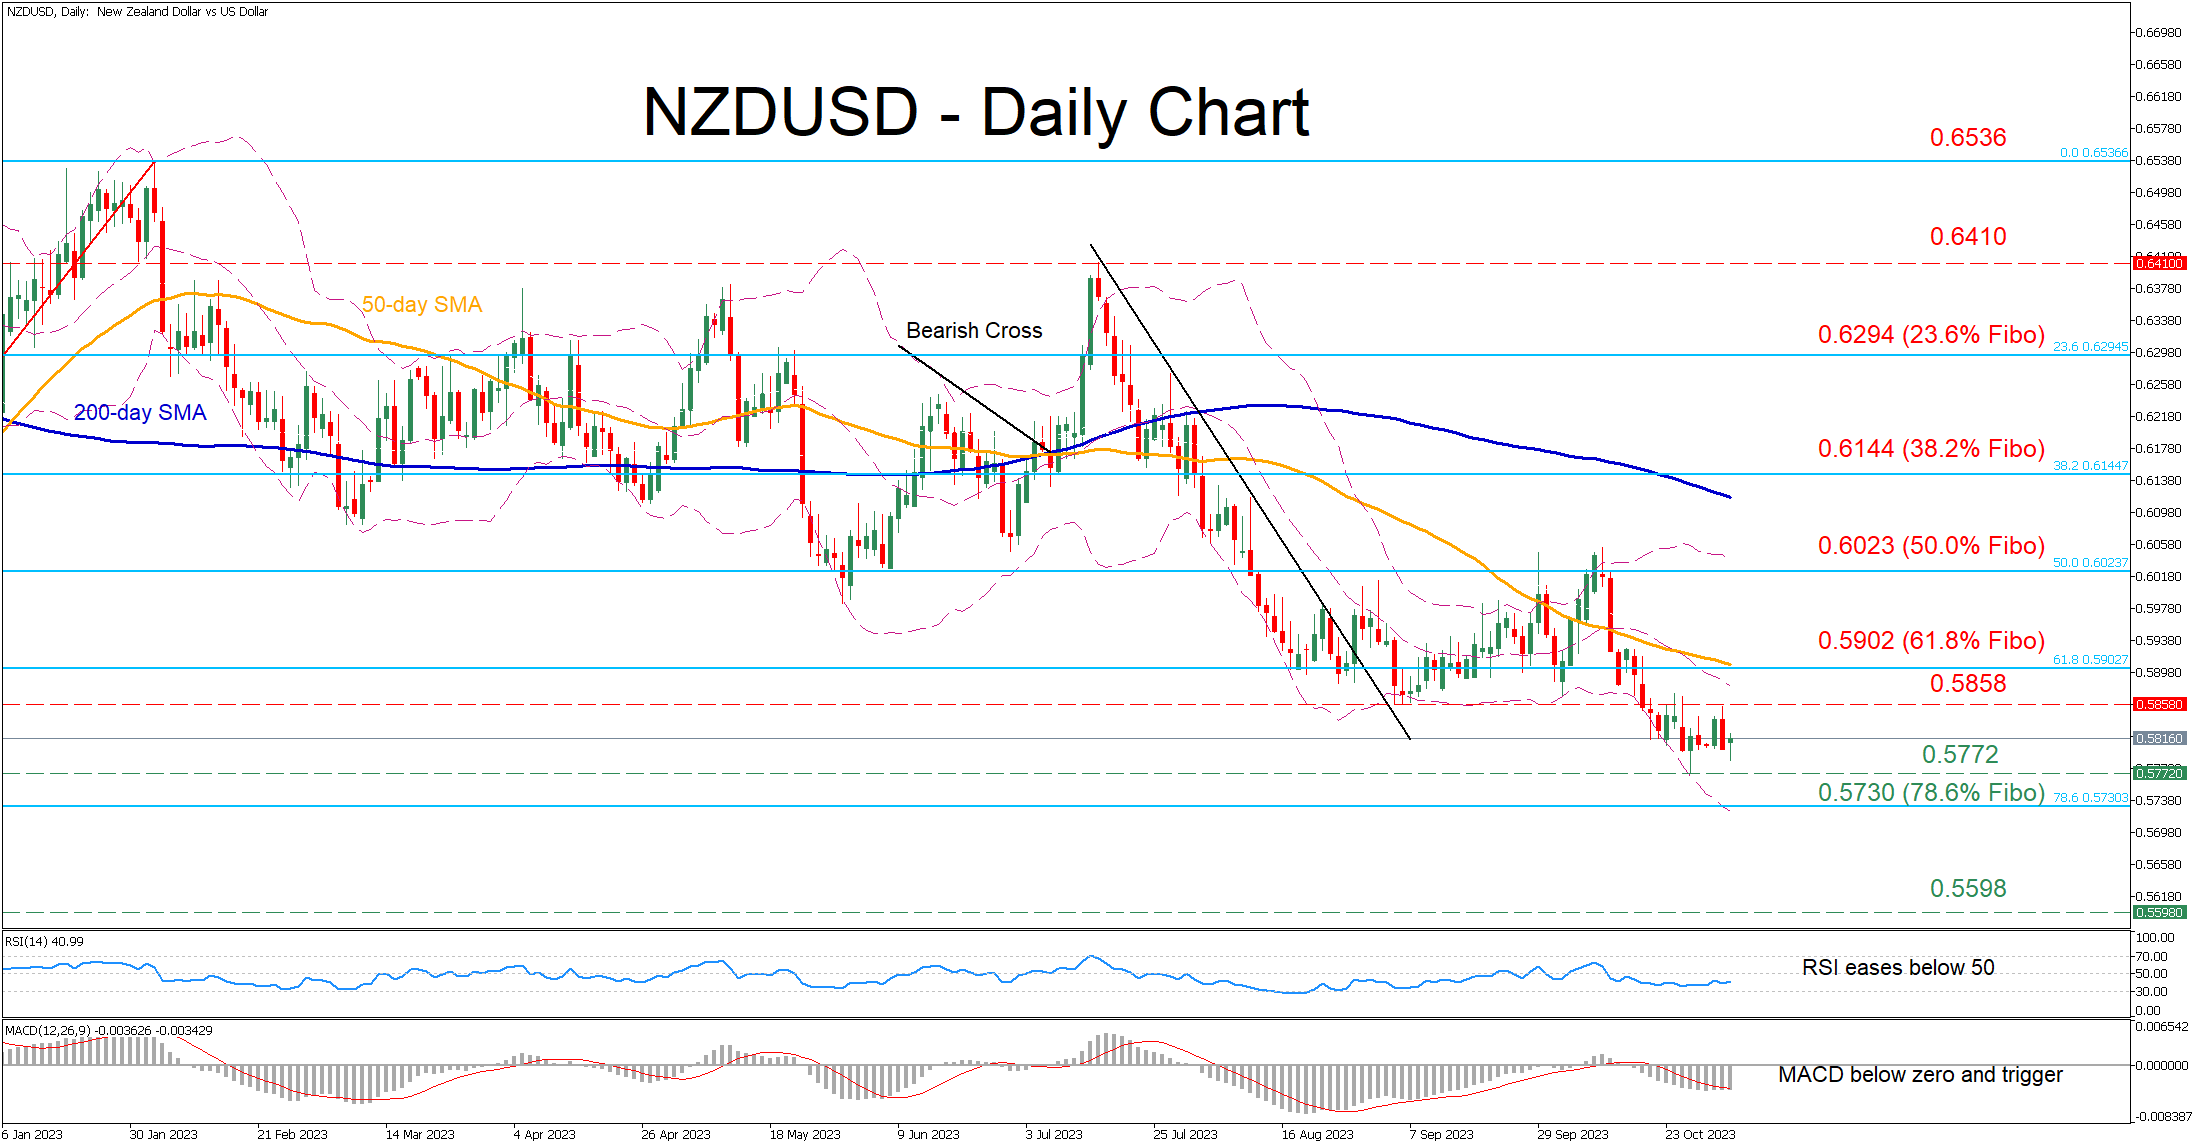
- NZDUSD halts latest decline at a fresh 1-year bottom of 0.5772
- Trades without a clear direction in the past week
- Momentum indicators remain tilted to the bearish side
NZDUSD has begun another round of weakness following the steep retreat from its October highs just a tad above the 61.8% Fibonacci retracement of the 0.5510-0.6535 upleg. Although the pair managed to find its feet at a fresh one-year low of 0.5772, the short-term oscillators are reflecting persistent downside risks.
Should the selling interest intensify further, initial support could be met at the 2023 low of 0.5772. Sliding beneath that floor, the pair may descend towards the 78.6% Fibo of 0.5730. A violation of that region could open the door for the September 2022 support of 0.5598.
On the flipside, if the bulls regain control, the price might challenge the September low of 0.5858, which also acted as resistance lately. Piercing through that wall, the pair could advance towards the 61.8% Fibo of 0.5902 before the 50.0% Fibo of 0.6023 appears on the radar. Even higher, the 38.2% Fibo of 0.6144 might curb further upside attempts.
Overall, despite pausing its steep downtrend, NZDUSD has been stuck in a sideways pattern, appearing unable to stage a recovery. Hence, traders should not rule out a fresh lower low as near-term risks remain skewed to the downside.
WTI Oil: Bears Pausing Above Pivotal Supports ahead of Key Economic Releases
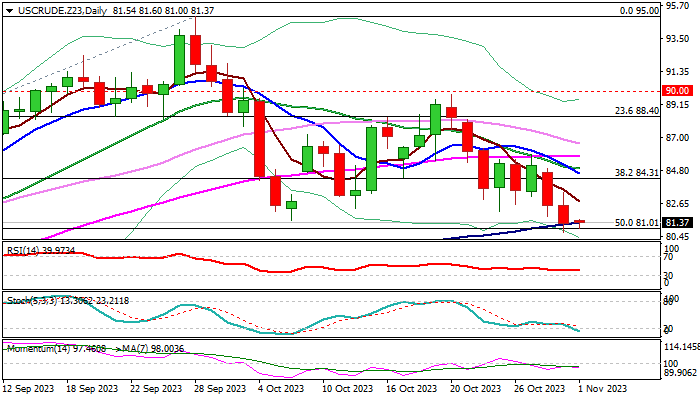
WTI oil is consolidating within a narrow range early Wednesday after almost 4% drop in past two days which cracked pivotal $81.00 support zone (100DMA (50% retracement of $67.02/$95.00 ascend.
Fresh bears faced increased headwinds in this zone, failing so far to register a clear break lower, as key factors that influence price movement are mixed.
Technical structure on daily chart is predominantly bearish (strong negative momentum / daily Tenkan-sen/Kijun-sen in bearish configuration / price holding below the base of daily cloud), while reversal pattern is developing on monthly chart after October’s close in red (the first bearish close after three-month rally and the biggest monthly loss since September 2022).
On the other hand, fundamentals continue to conflict, as record monthly oil output in the US adds pressure, along with unexpected contraction in China’s factory activity in Oct, while markets continue to closely watch developments in the Middle East.
Traders shift focus on a number of key economic data from the US today, with Oct Manufacturing PMI, reports from the labor sector (Oct ADP private sector employment and Sep JOLTS job openings) and EIA crude inventories report, to precede key event – Fed interest rate decision.
Fresh bears look for a weekly close below former higher low at $81.52 (Oct 6) to complete a failure swing pattern on daily chart and boost prospects for deeper fall.
Clear break of $81.01 (50% of $67.02/$95.00) to verify negative signal for attack at psychological $80 support and 200DMA ($78.10) in extension).
Near-term bias is expected to remain with bears while price action stays below daily cloud base ($83.98).
Res: 82.30; 82.78; 83.98; 84.31.
Sup: 81.01; 80.73; 80.00; 78.10.
USDJPY Bulls Test Japanese Authorities’ Resolve
- USDJPY edges lower after Tuesday’s sizeable rally
- Heightened risk of intervention as USDJPY is comfortably above 150
- Mixed momentum indicators complicate the outlook
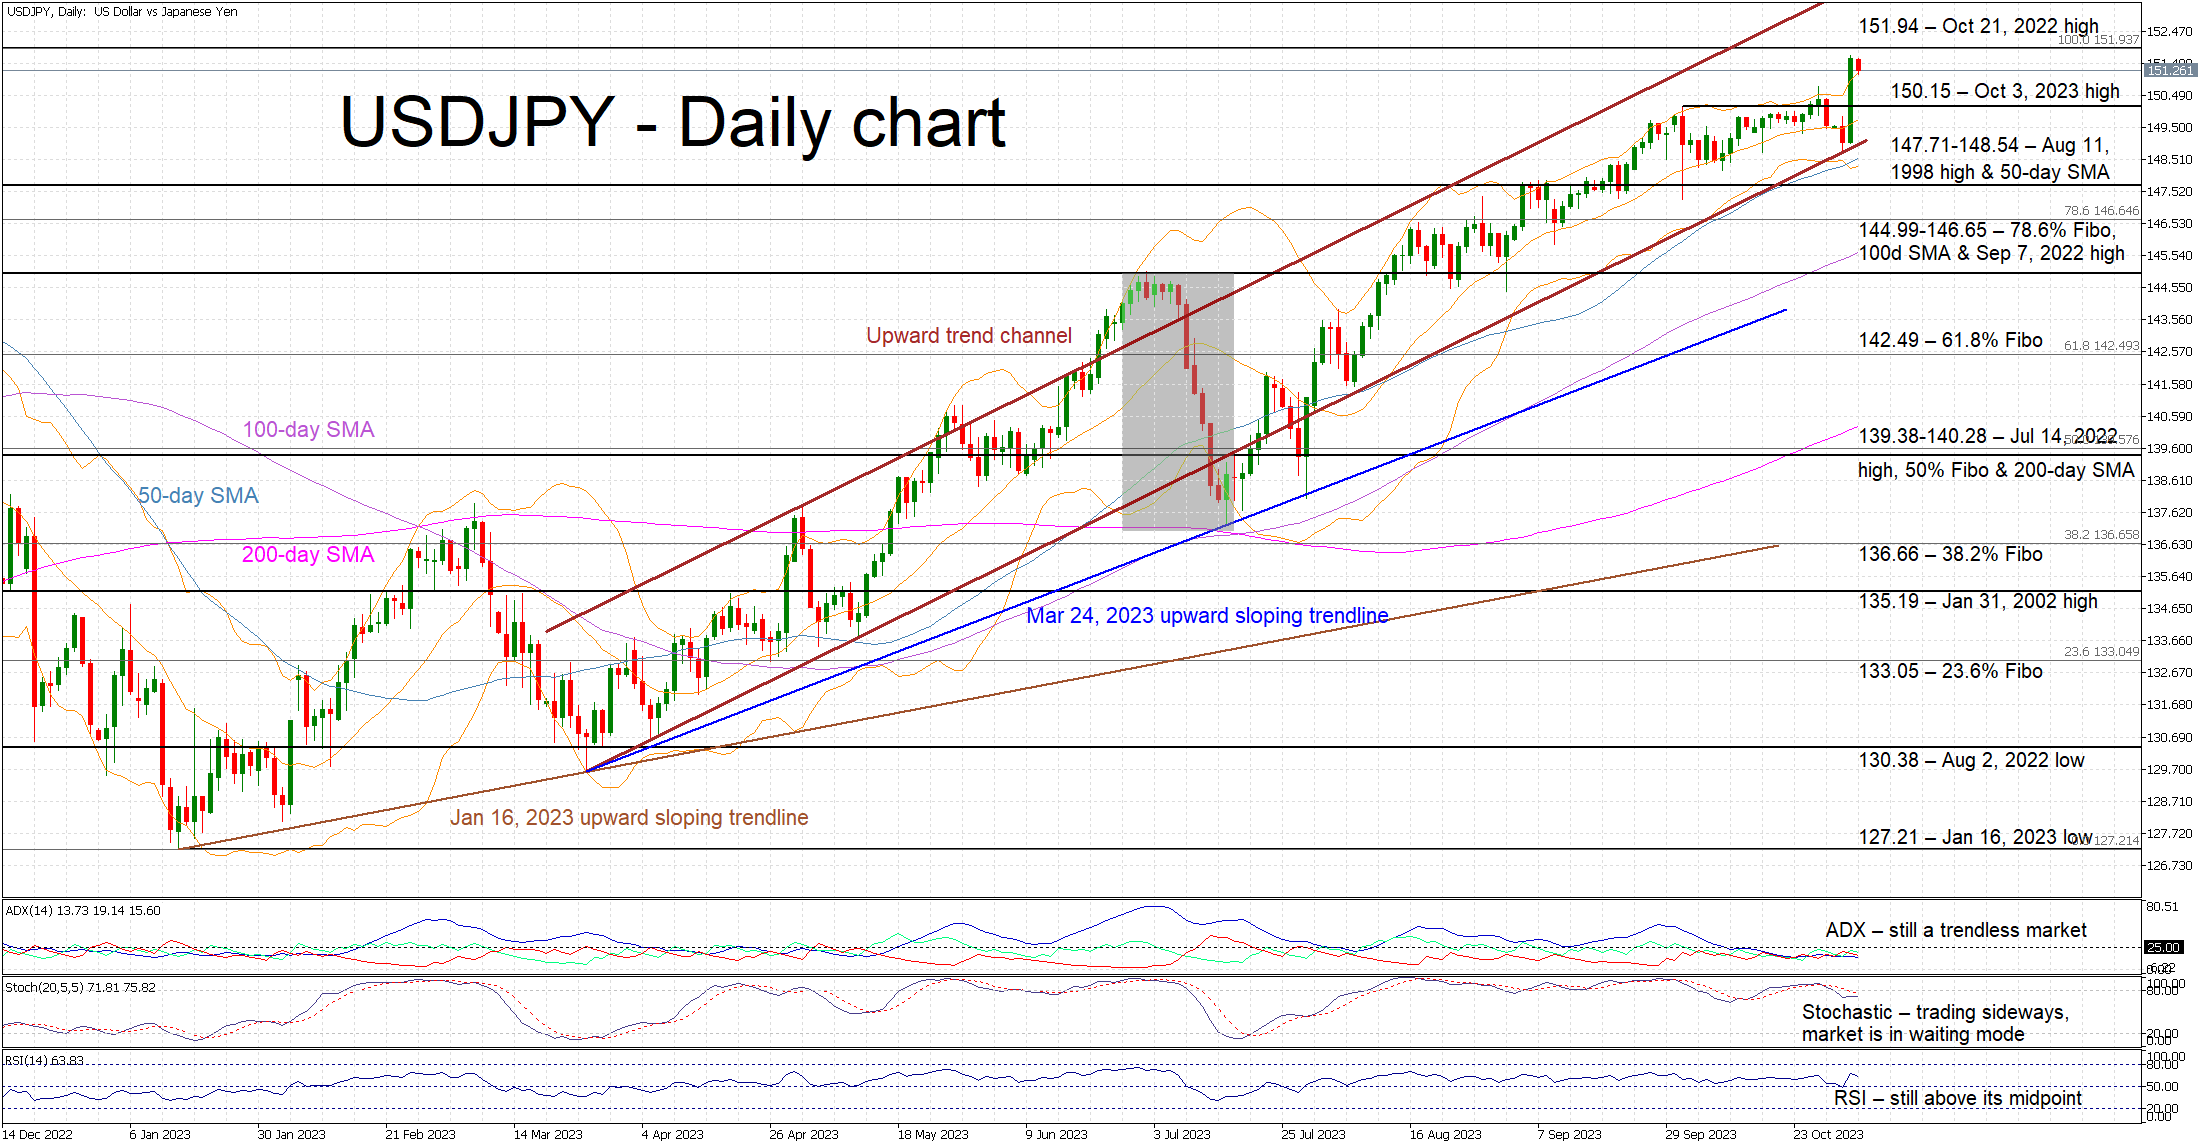
The lack of JPY-positive announcements at Tuesday’s BoJ meeting opened the door to a sizeable move in USDJPY. It bounced off the lower boundary of its medium-term upward trending channel and now trades comfortably above the 150 threshold. The pair is recording a red candle session today as the market is on the lookout for an actual intervention from the Japanese authorities.
In the meantime, the momentum indicators remain mixed. The Average Directional Movement Index (ADX) is stuck below its 25 threshold and thus pointing to a trendless market. On the flip side, the RSI has almost completed three months above its 50-midpoint, confirming the presence of a bullish tendency in the market.
Crucially, the stochastic oscillator continues to trade sideways, a tad below both its overbought territory and moving average, and thus revealing a degree of anticipation from market participants. Interestingly, the current higher high in USDJPY has not been met by a similar move in the stochastic oscillator; this raises the possibility of an overstretched upleg.
Should the bulls remain confident despite the intervention threat, they could try to keep USDJPY above the October 3 high at 150.15 and then gradually push it higher. They could then have the chance to record a new 2023 high and test the October 21, 2022 high at 151.94.
On the flip side, the bears appear somewhat relaxed as they anticipate an intervention from the Japanese officials. Until this takes place, they could try to push USDJPY below 150.15 level and then retest the busy 147.71-148.54 area, which is populated by the August 11, 1998 high and the 50-day simple moving average (SMA). Even lower, the 144.99-146.65 region could prove a stronger support area than currently anticipated.
To sum up, USDJPY bulls have made their move, pushing USDJPY comfortably above the 150 threshold, and are now preparing for the reaction from Japanese officials.
GBP/JPY Daily Outlook
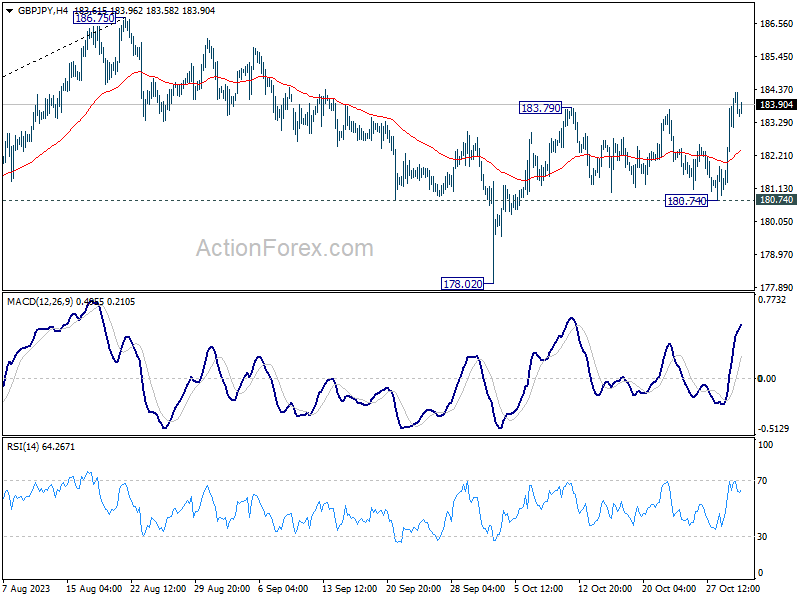
Daily Pivots: (S1) 182.30; (P) 183.31; (R1) 185.29; More...
GBP/JPY's rise from 178.02 resumed by breaking 183.79. Intraday bias is back on the upside for retesting 186.75 high. Decisive break there will resume larger up trend. For now, further rise is expected as long as 180.74 support holds, in case of retreat.
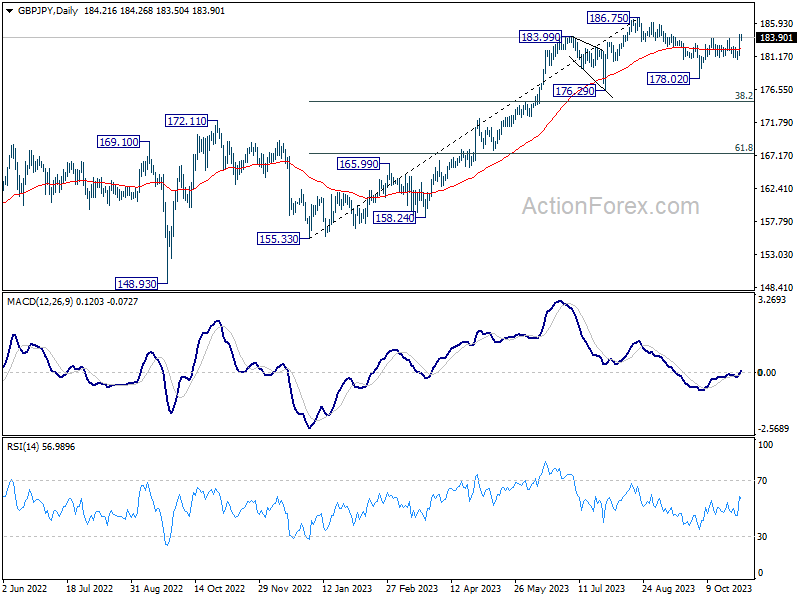
In the bigger picture, fall from 186.75 is seen as a corrective move only. As long as 176.29 support holds, larger up trend from 123.94 (202 low) should still be in progress. Break of 186.75 will target 195.86 (2015 high). Nevertheless, firm break of 176.29 will confirm medium term topping, and bring lengthier and deeper consolidations.
EUR/JPY Daily Outlook
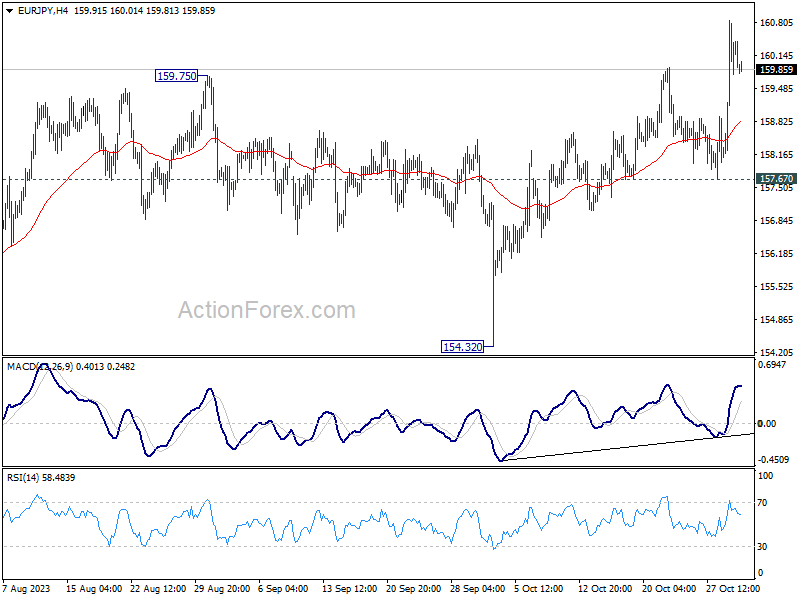
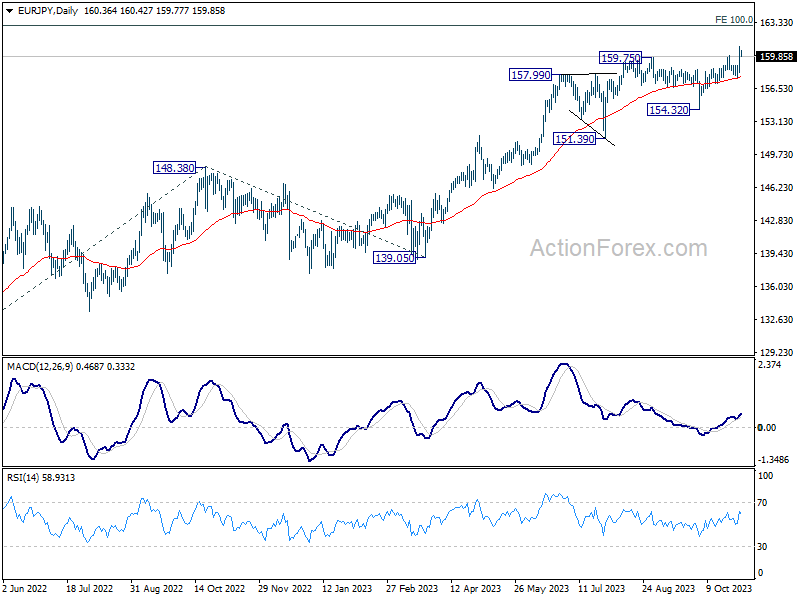
Daily Pivots: (S1) 158.78; (P) 159.81; (R1) 161.46; More....
Intraday bias in EUR/JPY remains on the upside at this point. Current rally should target 163.06 projection level next. On the downside, break of 157.67 support is needed to indicate short term topping. Otherwise, outlook will stay bullish in case of retreat.
In the bigger picture, rise from 114.42 (2020 low) is in progress. Next target is 100% projection of 124.37 to 148.38 from 139.05 at 163.06. On the downside, break of 154.32 support is needed to be the first sign of medium term topping. Otherwise, outlook will remain bullish even in case of deep pullback.
EUR/GBP Daily Outlook
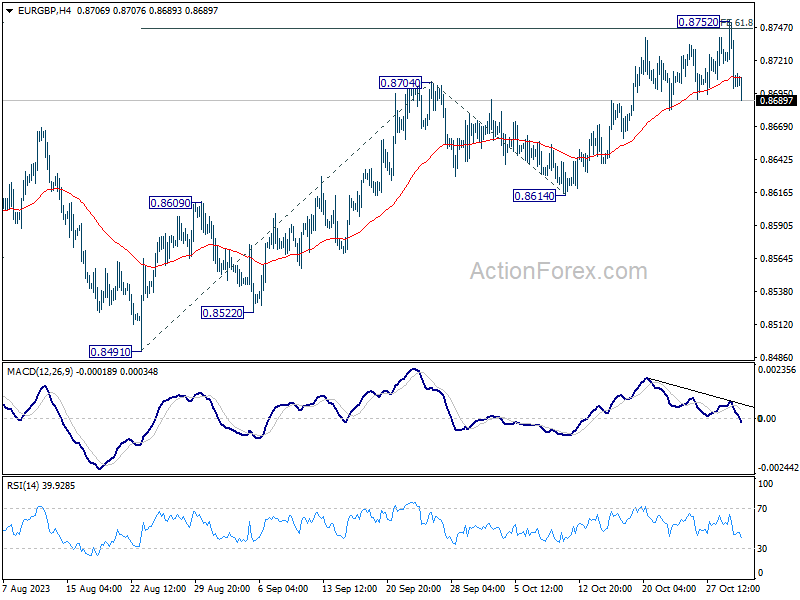
Daily Pivots: (S1) 0.8686; (P) 0.8720; (R1) 0.8739; More....
EUR/GBP retreated sharply after edging higher to 0.8752 and intraday bias stays neutral first. In case of deeper retreat, downside should be contained by 55 D EMA (now at 0.8652). Firm break of 0.8752 will resume the whole rise from 0.8491, and target 100% projection of 0.8491 to 0.8704 from 0.8614 at 0.8827 next. However, sustained break of 55 D EMA will argue that whole rebound from 0.8491 has completed, and bring deeper fall to 0.8614 support.
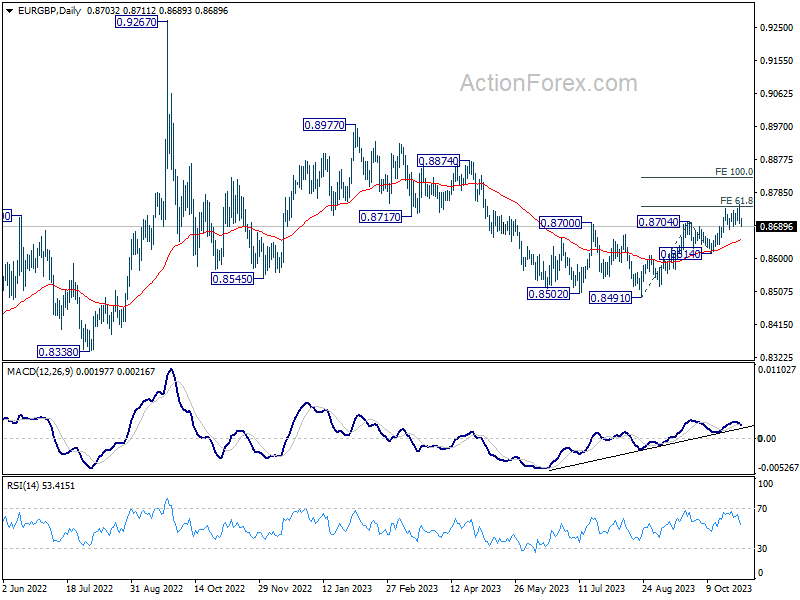
In the bigger picture, current development suggests that whole down trend from 0.9267 (2022 high) has completed with three down to to 0.8491. Rise from 0.8491 is seen as another leg inside that pattern from 0.9499 (2020 high). Further rally should be seen to 0.8977 resistance and above. This will now remain the favored case as long as 0.8614 support holds.
EUR/AUD Daily Outlook
Daily Pivots: (S1) 1.6633; (P) 1.6697; (R1) 1.6753; More...
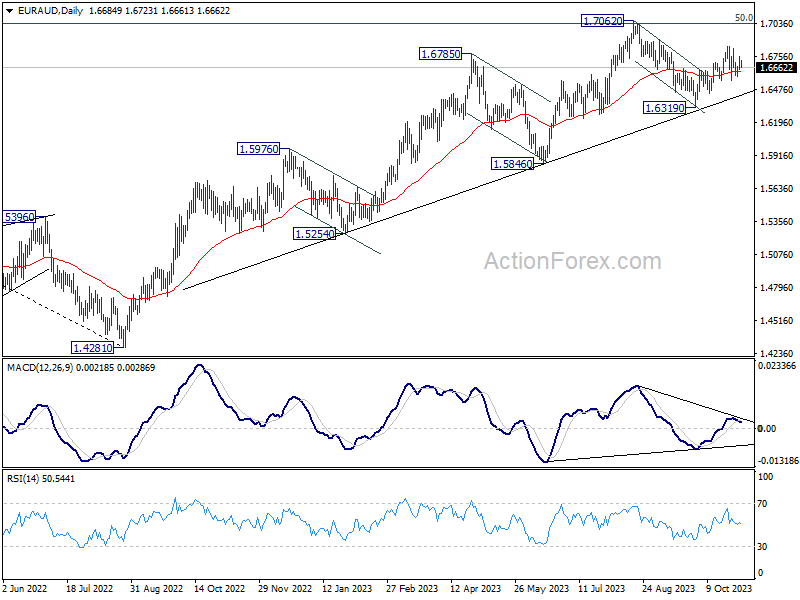
Intraday bias in EUR/AUD remains neutral as sideway trading continues. Further rally is expected as long as 1.6550 support holds. Above 1.6843 will target a test on 1.7062 high. Firm break there will resume larger up trend. However, break of 1.6550 support will bring deeper fall back to 1.6319 support instead.
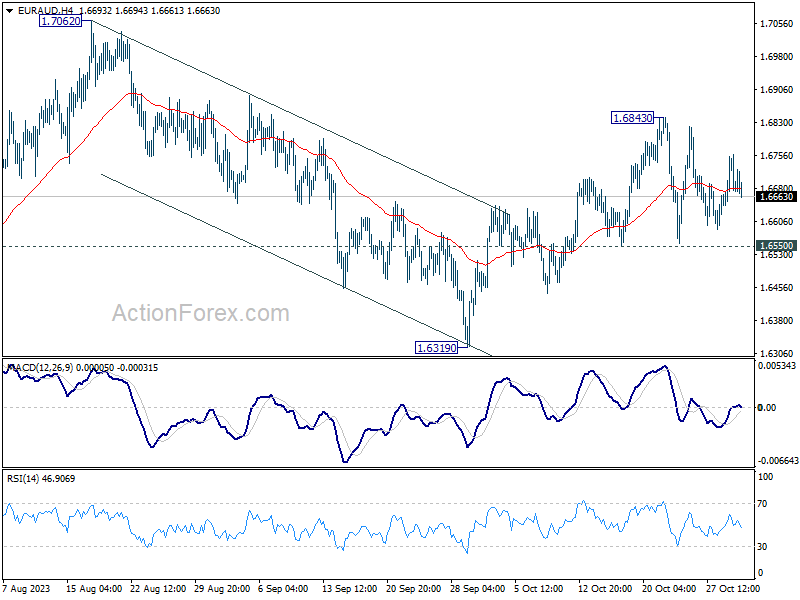
In the bigger picture, the strong support from medium term rising trend line indicates that rise from 1.4281 (2022 low) is still in progress. Sustained break of 1.7062 will pave the way to 61.8% retracement of 1.9799 (2020 high) to 1.4281 at 1.7691. In any case, outlook will stay bullish as long as 1.6319 support holds.