

Sample Category Title
USD/JPY Daily Outlook
Daily Pivots: (S1) 150.50; (P) 151.10; (R1) 151.54; More...
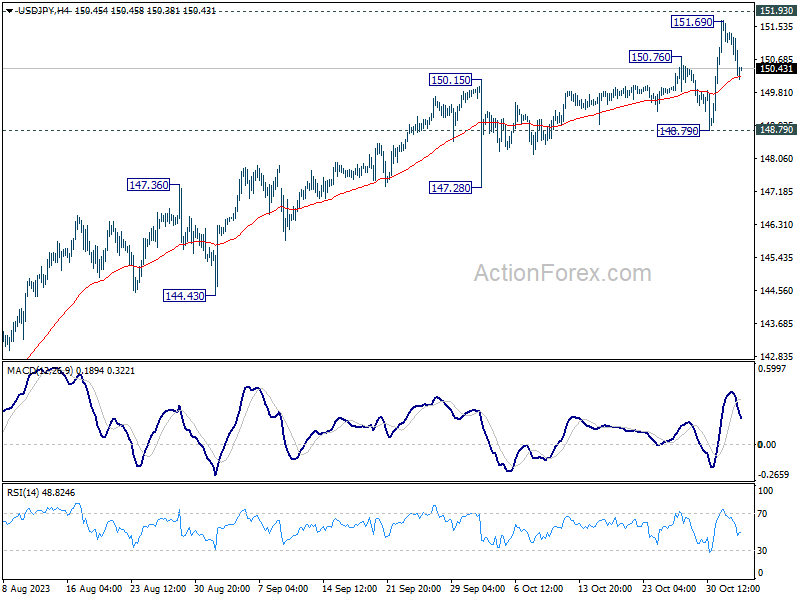
Intraday bias in USD/JPY is turned neutral first with current retreat. A temporary top was formed at 151.69, just ahead of 151.93 key resistance. Some consolidations would be seen first. For now, further rise remains in favor as long as 148.79 support holds. Decisive break of 151.93 will target 100% projection of 129.62 to 145.06 from 137.22 at 152.66. However, firm break of 148.79 will indicate rejection by 151.93, and bring deeper fall through 147.28 support.
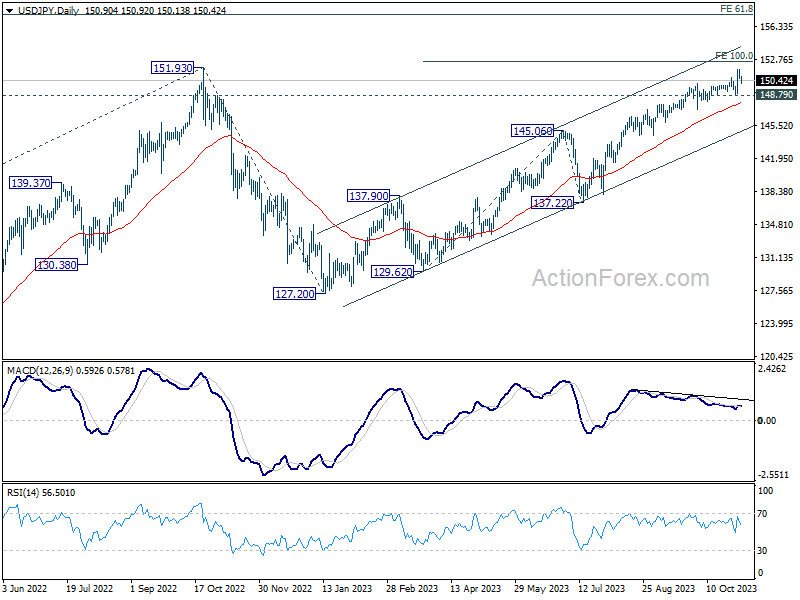
In the bigger picture, immediate focus is now on 151.93 resistance (2022 high). Rejection by 151.93, followed by sustained break of 145.06 resistance turned support will argue that rise from 127.20 has completed, and turn outlook bearish for 137.22 support and below. However, sustained break of 151.93 will confirm resumption of long term up trend. Next target will be 61.8% projection of 102.58 to 151.93 from 127.20 at 157.69.
Fed’s Aftermath Sees Stocks Ascend, Dollar and Yields Wane; Eyes on Sterling BoE Looms
Dollar experienced a pronounced dip as yields fell and stocks surged overnight, with the selling pressure continuing into Asian session. This comes even though Chair Jerome Powell left the door open for more tightening, after leaving interest rates unchanged. Contrastingly, market participants appear to be leaning even more towards the idea that Fed may have concluded its tightening cycle.
Despite this, Dollar hasn't faced a drastic downturn yet, as it maintains positions above near-term support levels against major counterparts. However, there's a pressing need for a boost. The greenback will look into the upcoming non-farm payroll data on Friday for reigniting upside momentum.
In the meantime, Sterling has emerged as one of the strongest currencies for the week, trailing behind Australian and New Zealand Dollars. As attention pivots to the Bank of England's imminent rate decision - where a status quo is anticipated - the intricacies of the meeting will be under scrutiny. This includes an analysis of the official statement, the vote breakdown, and the fresh quarterly projections. For the Pound to fortify its position against Euro and Swiss Franc, it would require a hawkish nudge from the BoE's deliberations.
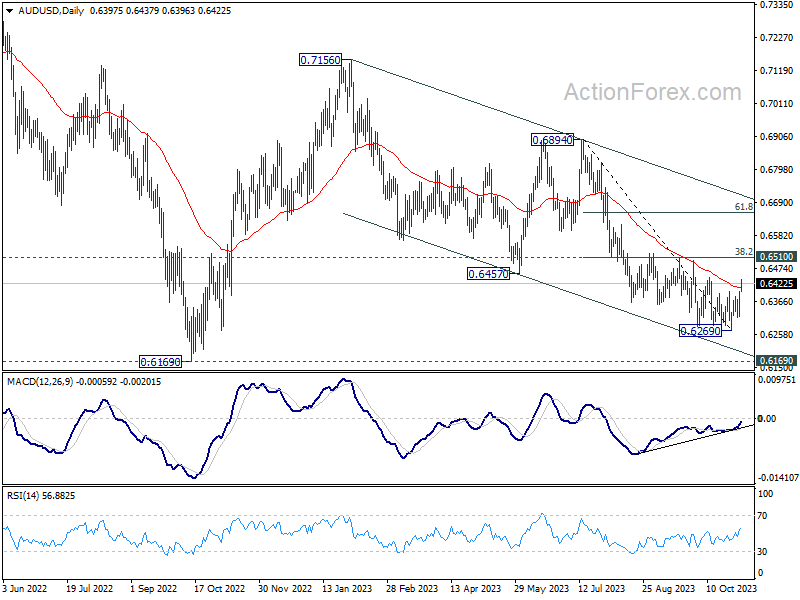
From a technical perspective, AUD/USD's break of 55 D EMA should confirm short term bottoming at 0.6269, on bullish convergence condition in D MACD. However, it's still early to confirm bullish trend reversal. Key hurdle lies in 0.6510 cluster resistance (38.2% retracement of 0.6894 to 0.6269 at 0.6508). Rejection by this resistance will maintain near term bearishness for another fall through 0.6269 at a later stage.
However, sustained break there will bolster the case that whole fall from 0.7156 has completed in a three wave structure. The fate could be decided by this week's US NFP and next week's RBA rate decision.
In Asia, Nikkei closed up 1.21%. Hong Kong HSI is up 0.91%. China Shanghai SSE is down -0.12%. Singapore Strait Times is up 0.14%. Japan 10-year JGB yield is down -0.0414 at 0.918. Overnight, DOW rose 0.67%. S&P 500 rose 1.05%. NASDAQ rose 1.64%. 10-year yield dropped -0.086 to 4.789.
DOW soars and yields tumble in wake of FOMC
US stock market experienced a robust rebound overnight, with DOW recording its most substantial three-day gain since April, following Fed's decision to maintain the interest rate at the widely anticipated range of 5.25-5.50%. This marks the second consecutive month of rate pause, but Fed has not ruled out the possibility of further tightening in the future.
Treasury yields witnessed a notable decline across the spectrum, a trend initially sparked by Treasury's refunding plan. 2-year yield ended the day staying below 5% mark, settling at 4.96%, while 10-year yield broke through 4.8% level. closing at 4.789%.
During the post-meeting press conference, Fed Chair Jerome Powell underscored the flexibility of the FOMC. He emphasized, "The idea that it would be difficult to raise [rates] again after stopping for a meeting or two is just not right. The Committee will always do what it thinks is appropriate at the time."
Further emphasizing the uncertainty of future meetings, Powell stated, "We have yet to finalize our decisions concerning the upcoming meetings." He elaborated on the Committee's objective to assess the need and degree of potential policy tightening, aiming to stabilize inflation at around 2% over a period.
Dismissing any speculations of rate cuts, Powell asserted that such discussions are currently off the table. The primary focus remains on evaluating if the present monetary policy is "sufficiently restrictive" to sustainably bring down inflation to 2% target.
Regarding the balance sheet runoff, Powell mentioned that there is no current consideration to alter its pace. The committee is not discussing or considering any changes in this aspect.
Additional readings on FOMC:
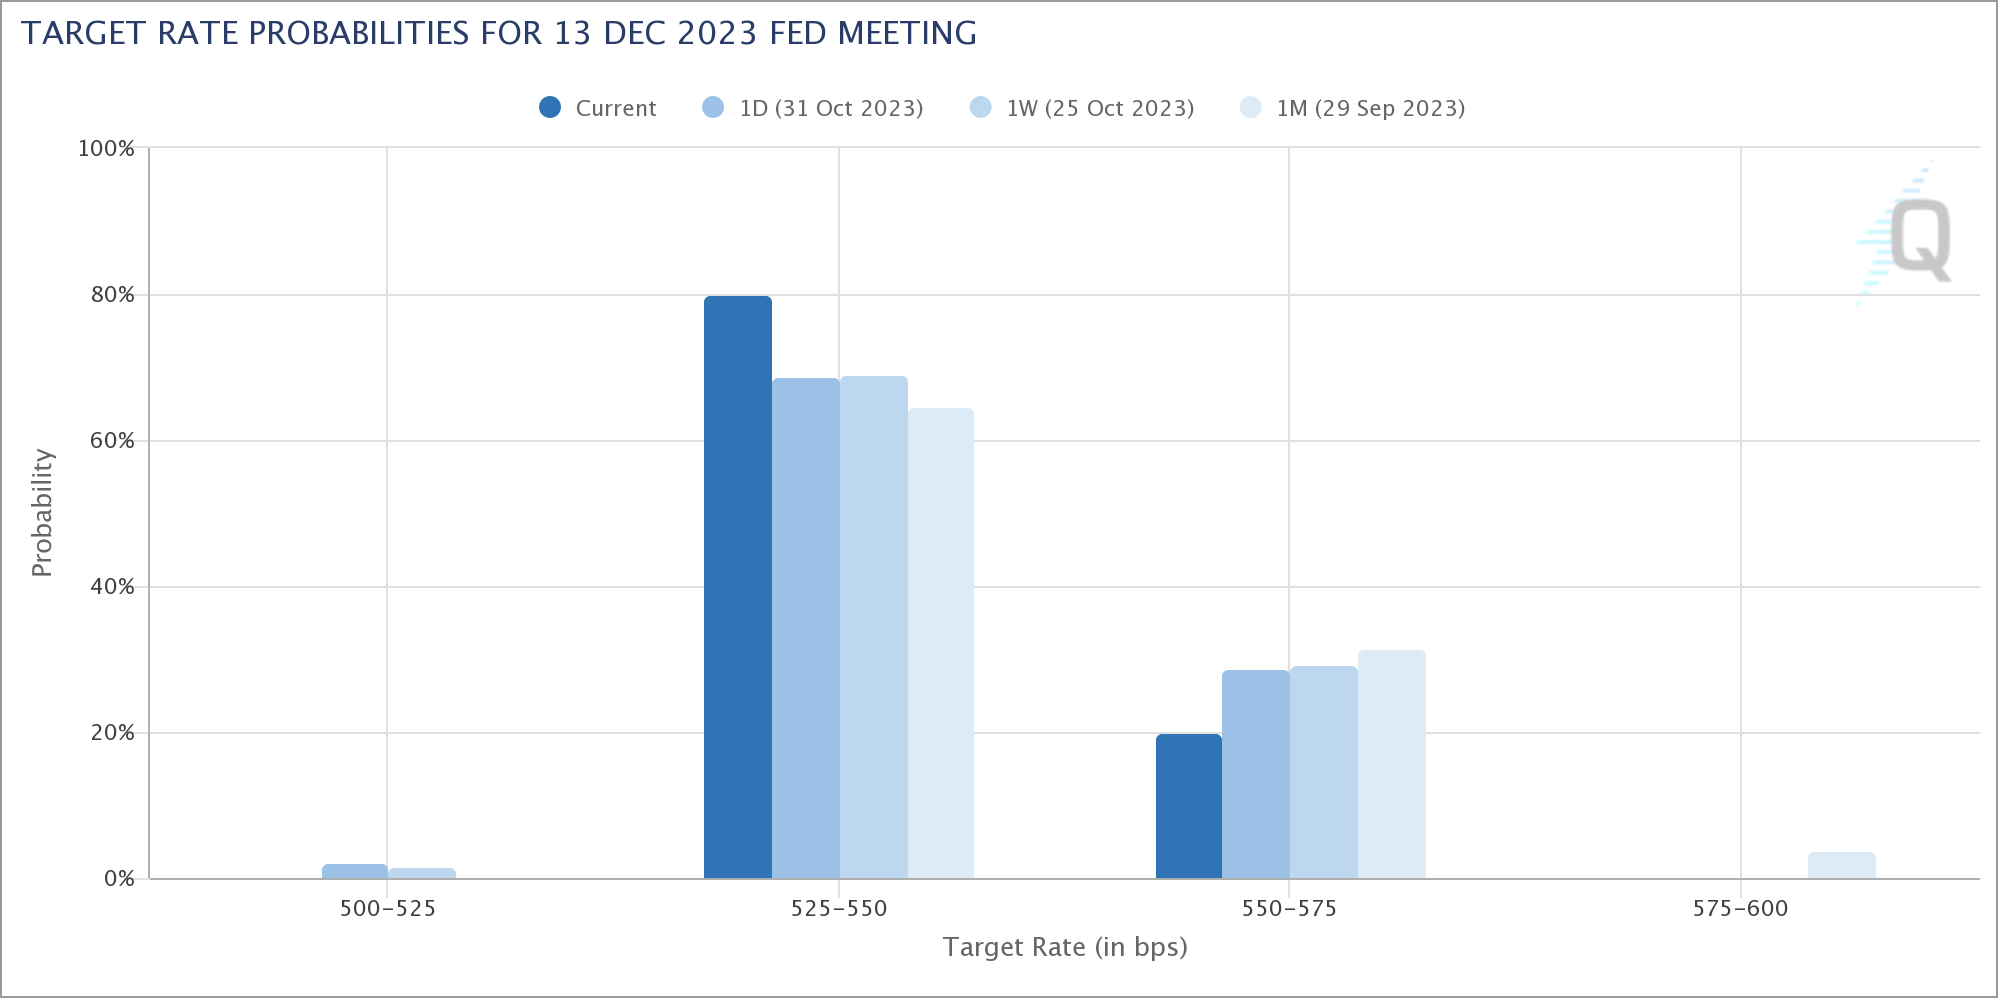
In response to these developments, Fed fund futures indicated a reduced probability of another rate hike in December, now standing at a 20% likelihood, down from the previous day's 29%.
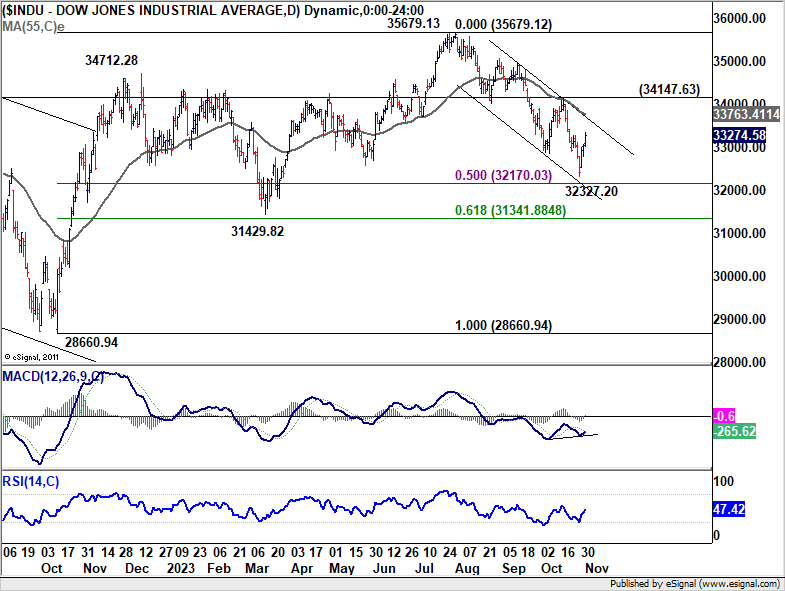
DOW's strong rebound this week suggests that a short-term bottom was established at 32327.20 already. Risk is now mildly on the upside for the near term, with possibility of further rally to 55 D EMA (now at 33764.41). If 33764.41 resistance level continues to hold its ground, it could indicate that DOW is merely in a short term consolidation phase, and the decline from 35679.12 might resume at a later stage.
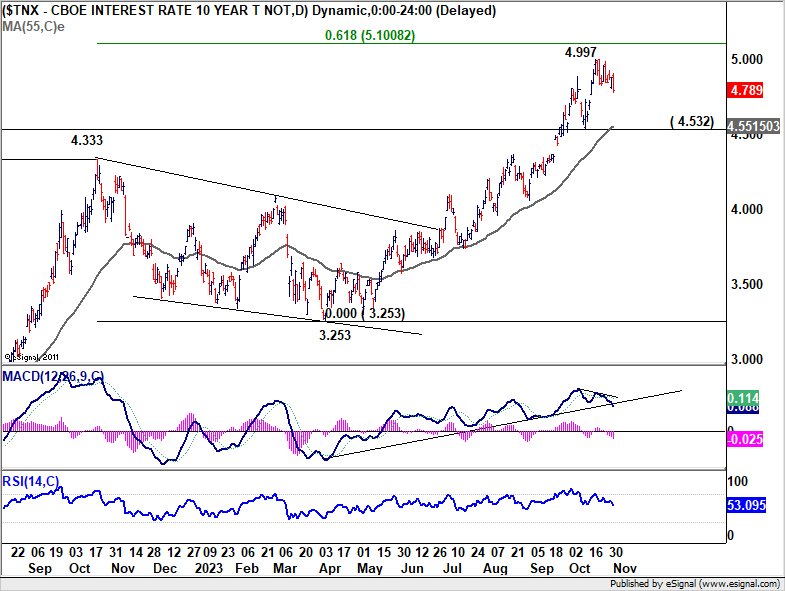
Shifting focus to 10-year yield, corrective pattern from 4.997 extended with yesterday's fall. Bearish divergence condition in D MACD argues that the consolidation would extend further for a while. . But there is no clear indication of bearish reversal with TNX holding well above 4.532 support as well as 55 D EMA (now at 4.551). Nevertheless, upside potential should be limited for the near term.
Australia's trade surplus narrows sharply to AUD 6.79B in Sep
Australia's economic outlook has taken a concerning turn as the trade surplus for September contracted significantly, recording its lowest monthly surplus since March 2021. The data released indicates a shrinkage from prior month's AUD 10.16B to AUD 6.79B, falling short of the anticipated AUD 9.58B surplus. This sharp decline in trade surplus is fueling concerns that the Australian economy may have slipped into recession in the third quarter.
The primary factor contributing to the reduced surplus is a noticeable -1.4% yoy drop in goods exports, which totaled AUD 45.62B. This decline was primarily driven by a substantial -39.2% reduction in the shipment of metals and non-monetary gold, a critical export commodity for the Australian economy.
On the import side, there was a 7.5% yoy increase to AUD 38.84B. This surge in imports is attributed to a 23.3% jump in import of capital goods. Additionally, there was a noticeable spike in the demand for recreational items.
BoE likely to hold to for the second straight meeting
BoE stands at a critical juncture as it is expected to maintain its policy interest rate at 5.25% today, marking the second consecutive pause in tightening. This decision comes in the wake of September's UK CPI remaining steady at 6.7%, defying market expectations and signaling a halt in the disinflation process. Conversely, the prevailing weak growth data underscore increasing risks of recession, placing the BoE in a challenging policy dilemma.
Today's meeting is set to highlight the existing divides within the nine-member MPC. September's decision, which resulted in no change, saw a tight vote, with 5 members in favour and 4 against. Given the nuanced economic picture, a shift in this balance, although unexpected, is still within the realm of possibility.
The central bank will also unveil its new economic forecasts. Given the recent string of subdued data, BoE is anticipated to downgrade its short-term projections for growth. Yet, looking further out, the bank might elevate its growth expectations for the two- and three-year marks, influenced by factors such as lower interest rates and a depreciated sterling.
One of the prevailing discussions in financial circles revolves around which major central bank will be the first to reduce interest rates. As it stands, market consensus suggests that BoE may trail its counterparts, ECB and Fed. Current projections don't anticipate a rate cut by BoE with over a 50% likelihood until August 2024. However, should BoE's upcoming forecasts reflect a significant downward adjustment in inflation outlook, this timeline and market sentiment could be poised for a change.
Some suggested readings on BoE:
- Bank of England's November Interest Rate Decision and Its Potential Impact on the Pound
- Doves Firmly in Control of BoE Meeting
- Bank of England Preview – Soft Data Warrants BoE to Stay On Hold
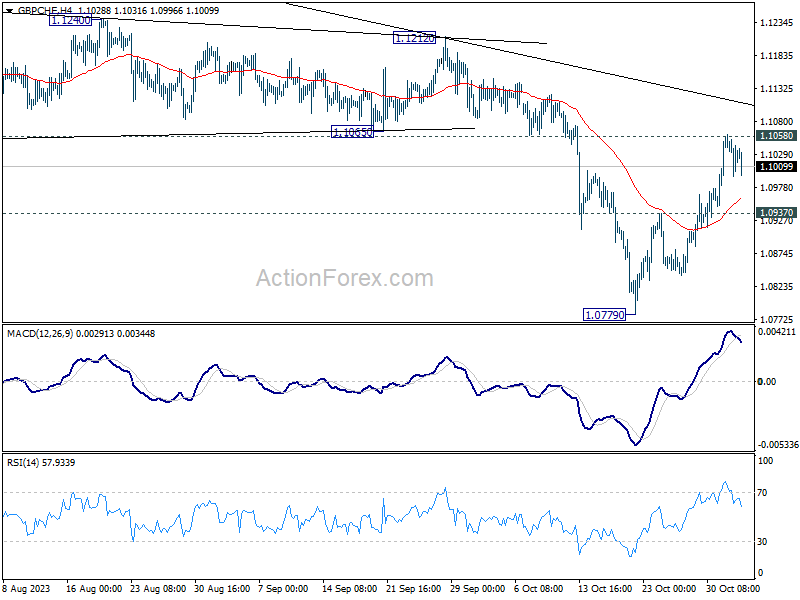
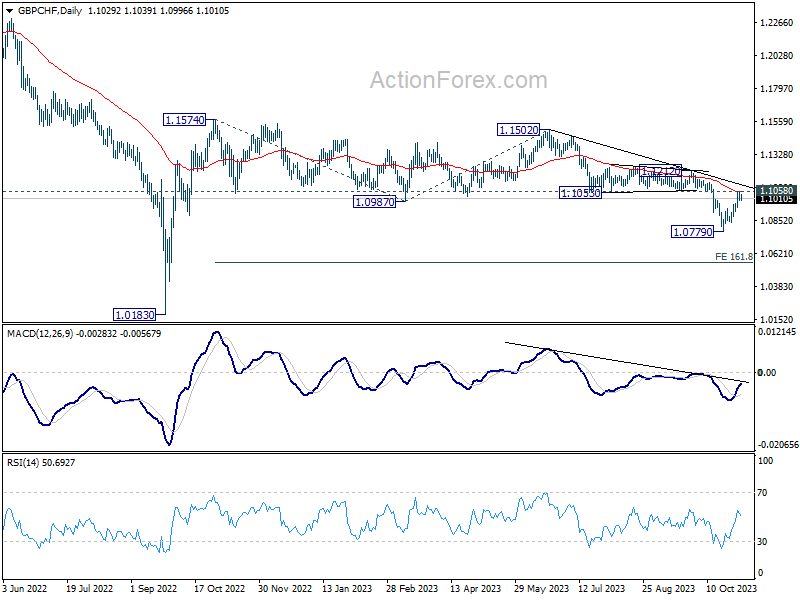
While GBP/CHF's rebound in the last two week has been strong, it's capped by 1.1053 support turned resistance, as well as 55 D EMA. Risk stays on the downside for larger decline from 1.1502 to continue. Break of 1.0937 minor support will retain near term bearishness, and bring retest of 1.0779 first. However, sustained break of 1.1058 will raise the chance of bullish reversal, and target 1.1212 structural resistance for confirmation.
Elsewhere
Swiss CPI, Germany unemployment and Eurozone PMI manufacturing final will be released in European session. Later in the day, US will release jobless claims and non-farm productivity.
USD/JPY Daily Outlook
Daily Pivots: (S1) 150.50; (P) 151.10; (R1) 151.54; More...
Intraday bias in USD/JPY is turned neutral first with current retreat. A temporary top was formed at 151.69, just ahead of 151.93 key resistance. Some consolidations would be seen first. For now, further rise remains in favor as long as 148.79 support holds. Decisive break of 151.93 will target 100% projection of 129.62 to 145.06 from 137.22 at 152.66. However, firm break of 148.79 will indicate rejection by 151.93, and bring deeper fall through 147.28 support.
In the bigger picture, immediate focus is now on 151.93 resistance (2022 high). Rejection by 151.93, followed by sustained break of 145.06 resistance turned support will argue that rise from 127.20 has completed, and turn outlook bearish for 137.22 support and below. However, sustained break of 151.93 will confirm resumption of long term up trend. Next target will be 61.8% projection of 102.58 to 151.93 from 127.20 at 157.69.
Economic Indicators Update
| GMT | Ccy | Events | Actual | Forecast | Previous | Revised |
|---|---|---|---|---|---|---|
| 23:50 | JPY | Monetary Base Y/Y Oct | 9.00% | 5.90% | 5.60% | |
| 00:30 | AUD | Goods Trade Balance (AUD) Sep | 6.79B | 9.58B | 9.64B | 10.16B |
| 07:30 | CHF | CPI M/M Oct | 0.10% | -0.10% | ||
| 07:30 | CHF | CPI Y/Y Oct | 1.70% | 1.70% | ||
| 08:45 | EUR | Italy Manufacturing PMI Oct | 46.5 | 46.8 | ||
| 08:50 | EUR | France Manufacturing PMI Oct F | 42.6 | 42.6 | ||
| 08:55 | EUR | Germany Manufacturing PMI Oct F | 40.7 | 40.7 | ||
| 08:55 | EUR | Germany Unemployment Change Oct | 15K | 10K | ||
| 08:55 | EUR | Germany Unemployment Rate Oct | 5.80% | 5.70% | ||
| 09:00 | EUR | Eurozone Manufacturing PMI Oct F | 43 | 43 | ||
| 11:30 | USD | Challenger Job Cuts Y/Y Oct | 58.20% | |||
| 12:00 | GBP | BoE Interest Rate Decision | 5.25% | 5.25% | ||
| 12:00 | GBP | MPC Official Bank Rate Votes | 2--0--7 | 4--0--5 | ||
| 12:30 | USD | Initial Jobless Claims (Oct 27) | 210K | 210K | ||
| 12:30 | USD | Nonfarm Productivity Q3 P | 4.00% | 3.50% | ||
| 12:30 | USD | Unit Labor Costs Q3 P | 1.10% | 2.20% | ||
| 14:30 | USD | Natural Gas Storage | 81B | 74B |
BoE likely to hold to for the second straight meeting
BoE stands at a critical juncture as it is expected to maintain its policy interest rate at 5.25% today, marking the second consecutive pause in tightening. This decision comes in the wake of September's UK CPI remaining steady at 6.7%, defying market expectations and signaling a halt in the disinflation process. Conversely, the prevailing weak growth data underscore increasing risks of recession, placing the BoE in a challenging policy dilemma.
Today's meeting is set to highlight the existing divides within the nine-member MPC. September's decision, which resulted in no change, saw a tight vote, with 5 members in favour and 4 against. Given the nuanced economic picture, a shift in this balance, although unexpected, is still within the realm of possibility.
The central bank will also unveil its new economic forecasts. Given the recent string of subdued data, BoE is anticipated to downgrade its short-term projections for growth. Yet, looking further out, the bank might elevate its growth expectations for the two- and three-year marks, influenced by factors such as lower interest rates and a depreciated sterling.
One of the prevailing discussions in financial circles revolves around which major central bank will be the first to reduce interest rates. As it stands, market consensus suggests that BoE may trail its counterparts, ECB and Fed. Current projections don't anticipate a rate cut by BoE with over a 50% likelihood until August 2024. However, should BoE's upcoming forecasts reflect a significant downward adjustment in inflation outlook, this timeline and market sentiment could be poised for a change.
Some suggested readings on BoE:
- Bank of England's November Interest Rate Decision and Its Potential Impact on the Pound
- Doves Firmly in Control of BoE Meeting
- Bank of England Preview – Soft Data Warrants BoE to Stay On Hold
While GBP/CHF's rebound in the last two week has been strong, it's capped by 1.1053 support turned resistance, as well as 55 D EMA. Risk stays on the downside for larger decline from 1.1502 to continue. Break of 1.0937 minor support will retain near term bearishness, and bring retest of 1.0779 first. However, sustained break of 1.1058 will raise the chance of bullish reversal, and target 1.1212 structural resistance for confirmation.
Technical Outlook and Review
DXY:
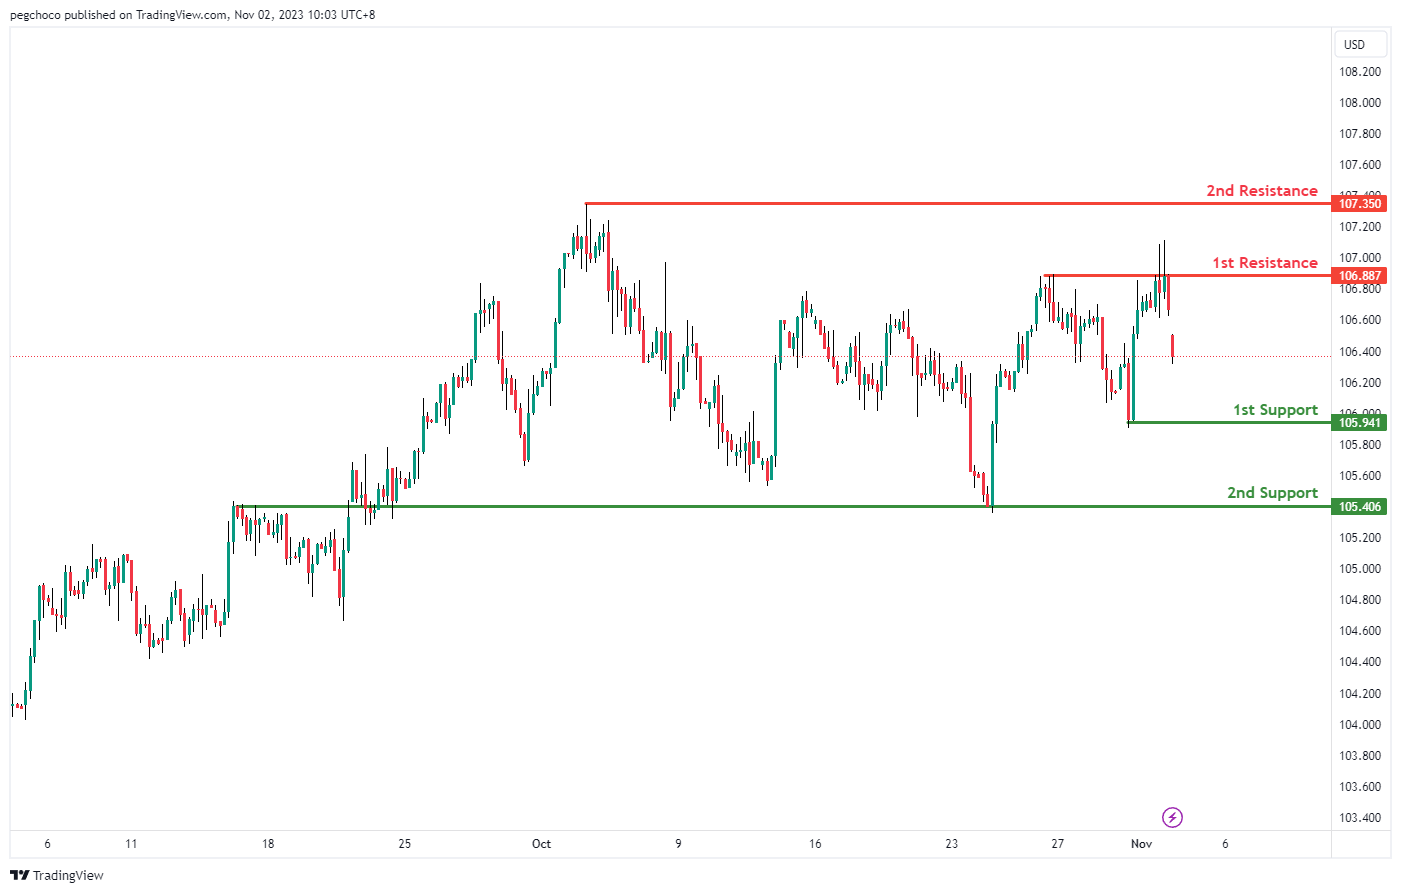
The XAU/USD (Gold/US Dollar) chart currently exhibits a bearish overall momentum. However, there’s a potential short-term bullish scenario in which the price could bounce off the 1st support at 1977.14, which is identified as an overlap support. This bounce may lead the price towards the 1st resistance at 1992.30, characterized as a pullback resistance.
After reaching the 1st resistance, there’s a possibility of a reversal to the downside, seeking support. The 2nd support at 1953.53 is also considered significant, as it aligns with an overlap support, reinforcing its potential as a support level. The 2nd resistance at 2007.97 is another significant level, noted as an overlap resistance, where the price may face resistance.
EUR/USD:
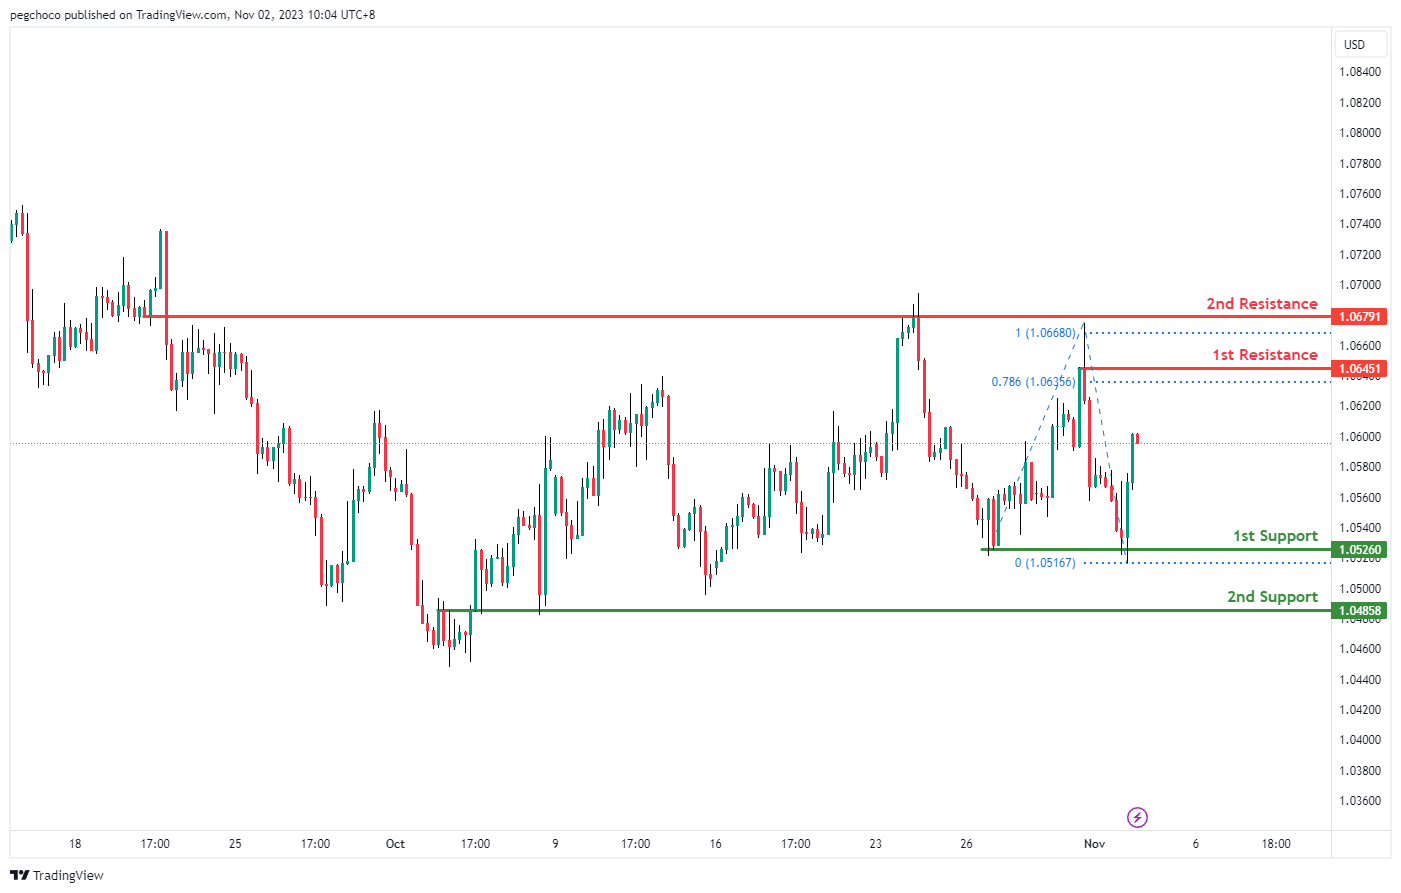
The EUR/USD chart currently demonstrates a bullish overall momentum, suggesting the potential for a bullish continuation towards the 1st resistance.
1st support at 1.0526 is considered significant as it aligns with a swing low support level, indicating its potential to act as strong support. Additionally, the 2nd support at 1.0485 is identified as an overlap support, reinforcing the potential support zone.
On the resistance side, the 1st resistance at 1.0645 is characterized as a swing high resistance, implying that it could pose a significant obstacle to any notable upward price movement in the bullish direction. Furthermore, the 2nd resistance at 1.0679 is identified as a swing high resistance and is marked by a 100% Fibonacci Projection, indicating another potential level where the price may face resistance.
EUR/JPY:
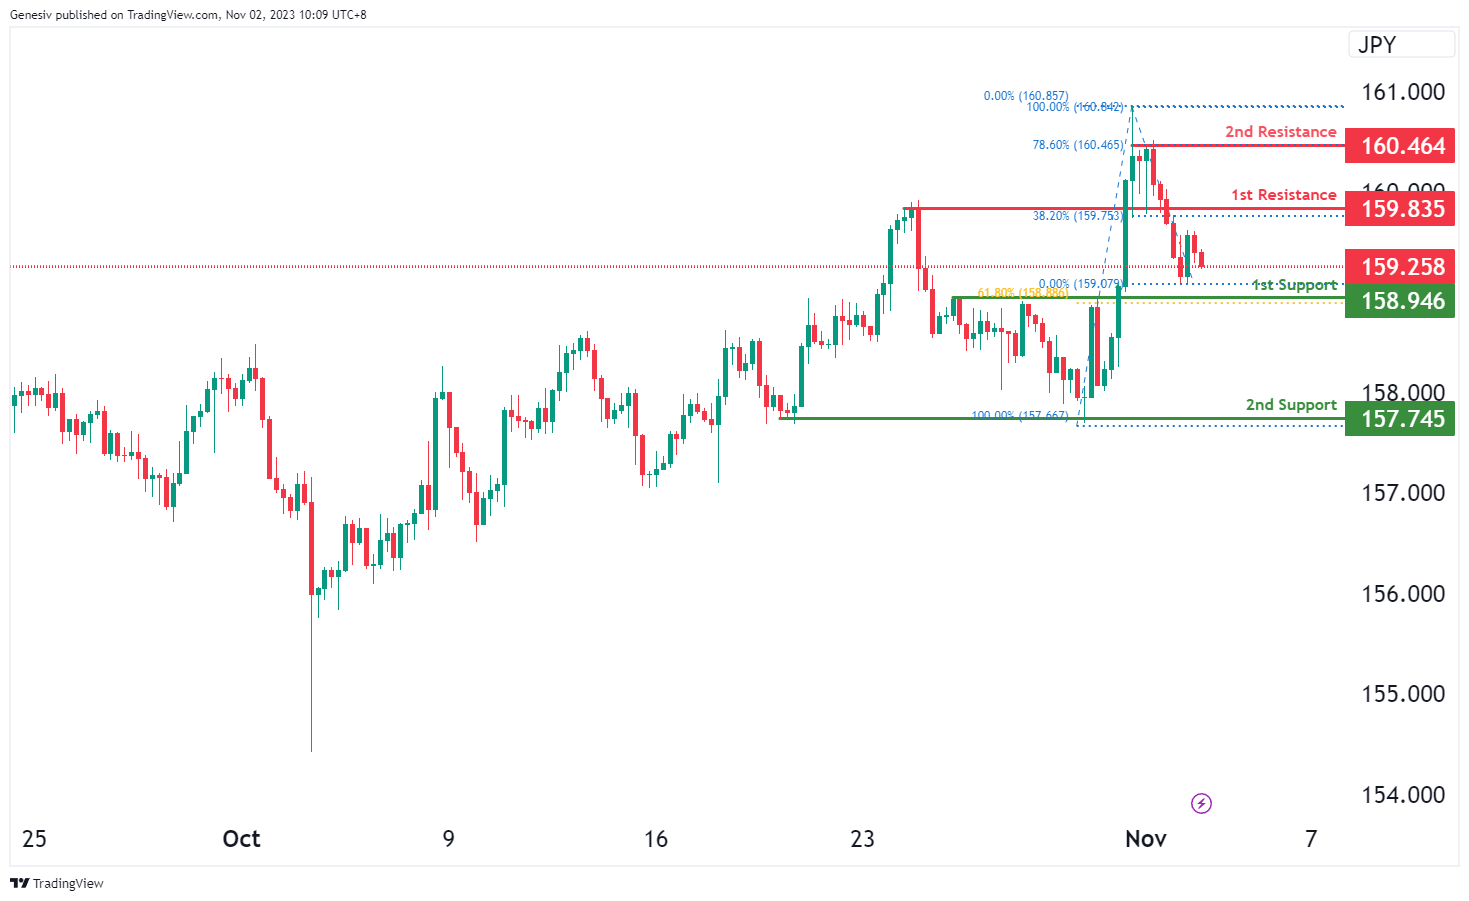
The EUR/JPY chart currently shows a bearish momentum, suggesting a potential scenario for a bearish continuation towards the first support at 158.94. The first support level at 158.94 is identified as a pullback support, coinciding with the 61.80% Fibonacci Retracement level, indicating a significant potential support level for the price decline.
The second support at 157.74 aligns with multi-swing low support, serving as an additional level that could potentially provide support in the bearish direction.
Regarding resistance levels, the first resistance at 159.83 represents pullback resistance and coincides with the 38.20% Fibonacci Retracement. The second resistance at 160.46 is associated with swing high resistance, corresponding to the 78.60% Fibonacci Retracement level, potentially acting as a substantial barrier to the price’s upward movement within the current bearish trend.
EUR/GBP:
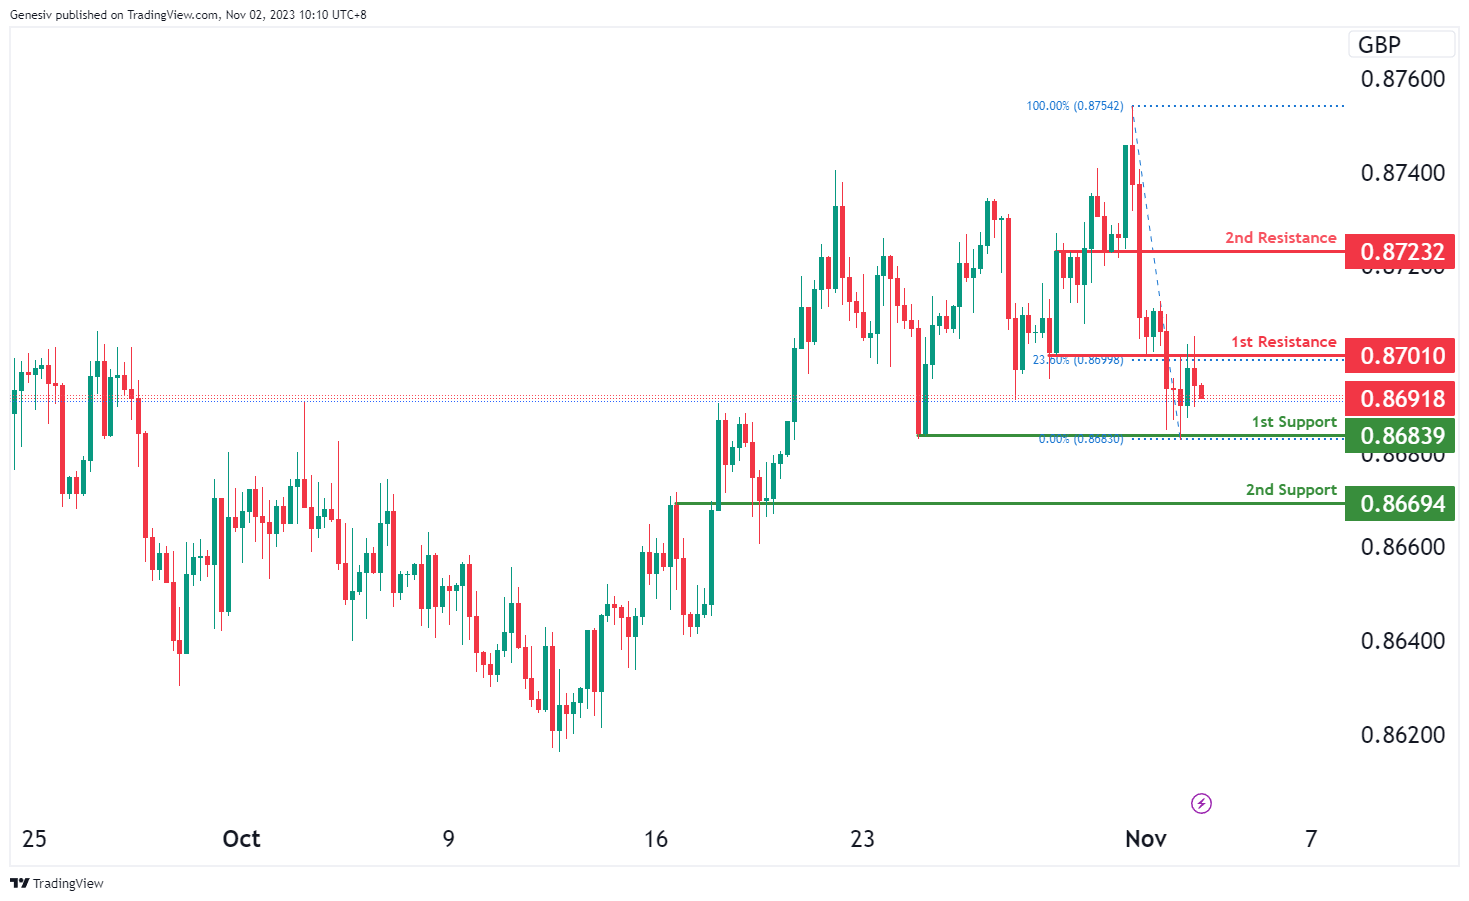
The EUR/GBP chart currently displays a bearish momentum, indicating a potential scenario for a bearish continuation towards the first support at 0.8683. This level is regarded as a multi-swing low support, suggesting it could serve as a significant level of potential support for the declining price movement.
The second support at 0.8669 is identified as an overlap support, providing an additional level of potential support during the bearish trend.
On the resistance side, the first resistance at 0.8701 represents an overlap resistance, coinciding with the 23.60% Fibonacci Retracement level, potentially acting as a significant barrier to the price’s downward movement. The second resistance at 0.8723 is characterized as pullback resistance, indicating another level that could impede the price from moving upward within the current bearish trend.
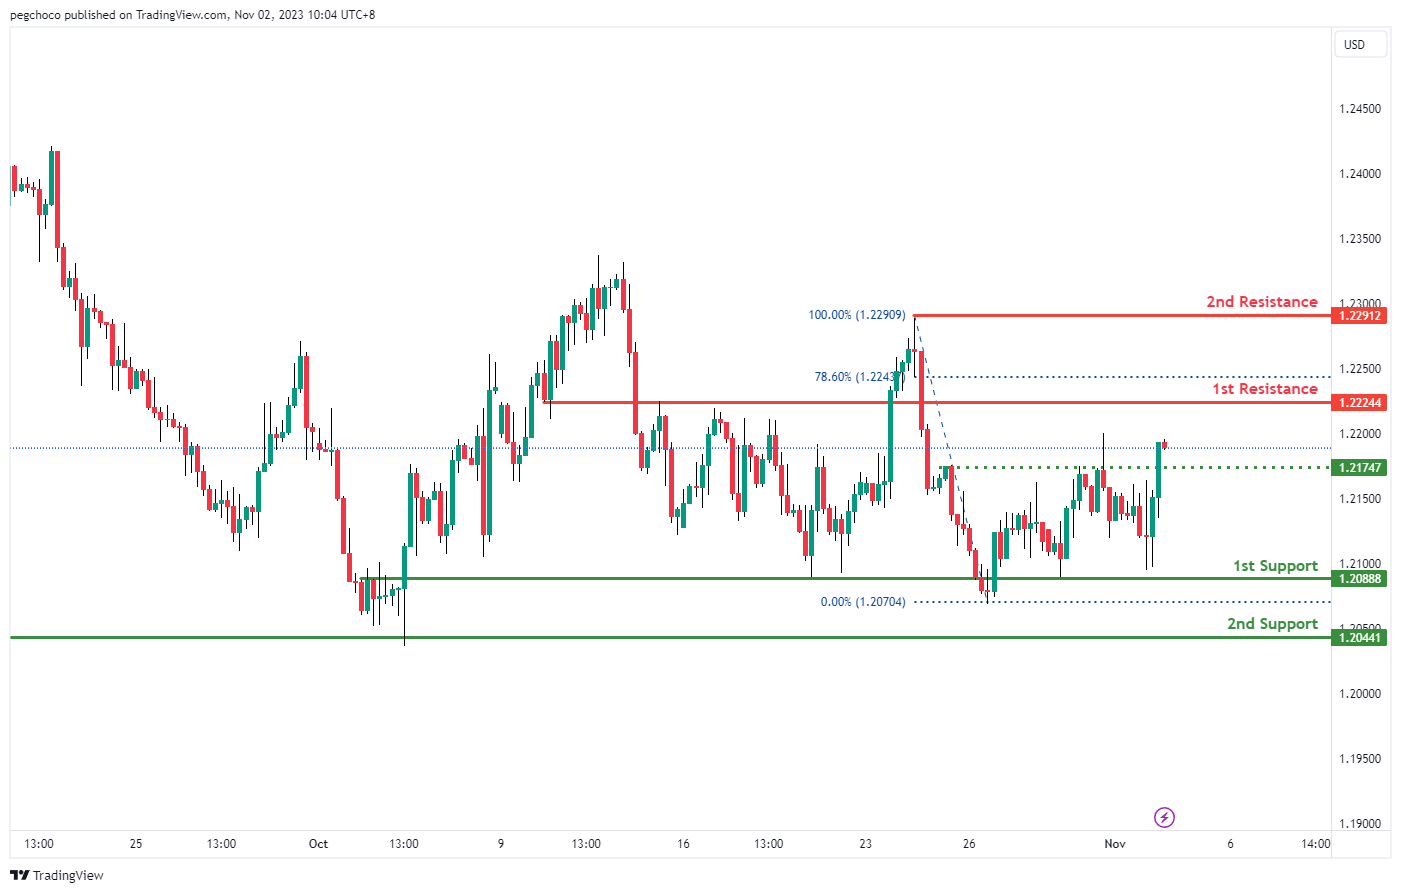
GBP/USD:
The GBP/USD chart currently exhibits a bullish overall momentum, suggesting the potential for a bullish continuation towards the 1st resistance.
1st support at 1.2088 is identified as an overlap support level, indicating its significance as potential support for the price. Additionally, the 2nd support at 1.2044 is also considered an overlap support, reinforcing the potential support zone.
On the resistance side, the 1st resistance at 1.2224 is categorized as a pullback resistance, which suggests it could act as a significant level of resistance for any further upward price movement. Furthermore, the 2nd resistance at 1.2291 is identified as a swing high resistance, indicating another potential resistance level where the price may face obstacles.
An intermediate support level at 1.2174 is noted, signifying a pullback support, which could provide additional support for the price in the bullish direction.
GBP/JPY:
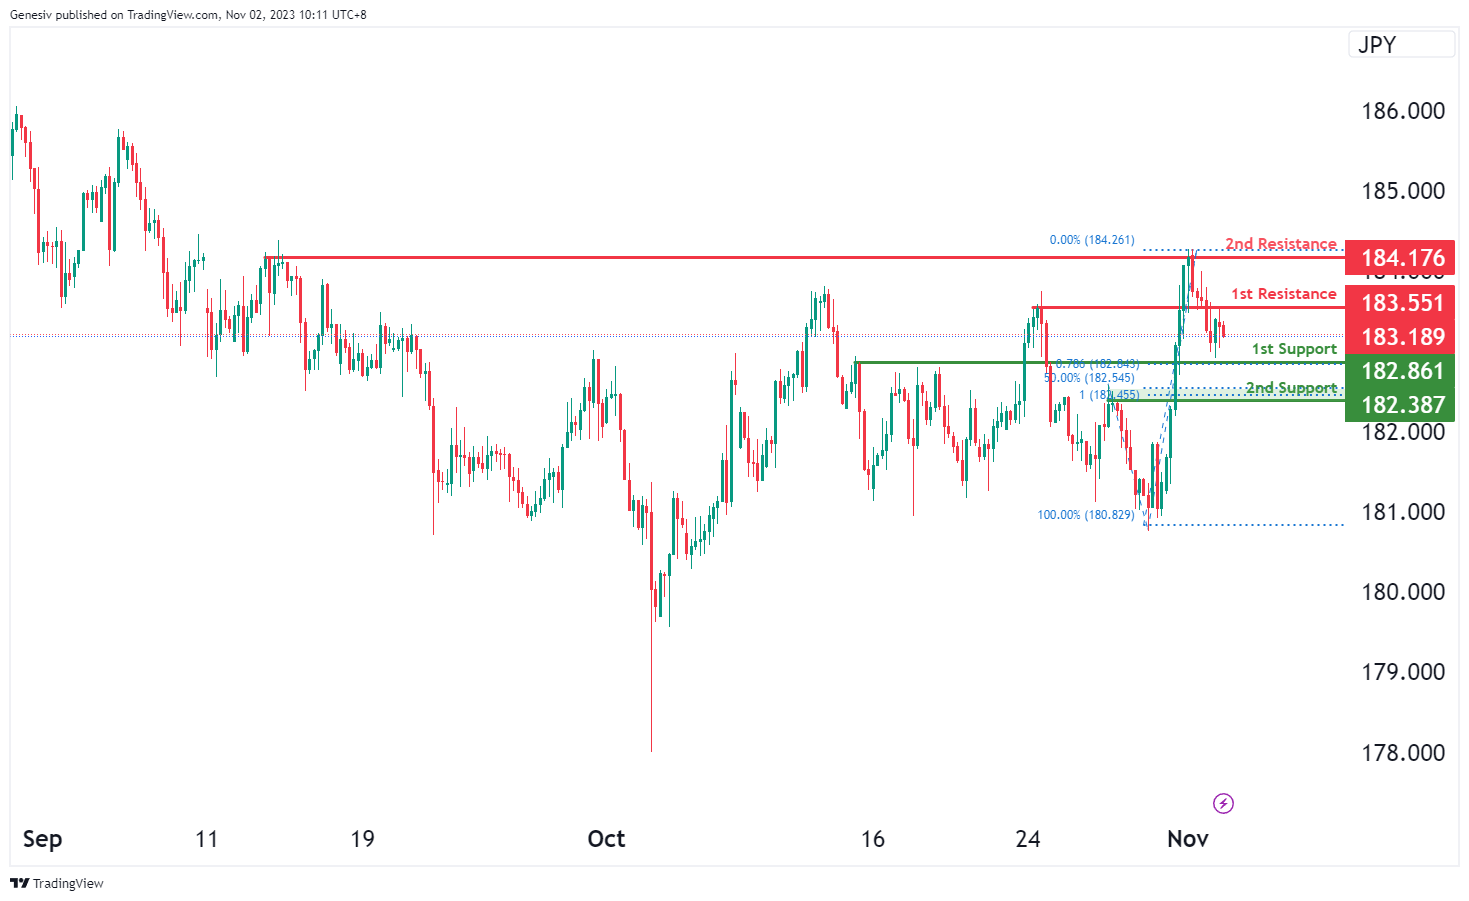
The GBP/JPY chart currently demonstrates a bearish momentum, suggesting a potential scenario for a bearish continuation towards the first support at 182.86. This level is identified as pullback support and holds significance due to the 50% Fibonacci Retracement and the 78.60% Fibonacci Projection, indicating a confluence of Fibonacci levels, which could potentially act as a strong support area for the price decline.
The second support at 182.38 is also categorized as pullback support and is highlighted by the 100% Fibonacci Projection, signifying another critical level that could potentially provide support within the bearish trend.
Regarding resistance levels, the first resistance at 183.55 is characterized as an overlap resistance, potentially serving as a barrier to the price’s upward movement in the bearish scenario. The second resistance at 184.17 aligns with multi-swing high resistance, indicating another substantial level that could hinder the price from rising within the current bearish trend.
USD/CHF:
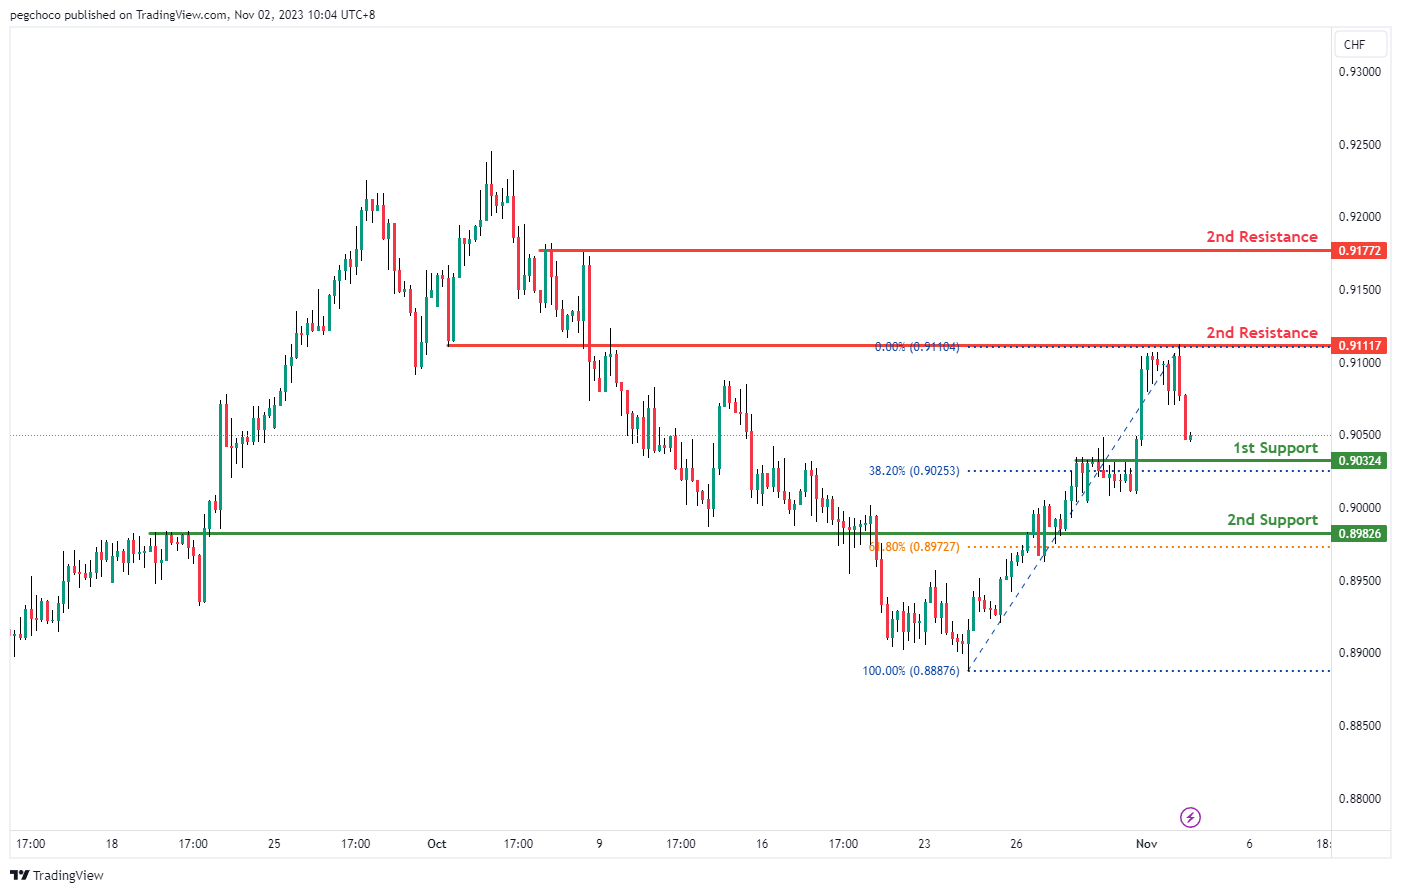
The USD/CHF chart currently has a bearish overall momentum, suggesting the potential for a bearish continuation towards the 1st support level.
1st support at 0.9032 is identified as a pullback support, and it coincides with the 38.20% Fibonacci Retracement level. This convergence of technical factors makes it a significant potential support level.
The 2nd support at 0.8982 is considered an overlap support and coincides with the 61.80% Fibonacci Retracement level. This level also adds to the potential support zone.
On the resistance side, the 1st resistance at 0.9111 is identified as an overlap resistance, suggesting it could act as a significant level of resistance for any upward price movement.
The 2nd resistance at 0.9177 is categorized as a multi-swing high resistance, indicating another potential level where the price may face obstacles in its upward movement.
USD/JPY:
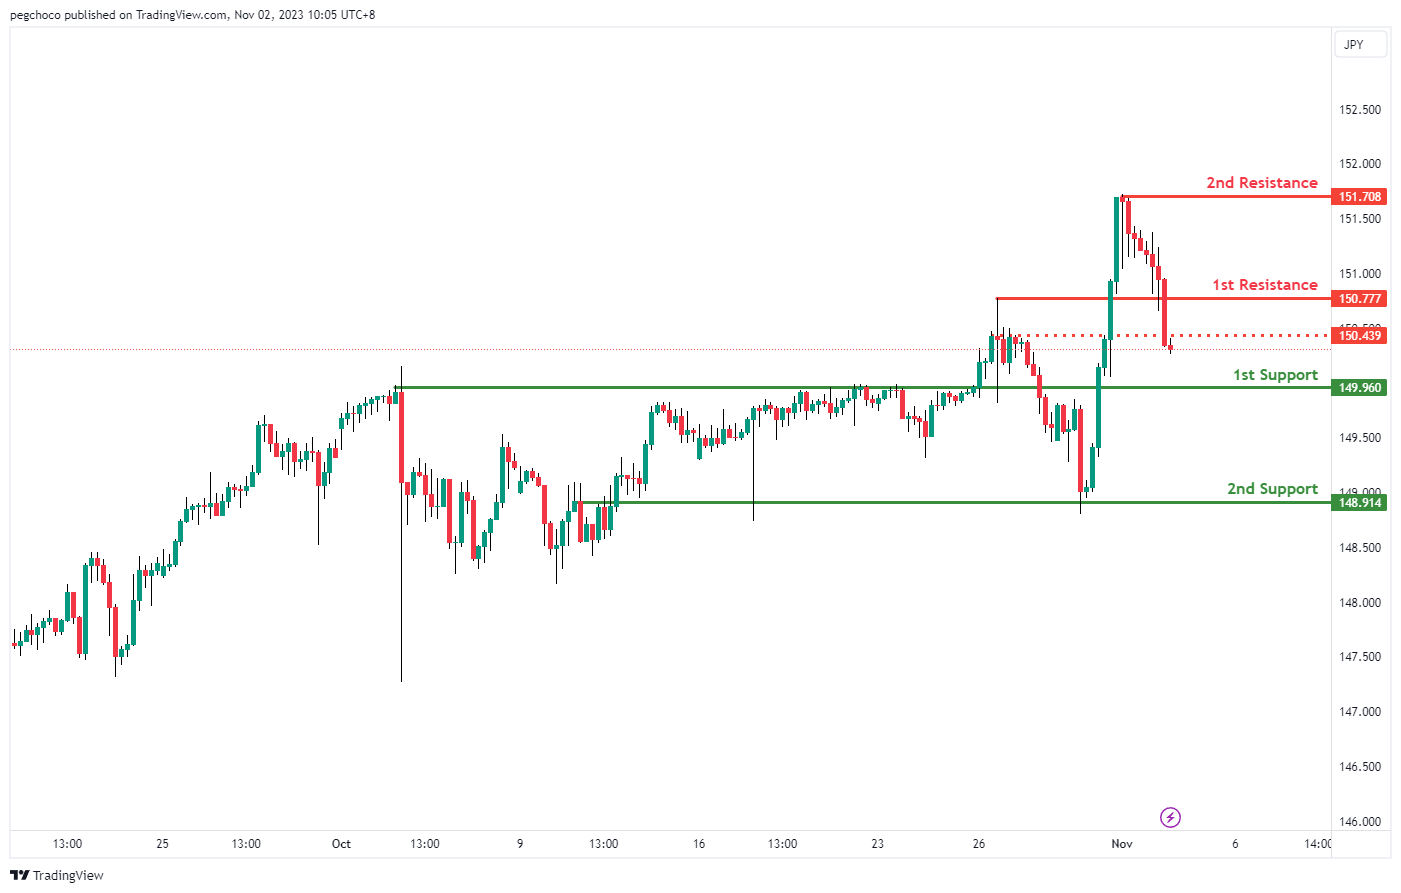
The USD/JPY chart currently has a bearish overall momentum, suggesting the potential for a bearish continuation towards the 1st support level.
1st support at 149.96 is identified as a pullback support, indicating it could be a significant level where the price might find some buying interest.
The 2nd support at 149.91 is considered an overlap support, further reinforcing its potential as a support level.
On the resistance side, the 1st resistance at 150.77 is identified as a pullback resistance, suggesting it could act as a level where the price may face selling pressure.
The 2nd resistance at 151.70 is categorized as a swing high resistance, indicating another potential level where the price may encounter obstacles in its upward movement.
Intermediate resistance at 150.43 is also noted as a pullback resistance, adding to the potential areas where the price might find resistance.
USD/CAD:
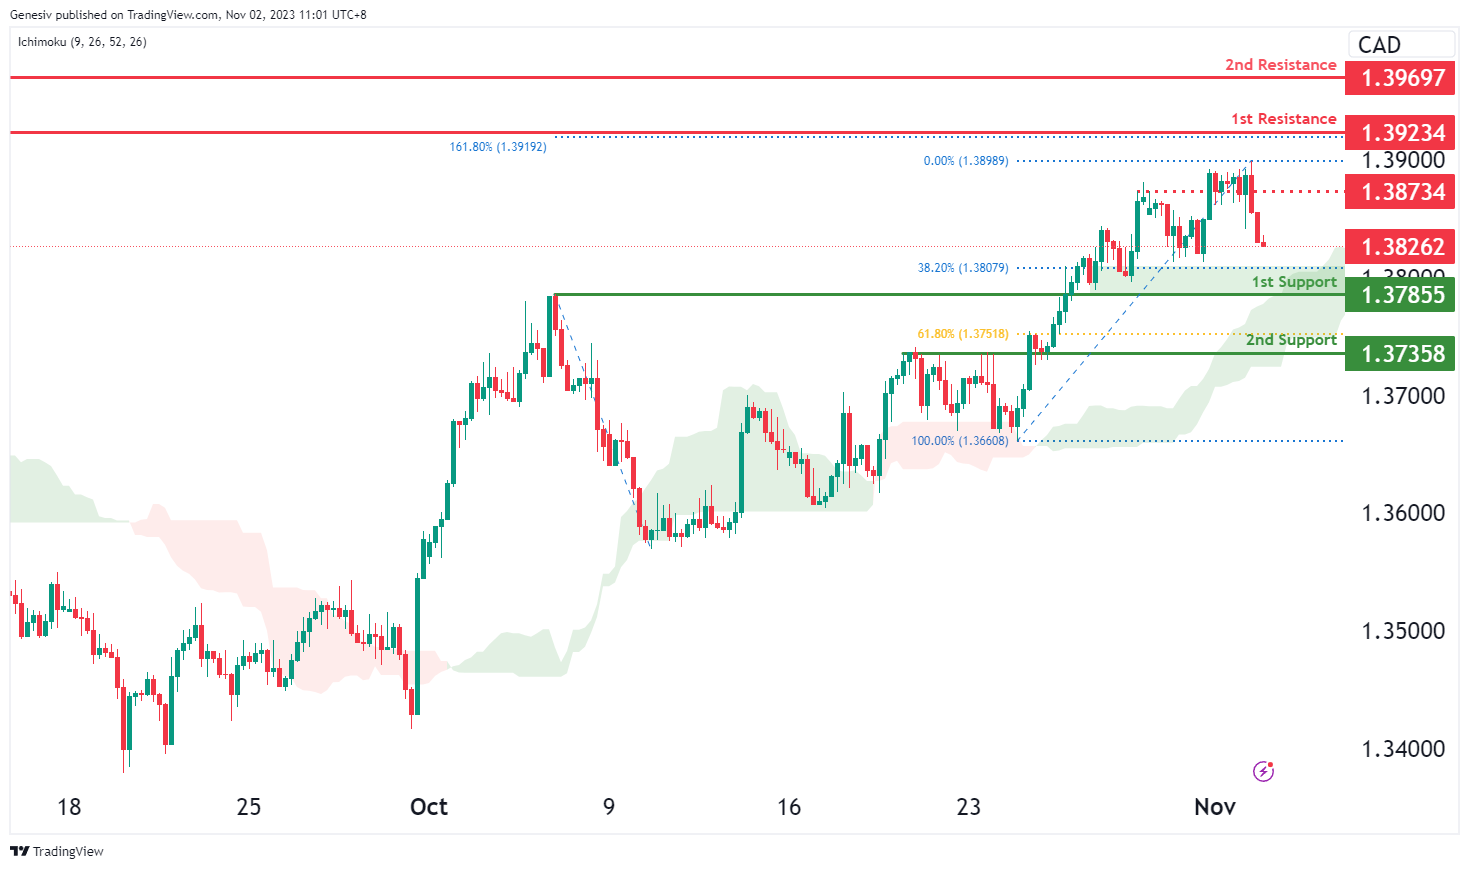
The USD/CAD chart currently demonstrates an overall bearish momentum. There is a potential scenario for price to make a bearish continuation towards the 1st support.
The 1st support level at 1.3786 is identified as an overlap support that aligns close to the 38.20% Fibonacci retracement level. Further below, the 2nd support level at 1.3736 is also marked as an overlap support that aligns close to the 61.80% Fibonacci retracement level, indicating a potential area of price support.
To the upside, the intermediate resistance at 1.3873 is identified as an overlap resistance while the 1st resistance level at 1.3923 is identified as a swing-high resistance that aligns with the 161.80% Fibonacci extension level. Beyond that, the 2nd resistance level at 1.3969 is also marked as a swing-high resistance, further reinforcing the potential for resistance in that region.
AUD/USD:
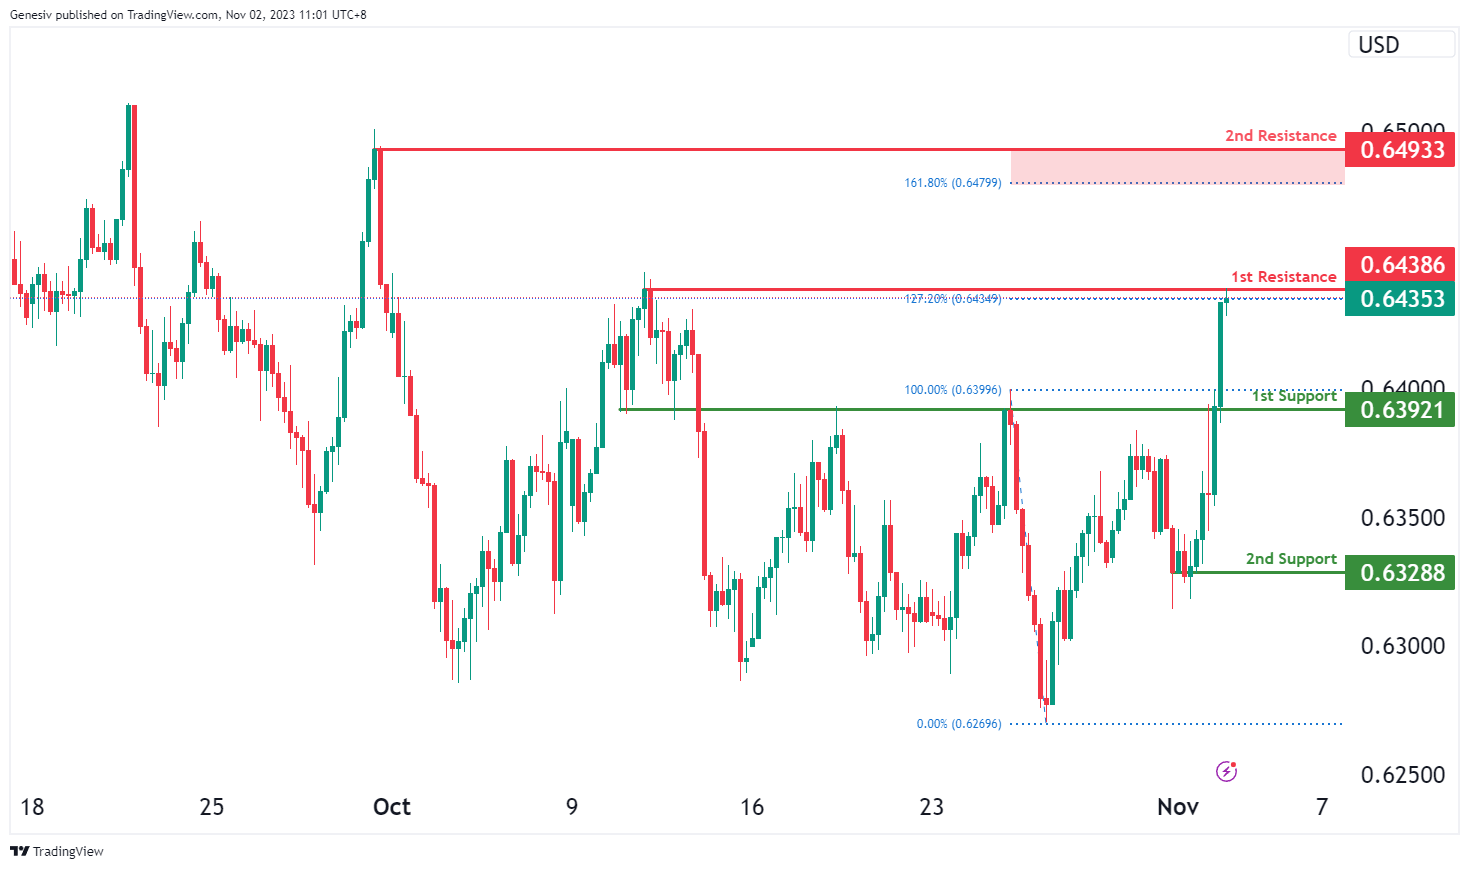
The AUD/USD chart currently exhibits an overall bullish momentum, suggesting a potential for a bullish continuation towards the 1st resistance.
The 1st resistance level at 0.6439 is identified as a swing-high resistance that aligns with the 127.20% Fibonacci extension level. Higher up, the 2nd resistance level at 0.6493 is also noted as a swing-high resistance that aligns close to the 161.80% Fibonacci extension level.
To the downside, the 1st support level at 0.6392 is identified as an overlap support. Further below, the 2nd support level at 0.6329 is marked as a pullback support, indicating a potential for a strong price support.
NZD/USD
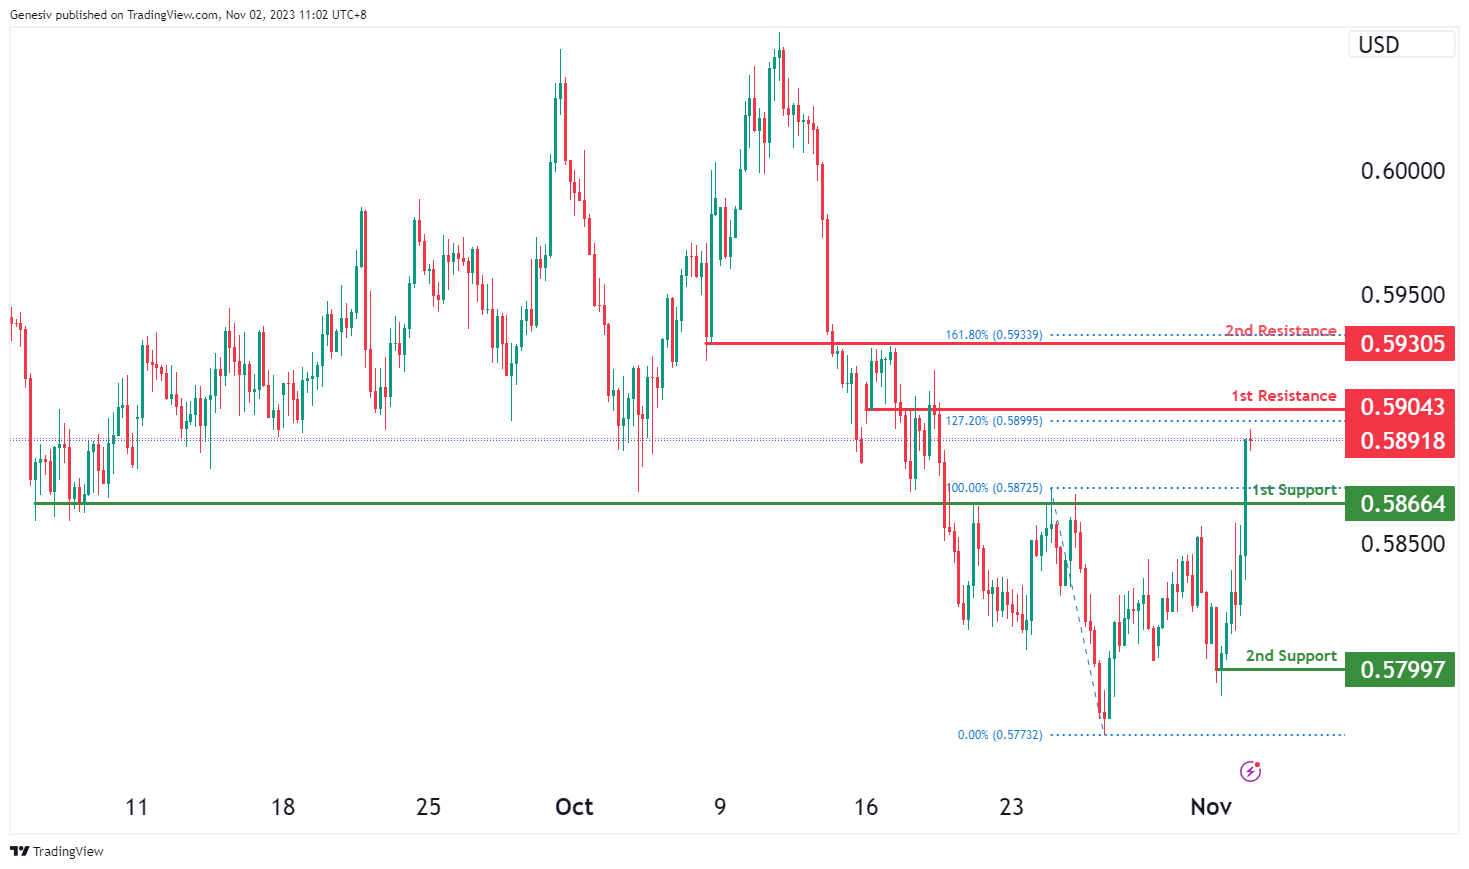
The NZD/USD chart currently demonstrates an overall bullish momentum, suggesting a potential for a bullish continuation towards the 1st resistance.
The 1st resistance level at 0.5904 is identified as an overlap resistance that aligns with the 127.20% Fibonacci extension level. Beyond this, the 2nd resistance level at 0.5931 is also noted as an overlap resistance that aligns with the 161.80% Fibonacci extension level, acting as a potential barrier to upward price movements.
To the downside, the 1st support level at 0.5866 is identified as an overlap support. Additionally, the 2nd support level at 0.5799 is marked as a pullback, potentially acting as a strong support zone.
DJ30:
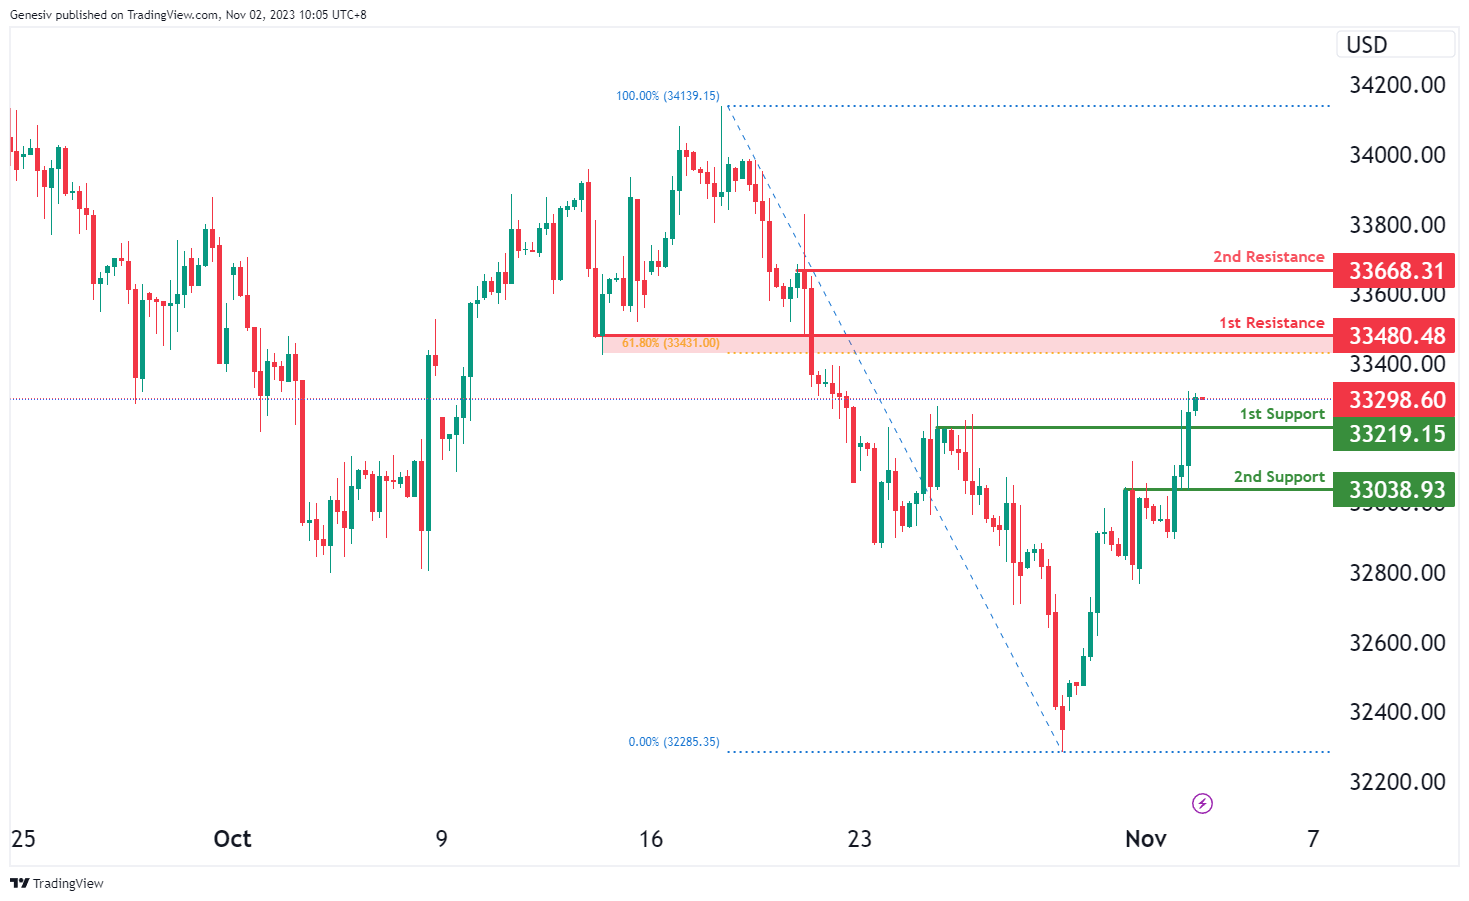
The DJ30 chart currently indicates a bullish momentum, suggesting a potential scenario for a bullish bounce off the first support at 33219.15. This level is considered a pullback support. The second support at 33038.93 aligns with swing low support levels. In terms of resistance, the first resistance at 33480.48 is marked by pullback resistance and coincides with the 61.80% Fibonacci Retracement. The second resistance at 33668.31 is identified as swing high resistance, potentially acting as a significant barrier for the price’s upward movement.
GER40:
The GER40 chart reflects a bullish trend, suggesting a potential scenario for a bullish continuation towards the first resistance at 15071.80. The first support at 14907.90 is regarded as a pullback support level, while the second support at 14800.00 aligns with an overlap support, both serving as potential levels where the price might find support.
On the resistance side, the first resistance level at 15071.80 is characterized by an overlap resistance, potentially posing a significant hurdle to the price’s upward movement. The second resistance at 15138.90 is identified as pullback resistance, indicating another potential barrier for further bullish advancement in price.

US500
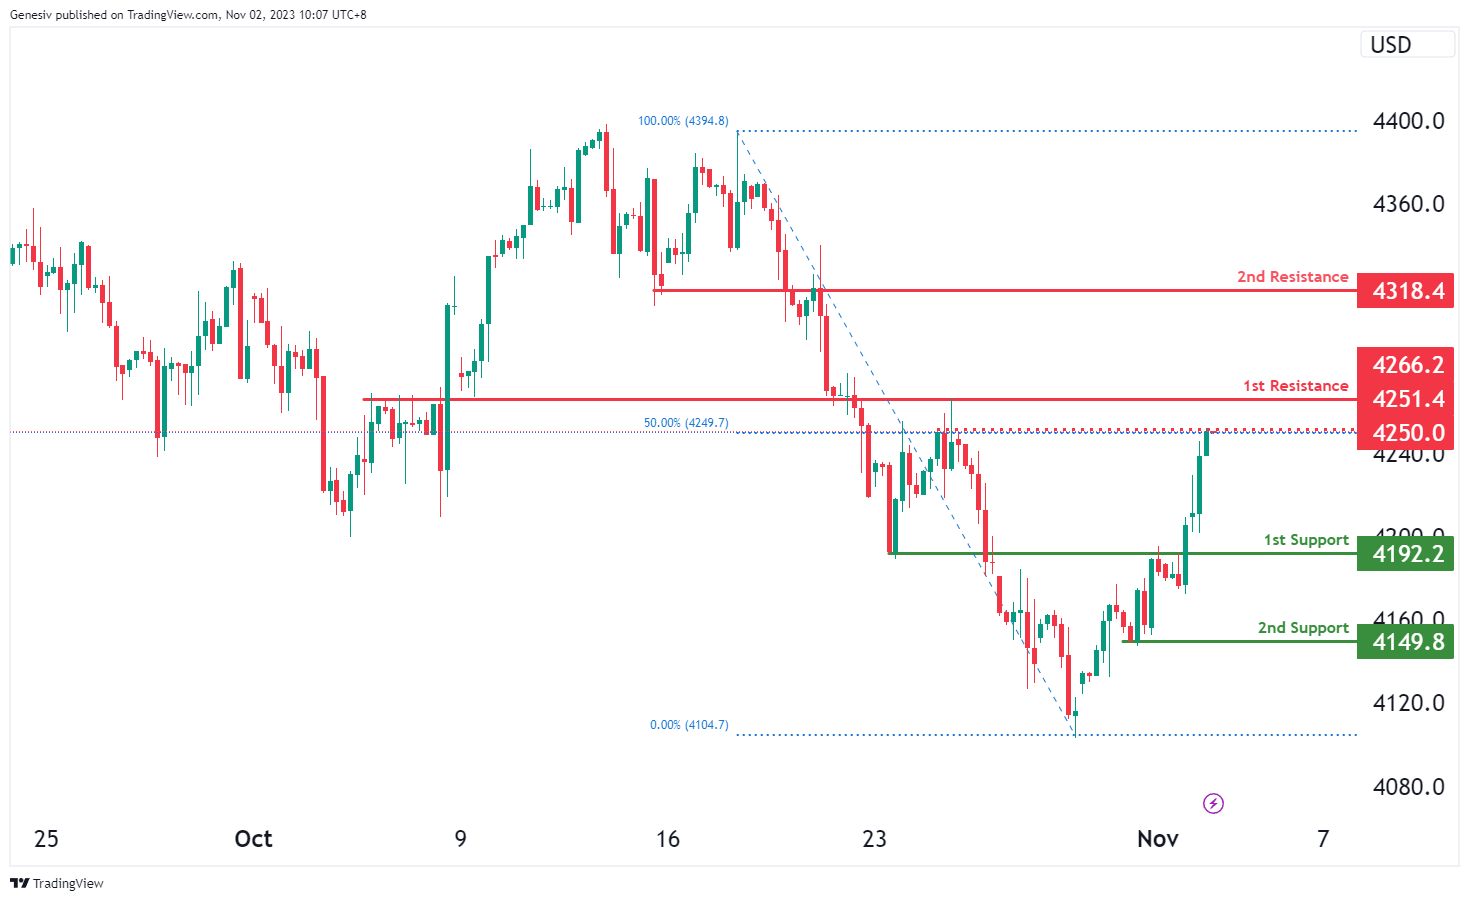
The US500 chart exhibits a bullish trend, indicating the potential for a bullish continuation towards the first resistance at 4266.2. The first support at 4192.2 is considered a pullback support, while the second support at 4149.8 aligns with swing low support, both indicating potential levels where the price might find support during upward movement.
In terms of resistance, the first resistance at 4266.2 is characterized by an overlap resistance, representing a significant hurdle for the price’s upward movement. The second resistance at 4138.4 is also an overlap resistance, potentially posing another barrier to the upward momentum.
Additionally, an intermediate resistance at 4249.7 coincides with swing high resistance and the 50% Fibonacci Retracement level, further reinforcing a potential price barrier within the bullish trend.
BTC/USD:
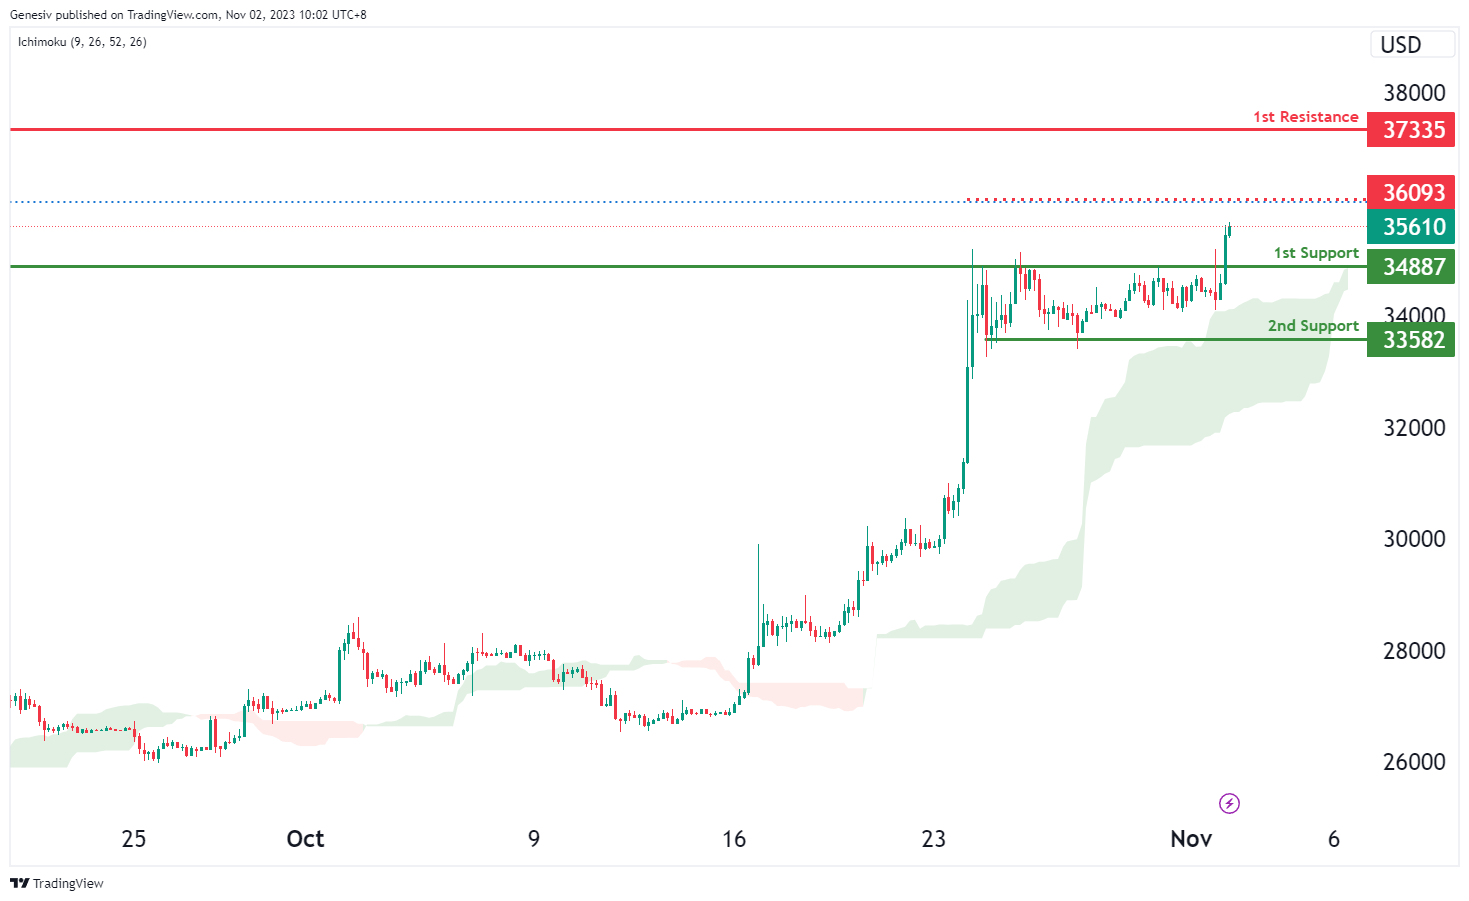
The BTC/USD chart exhibits a bullish trend, supported by its position above the bullish Ichimoku cloud. There’s a potential for a bullish continuation towards the first resistance at 37335, attributed to its pullback resistance. The first support at 34887 functions as a pullback support, while the second support at 33582 aligns with a multi-swing low support. Additionally, an intermediate resistance at 36093 coincides with the 161.80% Fibonacci Extension, further supporting the potential bullish movement.
ETH/USD:
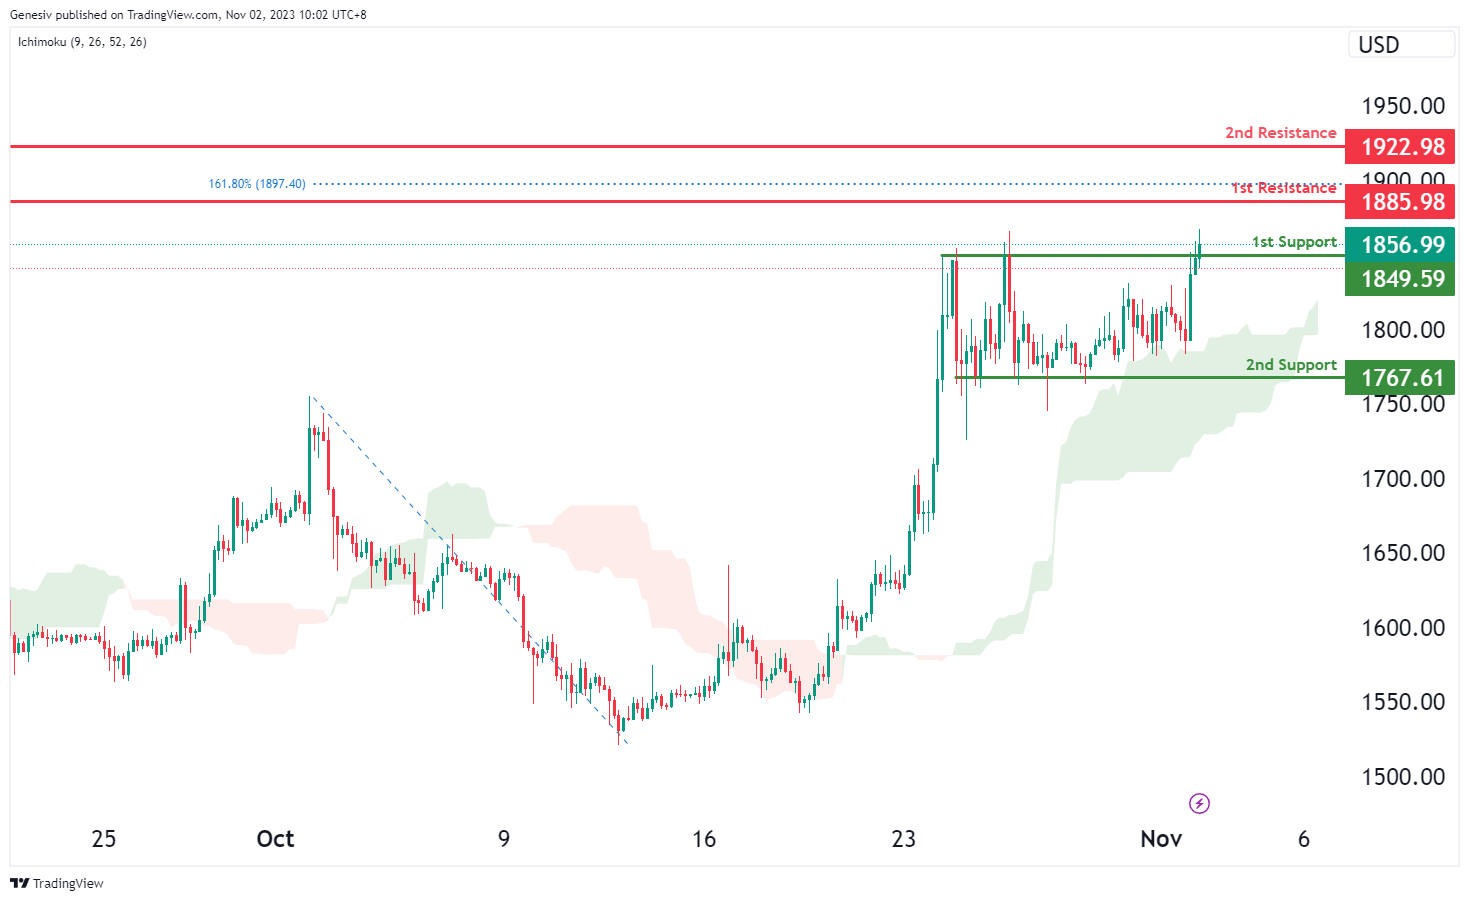
The ETH/USD chart is currently displaying a bullish trend, supported by its position above the bullish Ichimoku cloud. There’s a potential for a bullish bounce off the first support at 1849.59, which serves as a pullback support, possibly heading towards the first resistance at 1885.98. The second support at 1767.61 aligns with a multi-swing low support. Additionally, the first resistance is reinforced by an overlap resistance and the 161.80% Fibonacci Extension, while the second resistance at 1922.98 is also identified as an overlap resistance, indicating potential price barriers.
WTI/USD:
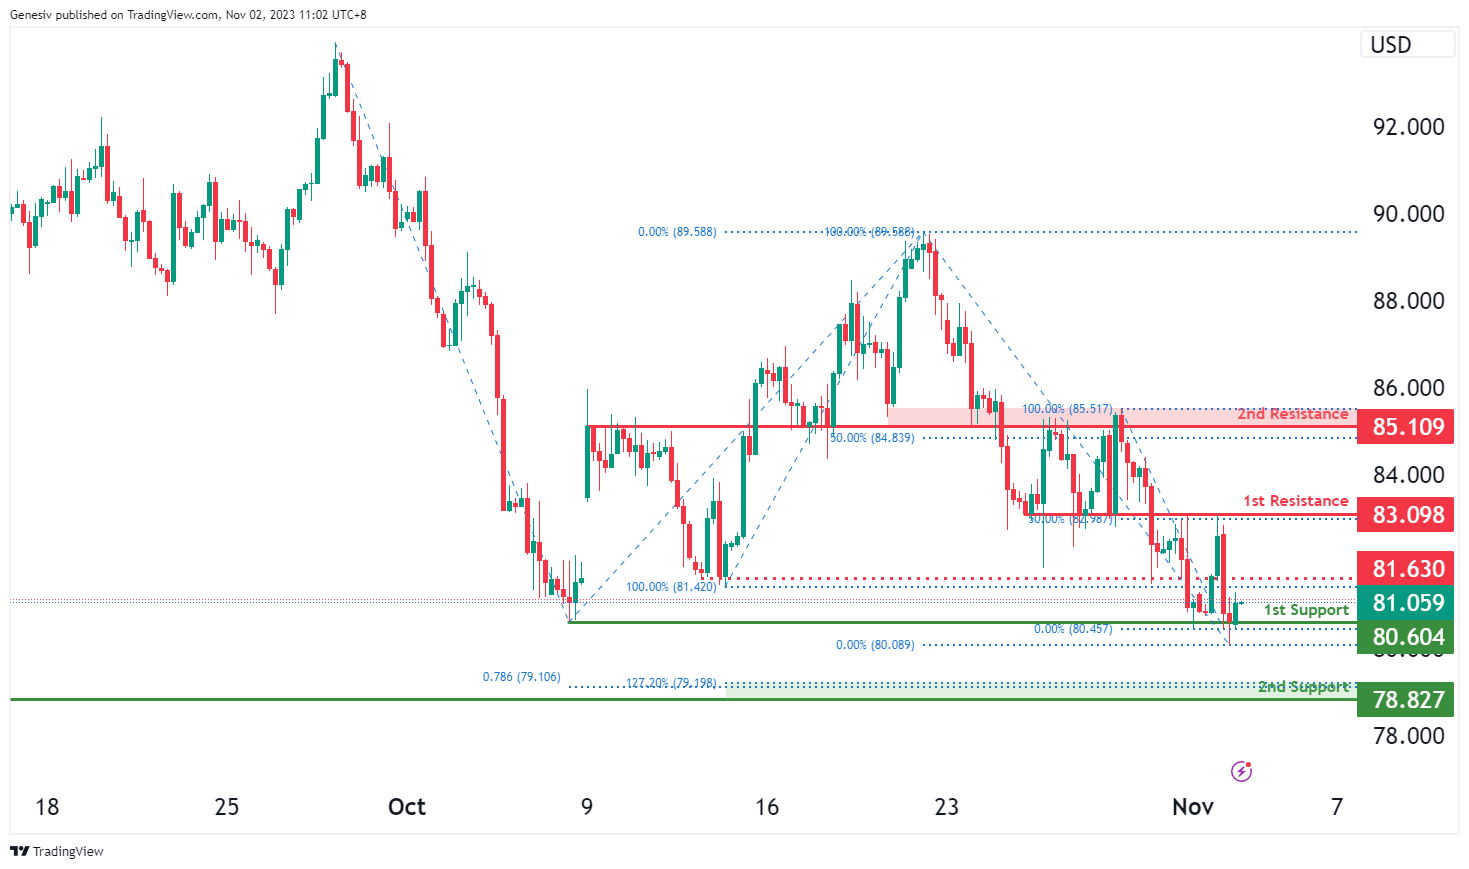
The WTI chart currently exhibits an overall bearish momentum. However, there is a potential for price to make a bullish bounce off the 1st support. Should price break above the intermediate resistance, there is a possibility for price to rise towards the 1st resistance.
The intermediate resistance level at 81.63 is identified as a pullback resistance while the 1st resistance level at 83.09 is noted as an overlap resistance that aligns with the 50.00% Fibonacci retracement level. Higher up, the 2nd resistance level at 85.11 is also marked as an overlap resistance that aligns with the 50.00% Fibonacci retracement level, making it a strong potential barrier to upward price movement.
To the downside, the 1st support level at 80.60 is identified as a swing-low support. Additionally, the 2nd support level at 78.83 is marked as a pullback support that aligns with a confluence of Fibonacci levels i.e. the 127.20% extension and the 78.60% projection levels, reinforcing a potential support zone.
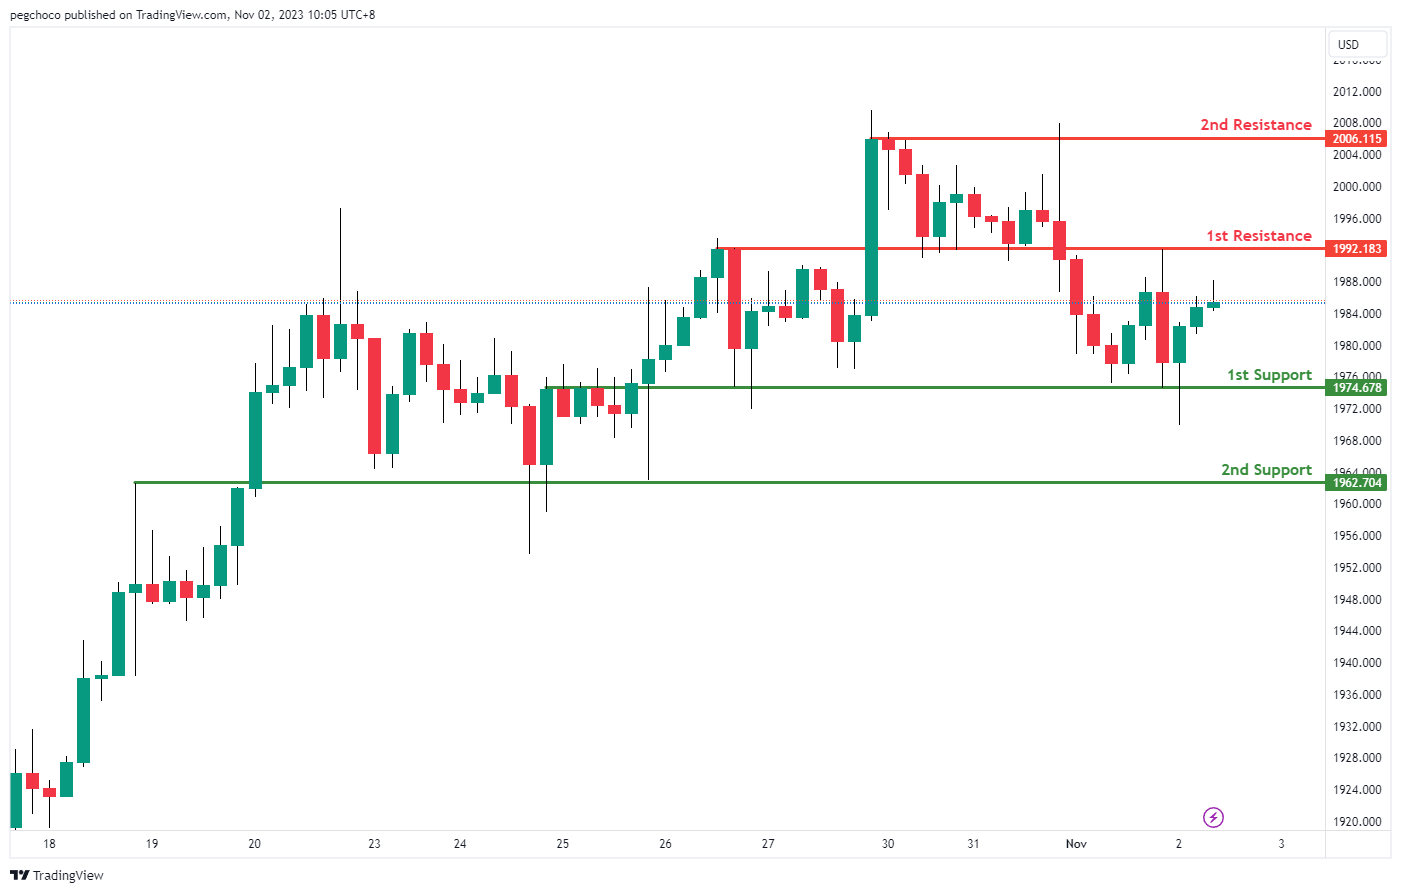
XAU/USD (GOLD):
The XAU/USD (Gold/US Dollar) chart currently has a neutral overall momentum, indicating a lack of a strong directional bias. In this situation, it’s suggested that the price could potentially fluctuate between the 1st support and 1st resistance levels.
1st support at 1974.67 is identified as an overlap support, suggesting it could be a significant level where the price might find some buying interest.
The 2nd support at 1962.70 is also categorized as an overlap support, further reinforcing its potential as a support level.
On the resistance side, the 1st resistance at 1992.18 is noted as an overlap resistance, indicating it could act as a level where the price may face selling pressure.
The 2nd resistance at 2006.11 is categorized as a multi-swing high resistance, suggesting it might be a level where the price encounters obstacles in its upward movement.
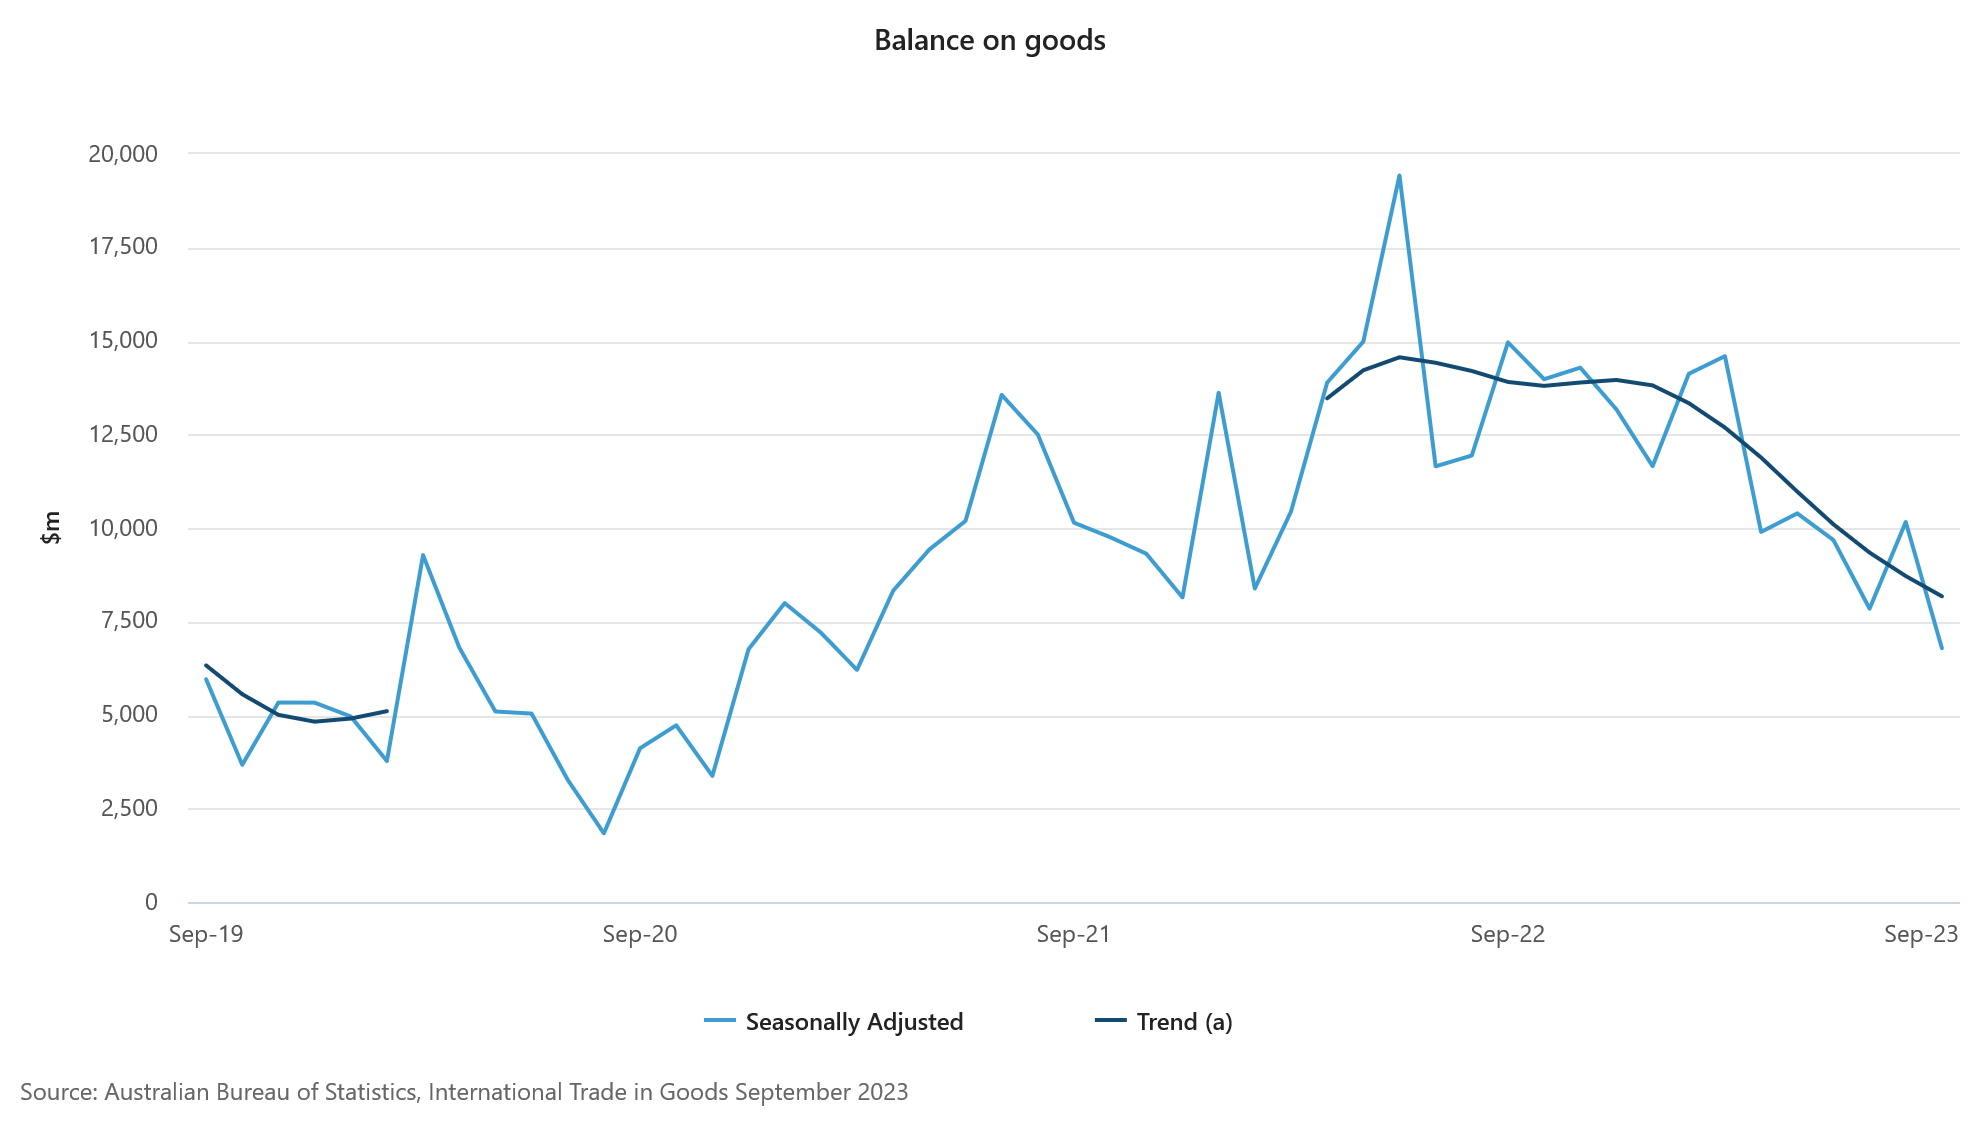
Australia’s trade surplus narrows sharply to AUD 6.79B in Sep
Australia's economic outlook has taken a concerning turn as the trade surplus for September contracted significantly, recording its lowest monthly surplus since March 2021. The data released indicates a shrinkage from prior month's AUD 10.16B to AUD 6.79B, falling short of the anticipated AUD 9.58B surplus. This sharp decline in trade surplus is fueling concerns that the Australian economy may have slipped into recession in the third quarter.
The primary factor contributing to the reduced surplus is a noticeable -1.4% yoy drop in goods exports, which totaled AUD 45.62B. This decline was primarily driven by a substantial -39.2% reduction in the shipment of metals and non-monetary gold, a critical export commodity for the Australian economy.
On the import side, there was a 7.5% yoy increase to AUD 38.84B. This surge in imports is attributed to a 23.3% jump in import of capital goods. Additionally, there was a noticeable spike in the demand for recreational items.
Gold Price Hesitates But Still Eyes New All-Time High
Key Highlights
- Gold prices corrected a few points from the $2,010 zone.
- It broke a key bullish trend line with support near $1,994 on the 4-hour chart.
- Crude oil prices spiked toward $81.50 before there was a recovery wave.
- The Fed kept interest rates unchanged at 5.25-5.50 per cent.
Gold Price Technical Analysis
Gold is still following a bullish path above $1,965 amid the Israeli–Hamas war. The price extended its increase above the $2,000 resistance zone.
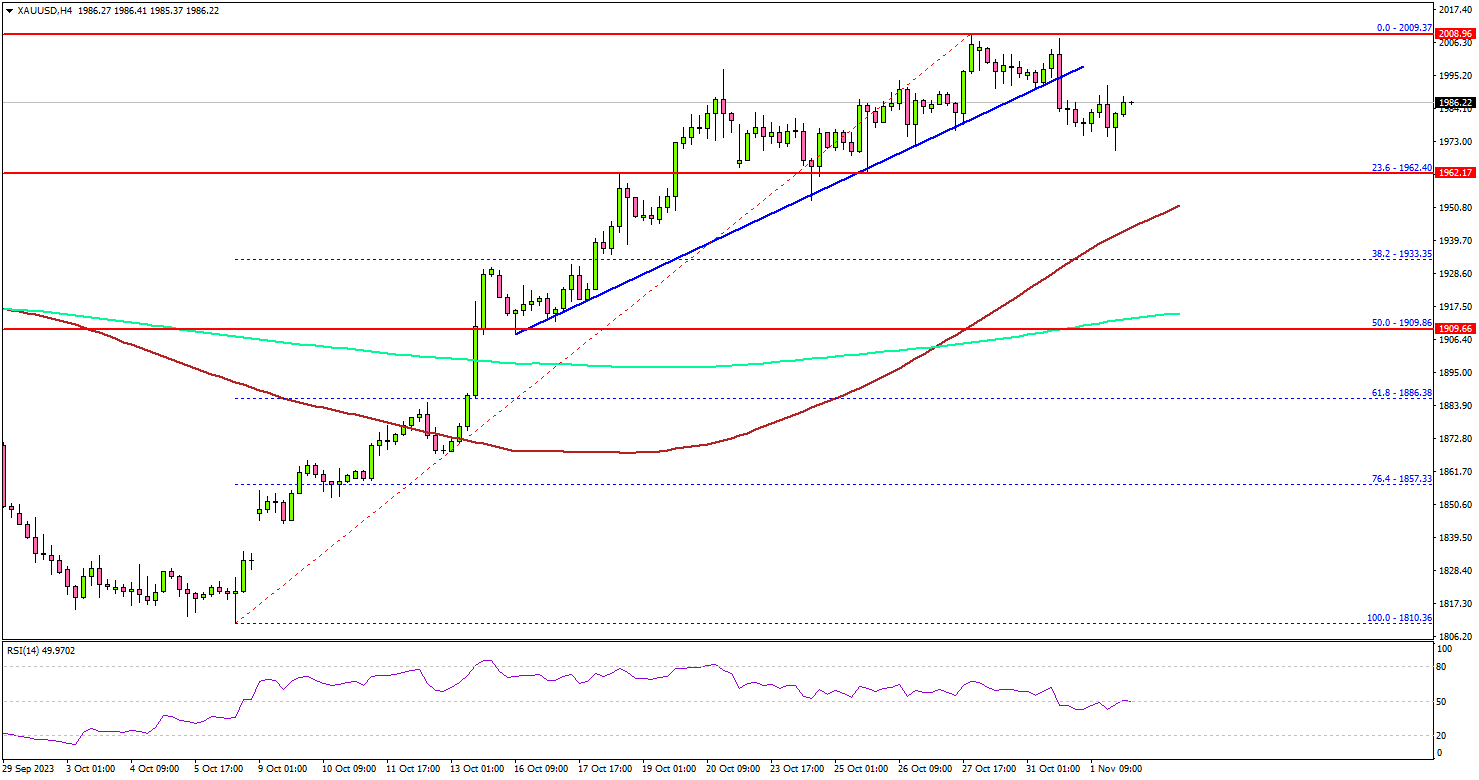
The 4-hour chart of XAU/USD indicates that the price settled above the $1,980 resistance, the 100 Simple Moving Average (red, 4 hours), and the 200 Simple Moving Average (green, 4 hours).
Finally, it traded to a new multi-week high at $2,009 before there was a downside correction. The price declined below a key bullish trend line with support near $1,994 on the same chart. There was a push toward the $1,975 level.
The first major support is near the 23.6% Fib retracement level of the upward move from the $1,810 swing low to the $2,009 high at $1,962. If there is a downside break, the price could test the 100 Simple Moving Average (red, 4 hours).
Any more losses might call for a move toward the 50% Fib retracement level of the upward move from the $1,810 swing low to the $2,009 high at $1,910.
Immediate resistance is near the $2,010 level. The first major resistance is $2,040. An upside break above the $2,040 level could send the price soaring toward the $2,080 resistance. The next major resistance is near the $2,120 level, above which Gold could test $2,200.
Looking at crude oil prices, there was a downside reaction toward the $81.50 level before the bulls appeared and protected more downsides.
Economic Releases to Watch Today
- Germany Manufacturing PMI for Oct 2023 - Forecast 40.7, versus 40.7 previous.
- Euro Zone Manufacturing PMI for Oct 2023 – Forecast 43.0, versus 43.0 previous.
- BoE Interest Rate Decision - Forecast 5.25%, versus 5.25% previous.
DOW soars and yields tumble in wake of FOMC
US stock market experienced a robust rebound overnight, with DOW recording its most substantial three-day gain since April, following Fed's decision to maintain the interest rate at the widely anticipated range of 5.25-5.50%. This marks the second consecutive month of rate pause, but Fed has not ruled out the possibility of further tightening in the future.
Treasury yields witnessed a notable decline across the spectrum, a trend initially sparked by Treasury's refunding plan. 2-year yield ended the day staying below 5% mark, settling at 4.96%, while 10-year yield broke through 4.8% level. closing at 4.789%.
During the post-meeting press conference, Fed Chair Jerome Powell underscored the flexibility of the FOMC. He emphasized, "The idea that it would be difficult to raise [rates] again after stopping for a meeting or two is just not right. The Committee will always do what it thinks is appropriate at the time."
Further emphasizing the uncertainty of future meetings, Powell stated, "We have yet to finalize our decisions concerning the upcoming meetings." He elaborated on the Committee's objective to assess the need and degree of potential policy tightening, aiming to stabilize inflation at around 2% over a period.
Dismissing any speculations of rate cuts, Powell asserted that such discussions are currently off the table. The primary focus remains on evaluating if the present monetary policy is "sufficiently restrictive" to sustainably bring down inflation to 2% target.
Regarding the balance sheet runoff, Powell mentioned that there is no current consideration to alter its pace. The committee is not discussing or considering any changes in this aspect.
In response to these developments, Fed fund futures indicated a reduced probability of another rate hike in December, now standing at a 20% likelihood, down from the previous day's 29%.
DOW's strong rebound this week suggests that a short-term bottom was established at 32327.20 already. Risk is now mildly on the upside for the near term, with possibility of further rally to 55 D EMA (now at 33764.41). If 33764.41 resistance level continues to hold its ground, it could indicate that DOW is merely in a short term consolidation phase, and the decline from 35679.12 might resume at a later stage.
Shifting focus to 10-year yield, corrective pattern from 4.997 extended with yesterday's fall. Bearish divergence condition in D MACD argues that the consolidation would extend further for a while. . But there is no clear indication of bearish reversal with TNX holding well above 4.532 support as well as 55 D EMA (now at 4.551). Nevertheless, upside potential should be limited for the near term.
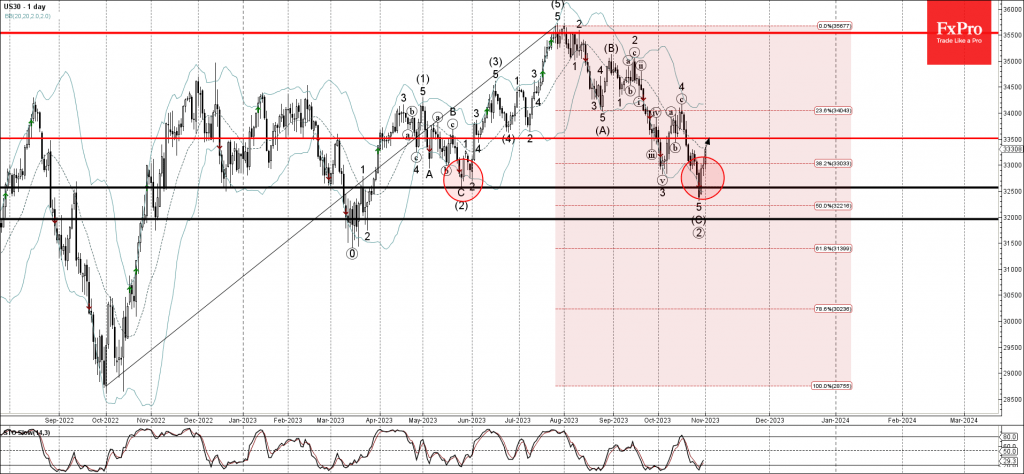
Dow Jones Wave Analysis
- Dow Jones reversed from support level 32565.00
- Likely to rise to resistance level 33500.00
Dow Jones index recently reversed up from the strong support level 32565.00 (former multi-month low from May) coinciding with the lower daily Bollinger Band.
The upward reversal from the support level 32565.00 created the daily candlesticks reversal pattern Bullish Engulfing.
Given the longer term uptrend, Dow Jones index can be expected to rise further toward the next resistance level 33500.00.
AUDCHF Wave Analysis
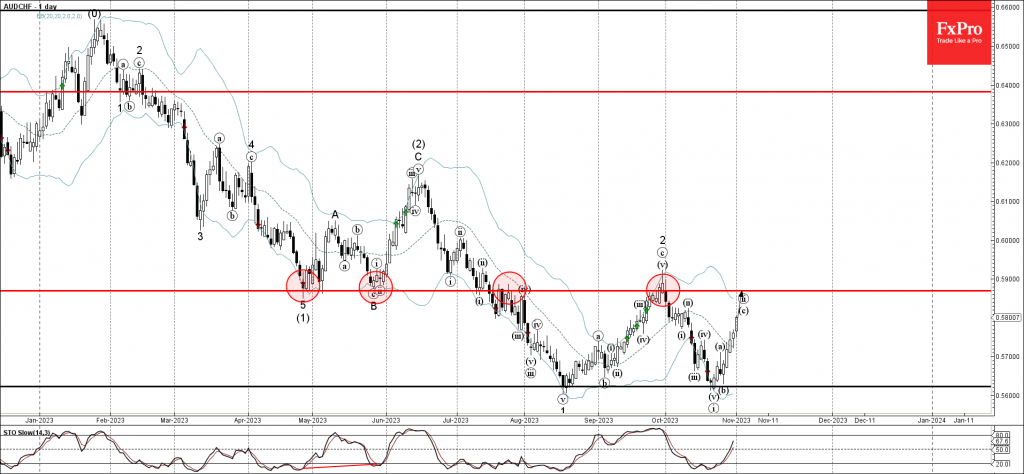
- AUDCHF rising inside c-wave
- Likely to rise to resistance level 0.5870
AUDCHF continues to rise inside the c-wave of the active short-term ABC correction ii, which started earlier from the key support level 0.5620 (former strong support from August).
The active ABC correction ii belongs to the higher downward impulse wave 3 from the end of September.
Given the continuation of the Swiss franc sales seen across the FX markets over the last trading sessions, AUDCHF can be expected to rise further toward the next resistance level 0.5870 (target for the completion of the active short-term ABC correction ii).
FOMC Appears To Be in “Hawkish Hold” Mode
Summary
- As widely expected, the FOMC decided to keep rates on hold at today's policy meeting. The decision to maintain the target range for the federal funds rate at its current level was unanimously supported by all 12 voting members of the Committee.
- The FOMC also maintained its current pace of quantitative tightening.
- The post-meeting statement continued to characterize inflation as "elevated." Additionally, the Committee maintained that "additional policy firming" may be "appropriate." In short, the FOMC is keeping open the door to hiking rates again if economic and financial developments warrant.
- This is the third time in the past four policy meetings that the FOMC has decided to maintain its target range for the federal funds rate at its current level rather than lift it further.
- It seems to us that the FOMC is now in "hold" mode, albeit in a hawkish way, rather than simply on "pause." That is, we think the bar to further rate increases is higher now than it was a few months ago.
- We forecast that the FOMC will remain on hold through most of Q2-2024, which is more or less consistent with market pricing. But the stance of monetary policy, as measured by the real fed funds rate, likely will become more restrictive in coming months as inflation slowly recedes back toward target but as the FOMC keep the nominal fed funds rate on hold.
FOMC Moves to "Hawkish Hold
As universally expected, the Federal Open Market Committee (FOMC) unanimously decided today to keep its target range for the federal funds rate unchanged at 5.25%-5.50%. Additionally, the FOMC voted to maintain the current pace at which Treasury securities and mortgage-backed securities (MBS) are rolling off of the central bank's balance sheet (i.e., quantitative tightening). The post-meeting statement acknowledged the strength in third quarter GDP growth—real GDP grew at an annualized pace of 4.9% in Q3 relative to the previous quarter— by noting that "economic activity expanded at a strong pace in the third quarter." Yet it also gave a nod to some recent tightening in financial conditions. Otherwise, there were no material changes to the statement.
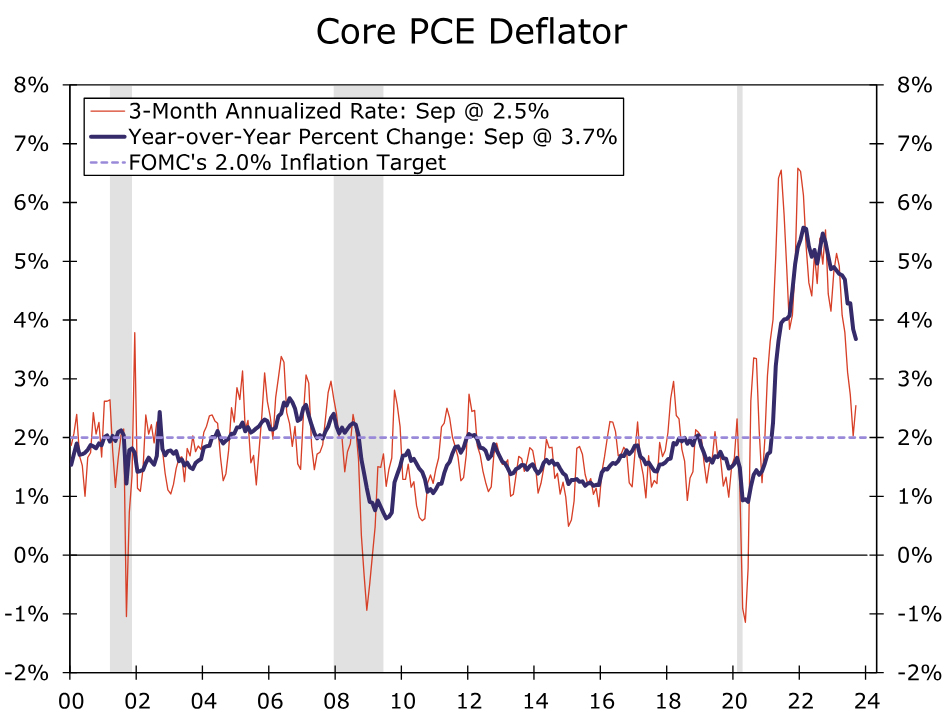
Notably, however, the FOMC continued to characterize inflation as "elevated." Indeed, the year-over-year rate of core PCE inflation, which Fed officials believe is the best measure of the underlying rate of consumer price inflation, printed at 3.7% in September, although the annualized rate of change over the past three months was 2.5% (Figure 1). The Committee kept the door open to another hike by reiterating that it will monitor economic and financial developments when "determining the extent of additional policy firming that may be appropriate." (The FOMC used this phrase in the past four statements.) This is the third time in the past four meetings that the Committee has decided to maintain its target range for the federal funds rate at its current level rather than lift it further. It seems to us that the FOMC is now in "hold" mode, albeit in a hawkish way, rather than simply on "pause." That is, we think the bar to further rate increases is higher now than it was a few months ago.
Policy Will Become More Restrictive on a "Passive" Basis in Coming Months
As shown in Figure 2, the real fed funds rate (i.e., the nominal rate of 5.50% less the year-over-year rate of core PCE inflation) is closing in on 2%, its highest level in more than a decade. In other words, the stance of monetary policy is more restrictive today than it has been for some time, even as the FOMC has held the fed funds rate target steady the past two meetings. Additionally, the effects of previous tightening is still feeding through the pipeline due to the inherent lags by which monetary policy tightening works, and the recent back-up in long-term interest rates will also exert headwinds on the economy.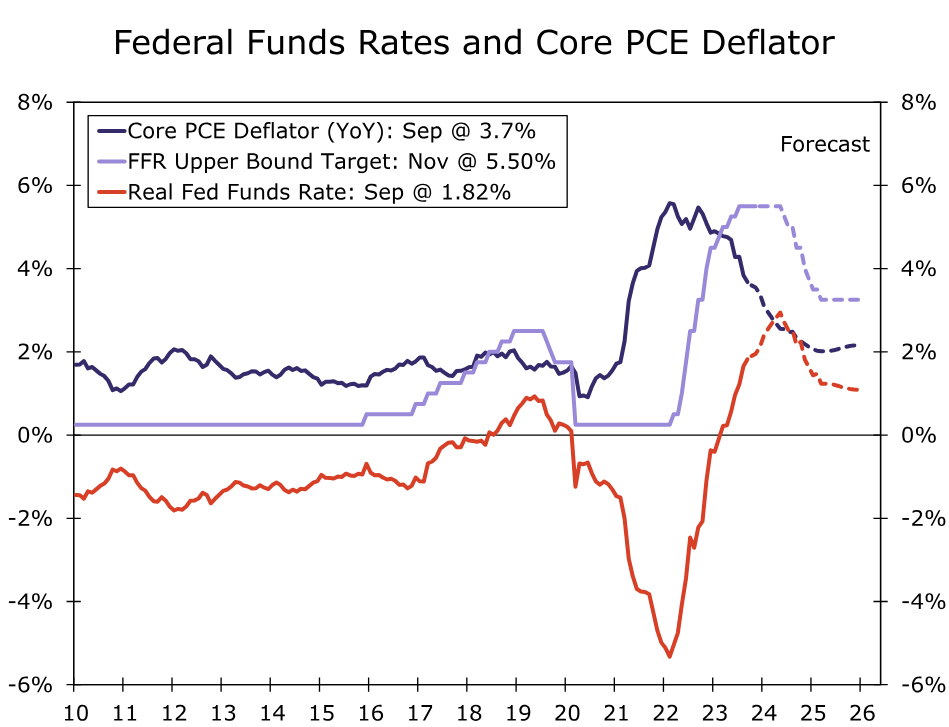
There is no indication in today's policy statement or in recent comments by Fed officials that the FOMC is about to cut rates. We forecast that the FOMC will remain on hold through most of Q2-2024, which is more or less consistent with market pricing. Consequently, the stance of monetary policy, as measured by the real fed funds rate, likely will become more restrictive in coming months as inflation slowly recedes back toward target while the FOMC keeps the nominal fed funds rate on hold. We think this "passive" tightening of monetary policy will lead to a period of economic weakness, if not outright contraction in real GDP, next year that will eventually induce the Committee to ease policy. As detailed in our most recent U.S. Economic Outlook, we then look for the FOMC to cut rates by 225 bps by early 2025, which is more than the market and Fed officials currently project.