Sample Category Title
Solana Races Towards the Sun, Bitcoin Reaches New Heights
Market picture
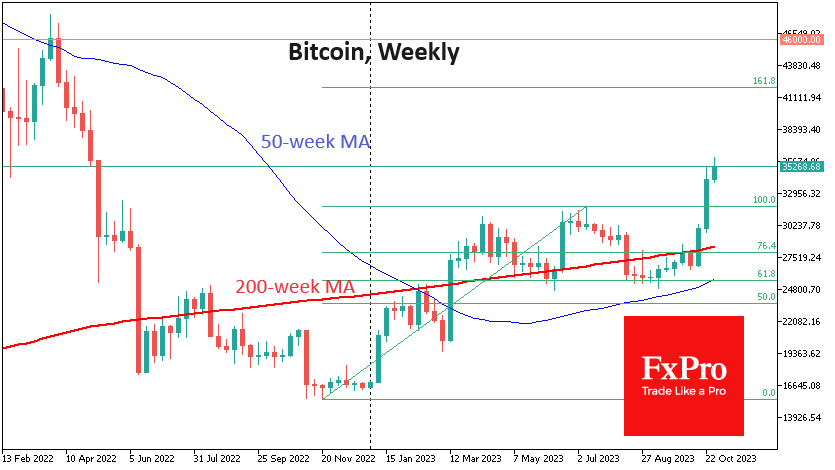
The cryptocurrency market rose on Wednesday, gaining fresh buying impulse after the Fed’s comments. Total market cap exceeded $1.30 trillion (+2.6% in 24 hours) and reached $1.32 trillion at the start of the day. Bitcoin surpassed $35K (+2.2%), and demand spread to leading altcoins such as XRP (+4%) or Solana (+10%).
Bitcoin broke the upper boundary of the week-long consolidation, climbing to $36K early on Thursday before retreating to $35.1K by the European session. Technically, the recent jump is a confirmation of the bullish bias. Bitcoin may not face significant resistance until $41K, but the maximum target for this momentum is $46K, where there was the last reversal.
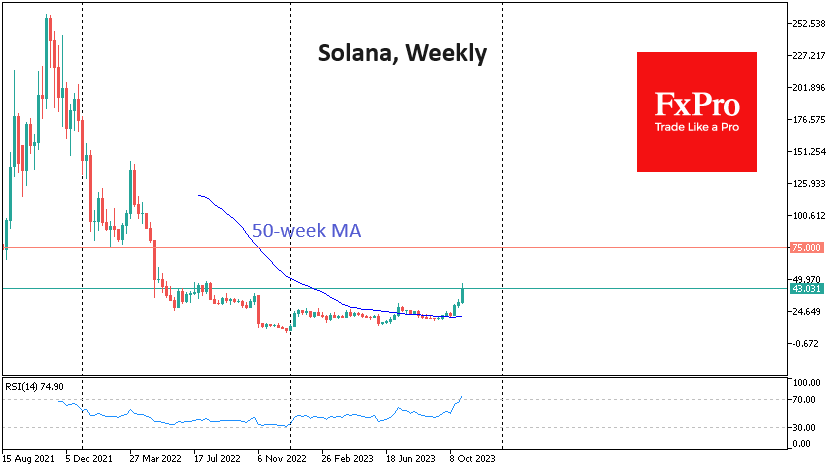
Solana has gained up to 50% over the last three days. It has already surpassed its Fibonacci upside target of 161.8% of the original jump from 12 to 26 October. This coin’s price is at its highest since August last year, although it is still 85% below its peak of precisely two years ago. There is no technical resistance between $48 and $75, but it already looks locally overheated.
News background
According to CoinDesk, several of the world’s largest market makers could provide liquidity for BlackRock’s bitcoin ETF if regulators approve the product. Jane Street, Virtu Financial, Jump Trading and Hudson River Trading have already talked with BlackRock, which recently updated its filing with the SEC to launch the ETF.
October was probably SkyBridge Capital’s best month ever, said hedge fund founder Anthony Scaramucci. Bitcoin had an impressive month, he said. The fund also holds a lot of Solana, up 70% for the month.
Tether, the issuer of the USDT stablecoin, reported reserves for the third quarter of the year. According to the report, the financial giant’s excess reserves totalled $3.2 billion.
The TON blockchain set a new world record during public testing, completing nearly 105,000 transactions per second (TPS). This figure exceeds all confirmed results of other blockchains and the maximum speed of the centralised payment systems Visa and Mastercard. The previous holder of the fastest blockchain title was Solana.
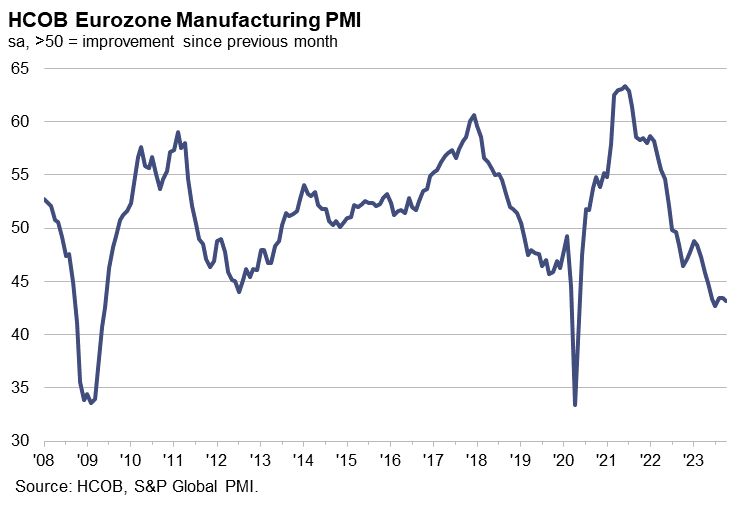
Eurozone PMI manufacturing finalized at 43.1, woes deepen
Eurozone's PMI Manufacturing reading for October was finalized at 43.1, a slight decline from September's 43.4.
A closer look at individual countries, notably, Germany, Europe's largest economy, posted a five-month high, though it still lurks in the downturn territory with a reading of 40.8. France hits a 41-month low at 42.8.
Amidst the broader decline, Greece displayed resilience with a two-month high of 50.8. In contrast, countries such as Ireland, Spain, and Italy presented figures pointing towards continued economic pressure with readings of 48.2, 45.1, and 44.9, respectively.
Cyrus de la Rubia, Chief Economist at Hamburg Commercial Bank, likened the ongoing trend in Eurozone manufacturing to a "bumpy sleigh ride." While the slight stability in recent PMI figures might hint at approaching the low point of this downturn, the critical indicators like the new orders index remain in the red.
The stagnation of these vital indices, as history suggests, could potentially set the stage for a recovery. However, de la Rubia anticipates this turnaround to materialize in the first half of the upcoming year.
Furthermore, he pointed out the synchronized decline among the eurozone nations. With key players like France, Italy, Spain, and Germany showcasing dipping PMIs, it's evident that a sectoral contraction might be imminent for these nations in the current quarter.
EUR/GBP Technical: Medium-Term Bullish Basing as BoE Looms
- Three key technical developments have suggested that the EUR/GBP cross pair has formed a potential medium-term bullish basing configuration since 23 August 2023
- Watch the key short-term support at 0.8680.
- Immediate resistances stand at 0.8750 and 0.8820.
The price actions of the EUR/GBP cross pair have started to trace out a medium-term bullish basing configuration since 23 August 2023 as we await the latest Bank of England (BoE) monetary policy decision later today.
Clearance above 200-day moving average
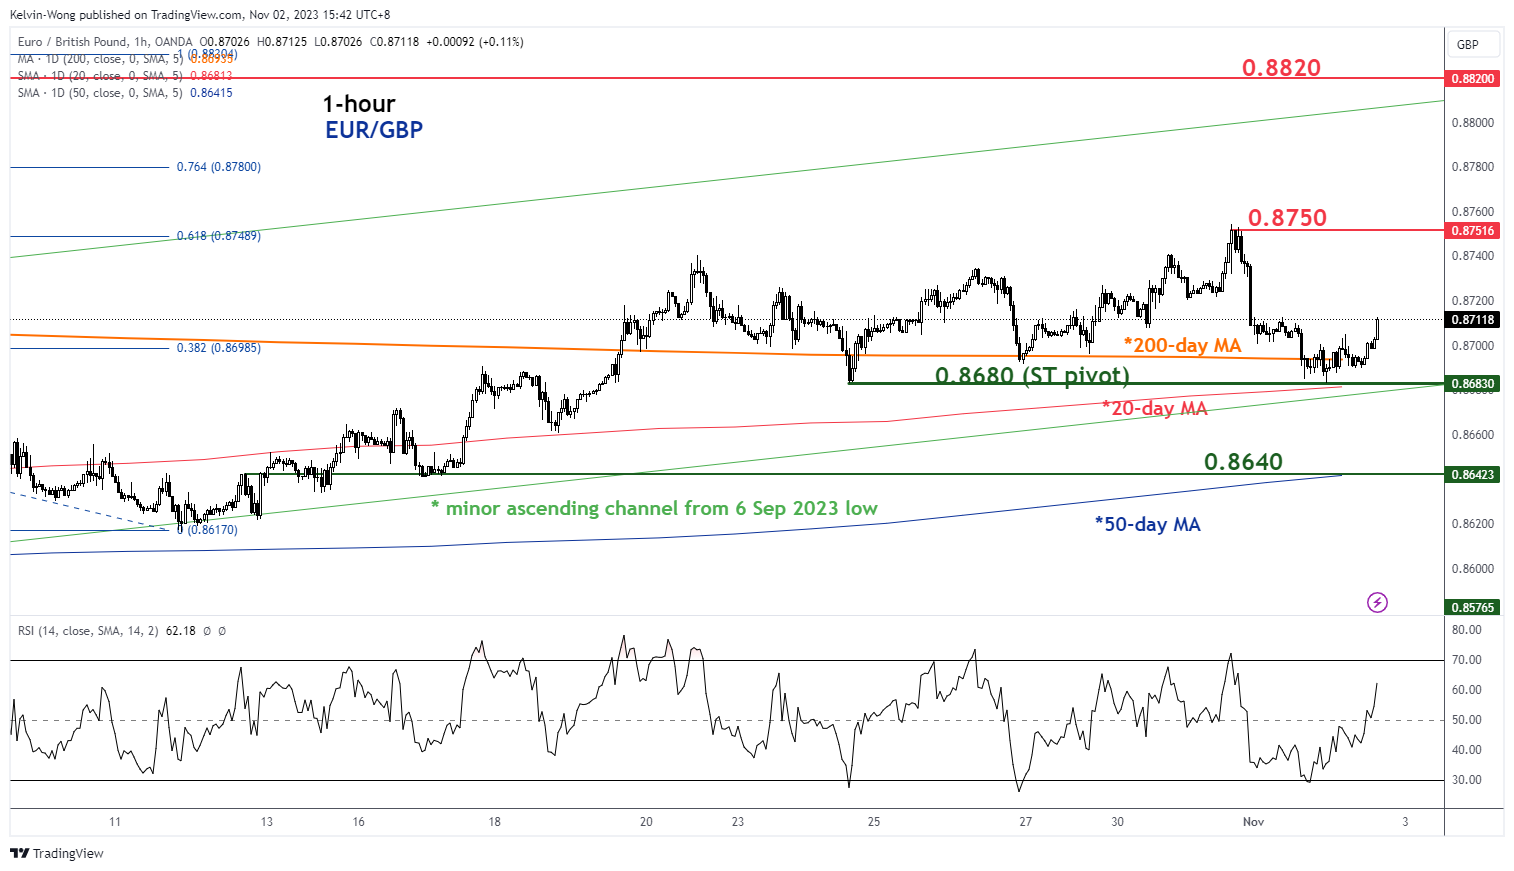
Fig 1: EUR/GBP medium-term trend as of 2 Nov 2023 (Source: TradingView, click to enlarge chart)
There are three key positive technical developments that have taken form. Firstly, the bullish basing formation has taken shape after a recent retest (23 August 2023) on the major ascending trendline from the 7 March 2022 low of 0.8203.
Secondly, recent price actions have surpassed the key 200-day moving average with a retest and rebound from it during yesterday’s US session (1 November) ex-post FOMC.
Thirdly, the 20 and 50-day moving averages have started to slope upwards with price actions above the 50-day moving average that indicate a potential medium-term uptrend phase is in motion.
Oscillation within a minor ascending channel
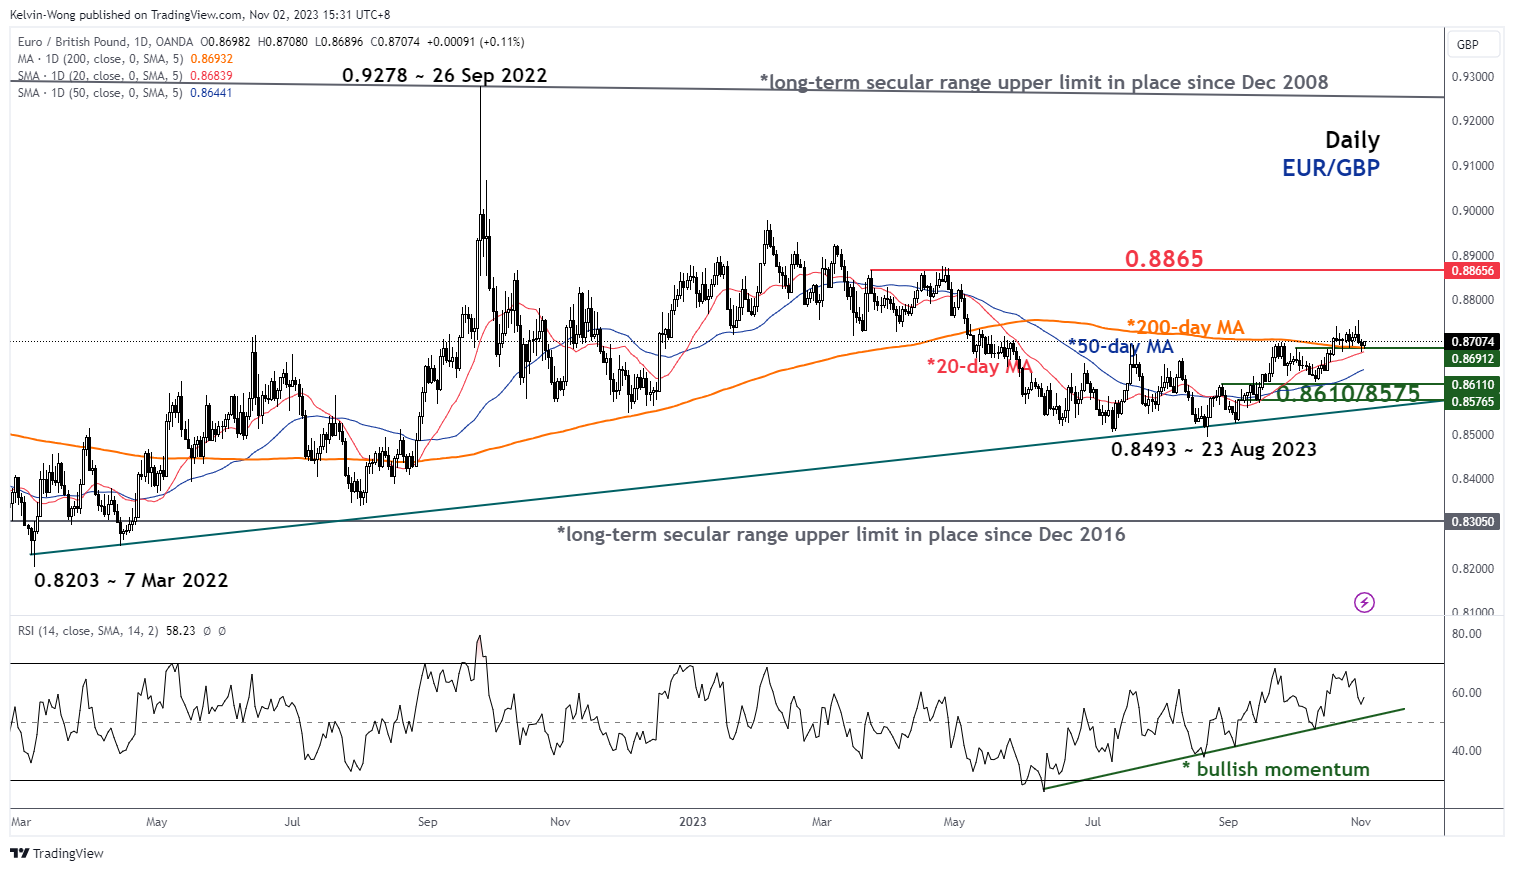
Fig 2: EUR/GBP minor short-term trend as of 2 Nov 2023 (Source: TradingView, click to enlarge chart)
In the short-term as seen in the 1-hour chart, the EUR/GBP has evolved into an impulsive up move sequence within a minor ascending channel in place since the 6 September 2023 low.
Watch the 0.8680 key short-term pivotal support (lower boundary of the ascending channel & 20-day moving average) for a potential push-up to retest the 31 October minor swing high area of 0.8750 before the intermediate resistance at 0.8820 (upper boundary of the ascending channel, 2/3May 2023 swing high & Fibonacci extension).
However, a break below 0.8680 negates the bullish tone for a pull-back toward the next intermediate support at 0.8640 (50-day moving average).
GBPUSD Tests Key Descending Trendline
- GBPUSD slightly higher today as market digests Fed meeting
- It tests again the July 14 aggressive descending trendline
- Momentum indicators remain muted ahead of next key event
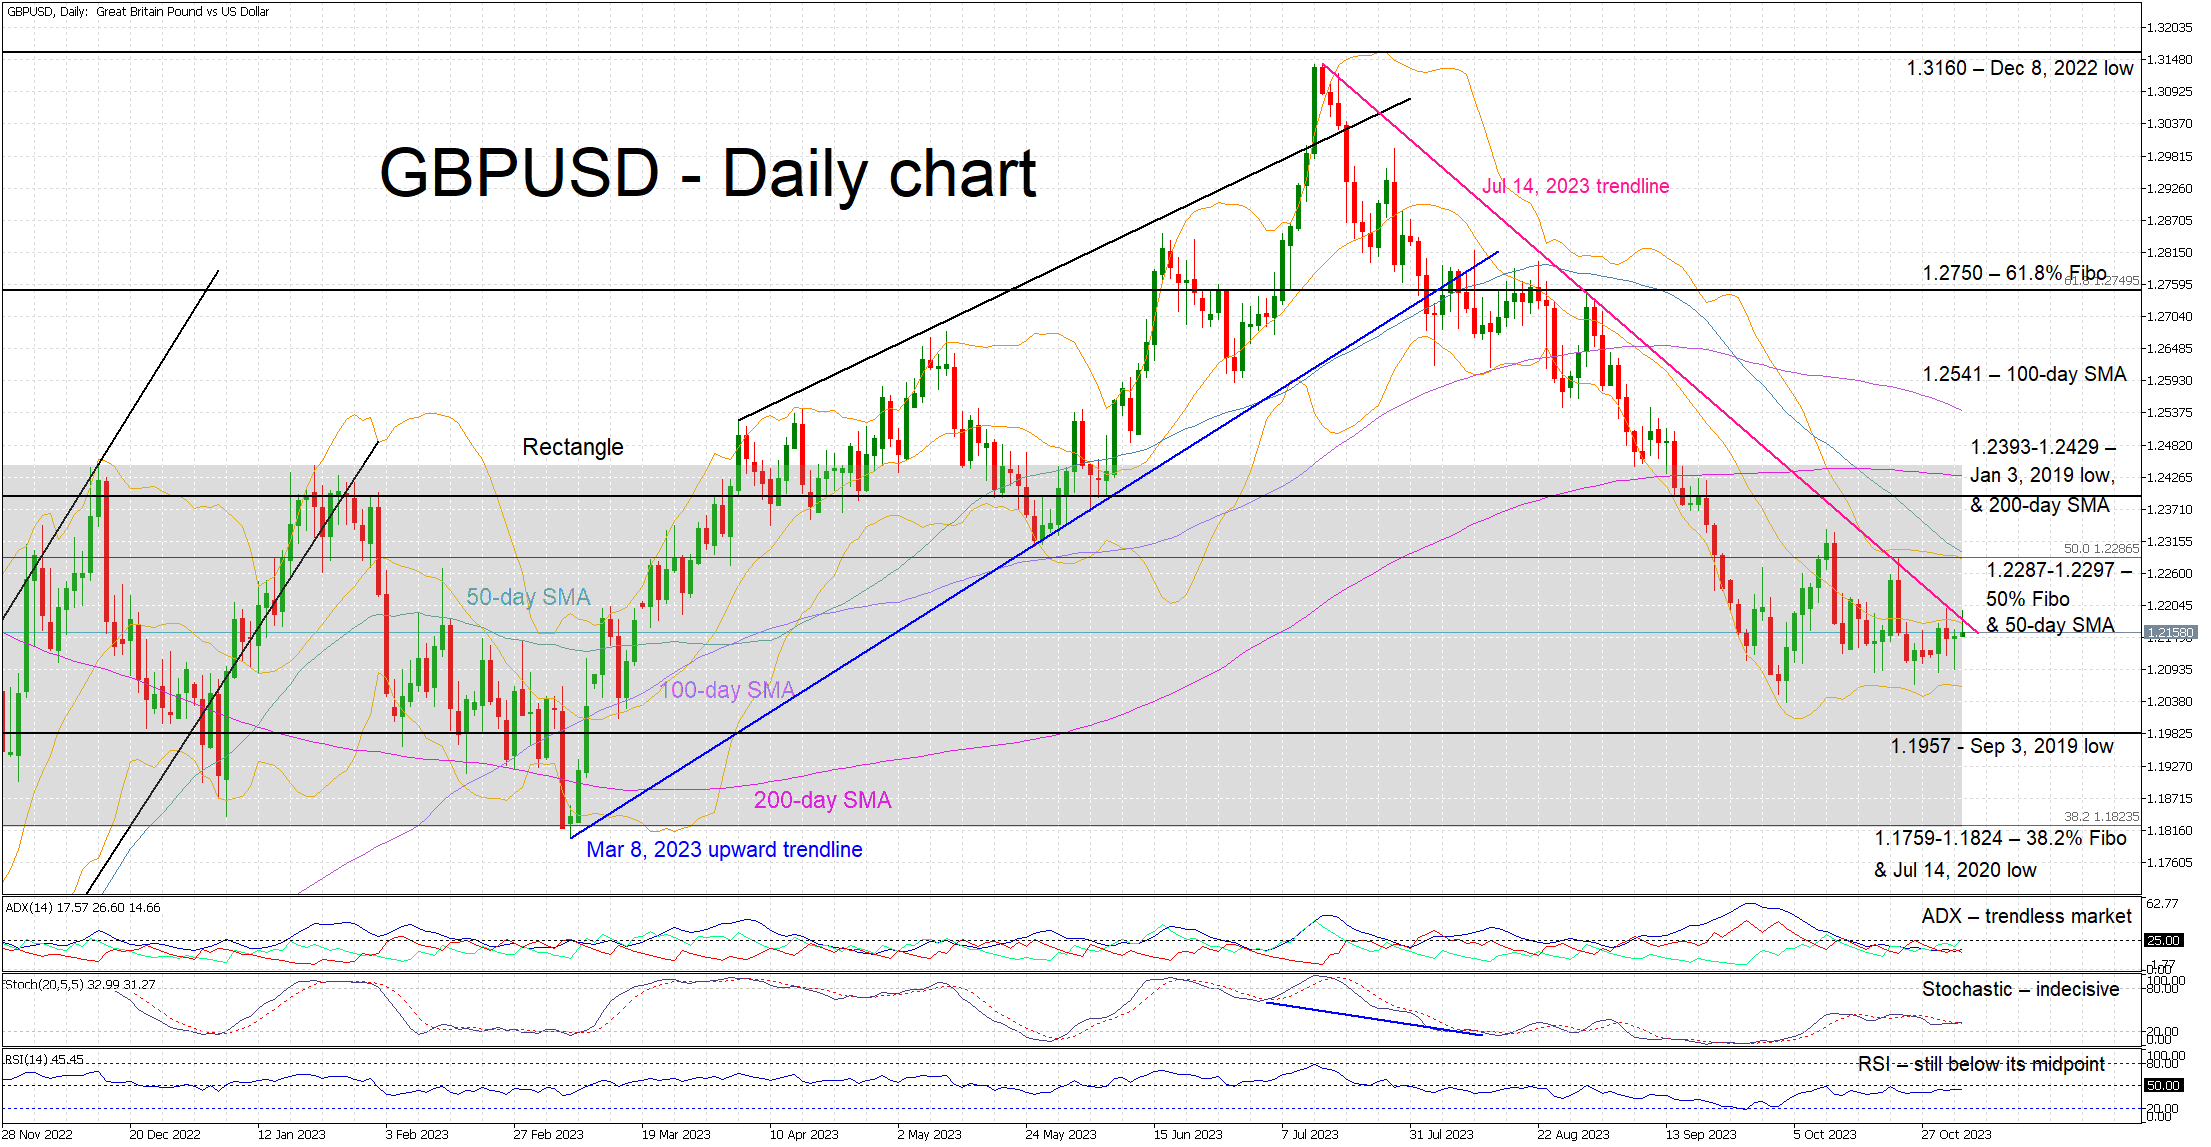
GBPUSD is trading slightly higher, testing the resistance set by the July 14 downward sloping trendline that has defined the downleg since the July 14 high at 1.3141. The pair appears to have recently found a bottom just above the 1.1967 area with volatility slowing down ahead of this week’s key events.
Momentum indicators confirm the current market indecisiveness. The RSI continues to hover a tad below its midpoint with the Average Directional Movement Index (ADX) remaining stuck below its threshold and thus signaling the absence of a strong trend in the market. More interestingly, the stochastic oscillator continues to battle with its moving average, close to its midpoint. The outcome of this battle could determine the next leg in GBPUSD.
Should the bulls feel confident, they could try to finally break the July 14 downward sloping. They could stage a move towards the 1.2287-1.2297 area that is defined by the 50-day simple moving average (SMA) and the 50% Fibonacci retracement of the June 1, 2021 – September 26, 2022 downtrend. Even higher, the 1.2393-1.2429 area could prove a stronger resistance area than currently expected.
On the flip side, the bears could try to defend the July 14 descending trendline and then gradually push GBPUSD towards the September 3, 2019 low at 1.1957. If successful, they could stage a move towards the 1.1759-1.1824 area, populated by the 38.2% Fibonacci retracement, the July 14, 2022 low and the lower boundary of the 1-year long rectangle.
To conclude, GBPUSD bulls have to overcome a key descending trendline if they aim to recover part of the losses incurred on the way down after the July 14 high.
WTI Oil Futures Succumb to Bearish Pressures
- WTI futures decline after rejection at 50-day SMA
- Found their feet around the 80.00 handle, forming potential double bottom
- Momentum indicators deep in the negative zone
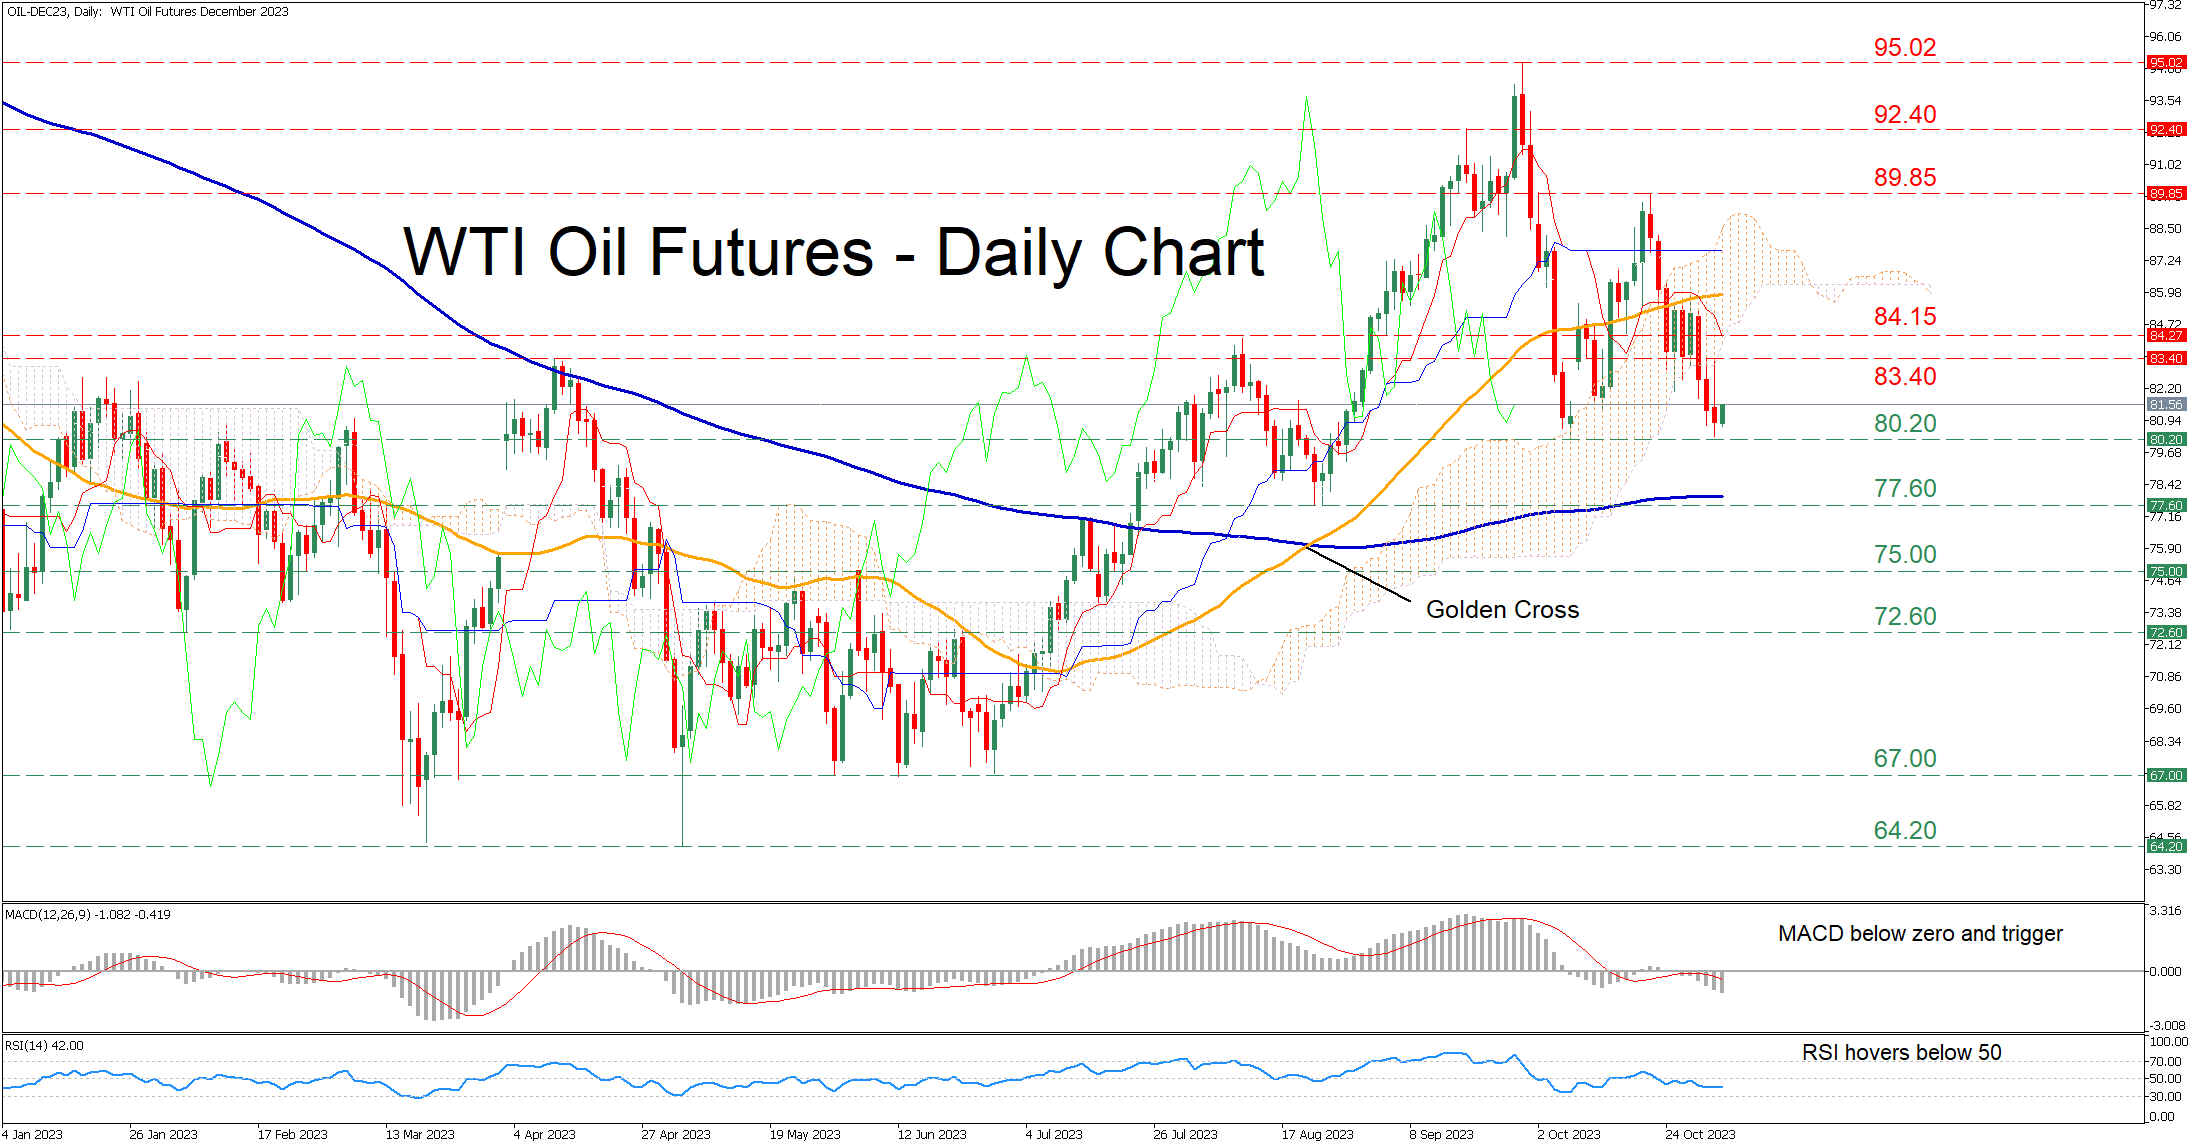
WTI oil futures (December delivery) have been on the retreat since their October peak of 89.85. In the near term, the price’s repeated inability to conquer the 50-day simple moving average (SMA) led to an acceleration of the decline and a fall below the Ichimoku cloud.
Should the bears try to push the price lower, initial support could be met at 80.20, which held strong twice in October. A break below that zone could pave the way for the August low of 77.60 that lies very close to the 200-day SMA. Further declines could then come to a halt at the June resistance of 75.00.
Alternatively, if the price manages to reverse its retreat, the April high of 83.40 could prove to be the first obstacle for the bulls to reclaim. Piercing through that wall, the price may then challenge the August peak of 84.15. Should that barricade also fail, there is no prominent resistance ahead of the October rejection region at 89.85.
In brief, WTI oil futures managed to pause the latest decline for now, but the short-term oscillators remain heavily tilted to the downside. However, the rebound could become more convincing in the case of a double bottom formation.
GBP/JPY Daily Outlook
Daily Pivots: (S1) 182.81; (P) 183.57; (R1) 184.18; More...
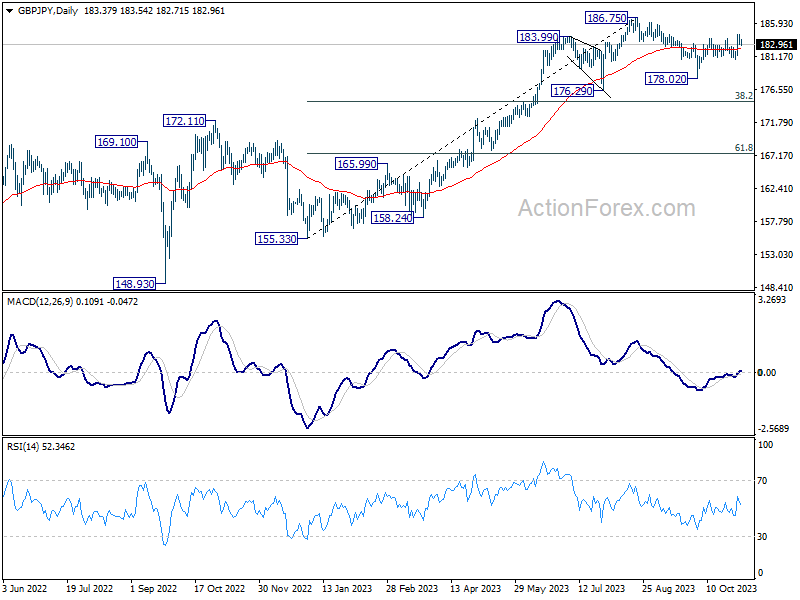
Intraday bias in GBP/JPY is turned neutral with current retreat and some consolidations could be seen. But further rise is expected as long as 180.74 support holds. Above 184.29 will resume the rally from 178.02, and target retest of 186.75 high.
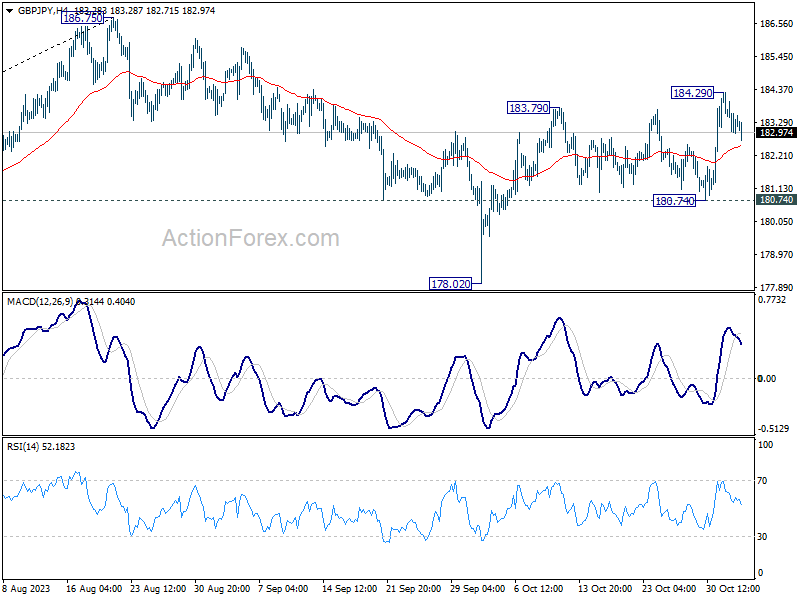
In the bigger picture, fall from 186.75 is seen as a corrective move only. As long as 176.29 support holds, larger up trend from 123.94 (202 low) should still be in progress. Break of 186.75 will target 195.86 (2015 high). Nevertheless, firm break of 176.29 will confirm medium term topping, and bring lengthier and deeper consolidations.
EUR/JPY Daily Outlook
Daily Pivots: (S1) 158.95; (P) 159.69; (R1) 160.32; More....
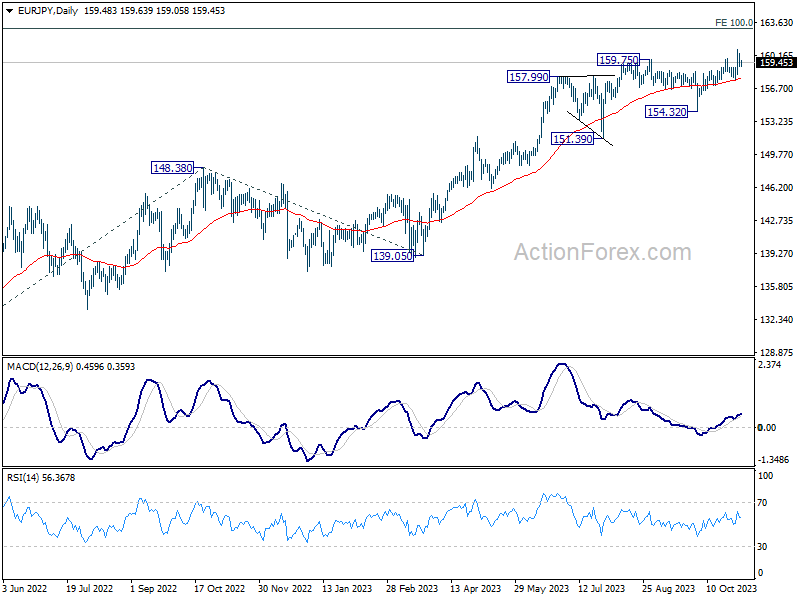
Intraday bias in EUR/JPY is turned neutral with current retreat. Some consolidations could be seen below 160.84 but outlook will stay bullish as long as 157.67 support holds. Break of 160.84 will resume larger rally to 163.06 projection level next.
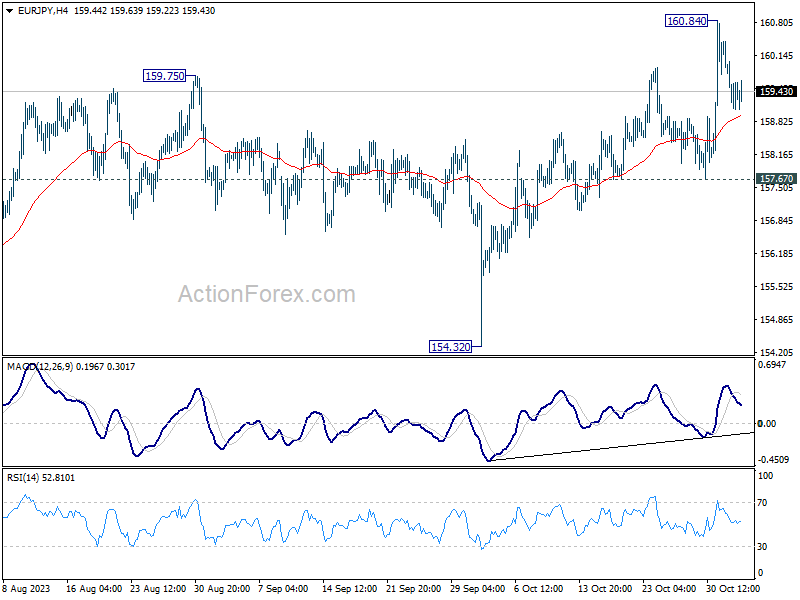
In the bigger picture, rise from 114.42 (2020 low) is in progress. Next target is 100% projection of 124.37 to 148.38 from 139.05 at 163.06. On the downside, break of 154.32 support is needed to be the first sign of medium term topping. Otherwise, outlook will remain bullish even in case of deep pullback.
EUR/GBP Daily Outlook
Daily Pivots: (S1) 0.8684; (P) 0.8698; (R1) 0.8714; More....
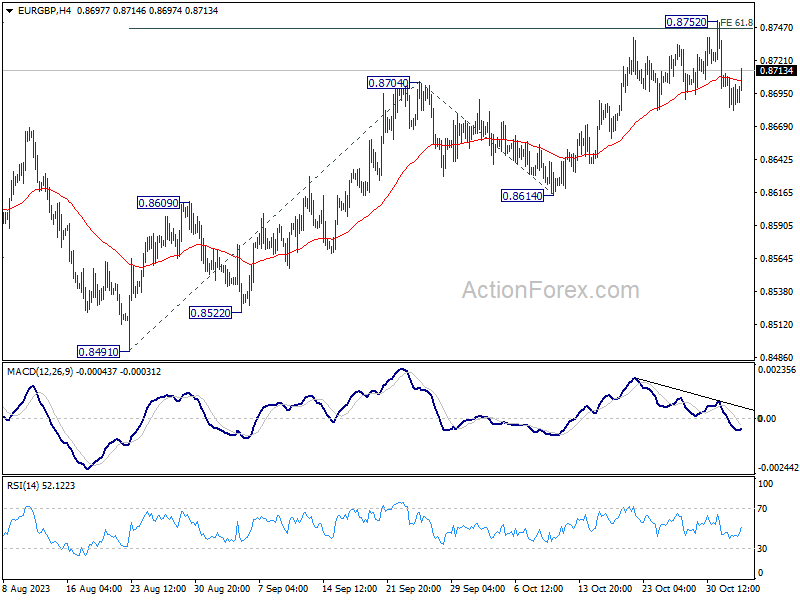
Intraday bias in EUR/GBP remains neutral for the moment as consolidation from 0.8752 is extending. In case of deeper retreat, downside should be contained by 55 D EMA (now at 0.8654). Firm break of 0.8752 will resume the whole rise from 0.8491, and target 100% projection of 0.8491 to 0.8704 from 0.8614 at 0.8827 next. However, sustained break of 55 D EMA will argue that whole rebound from 0.8491 has completed, and bring deeper fall to 0.8614 support.
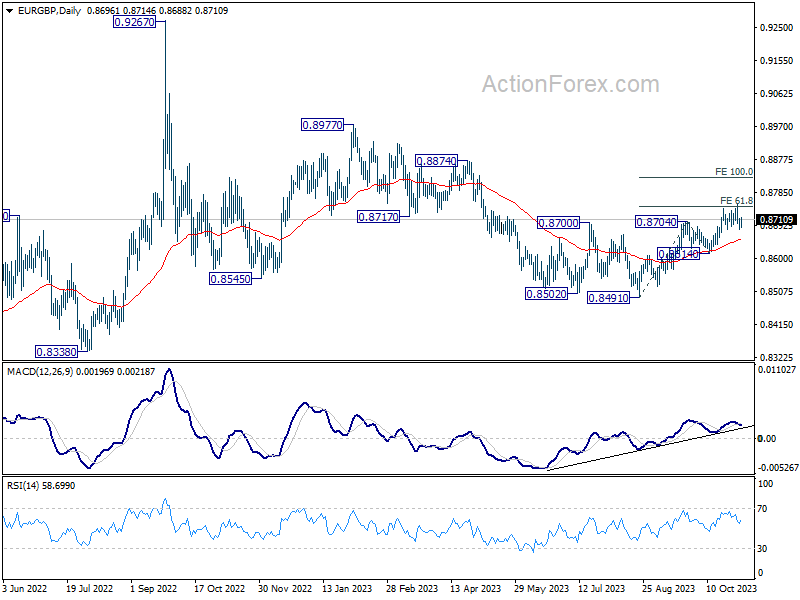
In the bigger picture, current development suggests that whole down trend from 0.9267 (2022 high) has completed with three down to to 0.8491. Rise from 0.8491 is seen as another leg inside that pattern from 0.9499 (2020 high). Further rally should be seen to 0.8977 resistance and above. This will now remain the favored case as long as 0.8614 support holds.
EUR/AUD Daily Outlook
Daily Pivots: (S1) 1.6448; (P) 1.6587; (R1) 1.6671; More...
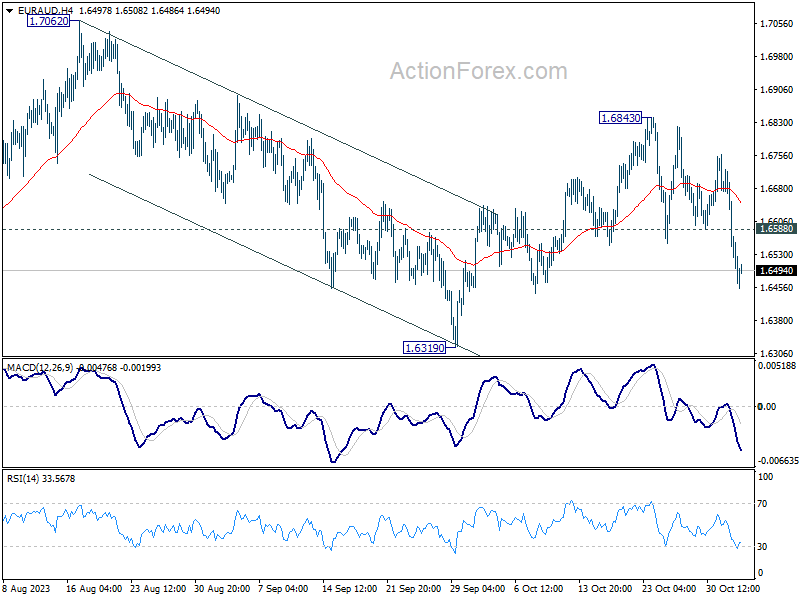
EUR/AUD's strong break of 1.6550 support argues that corrective rebound from 1.6843 has completed. Also, fall from 1.7062 might be ready to resume. Intraday bias is back on the downside for 1.6319 support next. On the upside, above 1.6588 minor resistance will turn intraday bias neutral first.
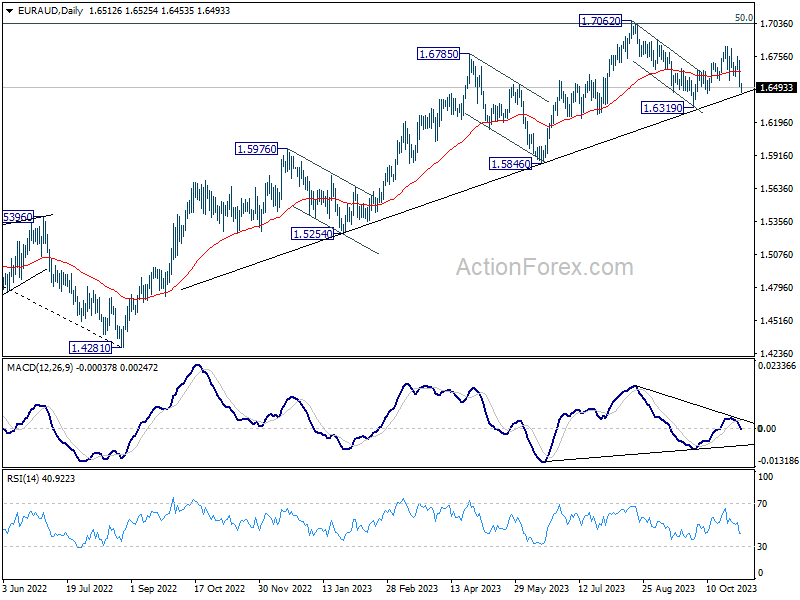
In the bigger picture, the strong support from medium term rising trend line indicates that rise from 1.4281 (2022 low) is still in progress. Sustained break of 1.7062 will pave the way to 61.8% retracement of 1.9799 (2020 high) to 1.4281 at 1.7691. In any case, outlook will stay bullish as long as 1.6319 support holds. However, decisive break of 1.6319 will confirm medium term topping at 1.7062, and bring deeper fall to 1.5846 support.
EUR/CHF Daily Outlook
Daily Pivots: (S1) 0.9567; (P) 0.9598; (R1) 0.9629; More...
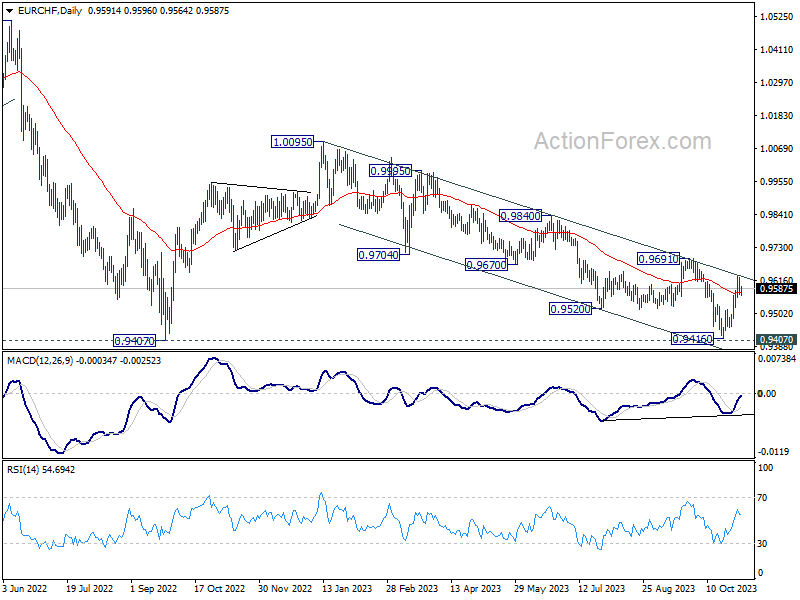
Intraday bias in EUR/CHF is turned neutral with current retreat. Some consolidations could be seen first. But another rise is mildly in favor as long as 0.9513 support holds. Above 0.9627 will resume the rebound from 0.9416 to 0.9691 key structural resistance. Firm break there will carry larger bullish implication.
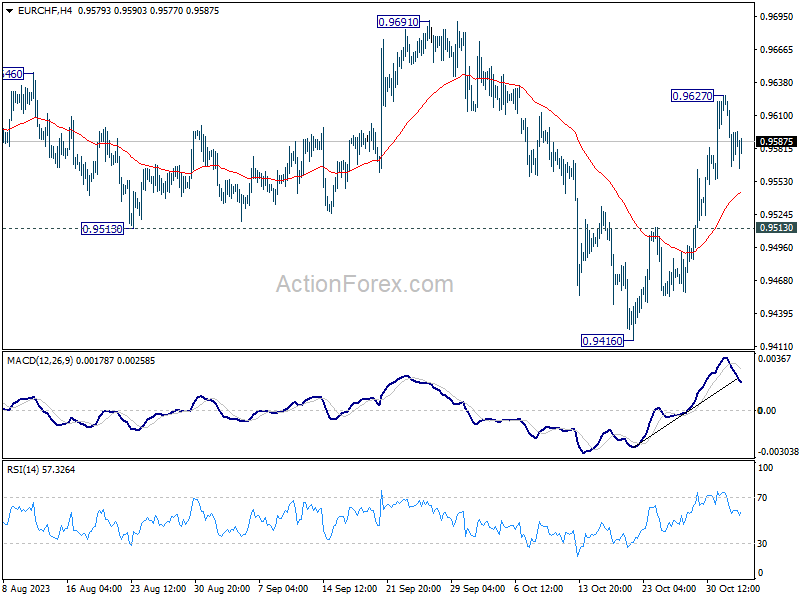
In the bigger picture, down trend from 1.2004 (2018 high) is still in progress. Decisive break of 0.9407 will confirm resumption, and target 61.8% projection of 1.1149 to 0.9407 from 1.0095 at 0.9018. On the upside, break of 0.9691, however, will indicate medium term bottoming just ahead of 0.9407. Further rally could then be seen back towards 1.0095 resistance.