Sample Category Title
NFP Boosts Investor Sentiment, Pressures Dollar and Yields
Investors react favorably to the much-anticipated US Non-Farm Payroll data, sending stock futures soaring while Treasury yields and Dollar weaken. The latest numbers point to a more relaxed labor market, yet with decent job growth, which is what Fed would love to see. Additionally, the slowdown in wage growth suggests some relief for domestic inflation pressures.
In the currency markets, Japanese Yen emerged as the primary winner, appreciating broadly in the wake of the NFP release. New Zealand and Australian Dollars followed suit, buoyed by risk-on sentiment. On the other end of the spectrum, is flaring even worse against the greenback after GDP data. Meanwhile, European majors showed limited enthusiasm, gaining only modestly following NFP.
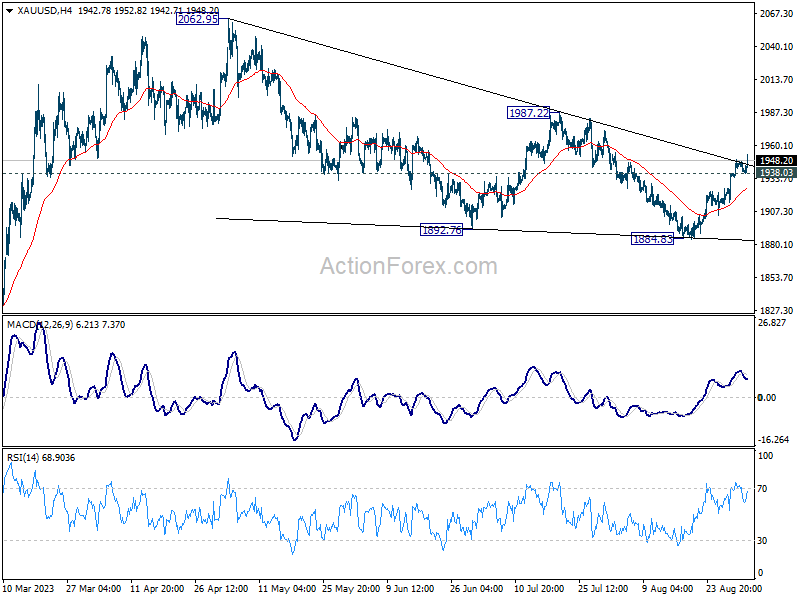
Technically, Gold is making bullish progress by resuming the rally from 1884.84. Break of the trend line resistance affirms the case that corrective pattern from 2062.95 has completed at 1884.83. Further rally would be seen to 1987.22 resistance for confirmation. Nevertheless, break of 1938.03 minor support will mix up the near term outlook.
In Europe, at the time of writing, FTSE is up 0.43%. DAX is down -0.14%. CAC is up 0.20%. Germany 10-year yield is up 0.0142 at 2.479. Earlier in Asia, Nikkei rose 0.28%. China Shanghai SSE rose 0.43%. Japan 10-year JGB yield dropped -0.0157 to 0.632.
US NFP grows 187k, unemployment rate jumps to 3.8%
US non-farm payroll employment grew 187k in August, above expectation of 170k. That's notably lower than the average monthly gain of 271k over the prior 12 months.
Unemployment rate jumped from 3.5% to 3.8%, above expectation of 3.5%, marking the highest level in a year and a half. Number of unemployment persons increased by 514k to 6.4m. Labor force participation rate rose 0.2% to 62.8%, first increase since March.
Average hourly earning rose 0.2% mom, below expectation of 0.3% mom. Over the past 12 months, average hourly earnings have increased by 4.3% yoy.
Canada GDP contracts -0.2% mom in Jun, flat in Jul
Canada's GDP contracted -0.2% mom in June, matched expectations. Services-producing industries was down -0.2% mom. Goods-producing industries were down -0.4% mom. 12 of 20 industrial sectors posted decreases.
Advance information indicates that real GDP was essentially unchanged in July.
UK PMI manufacturing finalized at 43, deepening downturn
UK PMI Manufacturing was finalized at 43.0 in August, down from 45.3 in July. This marks the lowest level since May 2020, underscoring the frailty in the sector. S&P Global highlighted that the demand slackened due to weaker domestic and export conditions. Interestingly, purchase prices have also declined at their fastest rate since January 2016.
Rob Dobson, Director at S&P Global Market Intelligence, described the situation as a "deepening of the UK manufacturing downturn," with the latest PMI reaching a 39-month low. He drew attention to the severity of the contraction rates in output and new orders, which he said are "rarely seen outside of major periods of economic stress, such as the global financial crisis of 2008/09 and the pandemic lockdowns."
Dobson elaborated on multiple economic headwinds affecting demand, including rising interest rates, the ongoing cost-of-living crisis, export losses, and overall market outlook concerns. These conditions have forced manufacturing firms into a "more defensive posture," with cutbacks in purchasing activity, inventory holdings, and staffing levels as they focus on controlling costs and maintaining margins.
Eurozone PMI manufacturing finalized at 43.5, glimmers of hope despite persistent weakness
Eurozone PMI Manufacturing was finalized at 43.5, marking a slight uptick from July's 38-month low of 42.7. Country-level readings reveal that Germany, the largest economy in the Eurozone, remains a cause for concern. Although it reported a two-month high, its PMI of 39.1 underscores its struggles. Spain (46.5), France (46.0), the Netherlands (45.9), Italy (45.4), and Austria (40.6) remained in contraction. Greece and Ireland were above 50-mark at 52.9 and 50.8 respectively.
Cyrus de la Rubia, Chief Economist at Hamburg Commercial Bank, commented on the situation, stating, "These numbers aren't as terrible as they might look at first glance."
Despite the obvious weakness signaled by a PMI below 50, de la Rubia pointed out that all twelve subindices either improved or remained stable. "This indicates that the downward trend from the past few months is starting to lose steam across the board," he added.
However, the cloud over Germany continues to darken. "Germany remains a negative outlier among the big euro countries," de la Rubia noted. This latest data will likely rekindle debates about Germany being the "sick man of Europe", even though it remains one of the most diversified economies in the region.
Swiss CPI up 0.2% mom in Aug, unchanged at 1.6% yoy
Swiss CPI rose 0.2% mom in August, matched expectations. Core CPI (excluding fresh and seasonal products, energy and fuel) rose 0.1% mom. Domestic products prices was flat 0.0% mom. Import products prices rose 0.8% mom.
Compared with the same month a year ago, CPI was unchanged at 1.6% yoy, above expectation of 1.5% yoy. Core CPI slowed from 1.7% yoy to 1.5% yoy. Domestic products prices slowed from 2.3% yoy to 2.2% yoy. Imported products prices rose from -0.6% yoy to -0.3% yoy.
Japan PMI manufacturing finalized at 49.6, input costs inflation at three-month high
Japan's PMI Manufacturing remained stagnant at 49.6 in August, indicating a third consecutive month of sectoral contraction. According to Usamah Bhatti at S&P Global Market Intelligence, the rate of deterioration was "unchanged from July and only fractional," primarily due to a "slower reduction in new orders."
The report highlighted concerning trends in cost pressures. "Input prices rose at a quicker pace for the first time since September 2022, pushing the rate of input cost inflation to a three-month high," Bhatti stated. The escalation in input costs was specifically attributed to high raw material prices, labor costs, and a weakened yen.
Despite these pressures, the report found that manufacturers increased their selling prices at the "weakest rate in two years," indicating that companies may be absorbing the additional costs instead of transferring them to consumers.
The employment situation also emerged as a point of concern. Bhatti noted, "The rate of job creation broadly stalled, with the latest increase the slowest recorded in the 29-month sequence."
China's Caixin PMI manufacturing rose to 51, output and employment see uptick
China's Caixin PMI for manufacturing defied expectations in August, rising from 49.2 to 51.0 and beating market forecasts of 49.4. This indicates a return to expansionary territory. The report noted several key improvements, including increases in output, new business, and a rebound in employment levels. Significantly, input costs rose for the first time since February, suggesting an easing in deflationary pressures.
Wang Zhe, Senior Economist at Caixin Insight Group, elaborated on the data, stating, "In August, the manufacturing sector showed overall improvement. Apart from sluggish exports, the gauges for supply, total demand, and employment were all in expansionary territory." Wang also noted that the "slight rise in prices buffered the pressure of deflation" and that logistics remained smooth.
However, caution still underlines the market's medium-term outlook. According to Wang, "Looking ahead, seasonal impacts will gradually subside, but the problem of insufficient internal demand and weak expectations may form a vicious cycle for a longer period of time." Wang also warned that "combined with the uncertainty in external demand, the downward pressure on the economy may continue to increase."
PBOC slashes FX RRR
Chinese Yuan saw a sharp uptick after PBoC announced a substantial 200 bps cut in foreign exchange reserve requirement ratio to 4% from 6%, effective September 15. According to PBoC, the move aims to "improve financial institutions' ability to use foreign exchange funds."
This RRR cut is set to release approximately USD 16.4B in foreign exchange, based on China's FX deposits standing at USD 821.8B as of end-July. Market analysts also note that the FX RRR reduction could have the added effect of lowering dollar funding costs in the interbank market, thereby alleviating some of downward pressure on Yuan.
USD/JPY Mid-Day Outlook
Daily Pivots: (S1) 145.17; (P) 145.72; (R1) 146.10; More...
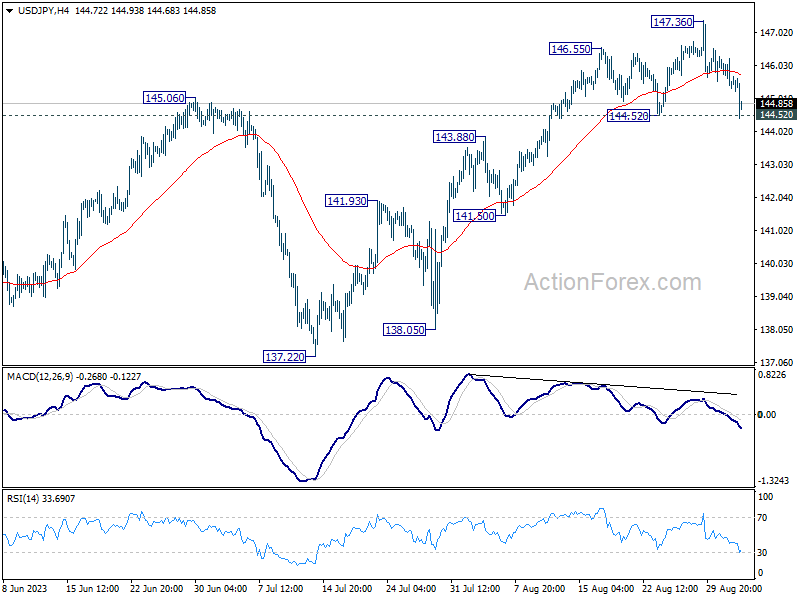
USD/JPY falls notably in early US session but it's still trying to defend 144.52 support. Intraday bias stays neutral first. Strong rebound from current level, follow by break of 147.36, will resume the rise from 127.20 to retest 151.93 high. On the downside, however, firm break of 144.52 should confirm short term topping, and turn bias back to the downside for 55 D EMA (now at 143.04) and possibly below.
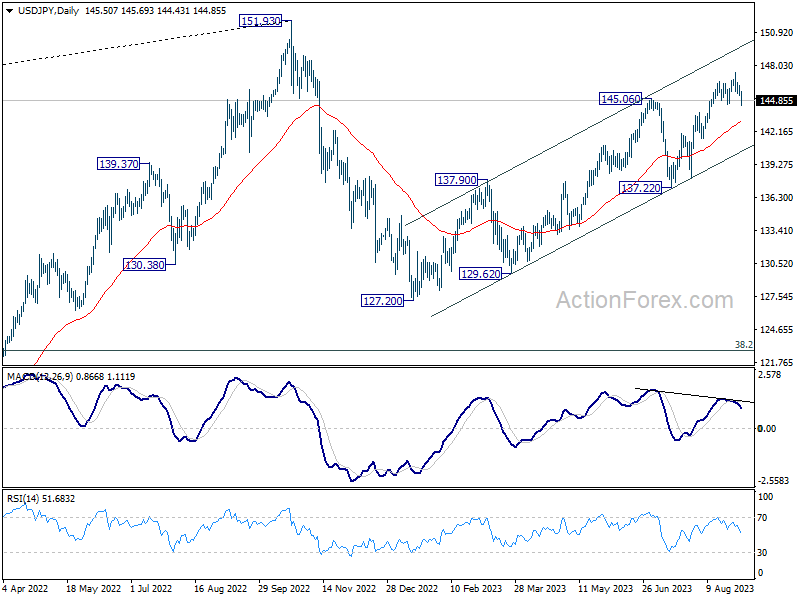
In the bigger picture, overall price actions from 151.93 (2022 high) are views as a corrective pattern. Rise from 127.20 is seen as the second leg of the pattern and could still be in progress. But even in case of extended rise, strong resistance should be seen from 151.93 to limit upside. Meanwhile, break of 137.22 support should confirm the start of the third leg to 127.20 (2023 low) and below.
Economic Indicators Update
| GMT | Ccy | Events | Actual | Forecast | Previous | Revised |
|---|---|---|---|---|---|---|
| 23:50 | JPY | Capital Spending Q2 | 4.50% | 7.90% | 11.00% | |
| 00:30 | JPY | Manufacturing PMI Aug F | 49.6 | 49.7 | 49.7 | |
| 01:45 | CNY | Caixin Manufacturing PMI Aug | 51 | 49.4 | 49.2 | |
| 06:30 | CHF | CPI M/M Aug | 0.20% | 0.20% | -0.10% | |
| 06:30 | CHF | CPI Y/Y Aug | 1.60% | 1.50% | 1.60% | |
| 07:30 | CHF | PMI Manufacturing Aug | 39.9 | 41.5 | 38.5 | |
| 07:45 | EUR | Italy Manufacturing PMI Aug | 45.4 | 45.9 | 44.5 | |
| 07:50 | EUR | France Manufacturing PMI Aug F | 46 | 46.4 | 46.4 | |
| 07:55 | EUR | Germany Manufacturing PMI Aug F | 39.1 | 39.1 | 39.1 | |
| 08:00 | EUR | Eurozone Manufacturing PMI Aug F | 43.5 | 43.7 | 43.7 | |
| 08:30 | GBP | Manufacturing PMI Aug F | 43 | 42.5 | 42.5 | |
| 12:30 | CAD | GDP M/M Jun | -0.20% | -0.20% | 0.30% | 0.20% |
| 12:30 | USD | Nonfarm Payrolls Aug | 187K | 170K | 187K | 157K |
| 12:30 | USD | Unemployment Rate Aug | 3.80% | 3.50% | 3.50% | |
| 12:30 | USD | Average Hourly Earnings M/M Aug | 0.20% | 0.30% | 0.40% | |
| 13:30 | CAD | Manufacturing PMI Aug | 49.6 | |||
| 13:45 | USD | Manufacturing PMI Aug F | 47 | 47 | ||
| 14:00 | USD | ISM Manufacturing PMI Aug | 46.6 | 46.4 | ||
| 14:00 | USD | ISM Manufacturing Prices Paid Aug | 42.9 | 42.6 | ||
| 14:00 | USD | ISM Manufacturing Employment Index Aug | 44.4 | |||
| 14:00 | USD | Construction Spending M/M Jul | 0.50% | 0.50% |
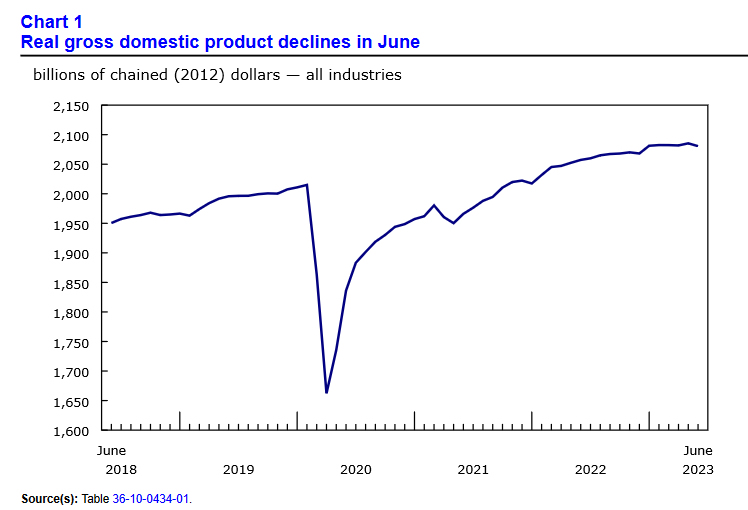
Canada GDP contracts -0.2% mom in Jun, flat in Jul
Canada's GDP contracted -0.2% mom in June, matched expectations. Services-producing industries was down -0.2% mom. Goods-producing industries were down -0.4% mom. 12 of 20 industrial sectors posted decreases.
Advance information indicates that real GDP was essentially unchanged in July.
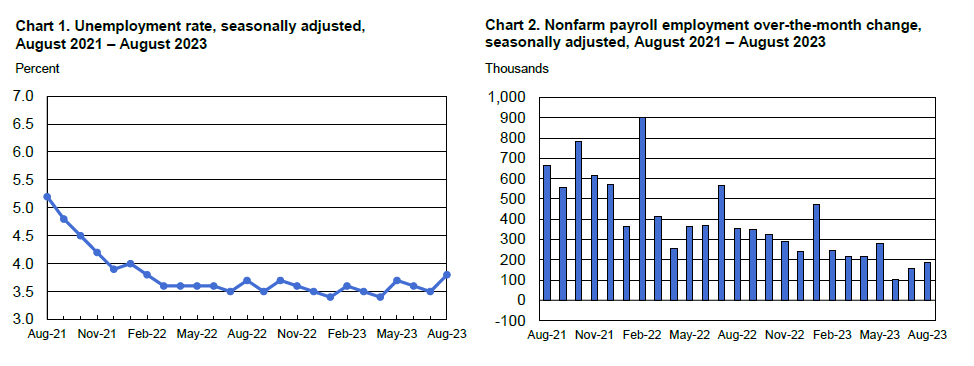
US NFP grows 187k, unemployment rate jumps to 3.8%
US non-farm payroll employment grew 187k in August, above expectation of 170k. That's notably lower than the average monthly gain of 271k over the prior 12 months.
Unemployment rate jumped from 3.5% to 3.8%, above expectation of 3.5%, marking the highest level in a year and a half. Number of unemployment persons increased by 514k to 6.4m. Labor force participation rate rose 0.2% to 62.8%, first increase since March.
Average hourly earning rose 0.2% mom, below expectation of 0.3% mom. Over the past 12 months, average hourly earnings have increased by 4.3% yoy.
Market Wiped out Tuesday’s Gains; Down-Trend Asserted in BTC
Market picture
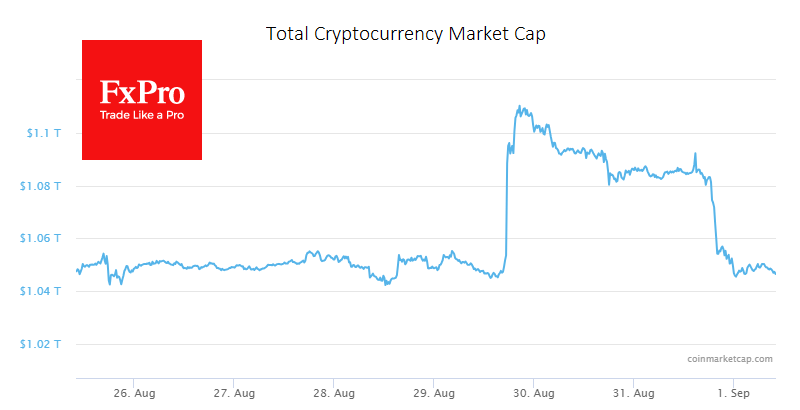
The crypto market lost 3.5% in 24 hours, again falling below $1.05 trillion. The formal start of the sell-off was the news that the SEC had delayed its review of bitcoin ETF applications. The decline paused, anticipating further triggers, completely erasing Tuesday’s upswing.
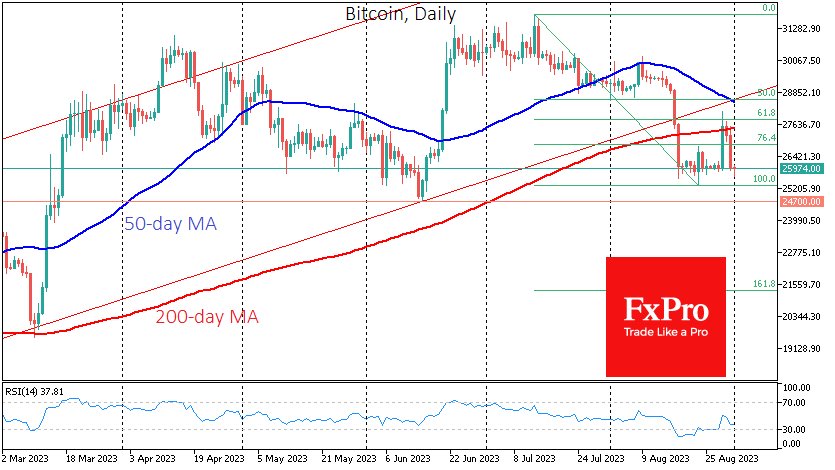
Bitcoin ended August down 11% at $26K, its worst performance since last November and the second consecutive month of declines. Technically, the recent pullback has confirmed that BTC’s 200-day average is now acting as a resistance. According to the Fibonacci pattern, the potential downside target is the $21.3K area. However, a drop to $24.7K also looks like an impressive short-term target for the bears.
Regarding seasonality, September is considered the worst month of the year for BTC. Over the past 12 years, Bitcoin has only ended the month up three times and down nine times. The average decline was 13%, and the average gain was 11%.
News Background
JPMorgan notes that the crypto market has reached fundamentals because of a large liquidation of positions, predicting a gradual easing of pressure on digital currencies.
Bloomberg raised the odds of a spot bitcoin ETF being approved in 2023 to 75%, and to 95% by the end of 2024, following the Grayscale court ruling. Grayscale said it was unsure whether it would refile to convert its GBTC ETF into a spot bitcoin ETF.
A New York district court dismissed a class action lawsuit against decentralised exchange Uniswap, stating that the platform was not liable for fraudulent tokens traded on it.
Canadian Dollar Eyes GDP, US Jobs Data
- Canada’s GDP expected to ease in Q2
- US nonfarm employment payrolls expected to dip to 177,000
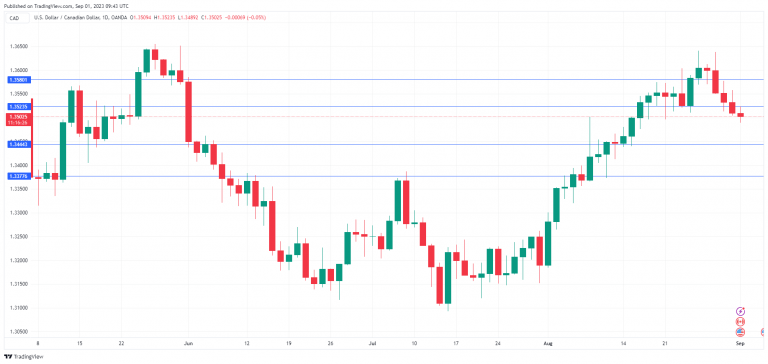
The Canadian dollar is calm in the European session, trading at 1.3500, down 0.07%. I expect to see stronger movement from USD/CAD in the North American session, as Canada releases second-quarter GDP and the US publishes the July employment report.
Canada’s GDP expected to slow in Q2
Canada usually releases employment reports on the same day as the US, but Canada’s July jobs report won’t be released until next week. Instead, today we have Canada’s GDP, a key release, along with the US employment release.
Canada’s economy rebounded in the first quarter, as GDP rose 0.8% q/q. This beat the consensus estimate of 0.4% and added support to the case for the Bank of Canada raising rates at the September 6th meeting. However, today’s GDP report could chill rate hike expectations if the economy took a step backward in the second quarter. The consensus estimate for Q2 GDP stands at 0.3% q/q, which would indicate weak economic growth. If GDP is stronger than expected, the odds of a rate hike will likely increase. The GDP report is the final key release out of Canada prior to the rate meeting, which adds significance to the GDP release.
Investors will also be keeping a close eye on the July US employment report, highlighted by nonfarm payrolls. On Wednesday, ADP Employment Change fell sharply to 177,000, down from a revised 371,000. The nonfarm payroll report is expected to decline slightly to 170,000, compared to 187,000 in the previous reading.
If nonfarm payrolls is within expectations, it will mark the third straight month of gains below 200,000, a clear sign that the US economy is cooling. This would not only cement an expected pause by the Federal Reserve next week but would also bolster the case for the Fed to hold rates for the next few months and possibly into 2024.
USD/CAD Technical
- USD/CAD tested resistance at 1.3523 earlier. Above, there is resistance at 1.3580
- 1.3444 and 1.3377 are providing support
Dollar Index: Dollar Steady but in Quiet Mode ahead of US NFP Report
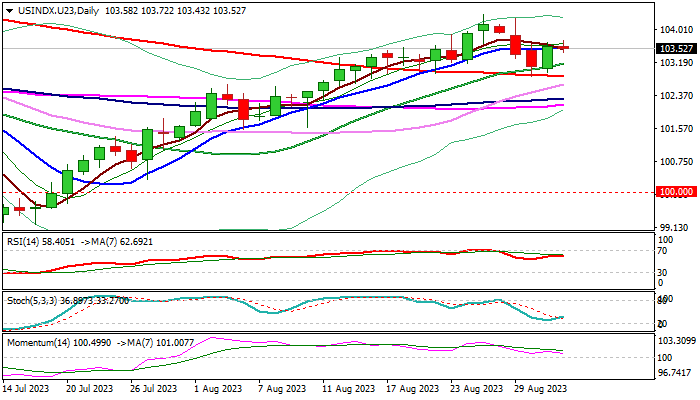
The dollar index steadies on Friday morning following 0.5% advance on Thursday, but range narrows ahead of key release today – US NFP report.
Daily chart picture remains positive as 14-d momentum indicator stays above the centreline and moving averages are in bullish setup, with additional support from Thursday’s bullish engulfing pattern, but fresh recovery still requires more work at the upside and close above 103.80 (Fibo 61.8% of 104.37/102.84 pullback) to generate reversal signal and mark a higher low at 102.84 (Aug 30 low).
On the other hand, fundamentals are likely to play a key role today, with NFP numbers to define dollar’s near-term direction.
Markets were discouraged by recent US economic data (weaker Q2 GDP, job openings plunged, drop in consumer confidence and private sector jobs report below expectations) which boost concerns about stronger economic slowdown.
Median forecast shows expectations for 170K new jobs added in August, vs 187K previous month, with any significant divergence from consensus to cause stronger impact to the greenback.
Generally, softer than expected Aug numbers would warn that conditions in so far tight US labor market are weakening, indicating growing negative impact from high interest rates and suggesting that Fed should stay on hold with interest rates.
The dollar may come under increased pressure on stronger NFP miss and risk drop towards targets at 102.40/101.90, on break of pivotal support at 102.85 (200DMA).
Alternatively, strong NFP beat would offer fresh support and lift the dollar.
Res: 103.80; 104.01; 104.37; 104.59.
Sup: 103.43; 103.16; 102.92; 102.40.
UK PMI manufacturing finalized at 43, deepening downturn
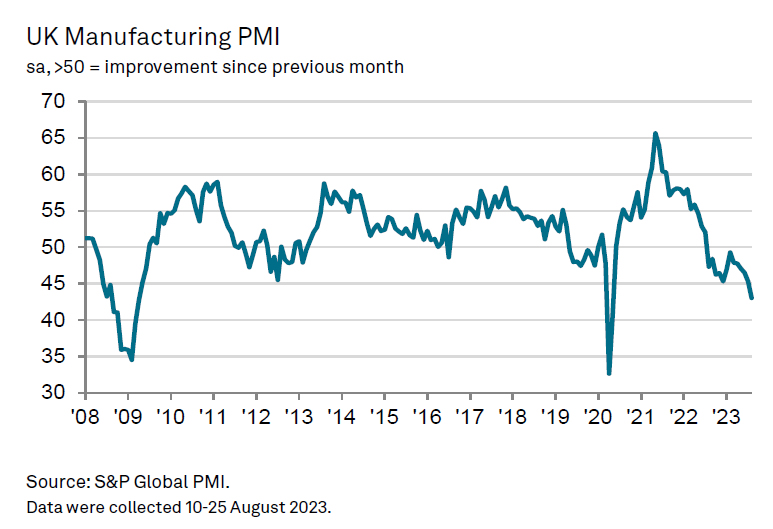
UK PMI Manufacturing was finalized at 43.0 in August, down from 45.3 in July. This marks the lowest level since May 2020, underscoring the frailty in the sector. S&P Global highlighted that the demand slackened due to weaker domestic and export conditions. Interestingly, purchase prices have also declined at their fastest rate since January 2016.
Rob Dobson, Director at S&P Global Market Intelligence, described the situation as a "deepening of the UK manufacturing downturn," with the latest PMI reaching a 39-month low. He drew attention to the severity of the contraction rates in output and new orders, which he said are "rarely seen outside of major periods of economic stress, such as the global financial crisis of 2008/09 and the pandemic lockdowns."
Dobson elaborated on multiple economic headwinds affecting demand, including rising interest rates, the ongoing cost-of-living crisis, export losses, and overall market outlook concerns. These conditions have forced manufacturing firms into a "more defensive posture," with cutbacks in purchasing activity, inventory holdings, and staffing levels as they focus on controlling costs and maintaining margins.
Gold Price and Crude Oil Price Turn Green
Gold price is showing positive signs above the $1,925 pivot level. Crude oil price is rising and it could climb further higher toward the $85 resistance.
Important Takeaways for Gold and Oil Prices Analysis Today
- Gold price started a fresh increase above $1,920 and $1,925 against the US Dollar.
- A key bullish trend line is forming with support at $1,932 on the hourly chart of gold at FXOpen.
- Crude oil prices are also moving higher above the $82.00 resistance zone.
- There is a connecting bullish trend line forming with support near $82.80 on the hourly chart of XTI/USD at FXOpen.
Gold Price Technical Analysis
On the hourly chart of Gold at FXOpen, the price started a fresh increase from the $1,900 zone. The price was able to clear the $1,925 resistance to move into a bullish zone.
There was a steady increase above the 50-hour simple moving average. Finally, the bears appeared near $1,950. The price is now correcting gains below the $1,942 level and the 50-hour simple moving average.
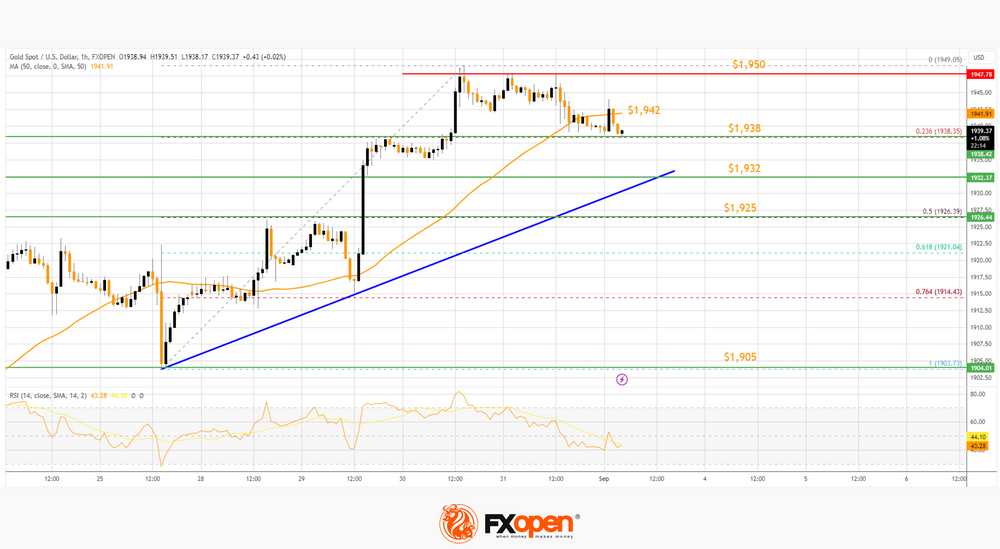
The RSI is back below 50 and the price is testing the 23.6% Fib retracement level of the upward move from the $1,903 swing low to the $1,950 high. There is also a key bullish trend line forming with support at $1,932.
If the bulls remain active, the price could start a fresh increase. Immediate resistance is near the 50-hour simple moving average at $1,942. The next major resistance is near the $1,950 level. An upside break above the $1,950 resistance could send Gold price toward $1,965. Any more gains may perhaps set the pace for an increase toward the $1,980 level.
Initial support on the downside is near the $1,938 level. The first major support is near the trend line at $1,932. The main support is near the 50% Fib retracement level of the upward move from the $1,903 swing low to the $1,950 high at $1,925.
If there is a downside break below the $1,925 support, the price might decline further. In the stated case, the price might drop toward the $1,905 support.
Oil Price Technical Analysis
On the hourly chart of WTI Crude Oil at FXOpen, the price started a decent increase against the US Dollar. The price gained bullish momentum after it broke the $80.65 resistance as mentioned in the previous analysis.
There was a sustained upward move above the $82.00 and $82.50 resistance levels. The bulls pushed the price toward $83.50. The current price action is positive above the 50-hour simple moving average and RSI is well above 60.
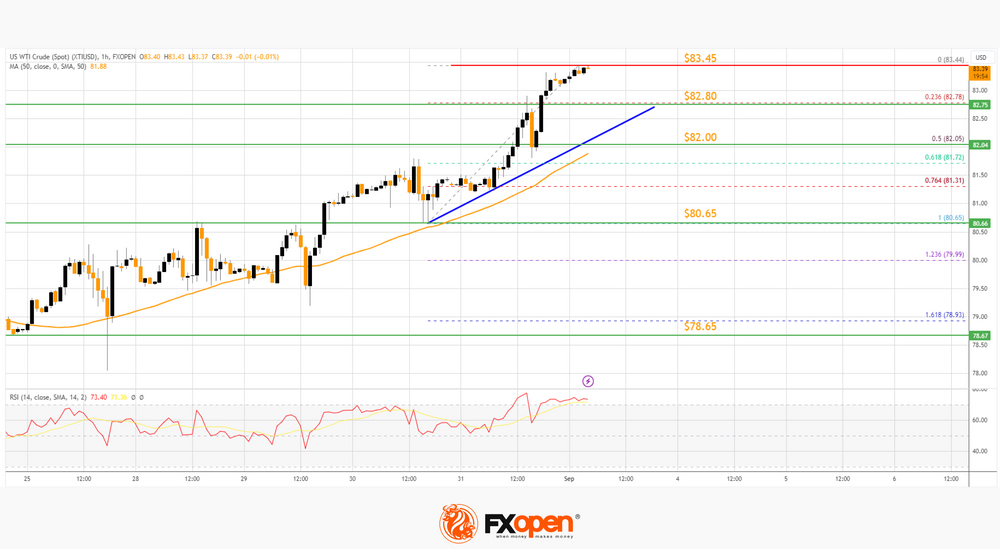
If the price climbs further higher, it could face resistance near $83.80. The first major resistance is near the $84.20 level. Any more gains might send the price toward the $85.00 level.
Conversely, the price might correct gains and test the 23.6% Fib retracement level of the upward move from the $80.65 swing low to the $83.44 high at $82.80. There is also a connecting bullish trend line forming with support near $82.80.
The next major support on the WTI crude oil chart is near the 50% Fib retracement level of the upward move from the $80.65 swing low to the $83.44 high at $82.00.
If there is a downside break, the price might decline toward $80.65. Any more losses may perhaps open the doors for a move toward the $78.65 support zone.
This article represents the opinion of the Companies operating under the FXOpen brand only. It is not to be construed as an offer, solicitation, or recommendation with respect to products and services provided by the Companies operating under the FXOpen brand, nor is it to be considered financial advice.
NZDUSD Trapped Below Key Average
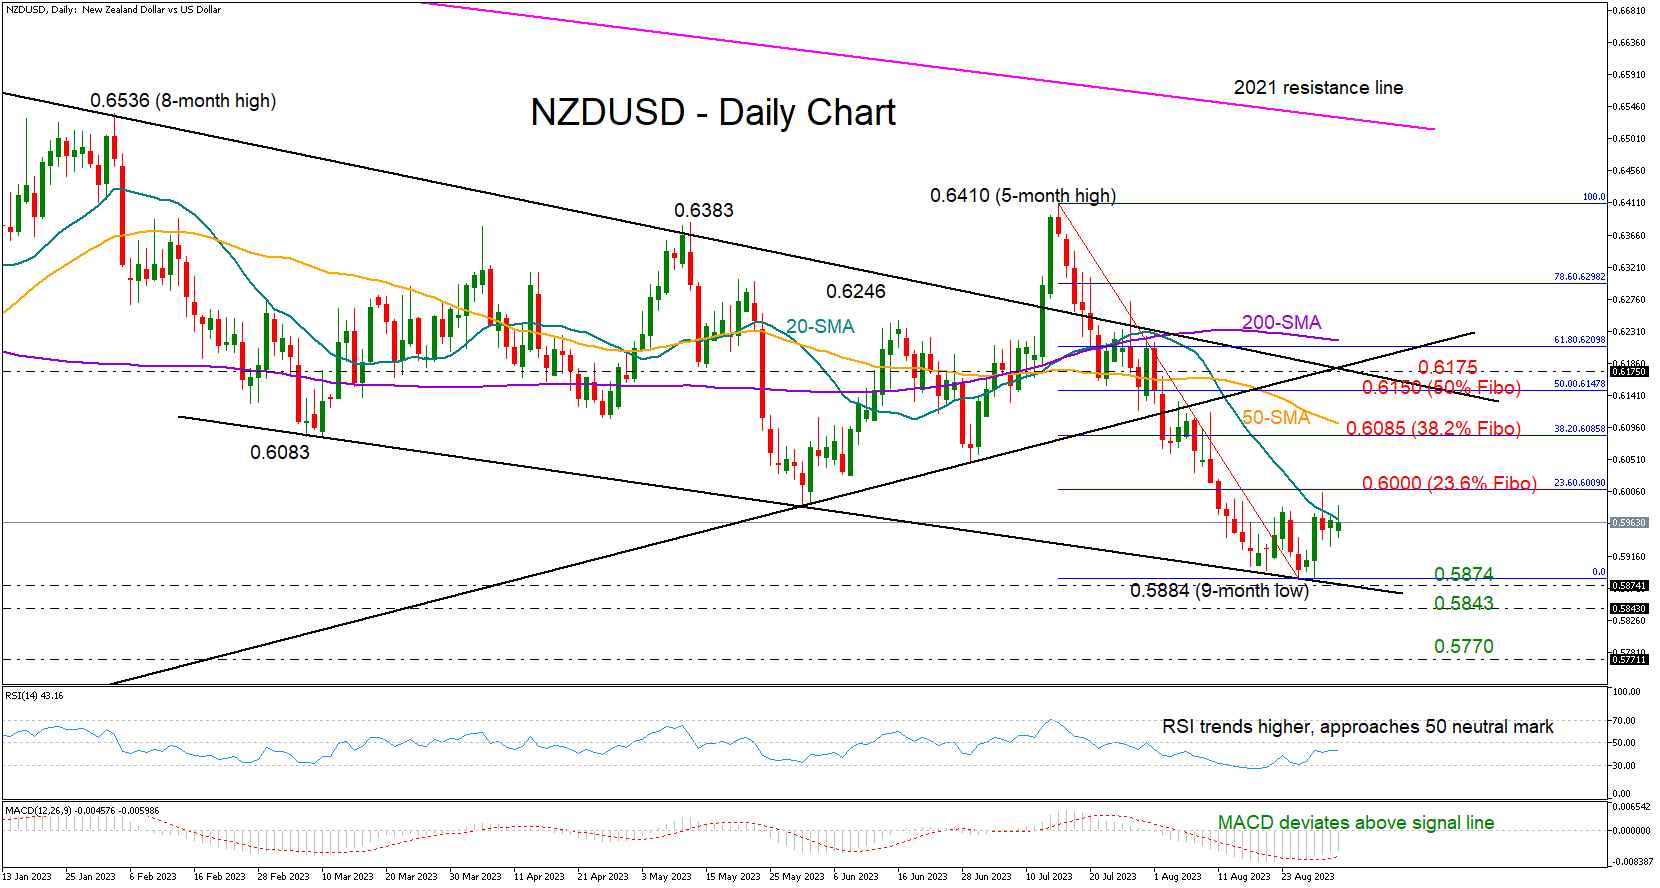
NZDUSD staged a nice rebound up to 0.6000 at the start of the week, but the 20-day simple moving average (SMA) proved a heavy obstacle ahead of the US jobs data, limiting gains around 0.5967.
The upside reversal in the momentum indicators is feeding optimism the bulls may stay in play in the coming sessions. Yet, traders may wisely wait for a close above the 0.6000 round level, which overlaps with the 23.6% Fibonacci retracement of the latest downleg, before driving the price to the 38.2% Fibonacci of 0.6085. Even higher, the 50% Fibonacci mark of 0.6150 and the 0.6175 zone, where the key trendlines from 2022 lows and highs intersect each other, could put a break on bullish forces. The 61.8% Fibonacci at 0.6200 and the 200-day SMA are also nearby.
In the event the 20-day SMA holds firm, the price may revisit the familiar support line from March at 0.5874. The 0.5843 constraining zone, which helped the price to pivot higher in October-November 2022 and April 2020, might come into consideration too. If the latter gives way, the downtrend could stretch towards the 0.5770 barrier.
Of note, the bearish SMA crosses are indicating a bear market going forward.
Summing up, there are downside risks to NZDUSD despite the latest bounce in the price. A decisive rally above 0.6000 is now needed to generate fresh bullish actions.
USDCAD Pulls Back from 3-month Peak
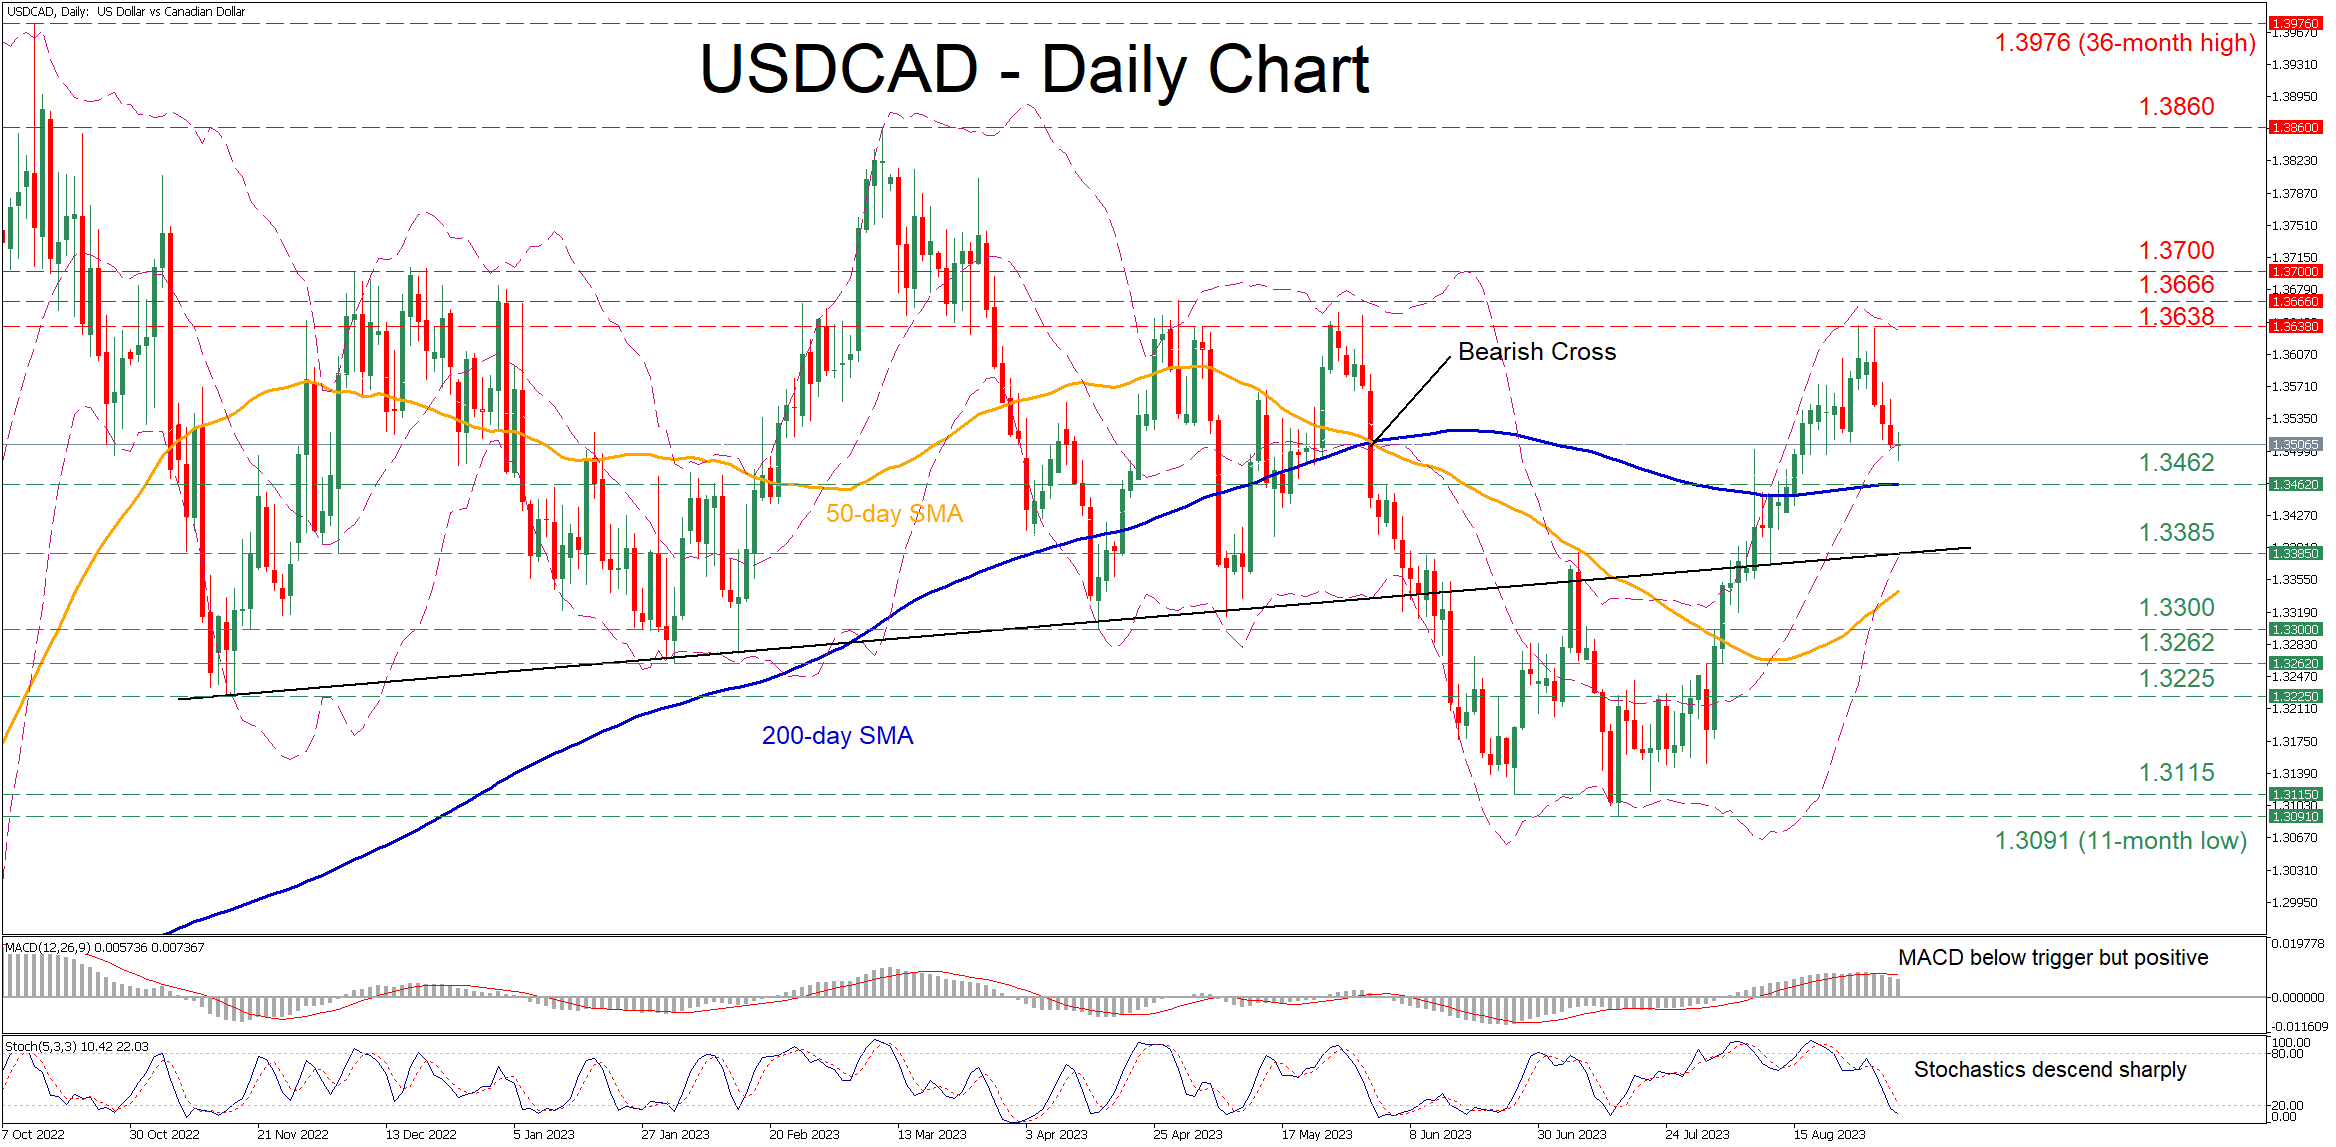
USDCAD had been stuck in a steep uptrend after finding its feet at the 11-month low of 1.3091 in mid-July. However, the pair has been undergoing a downside correction since its rejection at a fresh three-month peak of 1.3638 on Tuesday.
The momentum indicators currently suggest that the bullish forces are fading. Specifically, the MACD is softening below its red signal line in the positive zone, while the stochastics are descending sharply near the 20-oversold mark.
Should the bears attempt to push the price lower, immediate support could be found at the 200-day simple moving average (SMA), currently at 1.3462. Sliding beneath that floor, the pair could retreat towards the May resistance of 1.3385, which might now serve as support. A violation of that territory could open the door for the April bottom of 1.3300 ahead of the February low of 1.3262.
Alternatively, bullish actions could propel the price higher towards the recent rejection region of 1.3638. Surpassing that hurdle, the pair may face the April high of 1.3666 before it marches towards the 1.3700 psychological mark. Further advances could then cease at the 2023 peak of 1.3860 registered in March.
In brief, USDCAD has been losing ground in the last few daily sessions since its latest advance encountered strong resistance at a fresh three-month high. Nevertheless, it's too early to call for a sustained downtrend, unless the price breaks profoundly below the 200-day SMA.