
Sample Category Title
Norges Bank Expected to Hold Rate Steady Amid Middle East Uncertainty
In focus today
In Norway, we expect Norges Bank (NB) to keep the policy rate unchanged at 4% at today's meeting, in line with market expectations. Due to the great uncertainty and fluctuations in financial factors related to the situation in the Middle East, we expect NB to signal an unchanged policy rate until there is more information about the development in energy prices and the consequences for inflation. We expect NB to emphasize that they are ready to hike the policy rate if inflation remains high or rises. We expect the rate path in the Monetary Policy Report to show an unchanged policy rate for the rest of the year, followed by a cautious decline in the coming years. The risk is on the upside, as the rate path could indicate a certain probability of a rate hike later this year, driven by an increase in global rate expectations.
In Sweden, trade balance and household lending data for February will be released.
In the European Parliament, MEPs will vote on advancing the EU-US Turnberry trade deal amid uncertainty surrounding tariffs. The deal includes safeguards such as ensuring the pact takes effect only when the US commits to the agreed 15% tariff ceiling and a solution for steel and aluminium. If cleared in parliament, it moves to member state negotiations.
Economic and market news
What happened yesterday
In Sweden, the Riksbank Minutes revealed a board slightly divided on how to deal with supply shocks. Seim and Thedéen are open to frontloaded rate hikes, whereas Jansson, Bunge, and the newest member, Hjelm promote a gradual, wait-and-see approach. Hjelm prefers to see through the supply shocks, even in an adverse scenario. Like Jansson, Hjelm warns against overreacting, emphasising the risks of a policy U-turn. Our conclusion is that the Riksbank will show high readiness to act in May if the conflict persists and continues to impact intermediate goods. The money market shaved off 5-6 basis points from the 2026 curve. Read more in Riksbank Minutes - March 2026, 25 March.
The NIER survey was a mixed picture, with the overall ETI index remaining basically flat, manufacturing showing some improvement, and consumer confidence deteriorating. Retail price plans were largely unchanged.
In Germany, the Ifo index for March showed the same picture as the ZEW index with expectations falling significantly but the current situation holding up. Expectations declined to 86.0 as expected from 90.2 while the assessment of the current situation remained at 86.7 which was better than expected. The war in Iran is thus yet to affect growth in Germany, but it is clearly expected to have a negative effect in the coming months. However, the decline in expectations is significantly lower than what happened at the onset of the war in Ukraine in 2022.
In the UK, February inflation data figures aligned closely with expectations, with headline at 3.0% y/y, core at 3.2% y/y, and services at 4.3% y/y. This confirms that the disinflationary trend remains largely intact. However, data is quite outdated, as investors are now leaning towards a rate hike from the Bank of England in April.
Oil prices climbed above USD 100/bbl amid once again conflicting headlines from the Middle East. Iran dismissed the US-proposed ceasefire plan as 'excessive' and set forth demands, including authority over the Strait of Hormuz and war compensation. Strikes continued across the Gulf region this morning.
Equities: Equities continued higher yesterday, Stoxx 600 up 1.4% and S&P 500 up 0.5%. This was a geopolitical reversal trade, with cyclicals outperforming defensives, yet a selective one, as investors are at best cautiously optimistic. Materials, health care, consumer discretionary and industrials up 1-2%. Oil prices have edged somewhat higher again over night and as a result, Asian markets are down 1-2% this morning. US and European equity futures are -0.5% lower this morning.
Interesting dynamics in the tech space yesterday. Big tech mostly higher, along with semis and memory companies, while the software space was weaker again. Trigger for the move was Broadcom out yesterday saying that is experiencing significant supply chain constraints due to surging AI chip demand straining production capacity. These pressures are now spilling over beyond semiconductors into PCBs and other components, with capacity limitations pushing lead times from approximately six weeks out to six months. If a company of Broadcom's scale is running into these constraints the situation further down the value chain is likely to look even more challenging. Similarly, CPU giants Intel and AMD notified customers of price increases. The backdrop is the same story, with worsening supply constraints pushing delivery lead times from 1-2 weeks to 12 weeks or longer. This is a theme to monitor closely ahead of the upcoming Q1 earnings season, as a shortage of components could impact many sectors.
FI and FX: Yesterday was relatively quiet in FX and FI markets. Brent crude traded around the USD100/bbl level, NOK and SEK rebounded slightly and yields fell as the market was relieved of a day with no major news shocks from the Middle East. EUR/USD continued to trade around the 1.16 level.
EUR/USD Daily Outlook
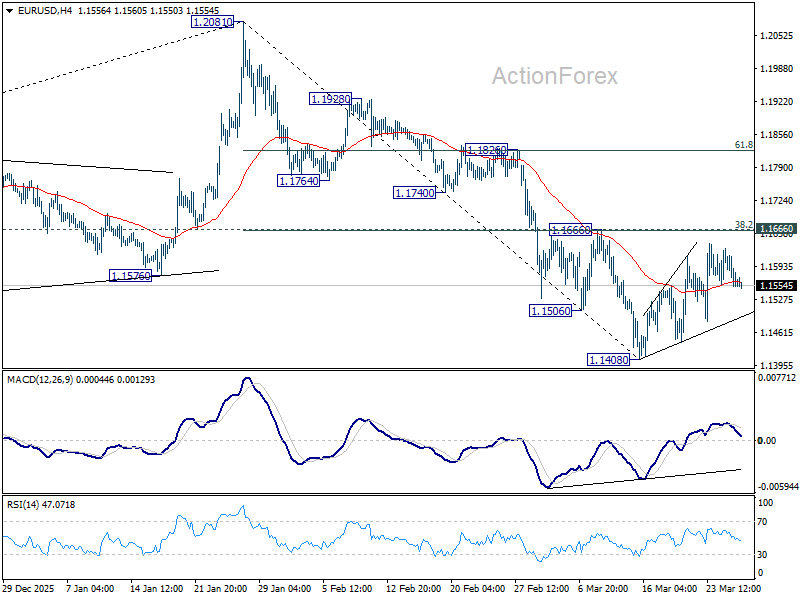
Daily Pivots: (S1) 1.1532; (P) 1.1582; (R1) 1.1608; More….
EUR/USD is still extending consolidations above 1.1408 and intraday bias stays neutral. With 1.1666 cluster resistance (38.2% retracement of 1.2081 to 1.1408 at 1.1665) intact, further decline is in favor. On the downside, below 1.1408 will resume the fall from 1.2081 to 38.2% retracement of 1.0176 to 1.2081 at 1.1353. However, decisive break of 1.1666 will argue that the fall from 1.2081 has completed, and turn bias back to the upside for 61.8% retracement of 1.2081 to 1.1408 at 1.1824.
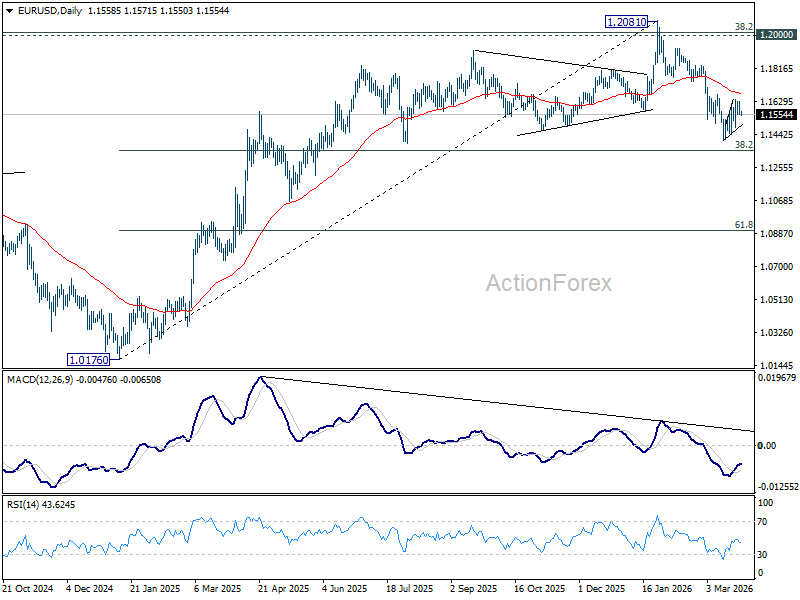
In the bigger picture, prior break of 55 W EMA (now at 1.1501) should confirm rejection by 1.2 key cluster resistance level. The whole up trend from 0.9534 (2022 low) might have completed as a three wave corrective rise too. Deeper fall is expected to long term channel support (now at 1.0528). Meanwhile, risk will stay on the downside as long as 1.2081 holds, even in case of strong rebound.
USD/JPY Daily Outlook
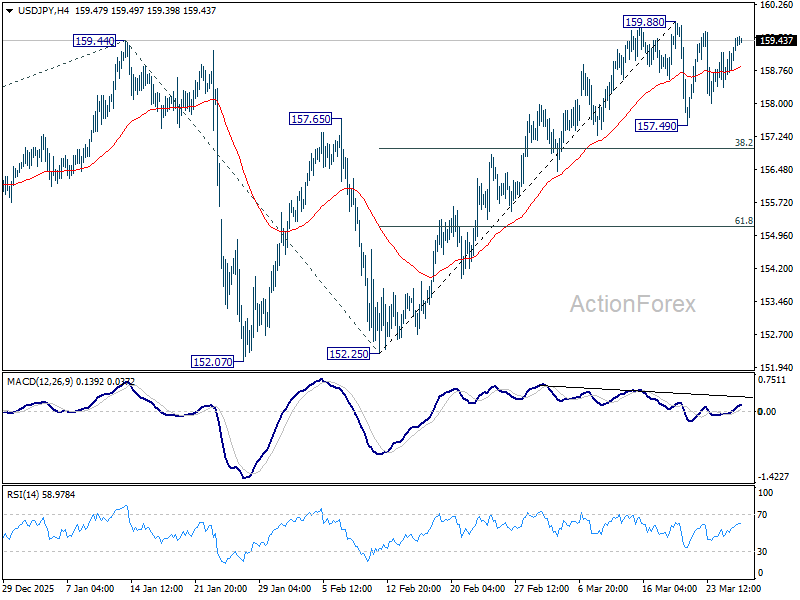
Daily Pivots: (S1) 158.80; (P) 159.15; (R1) 159.82; More...
USDJPY is still extending consolidations below 159.88 and intraday bias remains neutral. In case of another dip, downside should be contained by 38.2% retracement of 152.25 to 159.88 at 156.96 to bring rebound. On the upside, break of 159.88 will target a test on 161.94 high.
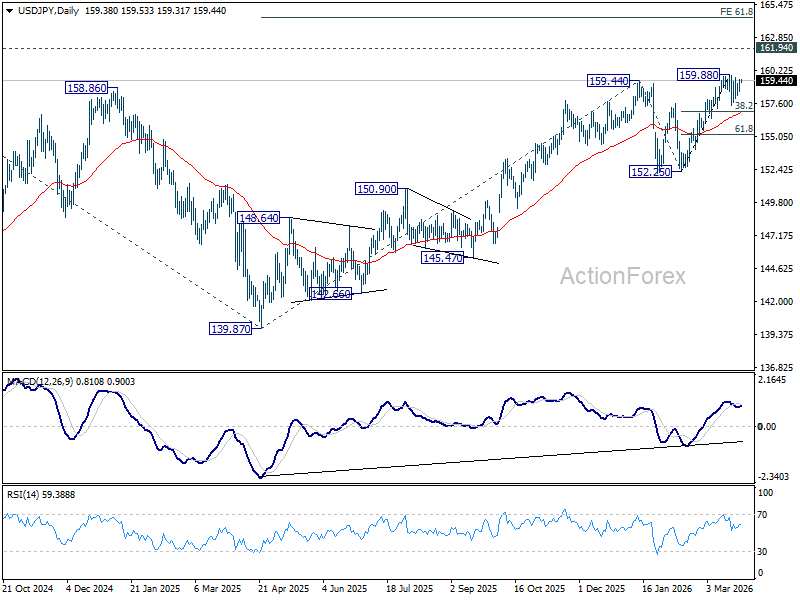
In the bigger picture, outlook is unchanged that corrective pattern from 161.94 (2024 high) should have completed with three waves at 139.87. Larger up trend from 102.58 (2021 low) could be ready to resume through 161.94. This will remain the favored case as long as 55 W EMA (now at 152.70) holds. Firm break of 161.94 will pave the way to 61.8% projection of 102.58 to 161.94 from 139.87 at 176.75.
GBP/USD Daily Outlook
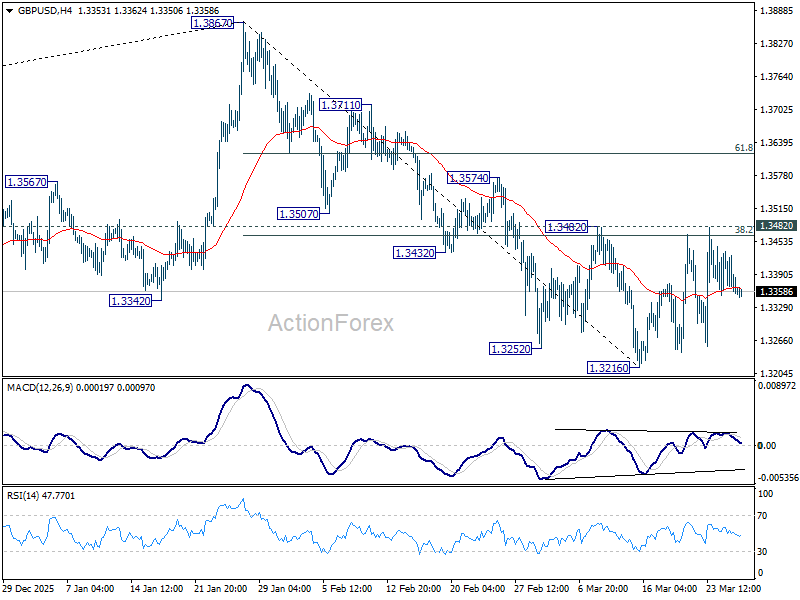
Daily Pivots: (S1) 1.3336; (P) 1.3386; (R1) 1.3415; More...
GBP/USD is still bounded in range trading and intraday bias stays neutral. With 1.3482 resistance intact, further decline is in favor. On the downside, below 1.3216 will resume the fall from 1.3867 to 1.3008 structural support. However, decisive break of 1.3482 will argue that the fall from 1.3867 has completed, and turn bias back to the upside for 61.8% retracement of 1.3867 to 1.3216 at 1.3618.
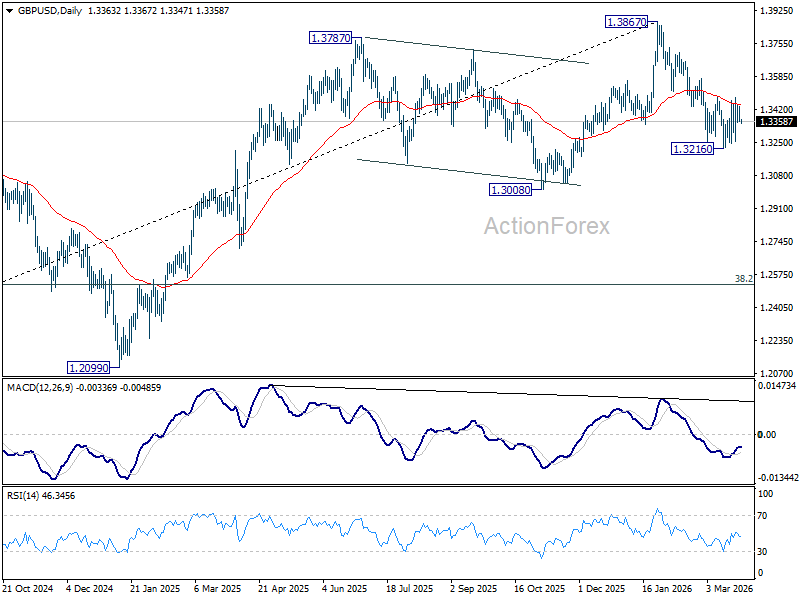
In the bigger picture, considering bearish divergence condition in both D and W MACD, a medium term top should be in place at 1.3867. Firm break of 1.3008 support will argue that fall from 1.3867 is at least correcting the rise from 1.0351 (2022 low) with risk of bearish reversal. That would open up further decline to 38.2% retracement of 1.0351 to 1.3867 at 1.2524. For now, medium term outlook will be neutral at best as long as 1.3867 resistance holds, or until further development.
USD/CHF Daily Outlook
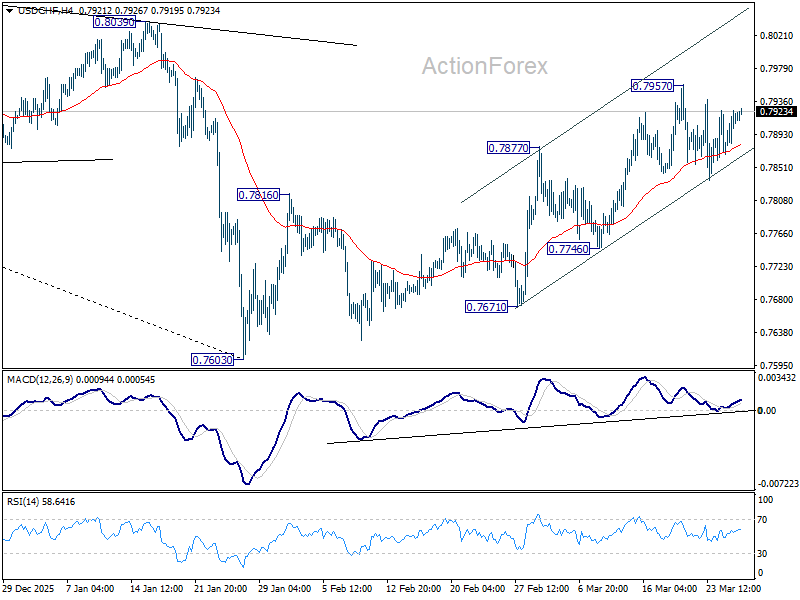
Daily Pivots: (S1) 0.7882; (P) 0.7904; (R1) 0.7939; More….
Intraday bias in USD/CHF remains neutral for the moment, as consolidations continue below 0.7957. As noted before, rise from 0.7603 should be correcting whole decline from 0.9200. Above 0.7957 will target 38.2% retracement of 0.9200 to 0.7603 at 0.8213. This will remain the favored case as long as 0.7746 support holds.
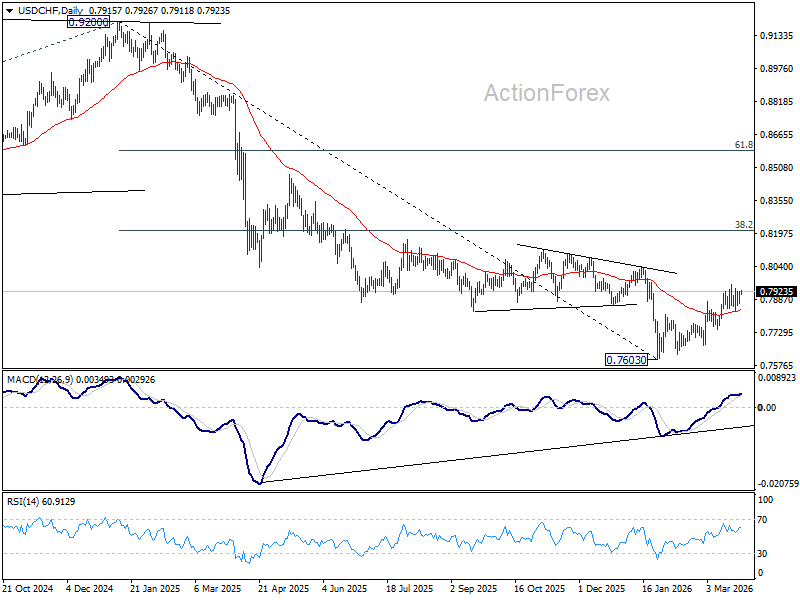
In the bigger picture, a medium term bottom should be in place at 0.7603 on bullish convergence condition in D MACD. Rebound from there is seen as correcting the fall from 0.9200 only. However, decisive break of 55 W EMA (now at 0.8085) will suggest that it's probably correcting the larger scale down trend from 1.0146 (2022 high). On the other hand, rejection by the 55 W EMA will setup down trend resumption to 100% projection of 1.0146 (2022 high) to 0.8332 from 0.9200 at 0.7382 at a later stage.
USD/CAD Daily Outlook
Daily Pivots: (S1) 1.3766; (P) 1.3794; (R1) 1.3838; More...
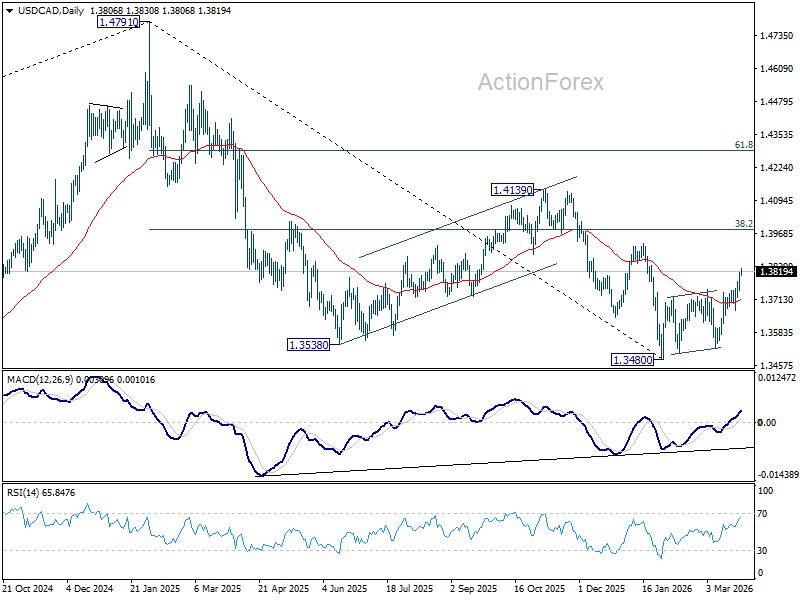
USD/CAD's rally from 1.3480 continues today and intraday bias stays on the upside. The rebound is seen as correcting the whole down trend from 1.4791 and should target 1.3927 resistance, or probably further to 38.2% retracement of 1.4791 to 1.3480 at 3981. On the downside, below 1.3771 minor support will turn intraday bias neutral first.
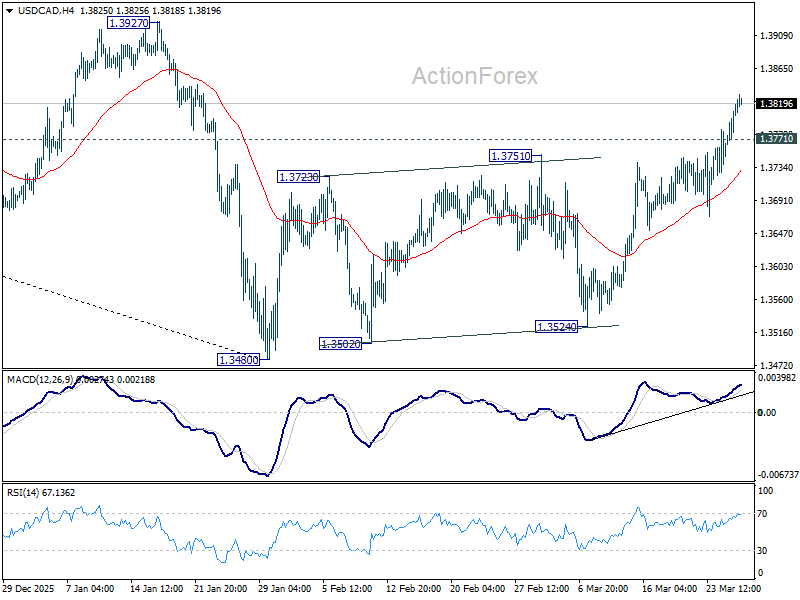
In the bigger picture, price actions from 1.4791 are seen as a corrective pattern to the whole up trend from 1.2005 (2021 low). Deeper fall could be seen, as the pattern extends, to 61.8% retracement of 1.2005 to 1.4791 at 1.3069. However, break of 1.3927 resistance will argue that the correction has completed with three waves down to 1.3480 already.
AUD/USD Daily Report
Daily Pivots: (S1) 0.6925; (P) 0.6965; (R1) 0.6987; More...
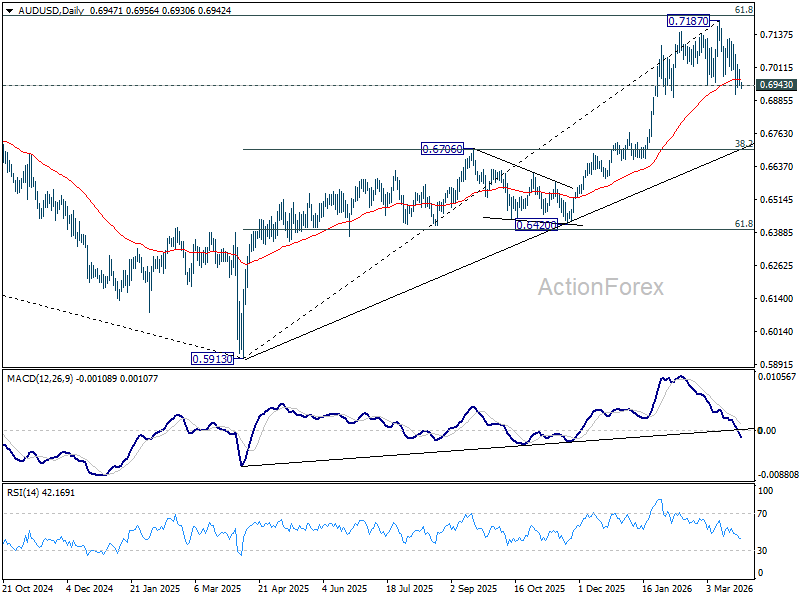
AUD/USD continues to press 0.6943 key support but there is no clean break yet. Intraday bias remains neutral first. On the downside, decisive break of 0.6943 should confirm rejection by 0.7206 key fibonacci resistance. That would set up deeper correction to the whole up trend from 0.5913, and target 38.2% retracement of 0.5913 to 0.7187 at 0.6700. Nevertheless, break of 0.7061 minor resistance will retain near term bullishness, and bring retest of 0.7187 high first.
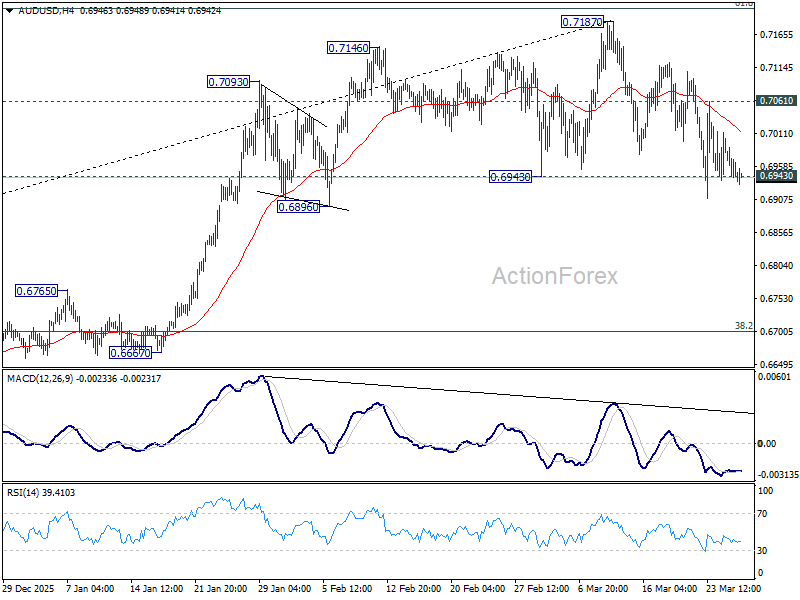
In the bigger picture, current development argues that rise from 0.5913 (2024 low) is reversing whole down trend from 0.8006 (2021 high). Decisive break of 61.8% retracement of 0.8006 to 0.5913 at 0.7206 will pave the way back to 0.8006. This will remain the favored case as long as 0.6706 resistance turned support holds, even in case of deep pullback.
Aussie’s Fertilizer Trap: Urea Price Explosion Squeezes AUD
The stalled US-Iran negotiations have shifted global "Fear Trade" focus toward the Strait of Hormuz’s role as a critical fertilizer bottleneck. With 35% of global Urea exports at risk, benchmark prices have surged, creating a "pincer effect" for the Australian Dollar. Despite high commodity prices, rising input costs for the 2026 winter crop are neutralizing the AUD’s traditional commodity boost, while bolstering the US Dollar’s "safe-haven" status as Fed rate hike odds jump to 30%.
The Hormuz Bottleneck: Beyond Oil
While oil prices are staying in consolidations, the market is waking up to the fact that the Strait of Hormuz is a vital artery for the agricultural complex. Qatar, Saudi Arabia, and Iran account for nearly one-third of the world’s seaborne Urea. The current stalemate has turned Urea into a front-page risk factor, with benchmark NOLA prices jumping 25-30% since late February.
This is a "double whammy" for the sector: even if shipping remains open, the skyrocketing cost of natural gas—the primary feedstock for nitrogen—is creating an alarming price floor for global food production.
The "Pincer Effect" on the Aussie Dollar
For the AUD, the "fertilizer-to-food" pipeline has turned toxic. Normally, high commodity prices are a tailwind for the Aussie, but the current crisis is squeezing farmer margins to the breaking point.
As Australia prepares for the 2026 winter crop, the prohibitive cost of seeding could lead to significantly lower export volumes later this year. With the "make or break" window closing in late May, the AUD has become the week's worst performer, lagging behind even its commodity peers, the Loonie and Kiwi.
Fed Pivot: From Easing to Tightening?
On the other hand, the impact on the US interest rate trajectory is the opposite. Futures markets have effectively priced out any hope for a Fed rate cut in 2026. Instead, the odds of a final rate hike by year-end have surged to nearly 30%.
As global supply chains fracture, Dollar is benefiting from its relative self-sufficiency in nitrogen production (driven by domestic shale gas), positioning the greenback as the "cleanest shirt in the dirty laundry."
The "Winners vs. Losers"
Market activity today reflects a pause in momentum in currencies. Major FX pairs are largely confined within yesterday's ranges. For the week so far, Dollar is gaining relative strength as investors gravitate toward economies with greater energy and production self-sufficiency. In contrast, commodity currencies are failing to benefit from higher prices. Aussie is particularly weak, as rising fertilizer and fuel costs threaten to erode agricultural profitability and potentially reduce future export volumes.
In Asian, at the time of writing, Nikkei is down -0.78%. Hong Kong HSI is down -2.03%. China Shanghai SSE is down -0.88%. Singapore Strait Times is up 0.20%. Japan 10-year JGB yield is up 0.02 at 2.275. Overnight, DOW rose 0.66%. S&P 500 rose 0.54%. NASDAQ rose 0.77%. 10-year yield fell -0.064 to 4.328.
Silver Defies 'Cried Wolf' Headlines: Why Bullish MACD Signals Signals Recovery Towards $80
Silver is exhibiting a classic "Cried Wolf" effect. Despite Tehran’s blunt rejection of the latest 15-point peace proposal, Silver has refused to buckle, maintaining a resilient floor above $70. Read more.
RBA Warns of 'Restrictive' Shift: Why Rising Neutral Rates and Petrol Shocks Could Trigger More Hikes
Assistant Governor Christopher Kent just delivered a sobering update on the RBA’s path forward. While global uncertainty usually cools rates, the "Supply Shock" from the Middle East is having the opposite effect—pushing Neutral Rates higher and keeping the pressure on Australian households. Read more.
AUD/USD Daily Report
Daily Pivots: (S1) 0.6925; (P) 0.6965; (R1) 0.6987; More...
AUD/USD continues to press 0.6943 key support but there is no clean break yet. Intraday bias remains neutral first. On the downside, decisive break of 0.6943 should confirm rejection by 0.7206 key fibonacci resistance. That would set up deeper correction to the whole up trend from 0.5913, and target 38.2% retracement of 0.5913 to 0.7187 at 0.6700. Nevertheless, break of 0.7061 minor resistance will retain near term bullishness, and bring retest of 0.7187 high first.
In the bigger picture, current development argues that rise from 0.5913 (2024 low) is reversing whole down trend from 0.8006 (2021 high). Decisive break of 61.8% retracement of 0.8006 to 0.5913 at 0.7206 will pave the way back to 0.8006. This will remain the favored case as long as 0.6706 resistance turned support holds, even in case of deep pullback.
Gold Rebound Looks Fragile, Upside May Fade Quickly
Key Highlights
- Gold started a recovery wave from the $4,100 zone.
- A major bearish trend line is forming with resistance at $4,850 on the 4-hour chart.
- WTI Crude Oil started a consolidation phase below the $95 and $98 resistance levels.
- Bitcoin could start a fresh increase if it settles above $72,500.
Gold Price Technical Analysis
Gold finally found some support near $4,100 against the US Dollar. The price started a decent recovery wave above $4,300 and $4,400.
The 4-hour chart of XAU/USD indicates that the price was able to climb above the 23.6% Fib retracement level of the downward move from the $5,419 swing high to the $4,098 low. However, the price is still well below the 100 Simple Moving Average (red, 4 hours) and the 200 Simple Moving Average (green, 4 hours).
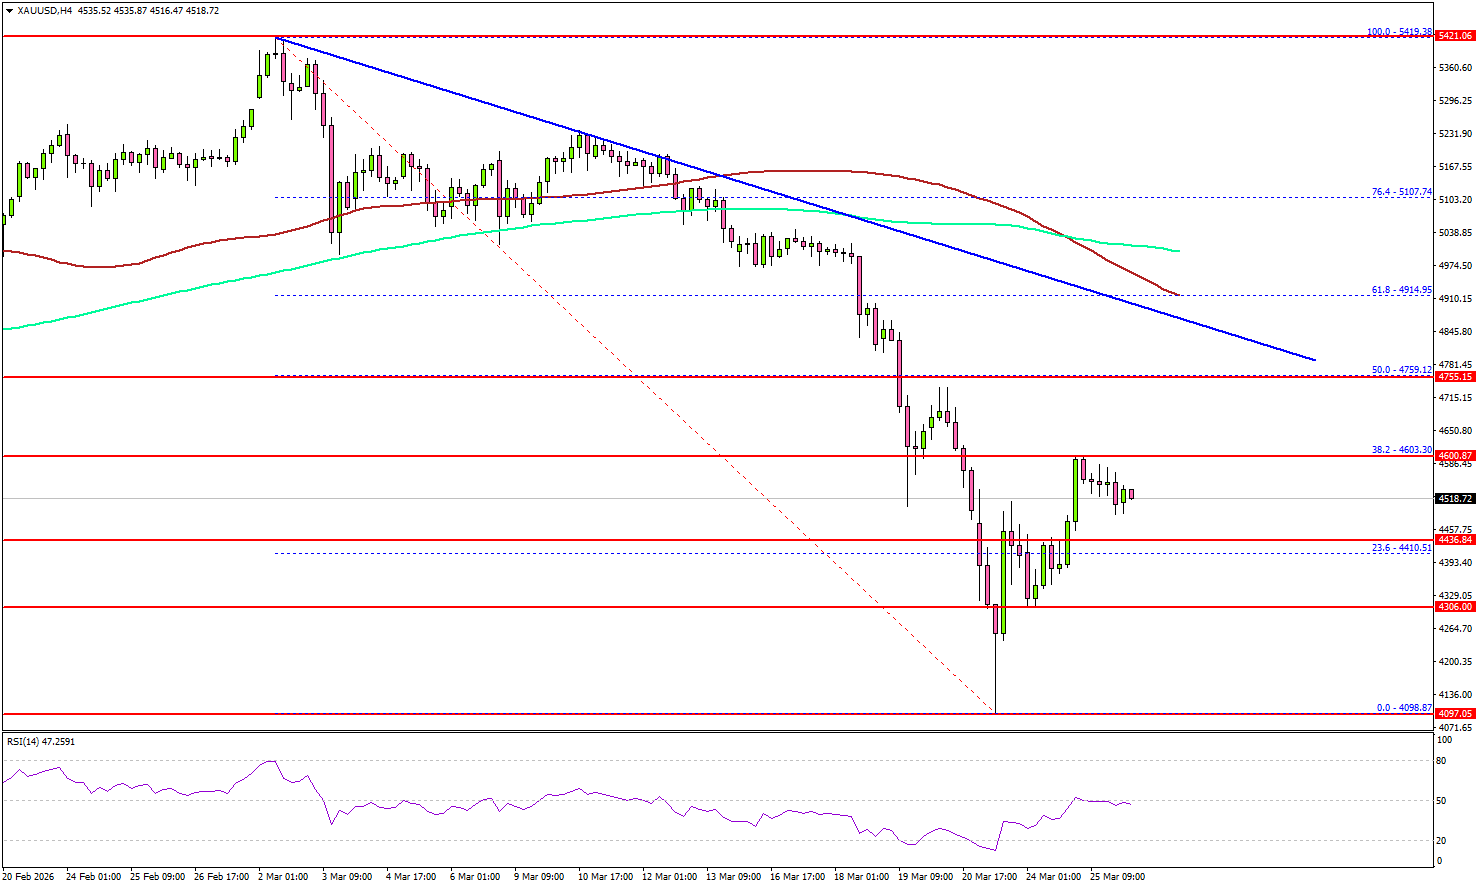
On the upside, immediate resistance is $4,600. The next major resistance sits near $4,750 and the 50% Fib retracement level of the downward move from the $5,419 swing high to the $4,098 low.
The main resistance could be near the trend line at $4,850. A clear move above $4,850 could open the doors for more upside. In the stated case, the bulls could aim for a move toward $5,000 or the 100 Simple Moving Average (red, 4 hours), above which the price could test $5,200.
If there is another decline, Gold might find bids near the $4,435 level. The first major support sits at $4,300, below which the price might slide to $4,120.
The main support sits at $4,000. Any more losses might call for a test of $3,880 or even $3,850 in the coming days.
Looking at WTI Crude Oil, the price remained supported above $80 and might start a fresh increase if it settles above $95.
Economic Releases to Watch Today
- US Initial Jobless Claims - Forecast 210K, versus 205K previous.
Silver Defies ‘Cried Wolf’ Headlines: Why Bullish MACD Signals Signals Recovery Towards $80
Silver prices are showing remarkable resilience, holding a firm floor above $70 despite Iran’s rejection of a 15-point proposal from the Trump administration. While momentum has stalled at the $74.50 resistance, the lack of a sell-off suggests "headline fatigue" has set in. Traders are now ignoring verbal rhetoric in favor of technical signals, specifically a bullish MACD convergence that points toward an eventual rally to around $79, where it would be another key psychological resistance at $80.
The "Cried Wolf" Effect: Why Iran News Failed to Move Silver
Throughout this week, the market has been caught in a dizzying cycle of conflicting reports. While Washington floats "positive talks," Tehran’s state media dismisses them as "psychological warfare." The result? Silver traders have stopped reacting to words.
Despite the peace deal rejection, Silver is refusing to fall back toward the $60.97 low established earlier this week. This "sideways resilience" at $72 indicates that the market is no longer pricing in verbal escalations, waiting instead for physical movements—such as a ground move by the 82nd Airborne or a resolution in the Strait of Hormuz.
The Oil Anchor: Brent at $100
Silver’s current lack of momentum is closely mirrored in the energy markets. Brent Crude remains locked in a tight range around the $100 psychological level. Until Oil finds a clear directional trigger, Silver is likely to continue its consolidation between $70 and $75.
Technical Outlook: The Path to 79
Technically, the picture remains skewed to the upside. The 4H MACD shows a clear bullish convergence, suggesting the corrective pattern from the 121.83 high is likely complete with three waves down to 60.97, just ahead of 60 psychological level. Firm break of 74.52 resistance (at 55 4H EMA at 74.30) will confirm short term bottoming. That would clear the path for further rally towards 55 D EMA (now at 79.11), where it will meet another key psychological at 80.
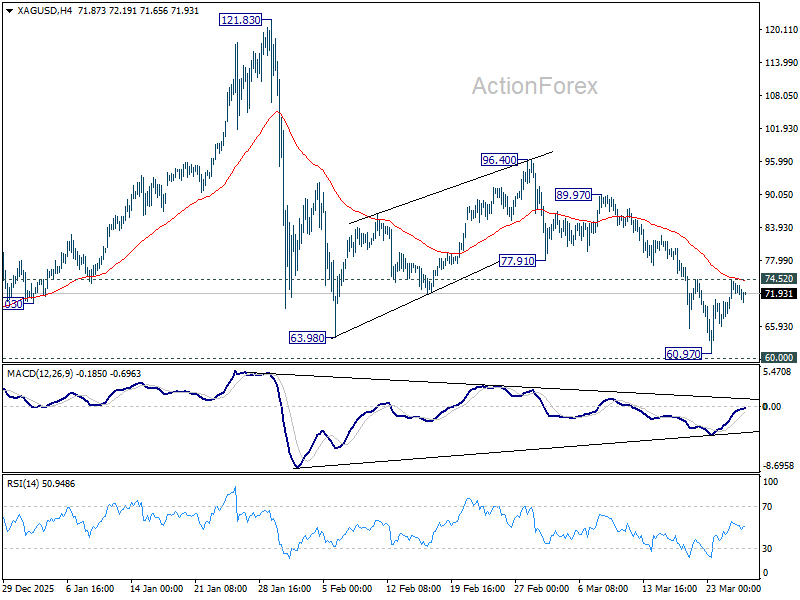
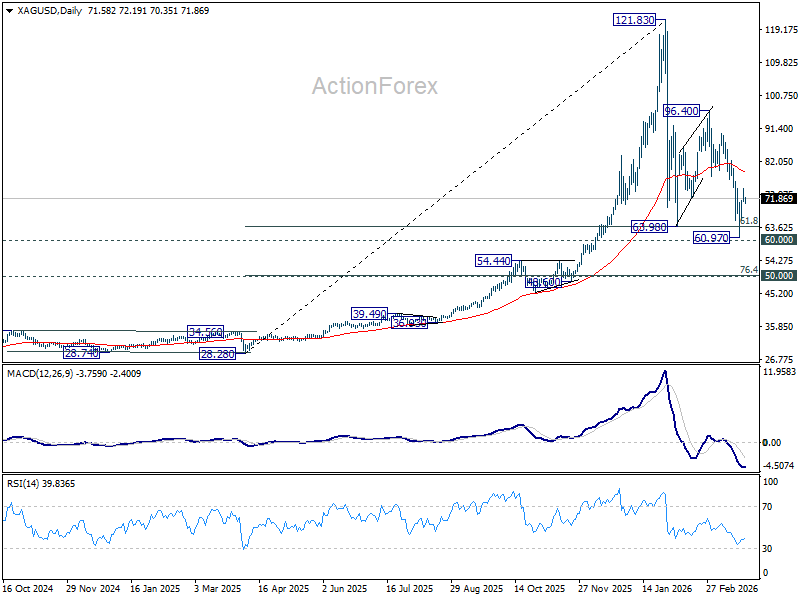
Table: Silver Technical Decision Zone
| Support/Resistance | Price Level | Significance |
| Corrective Low | 60.97 | Major floor; Three-wave correction complete above 60. |
| Current Pivot | 70.00 | New resilient floor despite Iran headlines. |
| Key Resistance | 74.52 | The "Trigger Point" for the next bullish leg. |
| Bullish Target | 79.11 | 55 D EMA; Confirms structural reversal. |