Sample Category Title
Global Markets Swing on US–Iran War Headlines as Risk-on Rally Falters – a Cross Analysis on S&P 500, US...
Key takeaways
- Volatility driven by conflicting war narratives: The S&P 500 and Nasdaq 100 swung between risk-on and risk-off as mixed signals on US–Iran negotiations triggered sharp reversals, while prediction markets still show low near-term ceasefire odds.
- Cross-asset signals point to fragile sentiment: The US Dollar Index remains supported, AUD/USD failed at resistance, and WTI crude oil holds key support—indicating no clear shift to sustained risk-on positioning.
- Technical resistance caps upside, downside risks persist: Equities are struggling at key moving averages (e.g., S&P 500 at 200-day MA), with downside triggers still in play—suggesting markets remain vulnerable to further declines despite intermittent rebounds.
The global markets have once again seen a “wild swing of the pendulum” in the past eight hours, driven by conflicting news narratives related to the ongoing US-Iran war, which has lasted 25 days as of Tuesday, March 24, 2026.
Tuesday’s session marked a mild reversal from Monday’s sudden burst of risk-on behaviour triggered by US President Trump’s claim that the US and Iran are back on the negotiation table, and a deal is imminent to end the conflict. Iranian officials refuted such claims, which led to a sell-off in global equities, a rebound in the US dollar, and a decline in benchmark oil prices, accompanied by an intraday softening of gold and silver.
By the end of Tuesday’s US session, three major benchmark US stock indices ended with losses; S&P 500 (-0.37%), Nasdaq 100 (-0.77%), and Dow Jones Industrial Average (-0.18%), with a slight risk-off backdrop backed by an increased odds that the US White House is sending military ground forces to Iran to odd US-Israel joint offensive as media reports stated that US administration has ordered the 82nd Airborne Division to deploy around 2,000 soldiers to the Middle East.
At around 4.15 am Singapore time, Wednesday, 25 March (right after the close of Tuesday’s US session), US President Trump gave a press conference that signalled that Iran had offered a “present” as a show of good faith in negotiations he has claimed are ongoing, hinting at a possible ceasefire to happen “very soon”.
The S&P 500 and Nasdaq 100 e-min futures rose sharply at the start of Wednesday, 25 March Asian session, with an intraday gain of 1% before it dwindled to 0.7% at this time of writing.
However, Polymarket’s prediction market platform is not reflecting an imminent US-Iran ceasefire, and several key cross assets’ price action behaviour is not displaying clear signals of an all-out risk-on herd sentiment at this juncture.
Unfolding them as follows…
Low odds of a ceasefire by 31 March
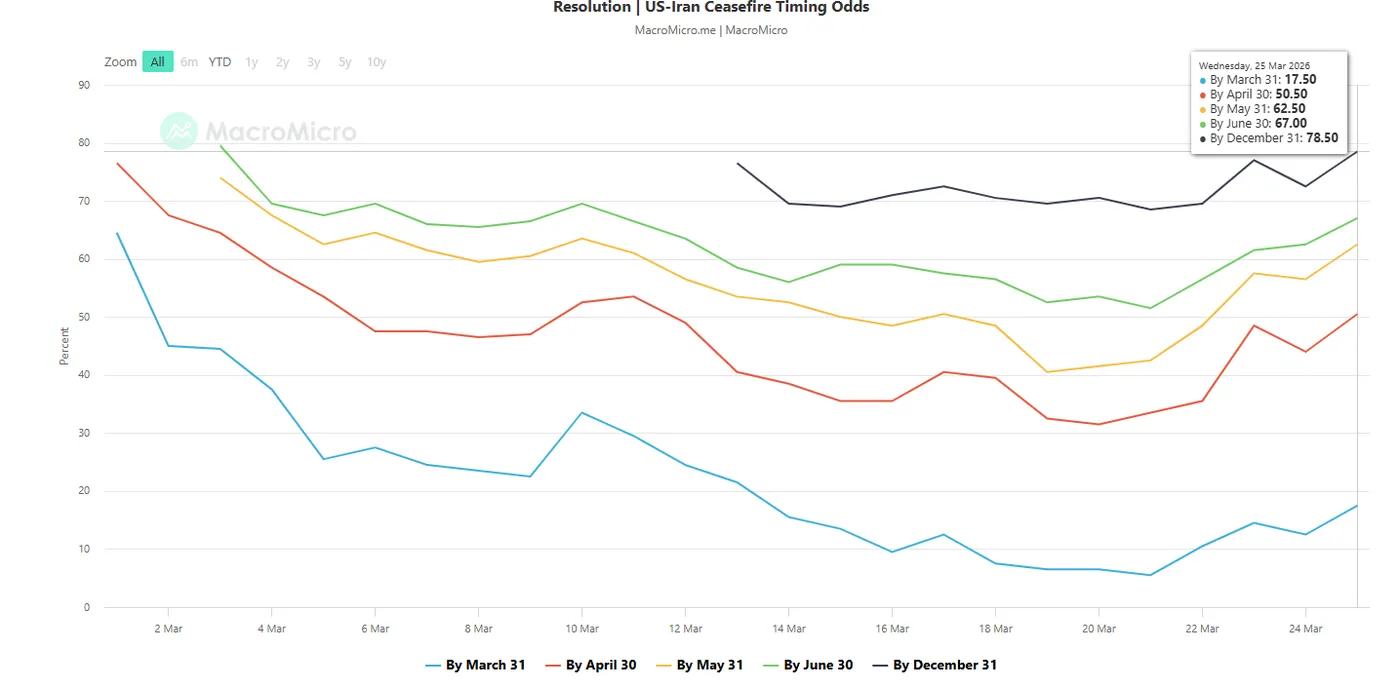
Fig. 1: Polymarket’s US-Iran ceasefire timing odds as of 25 Mar 2026 (Source: MacroMicro)
Data sourced from Polymarket compiled by fundamental data provider, MacroMicro, has indicated that the prediction market-implied probability for a US-Iran ceasefire by 31 March 2026 has only increased slightly to 17.5% on Wednesday, 25 March at this time of writing from its prior day of 12.5% (see Fig. 1).
A higher probability of a ceasefire at 62.5% is being priced in at a longer period, by 31 May 2026 (a jump from 56.5% printed on Tuesday, 24 March).
S&P 500 bulls get rejected again at the 200-day moving average
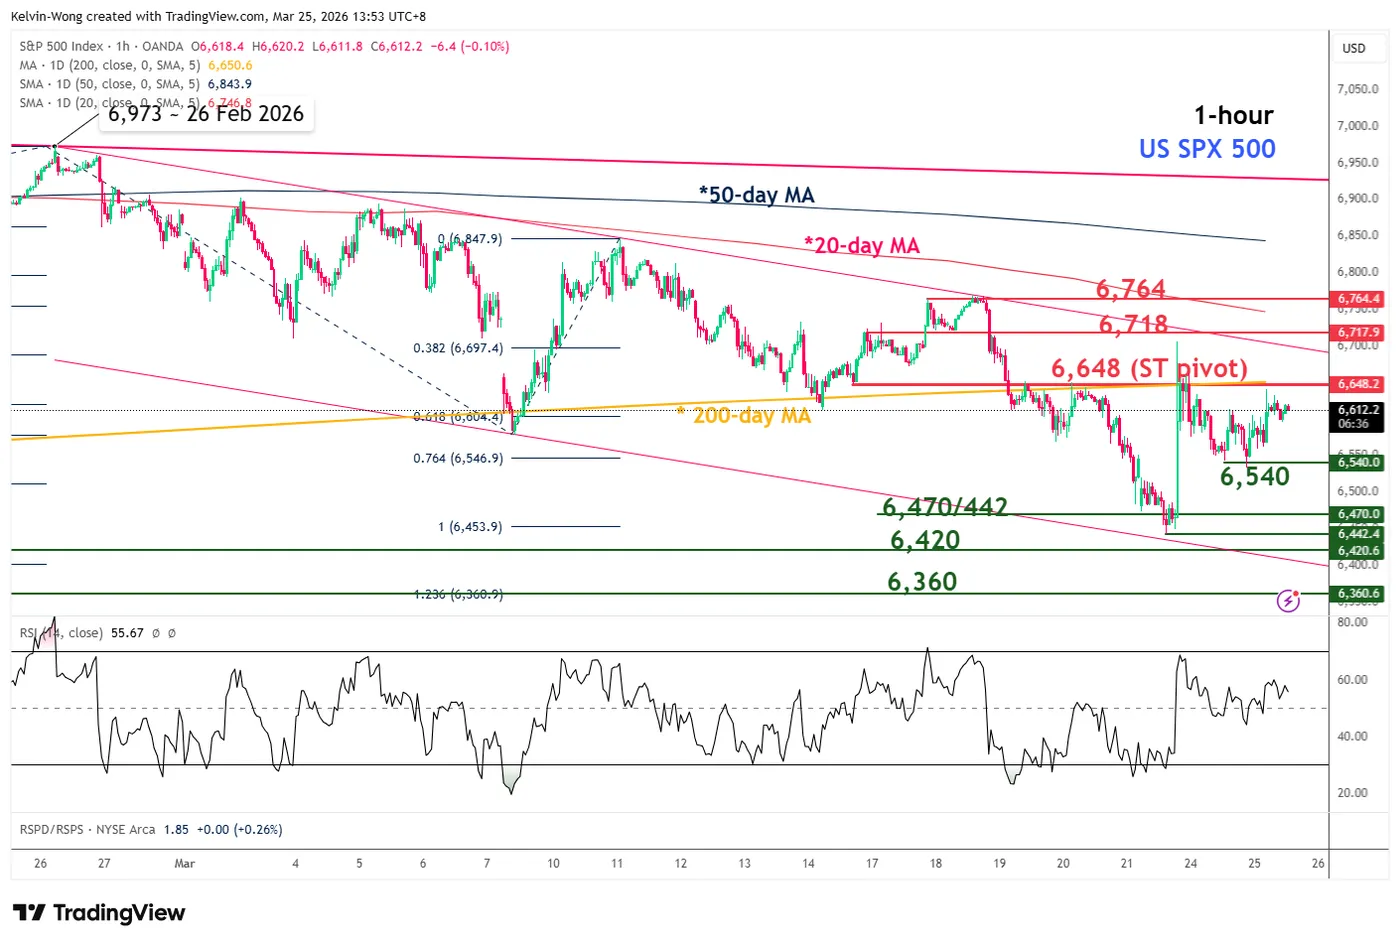
Fig. 2: US SPX 500 CFD minor trend as of 25 Mar 2026 (Source: TradingView)
The current price actions of the US SPX 500 CFD index (a proxy of the S&P 500 E-mini futures) have its intraday rally cut short again at its 200-day moving average, now coinciding with the 6,648 key short-term pivotal resistance (see Fig. 2).
A breakdown with an hourly close below 6,540 near-term support (downside trigger) may open up scope for the bears to retest Monday’s 23 March 2026 swing low area at 6,470/442 in the first step.
The US Dollar Index remains supported by its 20-day moving average
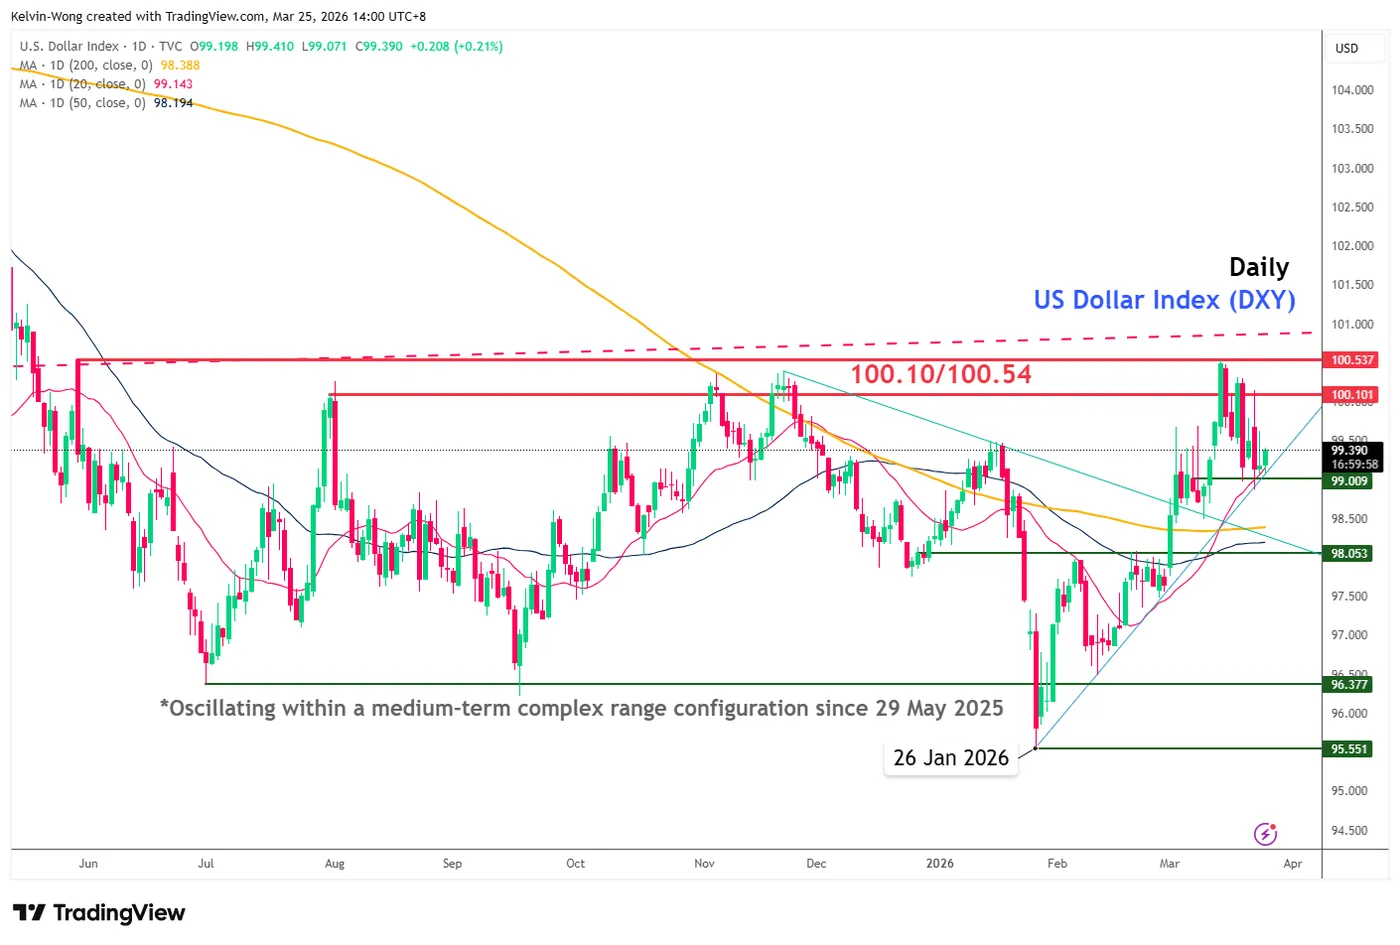
Fig. 3: US Dollar Index medium-term trend as of 25 Mar 2026 (Source: TradingView)
The recent 1.6% decline seen in the US Dollar Index from its 100.10/100.54 medium-term range support has managed and continued to find support at the 99.00 level, which confluences with the 20-day moving average and the ascending trendline in place since the 27 January 2026 low of 95.55 (see Fig. 3).
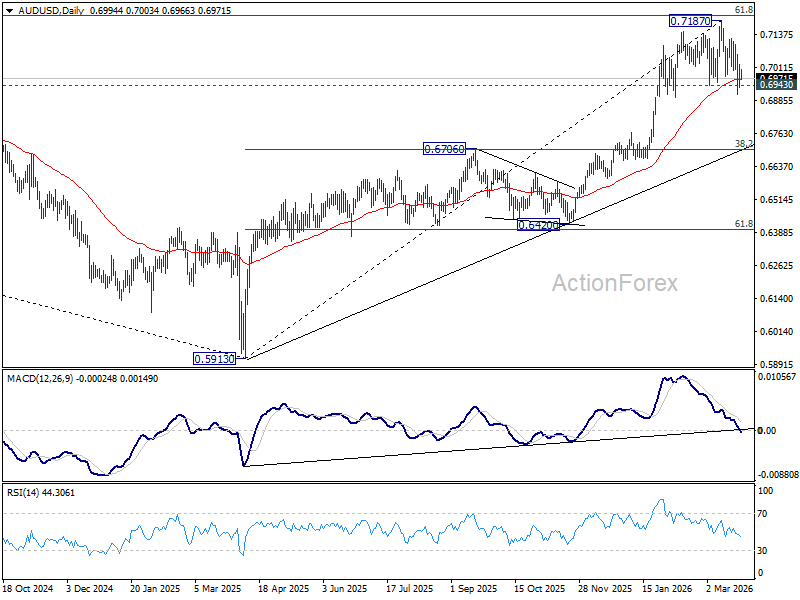
AUD/USD bulls capped below the 50-day moving average
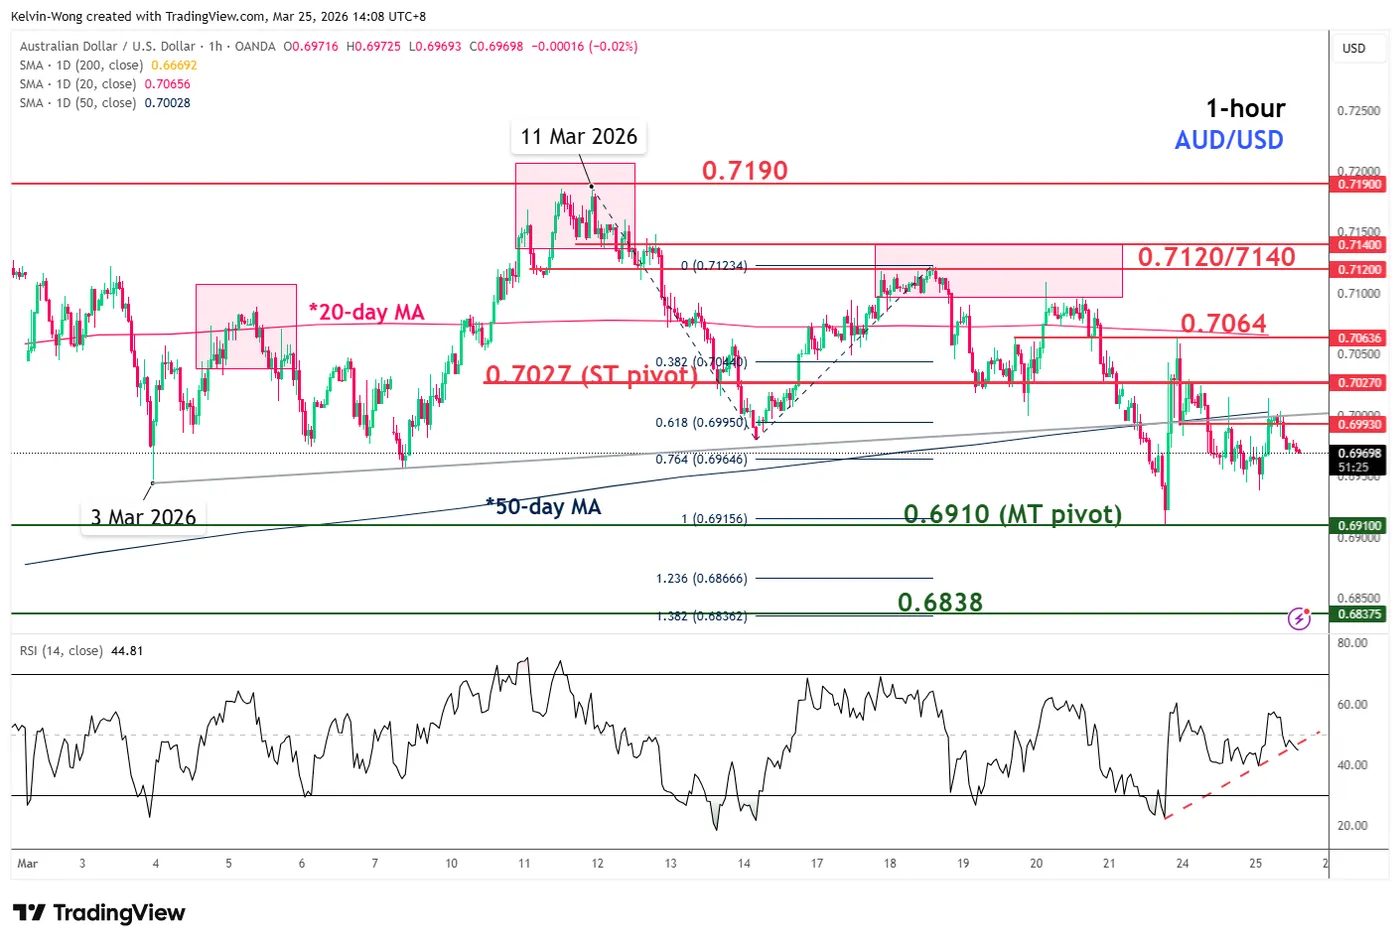
Fig. 4: AUD/USD minor trend as of 25 Mar 2026 (Source: TradingView)
The Australian dollar is considered a proxy of risk appetite, where a rally in the AUD/USD represents a risk-on behaviour.
On Wednesday, 25 March, the Asian opening session intraday rally seen in the AUD/USD has been wiped out after a bearish reaction right at the 50-day moving average, with an intraday loss of 0.4% at this time of writing.
Watch the 0.7027 key short-term pivotal resistance on the AUD/USD, and it has staged a bearish breakdown from a minor “Head & Shoulders” bearish reversal configuration on Monday, 23 March 2026 (see Fig. 4).
A break below 0.6910 key medium-term pivotal support exposes further potential weakness towards the next intermediate support at 0.6838 in the first step.
WTI crude oil is still holding above the 20-day moving average
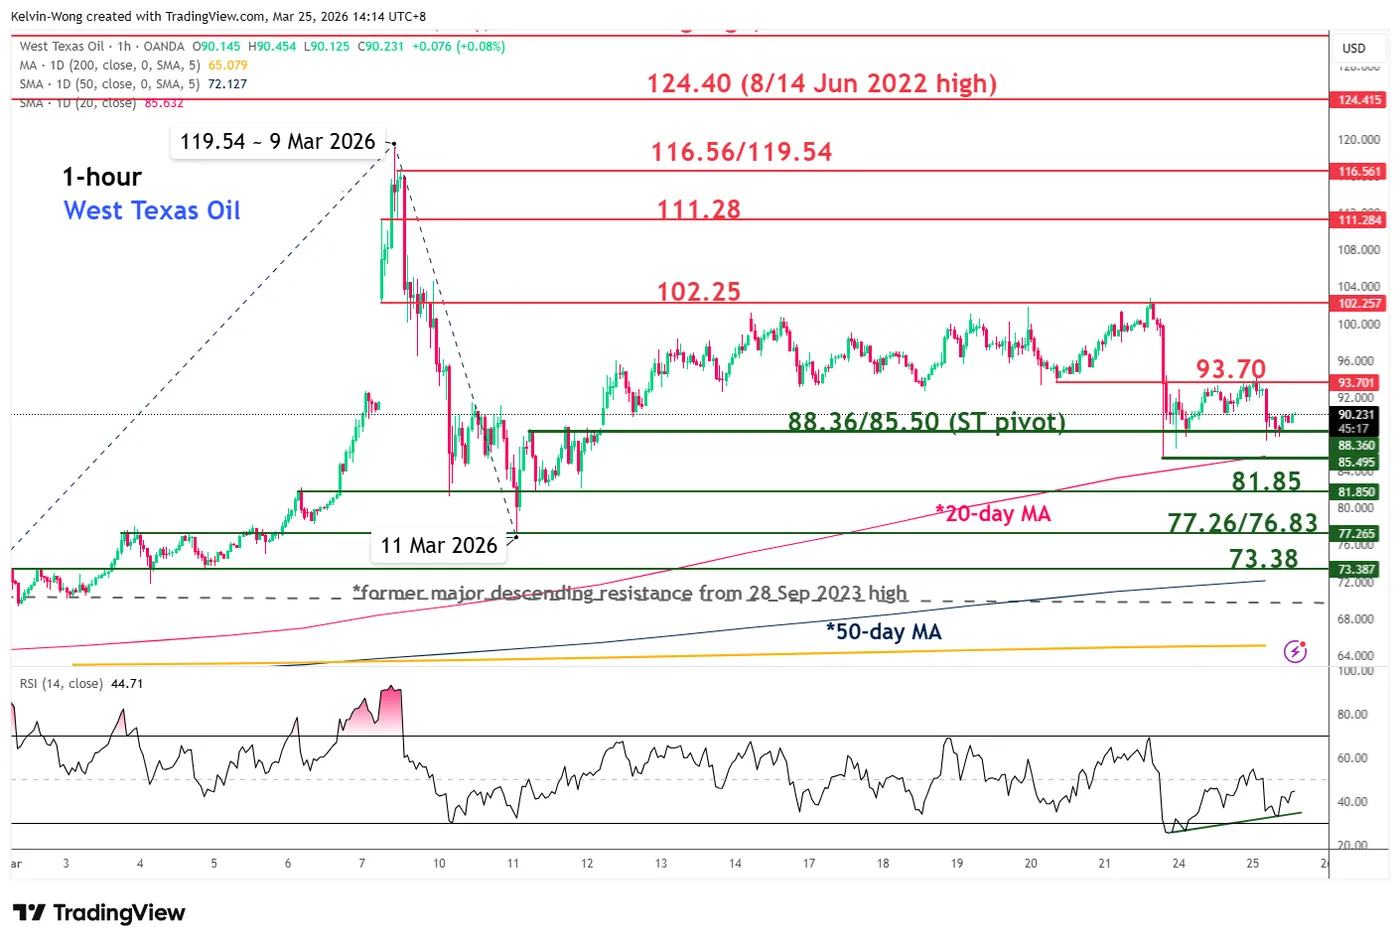
Fig. 5: West Texas Oil CFD index minor trend as of 25 Mar 2026 (Source: TradingView)
Wednesday’s Asian opening session sell-off seen in the West Texas Oil CFD index (a proxy of the WTI crude oil futures) has managed to find support once again at the 20-day moving average, which also stalled Monday’s intraday plunge of 10% triggered by US President Trump’s claim of a new round of negotiations between the US and Iran.
Watch the $88.36/85.50 key short-term pivotal support, and a clearance with an hourly close above $93.70 may see a further push up to retest the minor range resistance of $102.25 (see Fig. 5).
Conclusion
An analysis of the current price structures of the related cross asset classes, S&P 500, US Dollar Index, AUD/USD, and West Texas crude oil, suggests that we are not out of the woods yet for a significant bullish reversal in risk appetite to take form.
Perhaps the market is rebuking US President Trump’s claims of an imminent ceasefire between the US, Israel, and Iran.
It’s “the Fog of Uncertainty” in Full Swing
Markets
“The fog of uncertainty cannot be an excuse for inaction.” The quote is from Bank of England’s chief economist Huw Pill but could have come from any monetary policymaker serious about preserving credibility central banks had to restore following the 2020-2022 inflation spike. Pill is worried about the current energy shock’s effect beyond the immediate, short-term impact. He fears for the second-round effects through price and wage setting which could materialize much faster than in the past. Having February inflation this morning coming beyond expectations between 3% and 4.3% depending on the gauge will only strengthen his view. Pill’s comments underscore the central bank’s officially stated “readiness to act”. They came after yesterday’s UK March PMIs, which similar to the European ones, already screamed stagflation after being just two weeks into the Middle East conflict. It served as a stark reminder to core bond markets. Bunds underperformed with yields soaring up to 10 bps at the front. Swap yields even rallied 14 bps with the 2-yr reading for 3%. Yields rose between 1 and 3.8 bps in the US and 2.3-5.1 bps in the UK. The US dollar eked out some small gains against most peers, pushing DXY higher to 99.43. EUR/USD stabilized around the 1.16 big figure. EUR/GBP did the same near 0.865. Stocks were torn between conflicting messages coming from president Trump who hailed productive talks with Iran but Iran denying those having happened at all. It’s “the fog of uncertainty” in full swing, including today. The US reportedly ramped up diplomatic efforts by drafting a 15-point plan intended to bring the war to a close. The details are unclear but it is highly unlikely that an emboldened Iran will simply accept the US-set terms. The plan would also call for a one-month ceasefire to allow for negotiations. Markets are currently cheering diplomacy with (Asian) stocks and (European, US) futures markets rising, oil dropping and core bonds stabilizing from the rout yesterday. Looking at the actual developments rather than things being said, we remain cautious. The US is deploying thousands of more troops to the Middle East and Israeli and Iranian missiles continue to pierce the skies. Meanwhile the new deadline to open the Strait of Hormuz is approaching this Friday. 2026 weekends have been critical for any major Trump administration moves.
News & Views
Inflation in Australia eased slightly in February. Headline CPI was flat from January and softened to 3.7% Y/Y from 3.8% Y/Y. Trimmed mean core inflation rose 0.2% M/M to hold unchanged at 3.3% Y/Y. The largest contributors to annual inflation were housing (+7.2%), food and non-alcoholic beverages (+3.1%) and recreation and culture (+4.1%). Transport prices fell 0.2%, with automotive fuel prices declining 7.2% Y/Y (due to monthly declines of 3.4% and 3.2% in February and January respectively). However, this mitigating effect will be sharply reversed in the coming months due to higher prices related to the conflict in the Middle East. Inflation is expected to rise further away from the 2-3 % RBA inflation target. Even as the 2-y yield eased 10 bps (4.63%), the market still sees of chance of 70% of a next follow-up RBA rate increase at the early May meeting. The Aussie dollar over the previous days lost some momentum and this morning eases below the AUD/USD 0.70 barrier (currently 0.697).
The National Bank of Hungary (MNB) yesterday left its policy rate unchanged at 6.25%. The bank raised the inflation forecast for 2026 (3.8% from 3.2%) and 2027 (3.7% from 3.3%) with inflation still expected to return to 3% in 2028. The outlook for growth was downwardly revised from this year (1.7% from 2.4%) and for 2027 (3% from 3.1%) but upwardly revised from 2028 (2.9%). MNB sees household consumption as the main driver for growth in due to rising real wages and the government’s income-increasing measures. Capacity-increasing investment projects of recent years still are expected to help the expansion of industrial exports. In February 2026, inflation and core inflation declined to 1.4% and 2.1%, respectively due to favourable repricings. Prices caps have a mitigating impact on inflation in the coming months, but CPI is expected to return above the tolerance band (3% +/- 1%pt) band in Q3. In the current economic environment, maintaining the stability of domestic financial markets, especially that of the foreign exchange market, is seen as crucial for anchoring inflation expectations and thus achieving price stability. Maintaining tight monetary conditions is warranted. With the 2-y swap yield at 7.44%, the market currently prices the risk that MNB at some point might be forced to tightening policy to secure financial stability. EUR/HUF in volatile trading over recent days hovered near the 390 mark. Governor Varga said MNB has the right to intervene in FX if necessary.
EUR/USD Daily Outlook
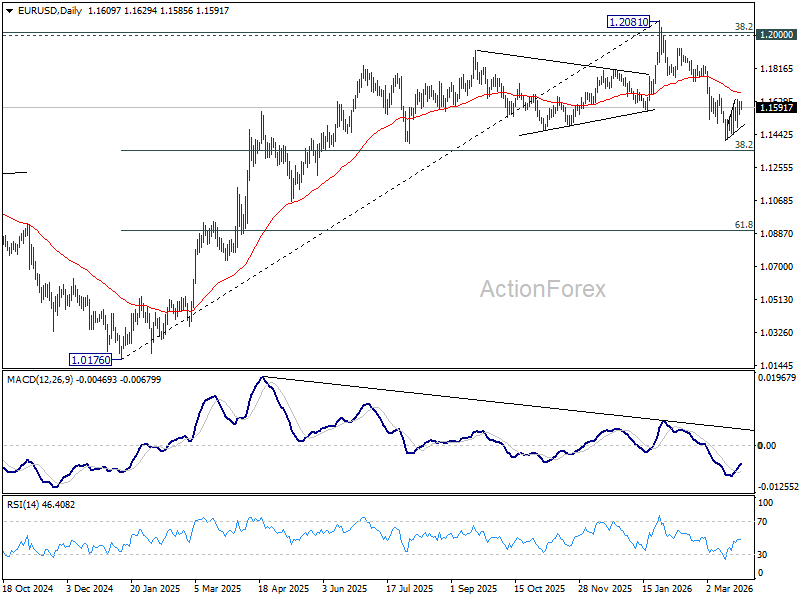
Daily Pivots: (S1) 1.1567; (P) 1.1597; (R1) 1.1638; More….
No change in EUR/USD's outlook as consolidation continues above 1.1408. Intraday bias remains neutral. With 1.1666 cluster resistance (38.2% retracement of 1.2081 to 1.1408 at 1.1665) intact, further decline is in favor. On the downside, below 1.1408 will resume the fall from 1.2081 to 38.2% retracement of 1.0176 to 1.2081 at 1.1353. However, decisive break of 1.1666 will argue that the fall from 1.2081 has completed, and turn bias back to the upside for 61.8% retracement of 1.2081 to 1.1408 at 1.1824.
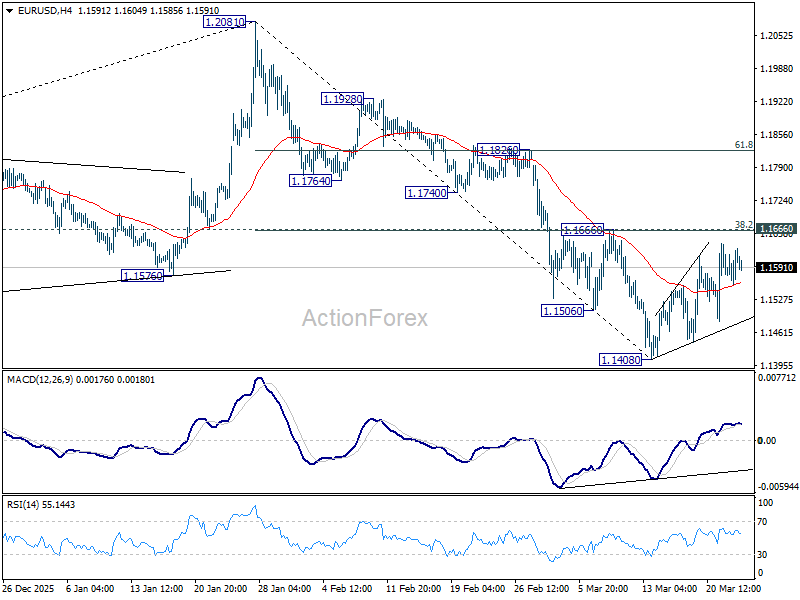
In the bigger picture, prior break of 55 W EMA (now at 1.1501) should confirm rejection by 1.2 key cluster resistance level. The whole up trend from 0.9534 (2022 low) might have completed as a three wave corrective rise too. Deeper fall is expected to long term channel support (now at 1.0528). Meanwhile, risk will stay on the downside as long as 1.2081 holds, even in case of strong rebound.
USD/JPY Daily Outlook
Daily Pivots: (S1) 158.23; (P) 158.71; (R1) 159.19; More...
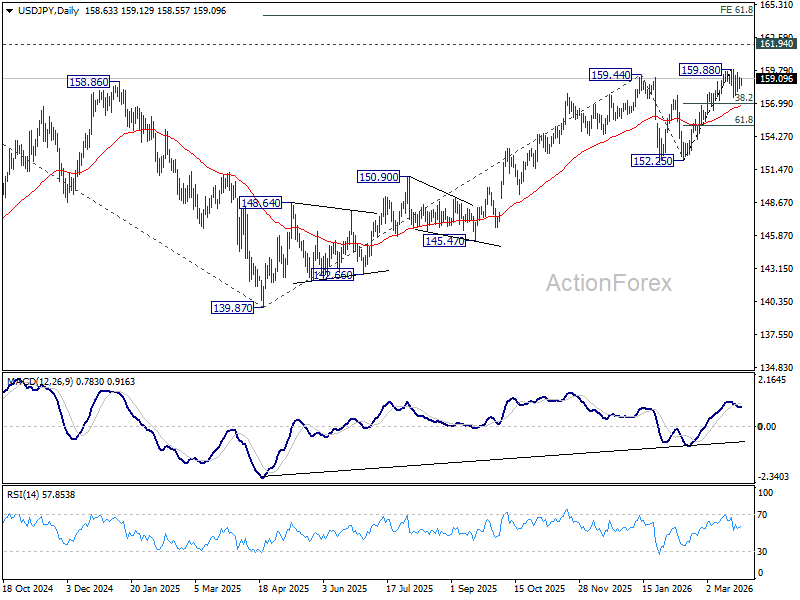
USD/JPY is staying in sideway trading and intraday bias remains neutral. In case of another dip, downside should be contained by 38.2% retracement of 152.25 to 159.88 at 156.96 to bring rebound. On the upside, break of 159.88 will target a test on 161.94 high.
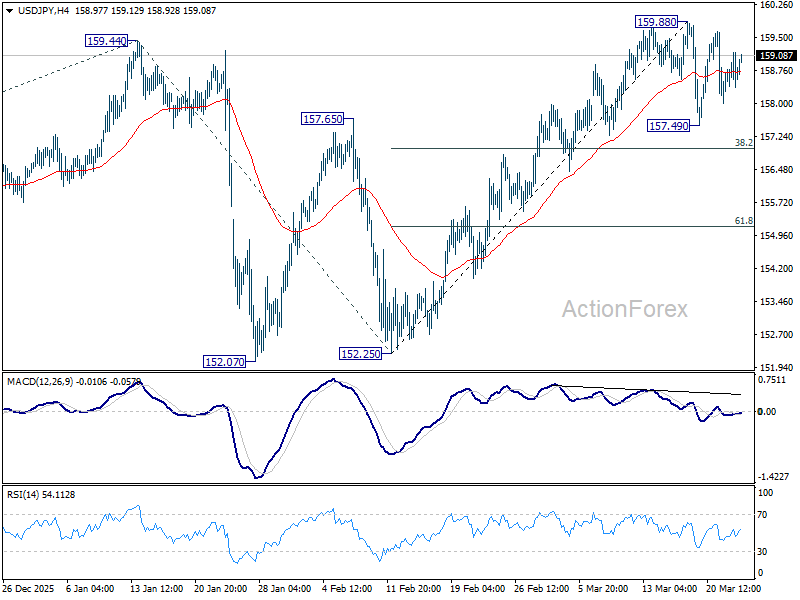
In the bigger picture, outlook is unchanged that corrective pattern from 161.94 (2024 high) should have completed with three waves at 139.87. Larger up trend from 102.58 (2021 low) could be ready to resume through 161.94. This will remain the favored case as long as 55 W EMA (now at 152.70) holds. Firm break of 161.94 will pave the way to 61.8% projection of 102.58 to 161.94 from 139.87 at 176.75.
GBP/USD Daily Outlook
Daily Pivots: (S1) 1.3300; (P) 1.3389; (R1) 1.3522; More...
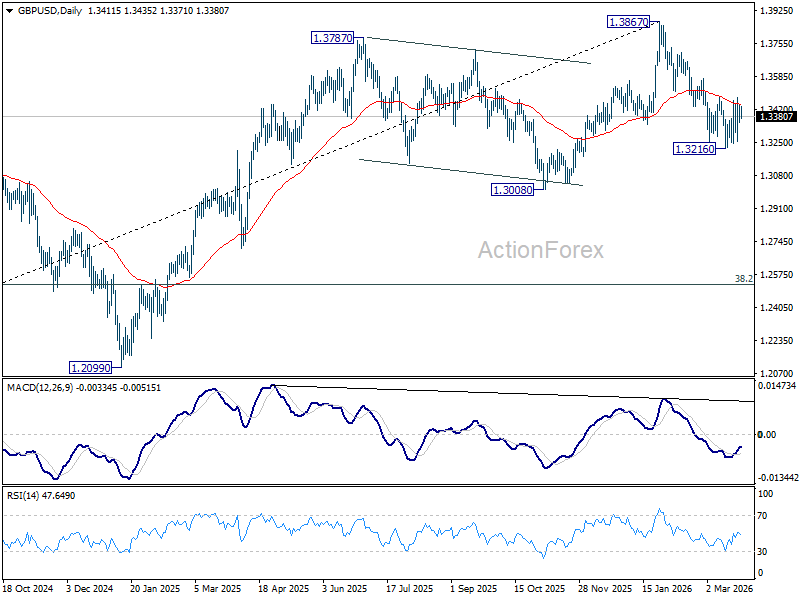
Range trading continues in GBP/USD and intraday bias stays neutral. With 1.3482 resistance intact, further decline is in favor. On the downside, below 1.3216 will resume the fall from 1.3867 to 1.3008 structural support. However, decisive break of 1.3482 will argue that the fall from 1.3867 has completed, and turn bias back to the upside for 61.8% retracement of 1.3867 to 1.3216 at 1.3618.
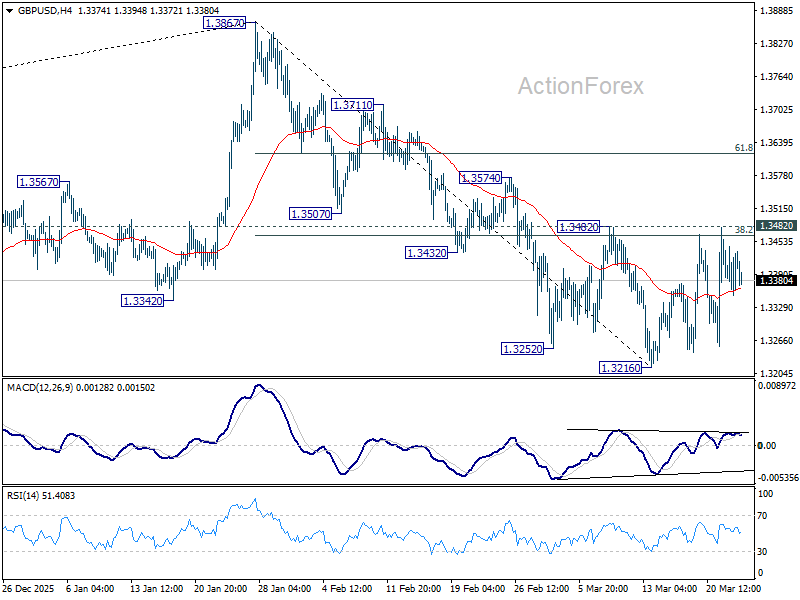
In the bigger picture, considering bearish divergence condition in both D and W MACD, a medium term top should be in place at 1.3867. Firm break of 1.3008 support will argue that fall from 1.3867 is at least correcting the rise from 1.0351 (2022 low) with risk of bearish reversal. That would open up further decline to 38.2% retracement of 1.0351 to 1.3867 at 1.2524. For now, medium term outlook will be neutral at best as long as 1.3867 resistance holds, or until further development.
USD/CHF Daily Outlook
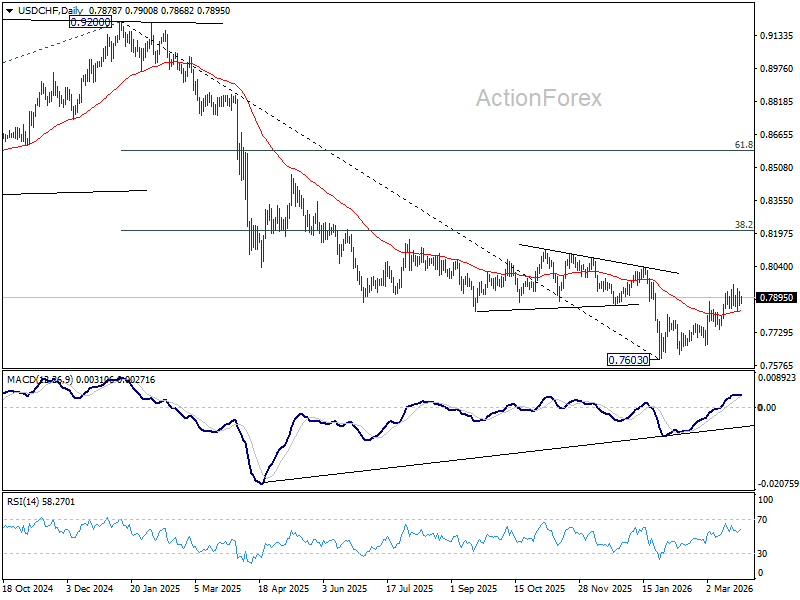
Daily Pivots: (S1) 0.7853; (P) 0.7889; (R1) 0.7919; More….
Sideway trading continues in USD/CHF and intraday bias remains neutral. As noted before, rise from 0.7603 should be correcting whole decline from 0.9200. Above 0.7957 will target 38.2% retracement of 0.9200 to 0.7603 at 0.8213. This will remain the favored case as long as 0.7746 support holds.
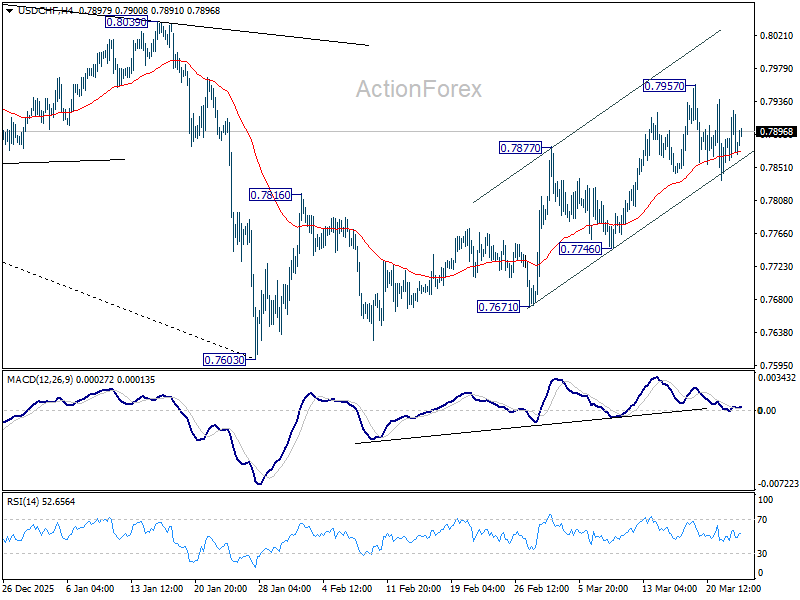
In the bigger picture, a medium term bottom should be in place at 0.7603 on bullish convergence condition in D MACD. Rebound from there is seen as correcting the fall from 0.9200 only. However, decisive break of 55 W EMA (now at 0.8085) will suggest that it's probably correcting the larger scale down trend from 1.0146 (2022 high). On the other hand, rejection by the 55 W EMA will setup down trend resumption to 100% projection of 1.0146 (2022 high) to 0.8332 from 0.9200 at 0.7382 at a later stage.
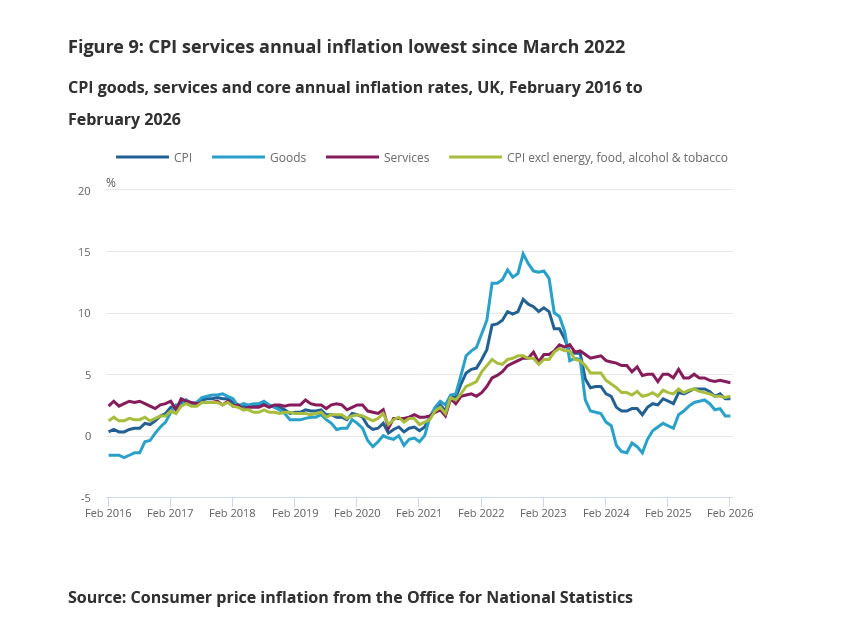
UK Inflation Unchanged at 3.0% as Services Keep Price Pressure Elevated
UK inflation held steady in February, with headline CPI unchanged at 3.0% yoy, in line with expectations. On a monthly basis, CPI rose 0.4%, matching the pace seen a year earlier.
However, underlying pressures remain firm. Core CPI ticked up from 3.1% yoy to 3.2% yoy, coming in above expectations. While goods inflation held steady at 1.6%, services inflation eased only slightly from 4.4% to 4.3%, indicating that domestic price pressures, particularly in services, remain elevated.
The data come at a critical juncture for the Bank of England. The escalation in the Middle East and the disruption to energy supplies via the Strait of Hormuz have pushed oil and gas prices higher, threatening to reverse the disinflation trend. This leaves the Bank of England facing a more complicated policy path, with inflation risks now skewed to the upside.
Middle East War Hits Global Economic Activity
Middle East headlines continue to drive markets, and there is a notable effort from the US – and its President – to ease tensions. Donald Trump has proposed a 5-day ceasefire to Iran earlier this week, he said he pointed at “productive and constructive” discussions with Iran – a claim denied by Tehran – and yesterday, he added that Iran had offered a “present” in the Strait of Hormuz. Nothing has been confirmed– to my knowledge – from the Iranian side. What is clear, however, is that Trump wants this war to end. Whether he can make that happen remains to be seen.
There are also reports that 3’000 troops are headed to the region. If boots hit the ground, the conflict would escalate.
I am not taking Trump’s words at face value, but his unilateral efforts offer some hope. Oil is lower this morning: Brent is down 3.70%, trading near $96pb at the time of writing, while WTI crude, which was lower earlier, is now up around 1.50%. Equity indices in Asia are pushing higher. The Nikkei is rebounding 1% after a flat session yesterday, the Kospi is up around 1.50%, while US and European futures point to a positive start.
But gains appear fragile, as the US dollar is pushing higher nonetheless. The USDJPY is up for a second session, again flirting with the 159 level. What keeps the pair contained near current levels is the fear of direct intervention from Japanese authorities to prop up the yen. That threat remains quite effective in discouraging speculative FX positioning.
Investor sentiment is cautiously improving on hope, but the fundamentals have taken a hit after almost a month of fighting in the Middle East and disruptions around the critical Strait of Hormuz. This is reflected in yesterday’s PMI data. Australia’s composite PMI slipped into contraction – below the 50 mark – while euro area private-sector activity grew at the slowest pace in almost a year, posting its biggest decline since the Ukraine invasion. Manufacturing activity across Europe – a smaller share of total activity – came in better than expected, but price pressures rose worryingly. In the UK, manufacturing costs rose by the most since Black Wednesday in 1992, according to the PMI survey.
One hope is that this month’s price spike proves temporary if tensions ease and oil prices decline sustainably. History offers some perspective – and hope. During the Gulf War, when Iraq invaded Kuwait in August 1990, oil prices surged from around $15 per barrel to nearly $40 in just two months, rattling global markets. But the stress was relatively short-lived. By the time coalition forces intervened and the war ended in February 1991, oil prices had already begun to moderate. Roughly one month later, volatility remained elevated; three to six months later, stabilization had begun, with energy markets largely returning to pre-war levels; and after one year, markets had broadly resumed prior trends.
If today’s crisis follows a similar path, oil prices could stabilize in the $80–85pb range in the coming months, while the US dollar could ease, offering a double benefit to global economies. Over a one-year horizon, oil could potentially return to the $60–70pb range. But there are many “ifs” in the near term, making short-term direction highly uncertain.
What is certain is that investors are eager for tensions to ease, hoping for a post-“Liberation Day”-type rebound in equity markets. I would argue that a rebound is likely, but the recent dip in US equities has not been as severe as last year’s selloff. The S&P500 fell more than 20% on tariff stress before rebounding last year; currently, it is down just over 7% from its January peak. Therefore, I wouldn’t rule out the possibility of a deeper correction before dip buyers return with conviction. After all, the Middle East situation today is worst than a week ago, with Gulf countries reportedly ready to join the war, and US troops headed to the region.
The macroeconomic backdrop has deteriorated over the past month. Energy prices are higher, operating costs are rising, and margins are likely to come under pressure. Expectations for the Federal Reserve (Fed) and other major central banks have shifted in a more hawkish direction, with markets increasingly questioning whether the Fed can deliver rate cuts this year.
At the same time, stress in private credit is building, while AI-related disruption continues to weigh on parts of the tech sector. The iShares Expanded Tech-Software ETF fell more than 4% yesterday, on news that Amazon’s cloud unit is developing AI tools to automate functions across sales, business development and other areas, potentially leading to further job cuts.
This raises another issue: AI-driven automation could lead to job losses – something the Fed may ultimately need to address through policy, given its dual mandate, unlike many of its peers such as the European central banks, which focus primarily on price stability.
Released this morning, UK inflation came in higher than expected. Headline inflation steadied near 3% in February but core inflation rose unexpectedly rose to 3.2%, both above the Bank of England’s (BoE) 2% target, and set to take a lift in the coming months due to the recent rise in energy prices. This expectation has already shifted BoE rate expectations. Last week, the BoE kept rates unchanged, whereas markets had expected a cut prior to the escalation in geopolitical tensions. Now, the BoE may be forced to maintain a more hawkish stance, and could even consider further tightening if price pressures persist.
This outlook is challenging for the government’s fiscal position, as well. Rising inflation expectations and a more hawkish BoE have pushed 10-year gilt yields above 5% earlier this week, the highest since 2008. Rising borrowing costs are eating into the fiscal headroom and brings two unideal scenarios on the table: if the government cuts spending, growth will suffer; if it increases support (through energy subsidies for ex), borrowing will rise. Neither outcome is particularly supportive for sterling.
Cable faces resistance near its 200-day moving average around 1.3430, while the EURGBP near 0.86 could act as a floor, despite a recent death cross formation favouring sterling. Both the euro and sterling are vulnerable to an energy shock, but sterling arguably more so, given the UK economy’s sensitivity to energy prices and relatively fragile fiscal position post-Brexit.
Markets Weigh De-Escalation Efforts Pushing Brent Crude Below USD100/bbl
In focus today
In Sweden, the Riksbank minutes will be published today. A lot has happened since the meeting last week, but it will be interesting to see how the Riksbank members themselves view the risks ahead and whether they express any individual assessments about when it might be time to act. It is also Göra Hjelm's first meeting. The NIER survey for March is also published. It is worth noting that it data was collected at the beginning of the month and does not capture recent events.
In Germany, the March Ifo survey is due and should offer further insight into preliminary growth and price effects from the war in Iran. Yesterday's PMI readings showed weaker-than-expected services, while manufacturing outperformed. In manufacturing, both new orders and output rose, a positive signal for the sector, but the decline in services and a sharp rise in manufacturing input prices remain concerning.
In the UK, February inflation will be published. The UK has been on a promising disinflationary trend, but February data is old news. It will take time before we get more clarity and the Bank of England can decide on its next move.
Economic and market news
What happened overnight
Overnight, the oil market was caught between escalating and de-escalating developments in the Middle East conflict. The market went with the latter, sending oil prices lower and Brent crude below USD100/bbl. We expect the market to stay nervous near-term and could easily see oil prices bounce higher again. The Trump administration proposed a 15-point peace plan to Iran via Pakistan, which offered to mediate talks. At the same time, the Pentagon sent 2,000 paratroopers to the area, adding to 4,500 Marines already en route and 50,000 troops stationed near Iran. Additionally, Iran informed the UN that "non-hostile" ships, excluding those linked to the US or Israel, may pass through the Strait of Hormuz.
In Japan, minutes from the Bank of Japan's January meeting revealed a hawkish stance, with many policymakers supporting further rate hikes to address inflationary pressures. Members also highlighted concerns over the weak yen's impact on prices. We expect the next rate hike from the BoJ in April, but much hinges on spring wage negotiations and of course energy prices.
What happened yesterday
In the euro area, the flash composite PMI fell more than expected in March to 50.5 (prior: 51.9), driven by a sharp drop in services to 50.1 (prior: 51.9). Manufacturing rose to 51.4 (prior: 50.8) but this was largely driven by longer delivery times amid supply distortions from the war in Iran. Manufacturing input prices surged to their highest level since September 2022, signalling a surge in cost, while output prices showed a muted increase. The print highlights the ECBs dilemma of balancing weaker growth and rising inflation, with communication so far focusing on inflation risks, reflecting a hawkish bias.
In the US, flash PMIs signalled steady demand and higher prices, mirroring trends in the euro area. Manufacturing came in surprisingly strong at 52.4 (prior: 51.6) driven by higher new orders (both domestic and exports), while services remained stable at 51.1 (prior: 51.7). Input and output subindices rose in both sectors, so far showing no clear signs of demand weakening from the energy shock.
In the UK, the flash composite PMI fell sharply to 51.0 in March (prior: 53.7), driven by slower growth in services at 51.2 (prior: 53.9) and manufacturing output at 50.1 (prior: 52.5). Supply chain disruptions from the Middle East conflict and surging energy prices pushed input costs higher and weakened demand, highlighting the Bank of England's challenge in balancing growth and inflation risks.
In Denmark, as indicated by polls, the general elections produced a complicated result with 12 parties in parliament and the biggest party (the Social Democrats) getting just 21.9% of the vote. The current centrist government lost its majority by a wide margin, and negotiations to form a new government are likely to be complicated and protracted. Fiscal policy as it stands will add around 0.5% of GDP to demand this year, and judging by the election campaign, negotiations might well result in modest further easing to mitigate the effect of higher energy prices. As with previous elections, this one should not trigger a market reaction. There continues to be fairly broad agreement around the fiscal framework, even if there is disagreement on how to prioritise within it.
In Hungary, the central bank held its rate at 6.25%, citing inflation risks from surging energy prices amid the Iranian conflict. The bank emphasised the importance of FX stability, maintaining tight monetary conditions to anchor inflation expectations and ensure financial stability.
Equities: Equity futures are higher this morning following reports that the US has sent a 15‑point plan to Iran aimed at ending the war. However, rumours of land troops hold investors from buying too much into this. Hence, futures are up only 0.5-1% this morning. What matters for equity markets is whether Hormuz will reopen in a potential ceasefire.
This followed a weaker session yesterday. AI disruption fears returned to the market as Anthropic announced that they are trialling a feature that lets users send prompts to Claude from their smartphone. Claude will then complete the task on its own on the user's computer. Tech, communication and real estate sold off. Cyclical appetite was solid, however, with materials and industrials faring relatively well.
FI and FX: Anxious, yet steady FX and FI markets yesterday. Energy prices remained elevated, with the price of Brent crude holding above the USD100/bbl before news that the US is working diplomacy to end the conflict which sent the price below USD100/bbl. NOK rebounded and rose together with the USD and EUR. EUR/USD traded around the 1.16 level. Upwards pressure on short-term interest rates, in particular on the EUR market, persisted amid more hawkish comments from ECB officials.
AUD/USD Daily Report
Daily Pivots: (S1) 0.6949; (P) 0.6987; (R1) 0.7034; More...
Intraday bias in AUD/USD stays neutral at this point, with focus on 0.6943 support. Decisive break there should confirm rejection by 0.7206 key fibonacci resistance. That would set up deeper correction to the whole up trend from 0.5913, and target 38.2% retracement of 0.5913 to 0.7187 at 0.6700. Nevertheless, strong rebound from current levels would retain near term bullishness for breakout through 0.7187 at a later stage.
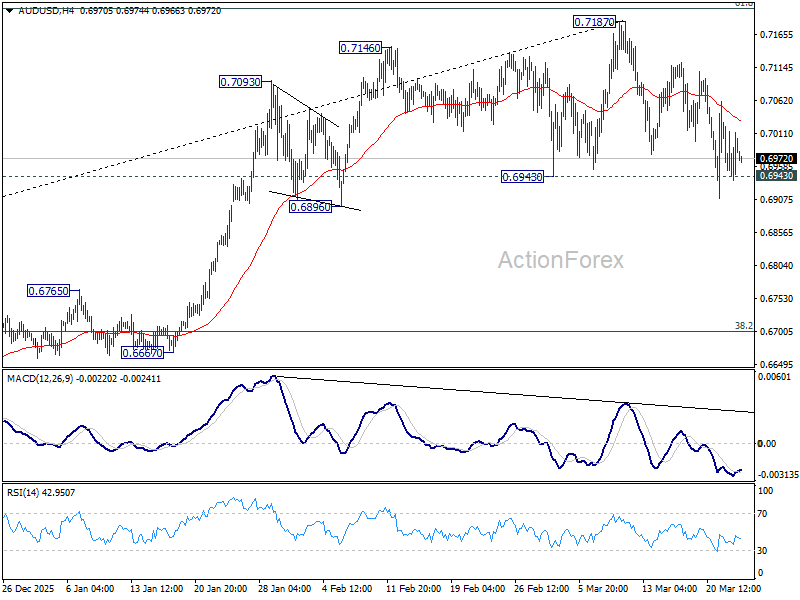
In the bigger picture, current development argues that rise from 0.5913 (2024 low) is reversing whole down trend from 0.8006 (2021 high). Decisive break of 61.8% retracement of 0.8006 to 0.5913 at 0.7206 will pave the way back to 0.8006. This will remain the favored case as long as 0.6706 resistance turned support holds, even in case of deep pullback.