Sample Category Title
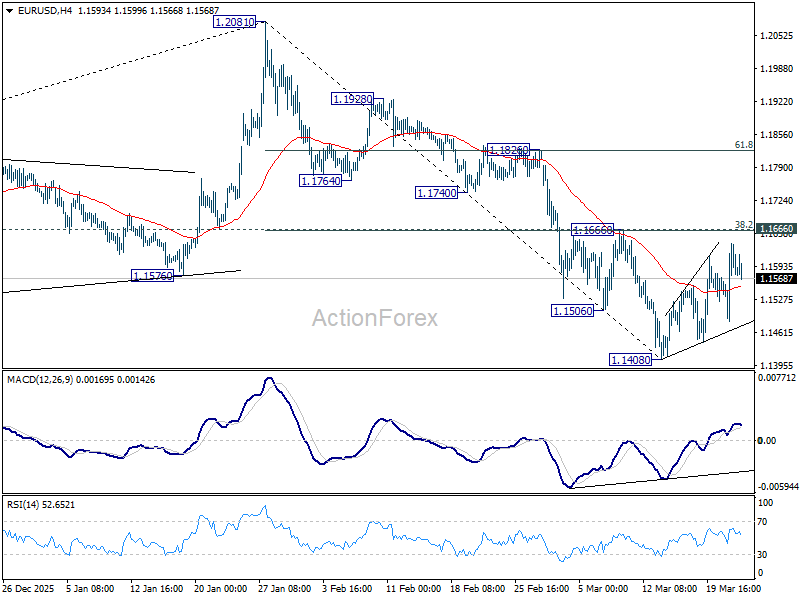
EUR/USD Mid-Day Outlook
Daily Pivots: (S1) 1.1519; (P) 1.1579; (R1) 1.1674; More….
Outlook in EUR/USD is unchanged as it's still extending consolidations from 1.1408. With 1.1666 cluster resistance (38.2% retracement of 1.2081 to 1.1408 at 1.1665) intact, further decline is in favor. On the downside, below 1.1408 will resume the fall from 1.2081 to 38.2% retracement of 1.0176 to 1.2081 at 1.1353. However, decisive break of 1.1666 will argue that the fall from 1.2081 has completed, and turn bias back to the upside for 61.8% retracement of 1.2081 to 1.1408 at 1.1824.
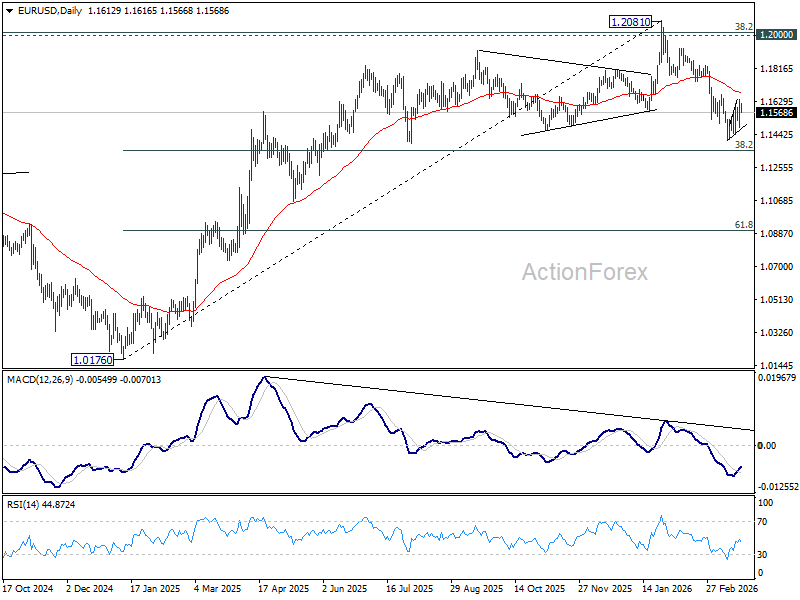
In the bigger picture, prior break of 55 W EMA (now at 1.1501) should confirm rejection by 1.2 key cluster resistance level. The whole up trend from 0.9534 (2022 low) might have completed as a three wave corrective rise too. Deeper fall is expected to long term channel support (now at 1.0528). Meanwhile, risk will stay on the downside as long as 1.2081 holds, even in case of strong rebound.
USD/CHF Mid-Day Outlook
Daily Pivots: (S1) 0.7819; (P) 0.7879; (R1) 0.7924; More….
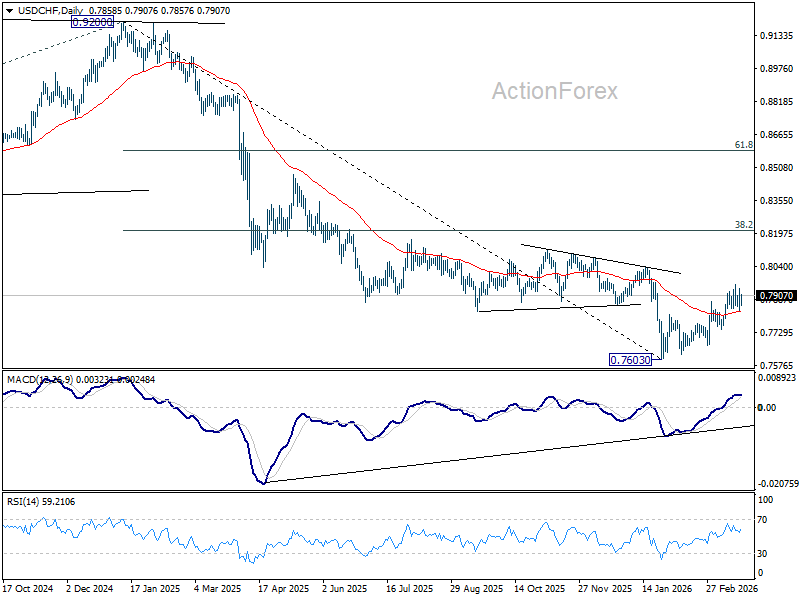
USD/CHF is still staying in consolidations below 0.7957 and intraday bias remains neutral. As noted before, rise from 0.7603 should be correcting whole decline from 0.9200. Above 0.7957 will target 38.2% retracement of 0.9200 to 0.7603 at 0.8213. This will remain the favored case as long as 0.7746 support holds.
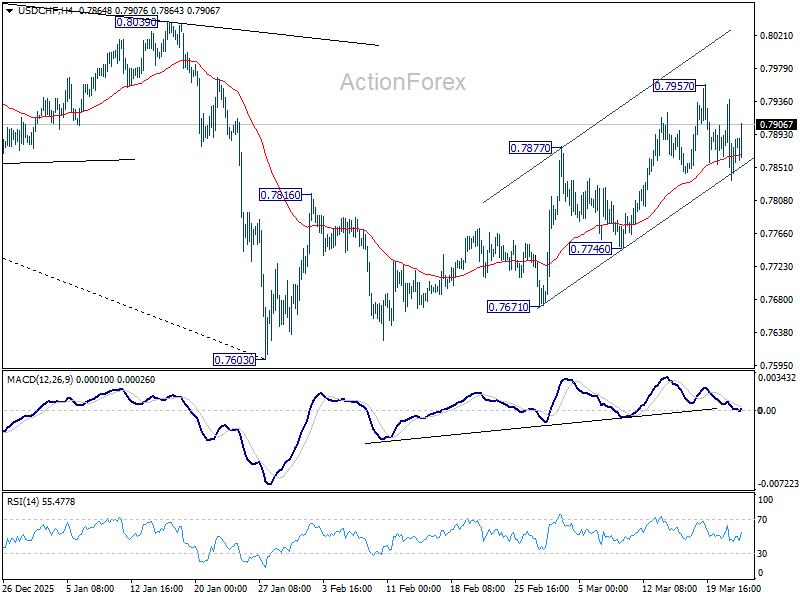
In the bigger picture, a medium term bottom should be in place at 0.7603 on bullish convergence condition in D MACD. Rebound from there is seen as correcting the fall from 0.9200 only. However, decisive break of 55 W EMA (now at 0.8085) will suggest that it's probably correcting the larger scale down trend from 1.0146 (2022 high). On the other hand, rejection by the 55 W EMA will setup down trend resumption to 100% projection of 1.0146 (2022 high) to 0.8332 from 0.9200 at 0.7382 at a later stage.
USD/JPY Mid-Day Outlook
Daily Pivots: (S1) 157.72; (P) 158.69; (R1) 159.40; More...
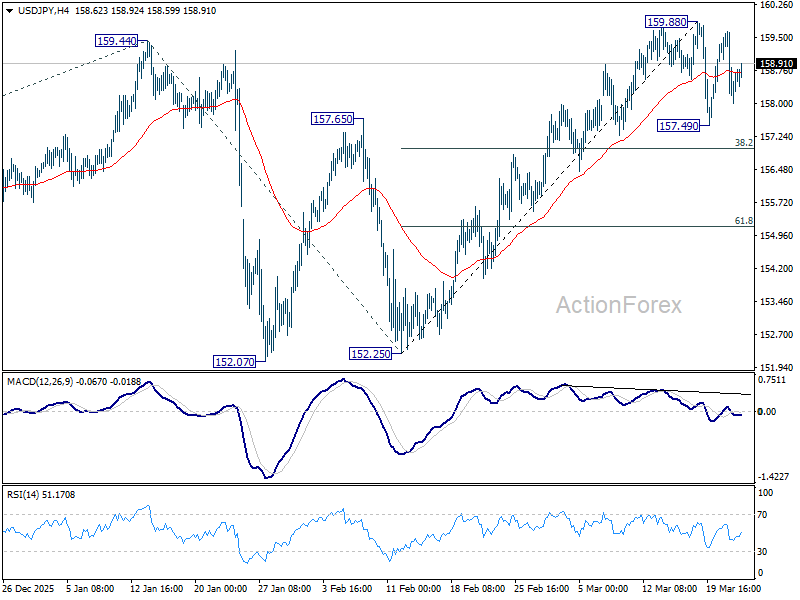
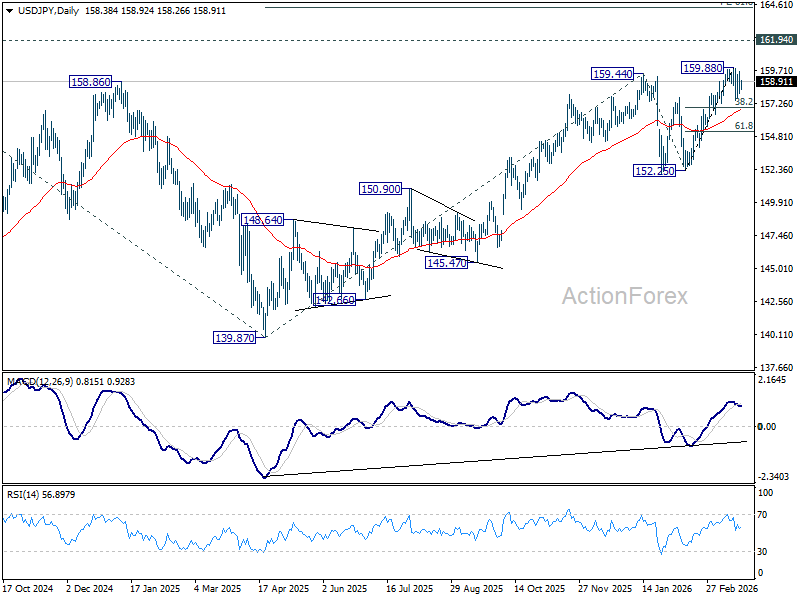
Range trading continues in USD/JPY and intraday bias remains neutral. In case of another dip, downside should be contained by 38.2% retracement of 152.25 to 159.88 at 156.96 to bring rebound. On the upside, break of 159.88 will target a test on 161.94 high.
In the bigger picture, outlook is unchanged that corrective pattern from 161.94 (2024 high) should have completed with three waves at 139.87. Larger up trend from 102.58 (2021 low) could be ready to resume through 161.94. This will remain the favored case as long as 55 W EMA (now at 152.70) holds. Firm break of 161.94 will pave the way to 61.8% projection of 102.58 to 161.94 from 139.87 at 176.75.
GBP/USD Mid-Day Outlook
Daily Pivots: (S1) 1.3300; (P) 1.3389; (R1) 1.3522; More...
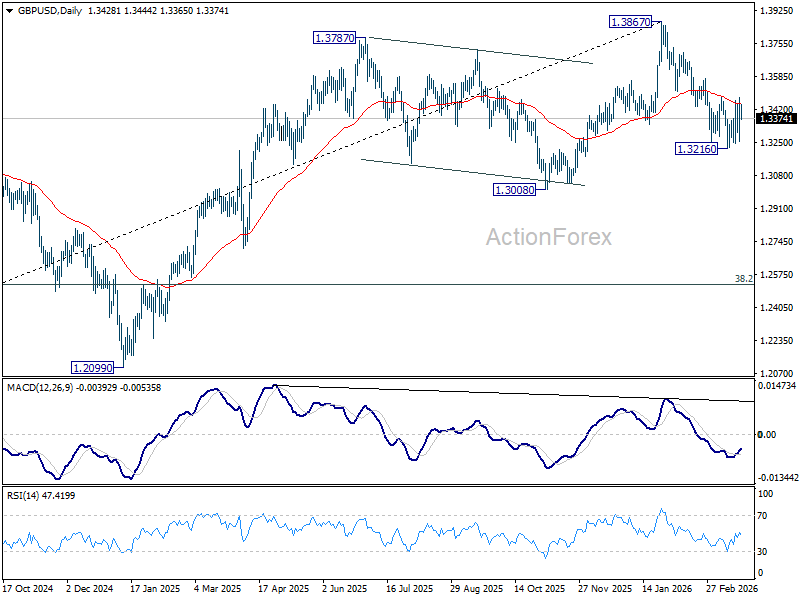
GBP/USD is still bounded in established range above 1.3216 and intraday bias remains neutral at this point. With 1.3482 resistance intact, further decline is in favor. On the downside, below 1.3216 will resume the fall from 1.3867 to 1.3008 structural support. However, decisive break of 1.3482 will argue that the fall from 1.3867 has completed, and turn bias back to the upside for 61.8% retracement of 1.3867 to 1.3216 at 1.3618.
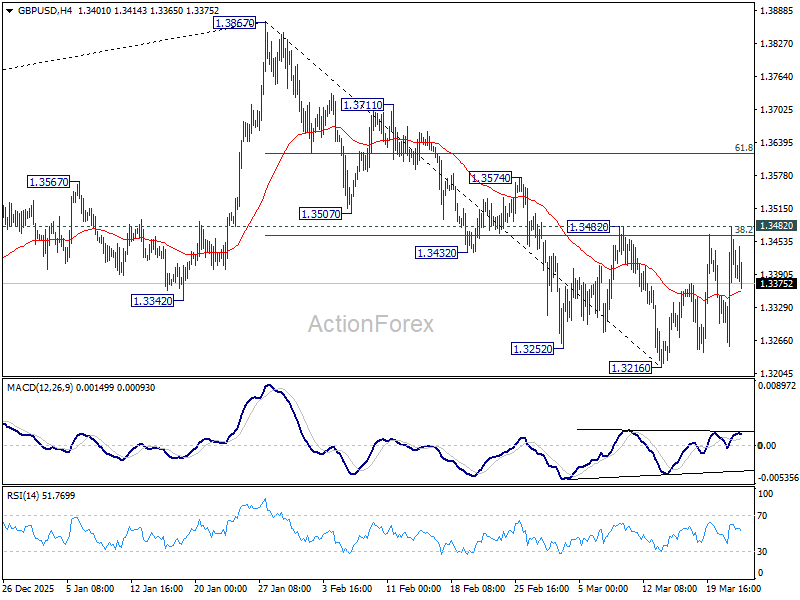
In the bigger picture, considering bearish divergence condition in both D and W MACD, a medium term top should be in place at 1.3867. Firm break of 1.3008 support will argue that fall from 1.3867 is at least correcting the rise from 1.0351 (2022 low) with risk of bearish reversal. That would open up further decline to 38.2% retracement of 1.0351 to 1.3867 at 1.2524. For now, medium term outlook will be neutral at best as long as 1.3867 resistance holds, or until further development.
Sterling Leads, Aussie Lags as PMIs Expose Uneven Stagflation Shock
Markets stayed cautious through the European session as a persistent “trust gap” around the Middle East conflict kept investors from fully embracing a peace pivot. Major European indexes traded sideways while US futures edged lower, reflecting a lack of conviction despite earlier optimism.
Oil continues to anchor sentiment. Brent crude is holding in a tight range above 100, signaling that traders are not pricing in a lasting de-escalation. The absence of tangible progress—such as a reopening of the Strait of Hormuz—has left markets reluctant to extend risk-on positioning.
Against this backdrop, today’s flash PMI releases offer a clearer macro signal. While they have not triggered immediate moves in FX markets, they provide what can be seen as a “smoking gun” for emerging stagflation risks stemming from the Middle East conflict. The key takeaway is not just stagflation, but divergence. The same shock—higher energy costs and supply chain disruptions—is being transmitted unevenly across economies, shaping different growth-inflation trade-offs and, in turn, different policy paths.
In the UK, the data point to a clear inflation shock. Manufacturing cost inflation surged to its highest level since the 1992 Sterling crisis, with firms already passing higher costs onto consumers. Despite this, both manufacturing and services remain in expansion. This dynamic strengthens the case for a more hawkish Bank of England stance. Policymakers are effectively “fighting a fire with a hose”.
Australia, by contrast, is facing a growth shock. It is the only major economy in this group where PMI Composite has already fallen into contraction territory, driven by a sharp deterioration in services activity. A further rate hike in May is now far more contentious. While markets still price a reasonable probability of tightening, the growth side of the equation is deteriorating quickly, raising the risk that additional hikes could push the economy into a deeper downturn.
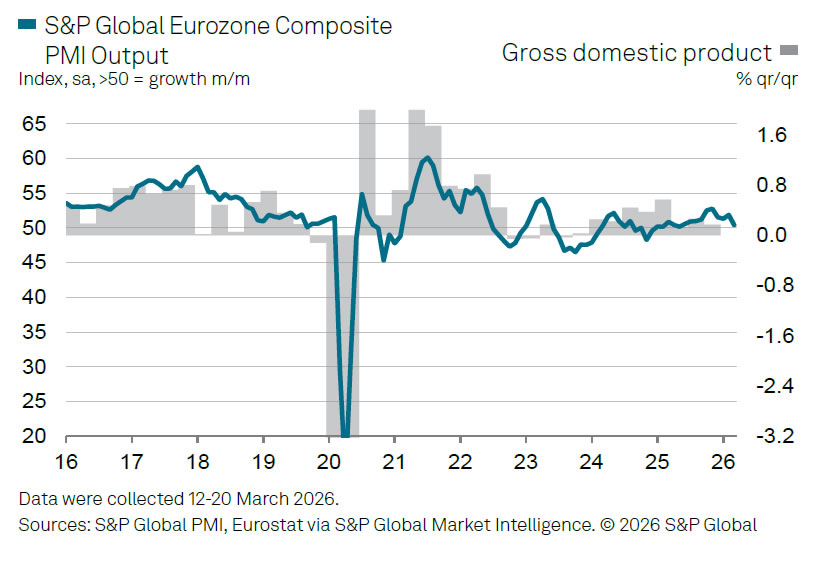
In the Eurozone, the picture is more muddled. Manufacturing activity has shown some improvement, but services are close to stalling, leaving the Composite reading hovering near stagnation. This split creates a policy “tug-of-war” within the ECB. With growth estimated at around 0.1% and inflation pressures building toward 3%, the ECB faces a classic stagflation dilemma. The likely response is a wait-and-see approach, particularly as policymakers assess whether energy prices push materially higher.
Japan stands out as relatively resilient for now. Business activity remains in expansion, supported by stable demand, although rising energy costs are beginning to filter through. Inflation is likely to pick up again as the effects of subsidies fade. But for now, Japan could still "enjoying the last bit of sunshine".
In currency markets, these divergences are becoming clearer. Sterling is the strongest performer for the week so far, followed by Yen and Euro, while Australian Dollar leads losses alongside Kiwi. Dollar and Swiss Franc are more neutral, reflecting the broader uncertainty. Until geopolitical clarity emerges, markets are likely to remain caught between fragile optimism and persistent stagflation risks.
In Europe, at the time of writing, FTSE is down -0.24%. DAX is down -0.88%. CAC is down -0.39%. UK 10-year yield is up 0.037 at 4.894. Germany 10-year yield is up 0.035 at 3.043. Earlier in Asia, Nikkei rose 1.43%. Hong Kong HSI rose 2.79%. China Shanghai SSE rose 1.78%. Singapore Strait Times rose 0.44%. Japan 10-year JGB yield fell -0.052 to 2.271.
Eurozone PMIs point to stagflation with 3% inflation and 0.1% growth
Eurozone PMI data point to rising stagflation risks, with inflation nearing 3% while growth slows to just 0.1%. Surging energy costs and weakening demand are squeezing activity and complicating the ECB’s policy outlook. Read more.
UK PMIs show manufacturing cost inflation at highest since 1992 Sterling crisis
UK PMI data show manufacturing cost inflation surging to its highest since the 1992 Sterling crisis, as energy prices and supply disruptions hit growth and raise stagflation risks. Read More.
BoJ's Ueda: Inflation to rise moderately, food tax cut impact limited
BoJ Governor Kazuo Ueda expects inflation to rise moderately, supported by a strengthening wage-price cycle, while downplaying the long-term impact of a proposed food tax cut. Read more.
Japan core CPI falls to 1.7% in February, as energy costs drag inflation lower
Japan CPI data point to easing inflation momentum driven by energy costs, though core-core inflation suggests underlying pressures remain. Read more.
Japan PMI composite falls to 52.5, war lifts costs and hits sentiment
Japan’s PMI data show growth cooling as input costs surge and business sentiment weakens. The Middle East conflict is lifting energy prices and disrupting supply chains, squeezing margins and raising uncertainty. Read more.
Australia PMI composite falls to 47, cost inflation hits 3-yr high on Middle East conflict
Australia’s PMI data signal a sharp shift into contraction as demand weakens and cost inflation surges to a three-year high. The combination highlights early stagflation risks as the Middle East shock begins to hit growth and prices. Read more.
RBNZ's Breman warns of inflation spike but cautions against overreaction
RBNZ Governor Anna Breman warns the Middle East conflict will lift inflation while weighing on growth, but stresses policy must avoid overreacting to temporary shocks. The focus remains on preventing short-term price spikes from becoming persistent inflation. Read more.
GBP/USD Mid-Day Outlook
Daily Pivots: (S1) 1.3300; (P) 1.3389; (R1) 1.3522; More...
GBP/USD is still bounded in established range above 1.3216 and intraday bias remains neutral at this point. With 1.3482 resistance intact, further decline is in favor. On the downside, below 1.3216 will resume the fall from 1.3867 to 1.3008 structural support. However, decisive break of 1.3482 will argue that the fall from 1.3867 has completed, and turn bias back to the upside for 61.8% retracement of 1.3867 to 1.3216 at 1.3618.
In the bigger picture, considering bearish divergence condition in both D and W MACD, a medium term top should be in place at 1.3867. Firm break of 1.3008 support will argue that fall from 1.3867 is at least correcting the rise from 1.0351 (2022 low) with risk of bearish reversal. That would open up further decline to 38.2% retracement of 1.0351 to 1.3867 at 1.2524. For now, medium term outlook will be neutral at best as long as 1.3867 resistance holds, or until further development.
WTI: Oil Price Rises After Iran Described Trump’s Peace Talks as Fake News
WTI oil price rose above $90 per barrel on Tuesday after sharp Monday’s drop (around 10%) to $84.50 (the lowest since Mar 11) after President Trump announced a peace deal with Iran and postponed US military action towards Iranian energy sector, sending shockwaves through the markets.
Iran’s response that Trump’s announcement was just a fake news, primarily oriented to stabilize stock markets and fresh wave of attacks on Israel overnight, soured the sentiment again, although so far limited bounce suggests that markets probably need more time to digest all story and generate clearer direction signal.
However, fresh escalation of the conflict fuels supply fears despite temporary relief, provided by Monday’s sharp drop that pushed the price away from $100 breakpoint and keeps in play hopes for stronger recovery.
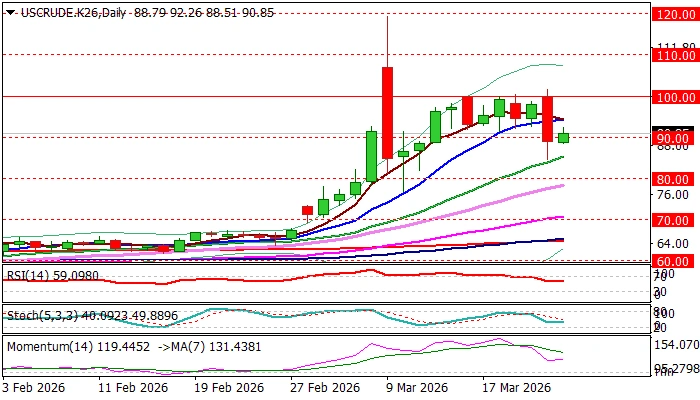
Bullishly aligned daily studies (most of DMAs remain in full bullish setup, with formation of 100/200DMA bull cross/still strong positive momentum/daily Tenkan-sen crossed above Kijun-sen) support the idea, which still requires validation of developing positive signals.
Today’s close above $90 will be the minimum requirement, with extension above $93.00 zone (former range floor/50% retracement of Monday’s drop) and violation of 10DMA ($94.25) needed to bring bulls back to play and shift focus towards $100.
Caution on repeated close below $90 that would keep the downside vulnerable.
Res: 91.05; 92.26; 93.00; 94.25.
Sup: 89.11; 88.54; 86.72; 84.50.
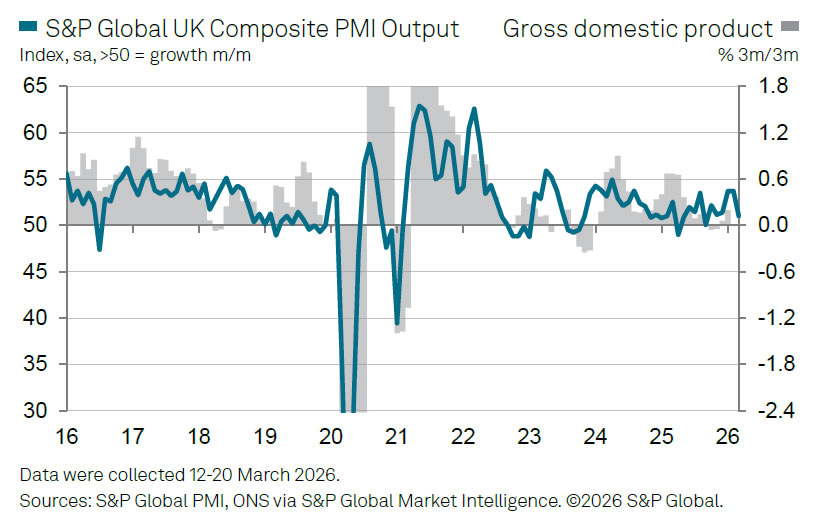
UK PMIs show manufacturing cost inflation at highest since 1992 Sterling crisis
UK PMI data for March point to a sharp loss of growth momentum as the Middle East conflict begins to weigh on activity. PMI Manufacturing edged down from 51.7 to 51.4, while PMI Services dropped more notably from 53.9 to 51.2, a six-month low. As a result, PMI Composite declined from 53.7 to 51.0, also marking its weakest level in six months.
The slowdown reflects weakening demand across both sectors. Firms reported lost business linked directly to the conflict, citing heightened risk aversion among customers, disruptions to travel and supply chains, and the impact of higher interest rates. According to S&P Global’s Chris Williamson, output growth has slowed “to a crawl”.
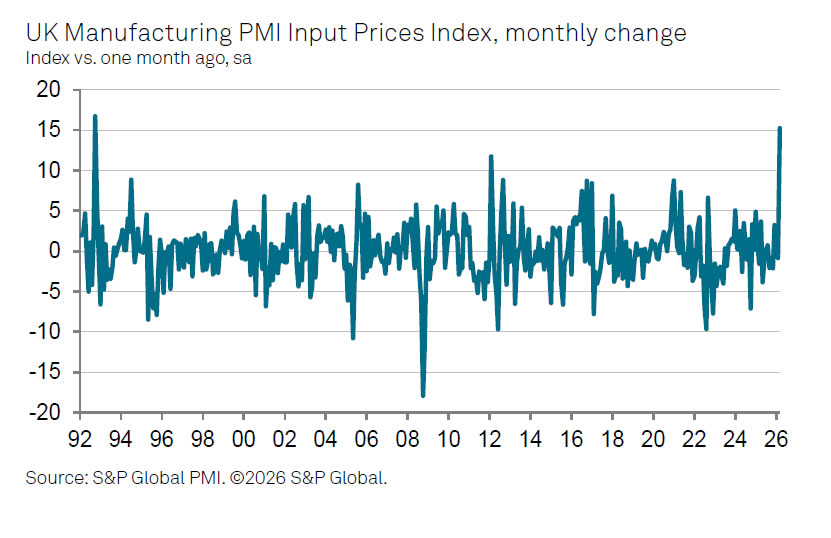
At the same time, inflation pressures are accelerating sharply. Rising energy prices and supply chain disruptions have driven a surge in input costs, with manufacturing cost inflation reaching its highest level since the aftermath of Sterling’s depreciation in 1992.
Crypto Again Attempts to Break the Downtrend
Market Overview
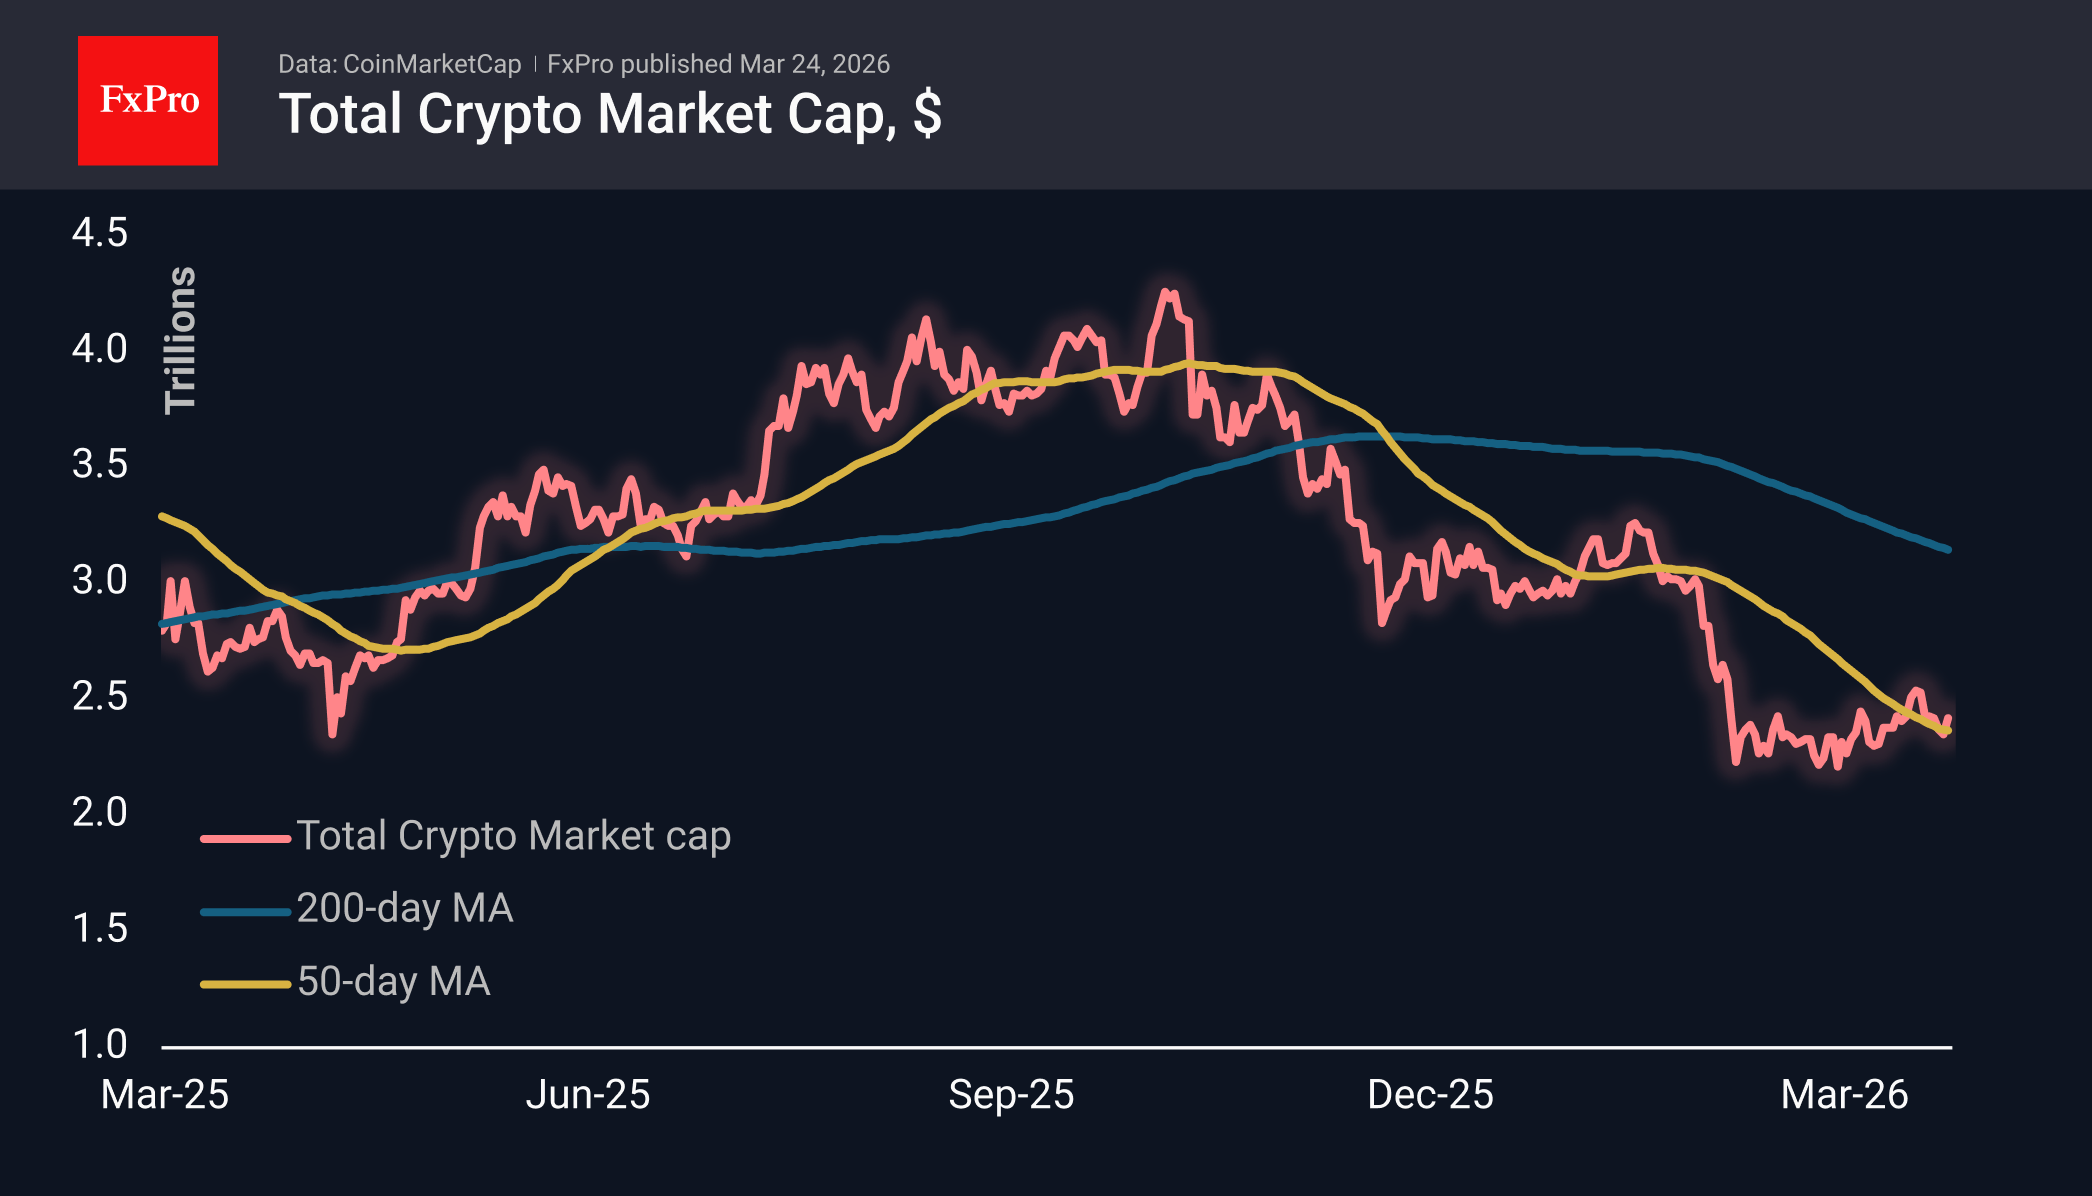
The crypto market cap has increased by nearly 4% over the past 24 hours, remaining near the high reached after Trump announced talks with Iran. This outperforms most related markets, where initial momentum has waned. Among the major coins, the relatively smaller Aptos (+15%), Filecoin (+10%), and Toncoin (+7.4%) are performing better than others. Monero (-2%) and Polkadot (+1%) are underperforming. Meanwhile, the crypto market has been trading around its 50-day moving average for the past 10 days, with a few attempts to move above it.
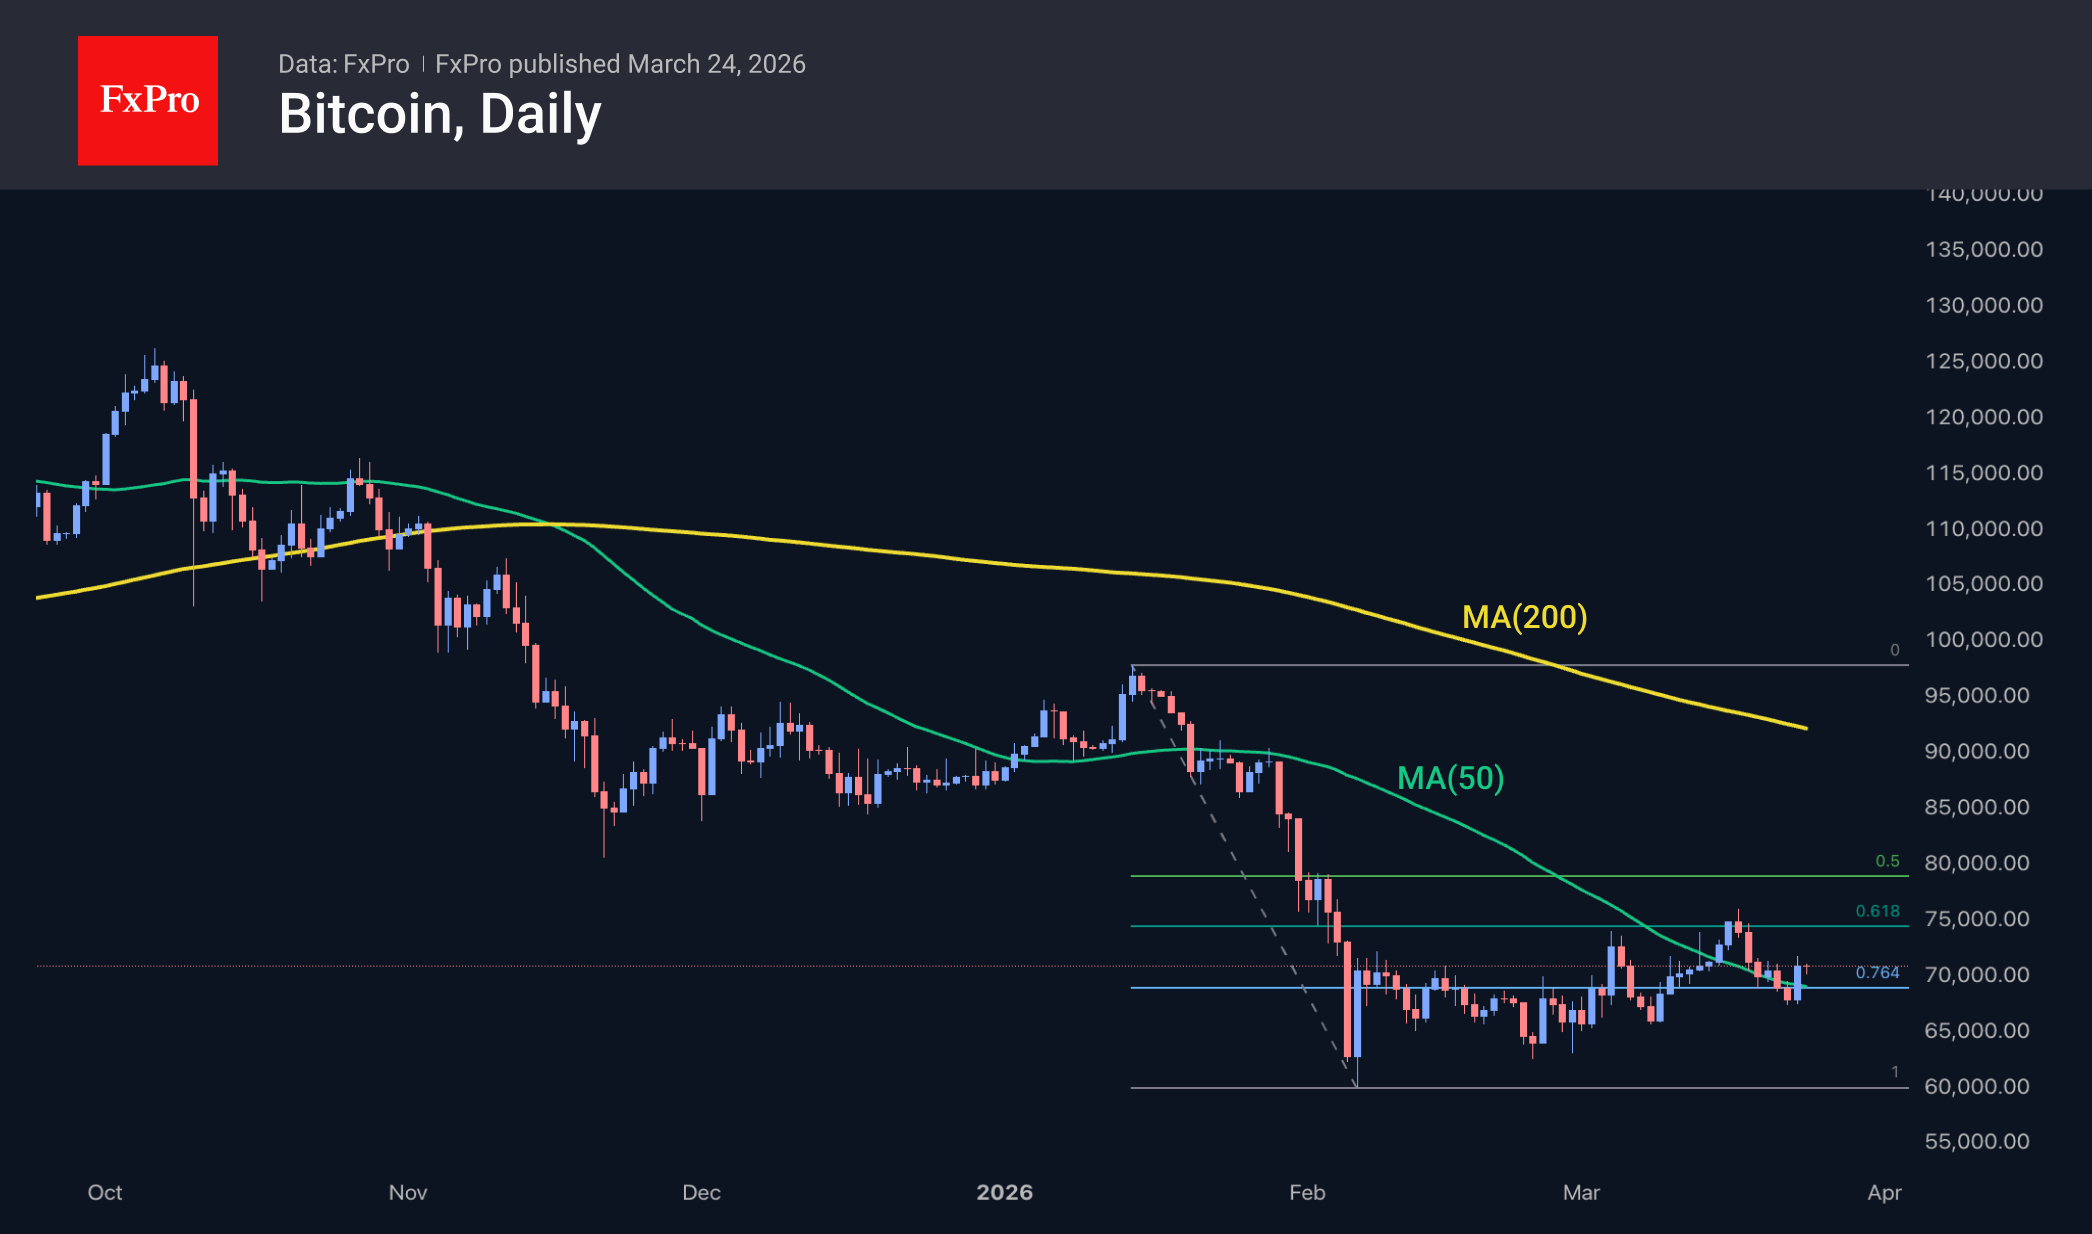
Bitcoin has risen by more than 4.5%, staying just below $71K. Although the leading cryptocurrency did not immediately capitalise on the upward momentum and extend its gains, simply remaining at these high levels now suggests confidence among the bulls. They are gradually developing a more optimistic outlook. However, it would be premature to declare the end of the downtrend until prices settle above $75K, where the March pivot points and the 61.8% Fibonacci retracement level from the January-February decline are concentrated.
News Background
According to CoinShares, global investment in crypto funds increased by $230 million last week, representing a fivefold decrease from the previous week. Investments in Bitcoin rose by $219 million, in Solana by $17 million, in Chainlink by $5 million, and in XRP by $3 million. Investments in Ethereum declined by $28 million.
Bitcoin can serve as a liquid asset and an ‘exit point’ for investors amid instability in global markets, notes the hedge fund Weiss Multi-Strategy Advisers.
The current decline in Bitcoin is connected to a four-year cycle and profit-taking by long-term holders. The bull run is expected to start in the fourth quarter of this year, according to Anthony Scaramucci, managing partner at SkyBridge Capital.
In mid-March, the average cost of mining a single Bitcoin increased to $88K, according to calculations by Checkonchain. At a market price of about $69K, miners are losing an average of roughly 21%.
Strategy bought an extra 1,031 BTC ($76 million) last week at an average price of $74,326 per coin. The company now owns 762,099 BTC at an average purchase price of $75,694 and aims to raise an additional $44 billion for further acquisitions.
Oil and silver have surpassed Solana and XRP in trading volumes on the decentralised Hyperliquid platform. This exchange is increasingly popular for trading commodity contracts, especially at weekends when traditional markets are closed.
Bitcoin Faces Textbook Rejection at Blue Box Zone
In this technical blog, we will look at the past performance of the 4-hour Elliott Wave Charts of Bitcoin. In which, the decline from 14 January 2026 high ended 5 waves in an impulse sequence and showed a lower low sequence in a corrective pattern. Therefore, we knew that the structure of Bitcoin is incomplete to the downside & should see more weakness. So, we advised members to sell the bounces in 3, 7, or 11 swings at the blue box areas. We will explain the structure & forecast below:
Bitcoin 4-Hour Elliott Wave Chart From 3.02.2026
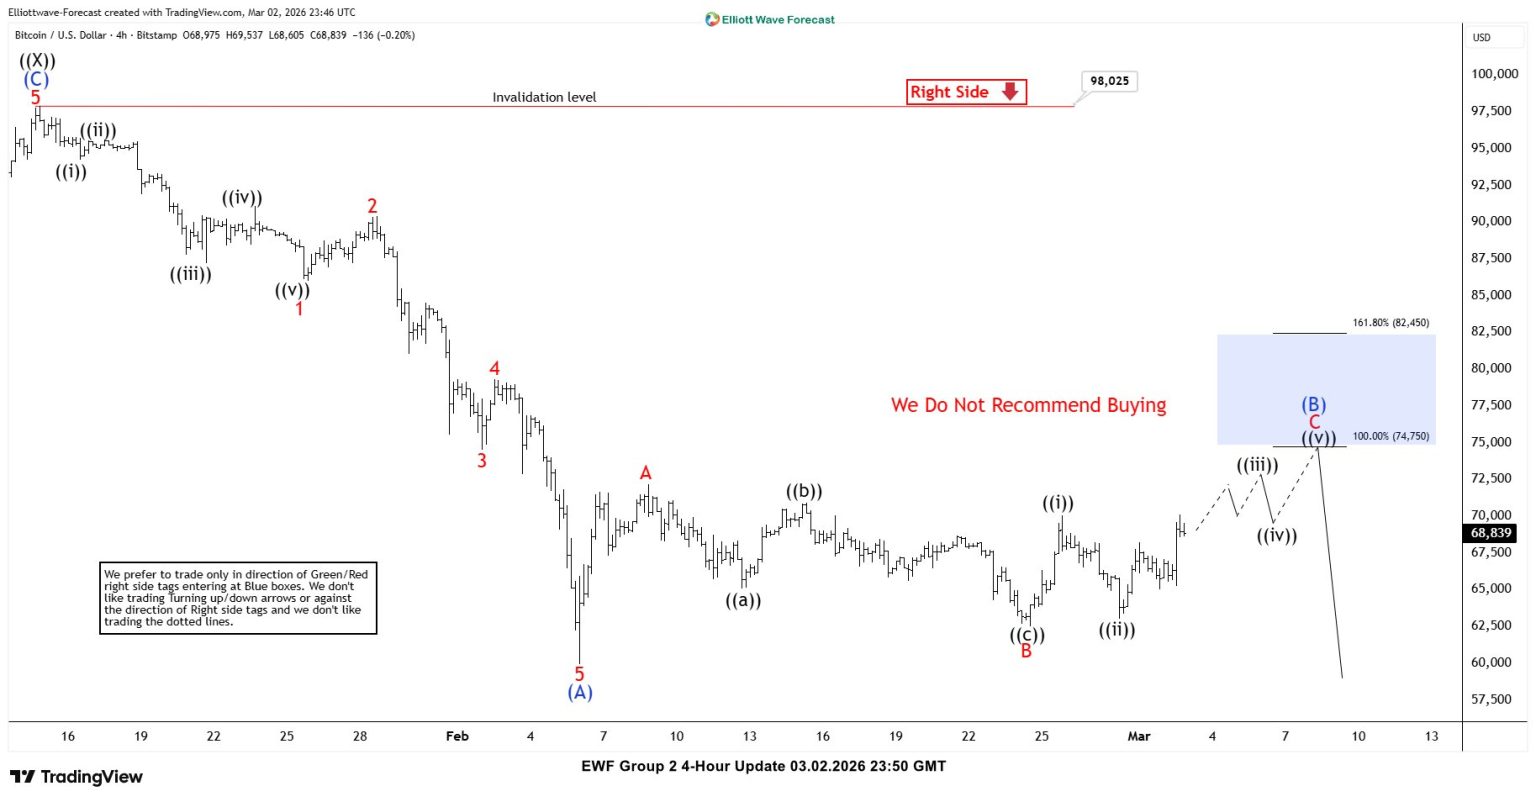
Here’s 4-hour Elliott wave Chart from the 3.02.2026 update. In which, the decline to $59930 low ended 5 waves from the 1.14.2026 high within wave (A) & made a wave (B) bounce. The internals of that bounce unfolded as an Elliott wave zigzag correction where wave A ended at $72174 high. Then a decline to $62525 ended wave B pullback and started the C leg higher towards $74750- $82450 blue box area from where sellers were expected to appear looking for more downside or for a 3 wave reaction lower at least.
Bitcoin Latest 4-Hour Elliott Wave Chart From 3.24.2026
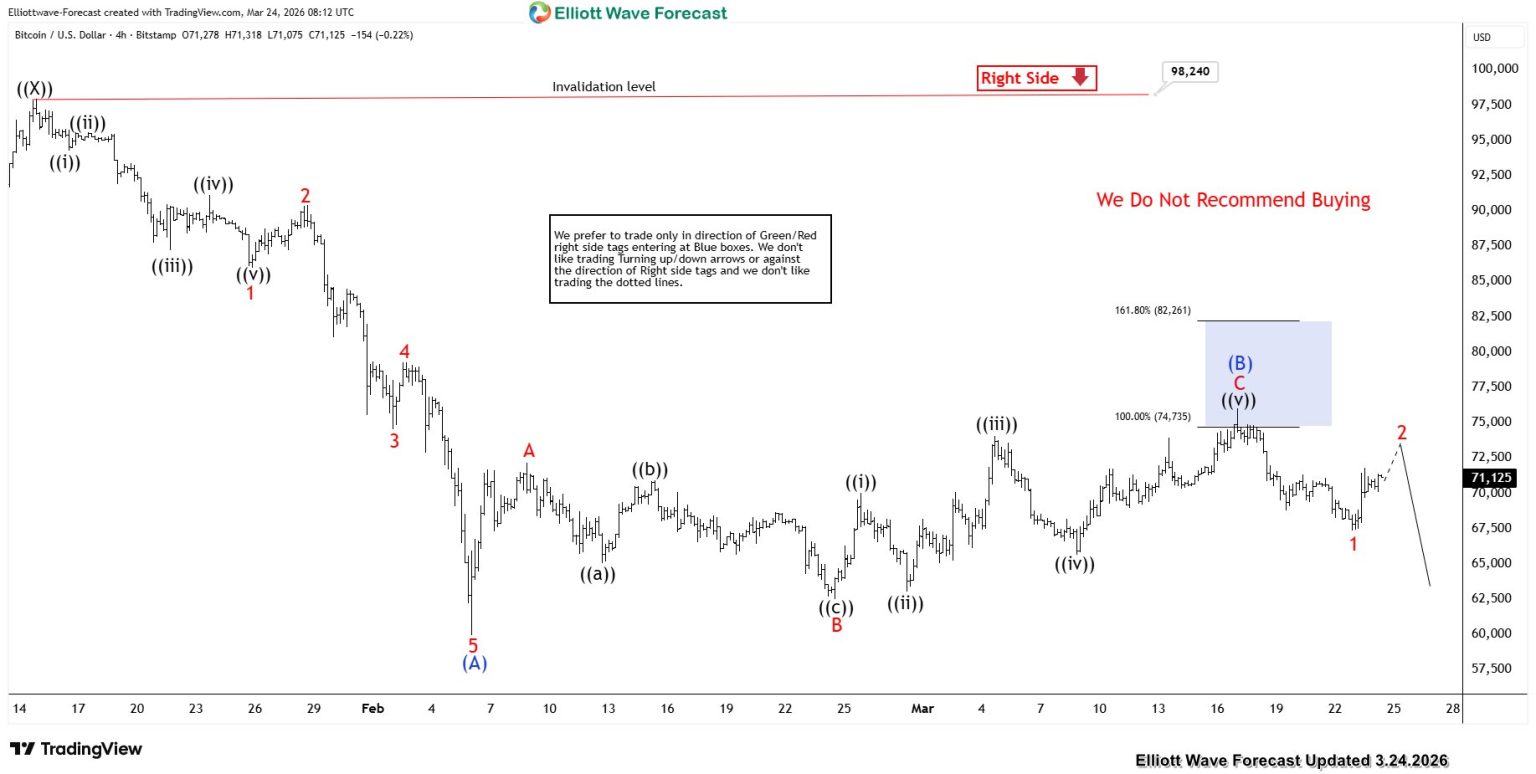
This is the Latest 4-hour view from the 3.24.2026 update. In which the BTCUSD is showing a strong reaction lower taking place from the equal legs area allowing shorts to get into a risk-free position shortly after taking the position.
Eurozone PMIs point to stagflation with 3% inflation and 0.1% growth
Eurozone PMI data for March point to growing stagflation risk, with rising cost pressures colliding with slowing growth. PMI Manufacturing rose from 50.8 to 51.4, marking a 45-month high. But this strength was offset by weakness in services, where PMI Services fell from 51.9 to 50.1. As a result, PMI Composite declined from 51.9 to 50.5, its lowest level in 10 months.
The divergence highlights an uneven economic picture. While manufacturing continues to benefit from pockets of external demand, the services sector is losing momentum as business confidence deteriorates and new orders weaken. According to S&P Global’s Chris Williamson, output growth has slowed to "near-stagnation", with forward-looking indicators pointing to a heightened risk of a downturn in the coming months.
At the same time, inflation pressures are intensifying sharply. Firms reported the fastest rise in input costs in over three years, driven by higher energy prices and worsening supply chain disruptions linked to the Middle East conflict. Supplier delays have surged to their highest since mid-2022.
The data present a difficult backdrop for the EB. With growth slowing toward stagnation while price pressures accelerate, policymakers face a challenging trade-off. Williamson noted that the ECB is no longer in a “good place” on the growth-inflation balance, with survey indicators pointing to inflation nearing 3% and GDP growth slipping below 0.1% in the near term.