
Sample Category Title
EUR/GBP Daily Outlook
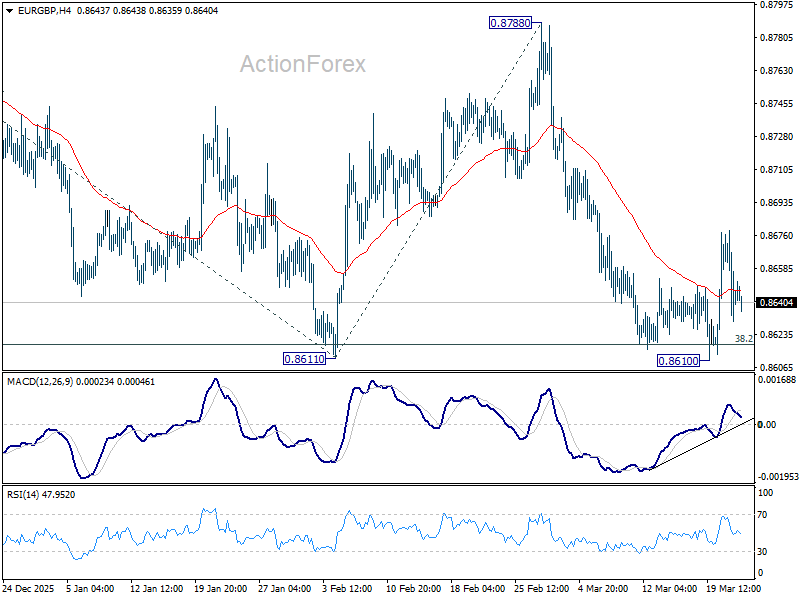
Daily Pivots: (S1) 0.8625; (P) 0.8654; (R1) 0.8676; More…
Intraday bias in EUR/GBP remains neutral for the moment. With 55 D EMA (now at 0.8682) intact, further decline is in favor. On the downside, firm break of 0.8611 will resume the whole fall from 0.8863 to 100% projection of 0.8863 to 0.8611 from 0.8788 at 0.8536. However, sustained break above 55 D EMA will turn bias back to the upside for 0.8788 resistance instead.
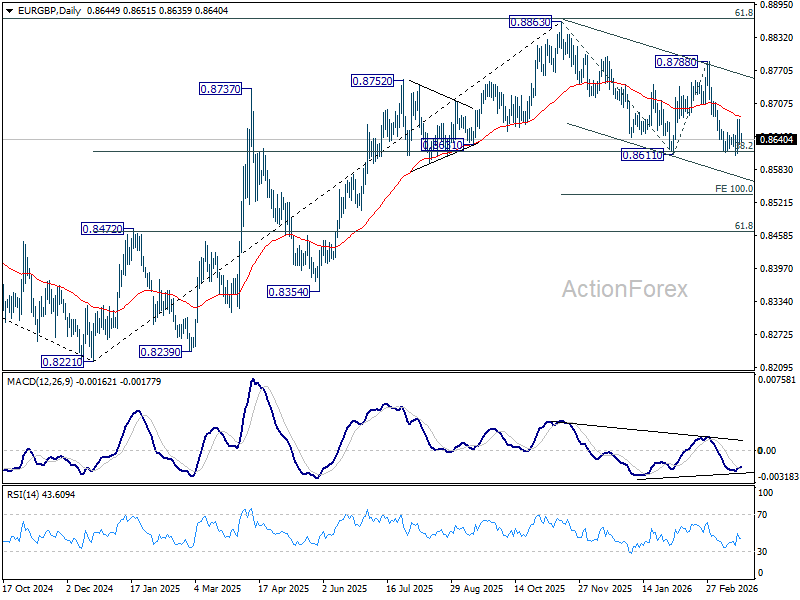
In the bigger picture, current development revived the case that whole rise from 0.8221 (2024 low) has completed at 0.8863, after rejection by 61.8% retracement of 0.9267 (2022 high) to 0.8221 at 0.8867. Sustained trading below 38.2% retracement of 0.8821 to 0.8863 at 0.8618 will confirm this case, and bring deeper fall to 61.8% retracement at 0.8466 at least. For now, medium term outlook is neutral at best as long as 0.8863 resistance holds.
EUR/AUD Daily Outlook
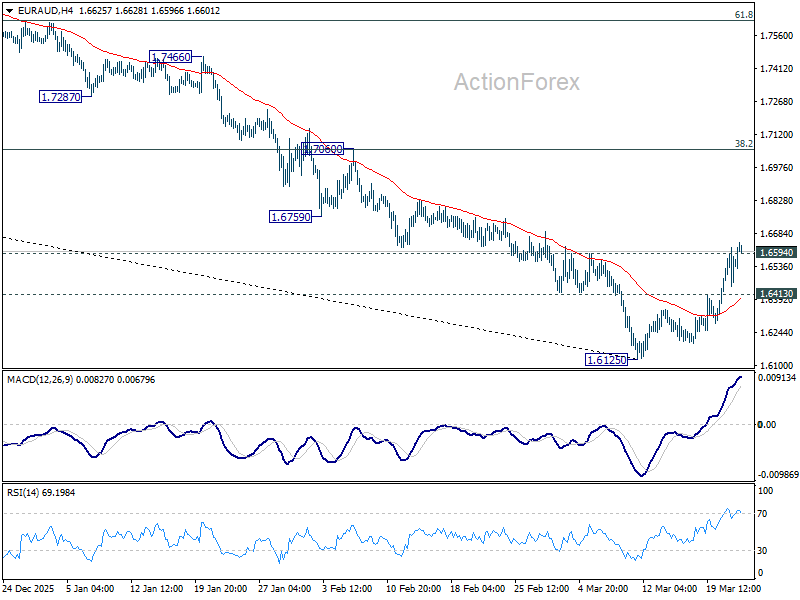
Daily Pivots: (S1) 1.6469; (P) 1.6546; (R1) 1.6642; More...
EUR/AUD's break of 1.6594 resistance indicates that a short term bottom was already formed at 1.6125. Intraday bias is back on the upside for stronger rebound to 55 D EMA (now at 1.6769). Firm break there will target 38.2% retracement of 1.8554 to 1.6125 at 1.7053. Nevertheless, below 1.6413 minor support will bring retest of 1.6125 low.
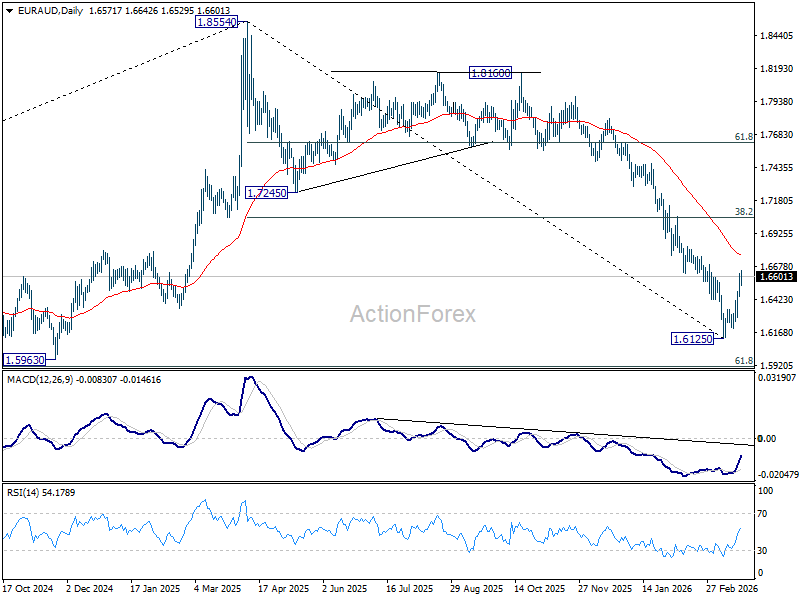
In the bigger picture, fall from 1.8554 medium term top is seen as reversing the whole up trend from 1.4281 (2022 low). Deeper decline should be seen to 61.8% retracement of 1.4281 to 1.8554 at 1.5913, which is slightly below 1.5963 structural support. Decisive break there will pave the way back to 1.4281. For now, risk will stay on the downside as long as 55 W EMA (now at 1.7245) holds, even in case of strong rebound.
EUR/CHF Daily Outlook
Daily Pivots: (S1) 0.9102; (P) 0.9124; (R1) 0.9154; More....
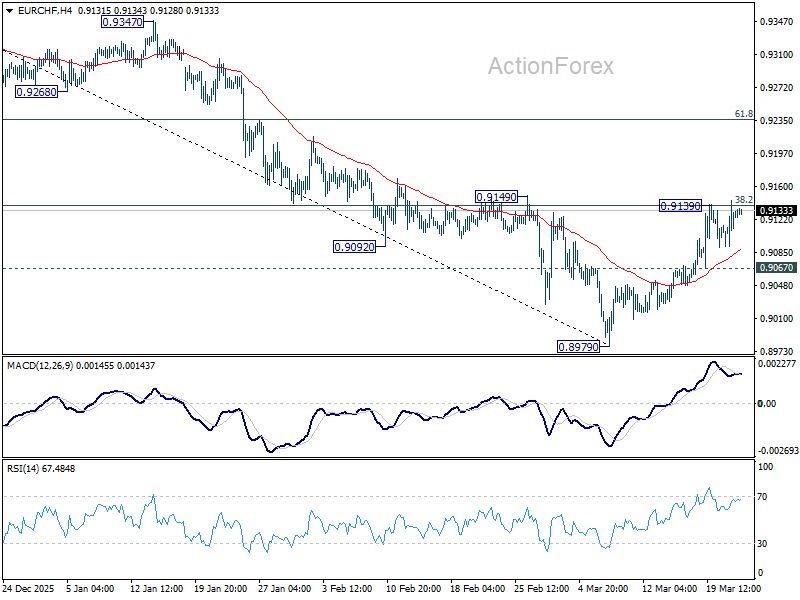
Intraday bias in EUR/CHF remains neutral for the moment. On the upside, firm break of 38.2% retracement of 0.9394 to 0.8979 at 0.9138 will extend the rebound from 0.8979 short term bottom to 61.8% retracement at 0.9235. On the downside, below 0.9067 minor support will turn intraday bias back to the downside for retesting 0.8979 low instead.
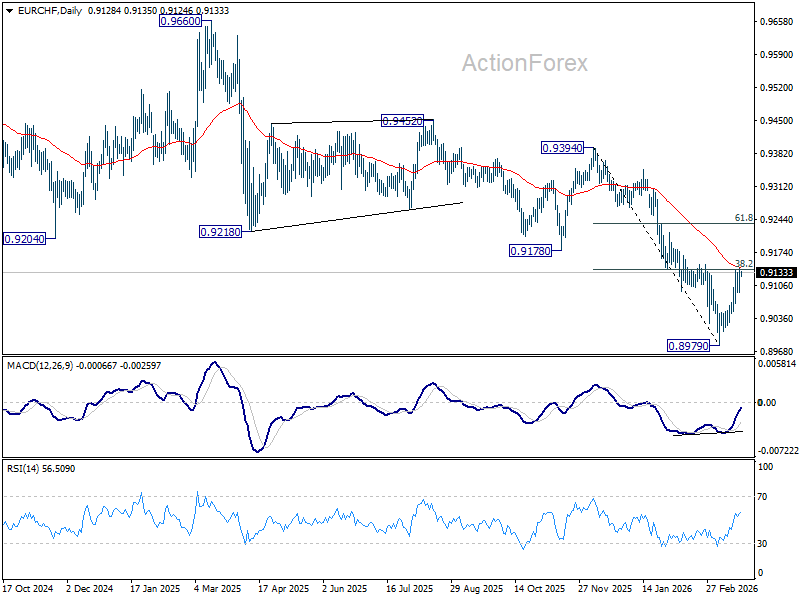
In the bigger picture, down trend from 0.9928 (2024 high) is still in progress. Next target is 61.8% projection of 1.1149 to 0.9407 from 0.9928 at 0.8851. Outlook will stay bearish as long as 0.9394 resistance holds, in case of rebound.
EUR/USD Daily Outlook
Daily Pivots: (S1) 1.1519; (P) 1.1579; (R1) 1.1674; More….
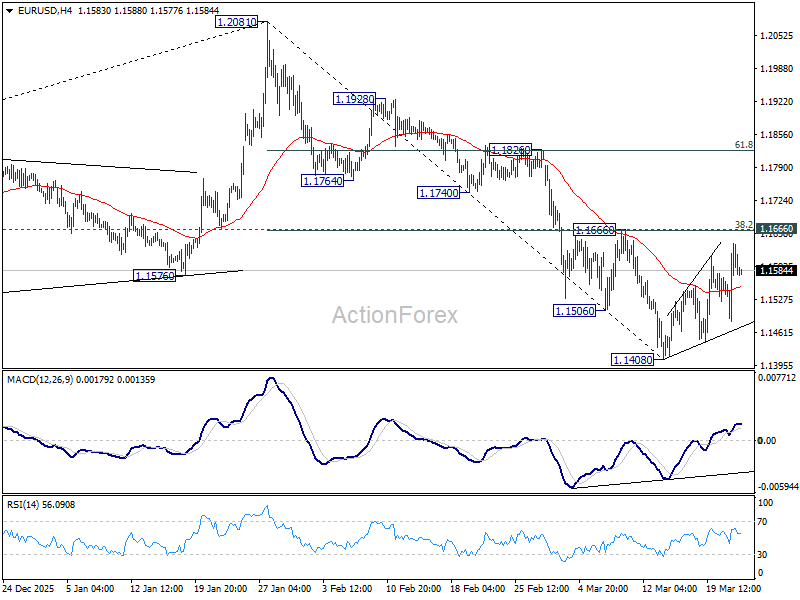
Intraday bias in EUR/USD stays neutral for the moment. More consolidations could be seen above 1.1408. But with 1.1666 cluster resistance (38.2% retracement of 1.2081 to 1.1408 at 1.1665) intact, further decline is in favor. On the downside, below 1.1408 will resume the fall from 1.2081 to 38.2% retracement of 1.0176 to 1.2081 at 1.1353. However, decisive break of 1.1666 will argue that the fall from 1.2081 has completed, and turn bias back to the upside for 61.8% retracement of 1.2081 to 1.1408 at 1.1824.
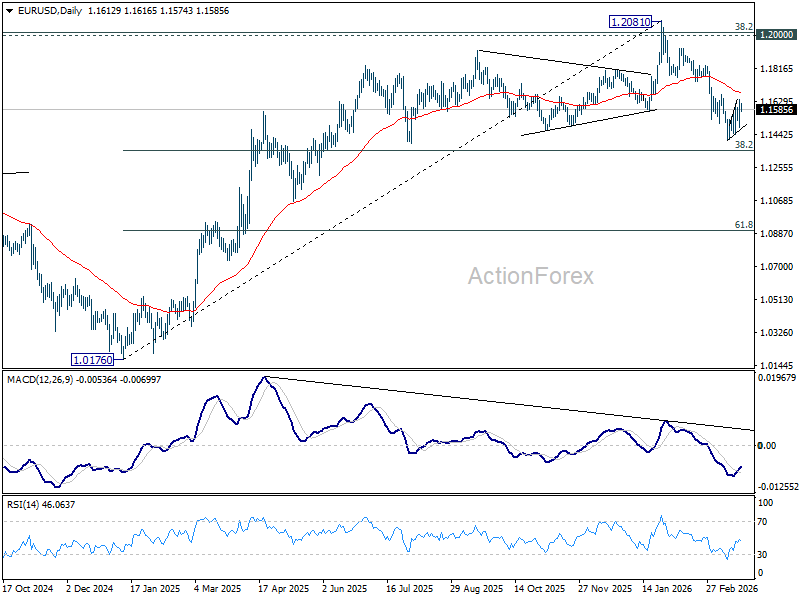
In the bigger picture, prior break of 55 W EMA (now at 1.1501) should confirm rejection by 1.2 key cluster resistance level. The whole up trend from 0.9534 (2022 low) might have completed as a three wave corrective rise too. Deeper fall is expected to long term channel support (now at 1.0528). Meanwhile, risk will stay on the downside as long as 1.2081 holds, even in case of strong rebound.
USD/JPY Daily Outlook
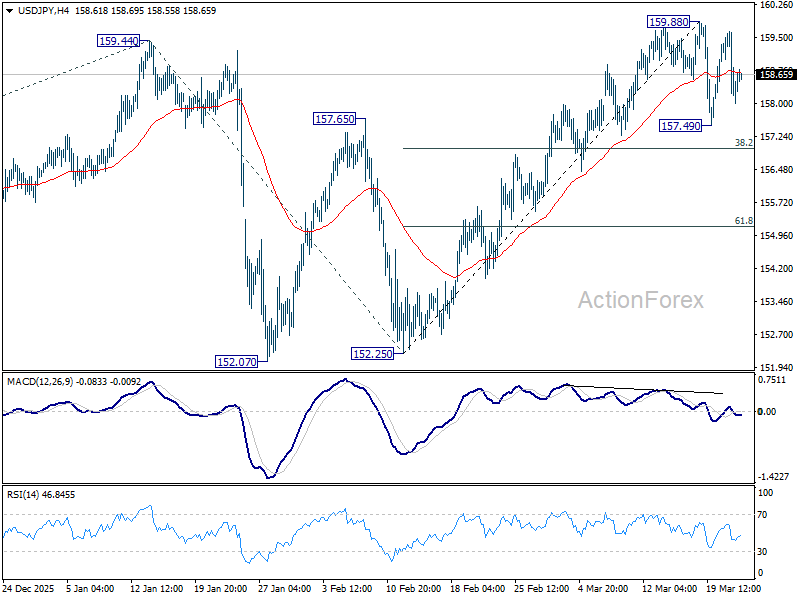
Daily Pivots: (S1) 157.72; (P) 158.69; (R1) 159.40; More...
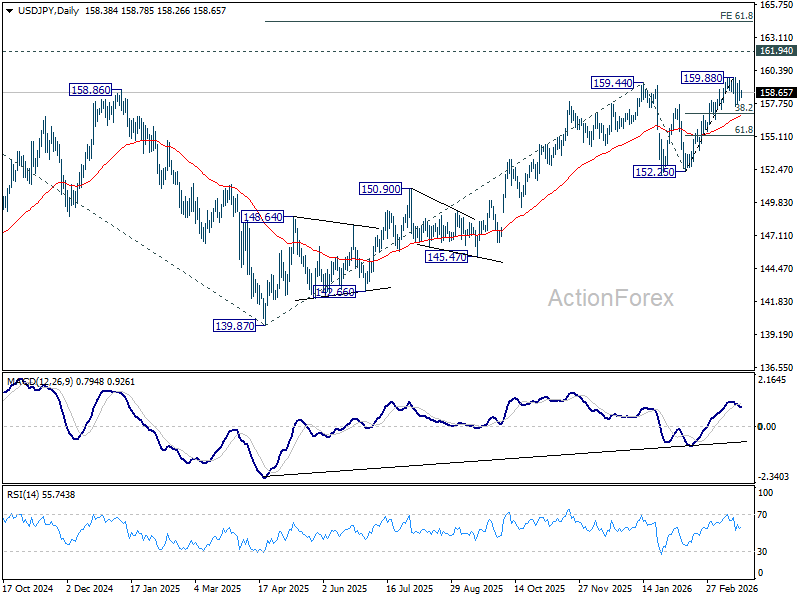
Intraday bias in USD/JPY remains neutral as consolidations continue below 159.88. Another falling leg could be seen, but downside should be contained by 38.2% retracement of 152.25 to 159.88 at 156.96 to bring rebound. On the upside, break of 159.88 will target a test on 161.94 high.
In the bigger picture, outlook is unchanged that corrective pattern from 161.94 (2024 high) should have completed with three waves at 139.87. Larger up trend from 102.58 (2021 low) could be ready to resume through 161.94. This will remain the favored case as long as 55 W EMA (now at 152.70) holds. Firm break of 161.94 will pave the way to 61.8% projection of 102.58 to 161.94 from 139.87 at 176.75.
GBP/USD Daily Outlook
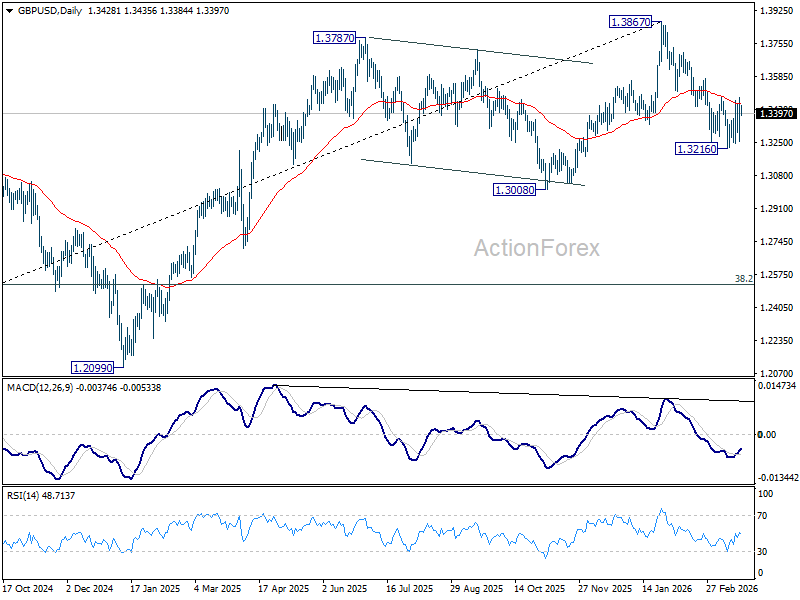
Daily Pivots: (S1) 1.3300; (P) 1.3389; (R1) 1.3522; More...
Range trading continues in GBP/USD and intraday bias remains neutral for the moment. With 1.3482 resistance intact, further decline is in favor. On the downside, below 1.3216 will resume the fall from 1.3867 to 1.3008 structural support. However, decisive break of 1.3482 will argue that the fall from 1.3867 has completed, and turn bias back to the upside for 61.8% retracement of 1.3867 to 1.3216 at 1.3618.
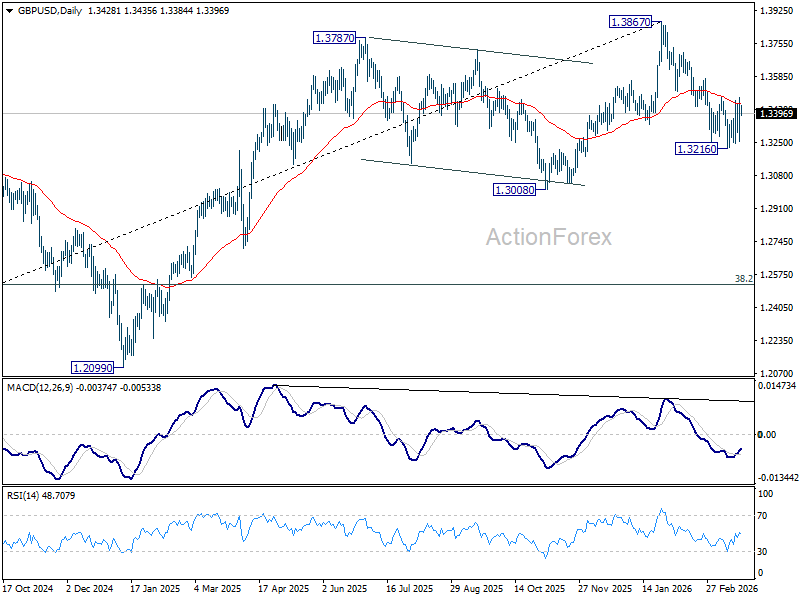
In the bigger picture, considering bearish divergence condition in both D and W MACD, a medium term top should be in place at 1.3867. Firm break of 1.3008 support will argue that fall from 1.3867 is at least correcting the rise from 1.0351 (2022 low) with risk of bearish reversal. That would open up further decline to 38.2% retracement of 1.0351 to 1.3867 at 1.2524. For now, medium term outlook will be neutral at best as long as 1.3867 resistance holds, or until further development.
USD/CHF Daily Outlook
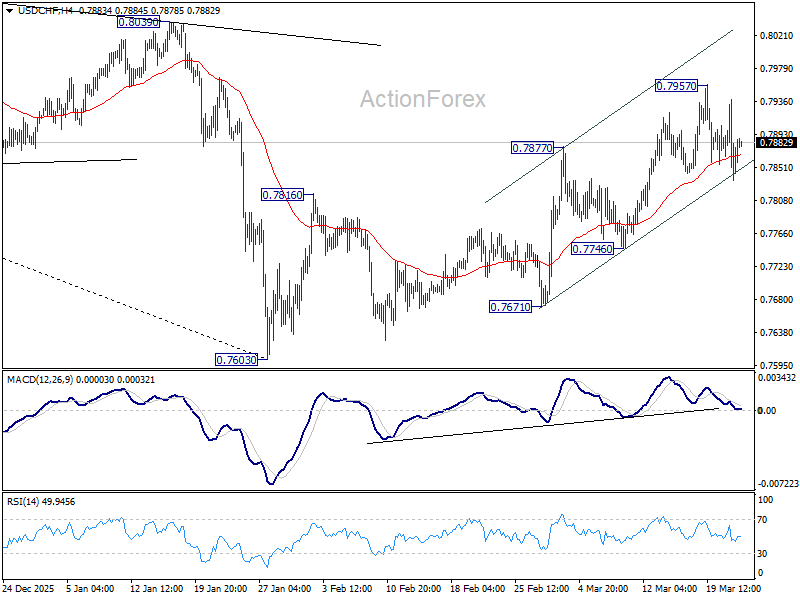
Daily Pivots: (S1) 0.7819; (P) 0.7879; (R1) 0.7924; More….
Intraday bias in USD/CHF remains neutral and more consolidations could be seen below 0.7957. As noted before, rise from 0.7603 should be correcting whole decline from 0.9200. Above 0.7957 will target 38.2% retracement of 0.9200 to 0.7603 at 0.8213. This will remain the favored case as long as 0.7746 support holds.
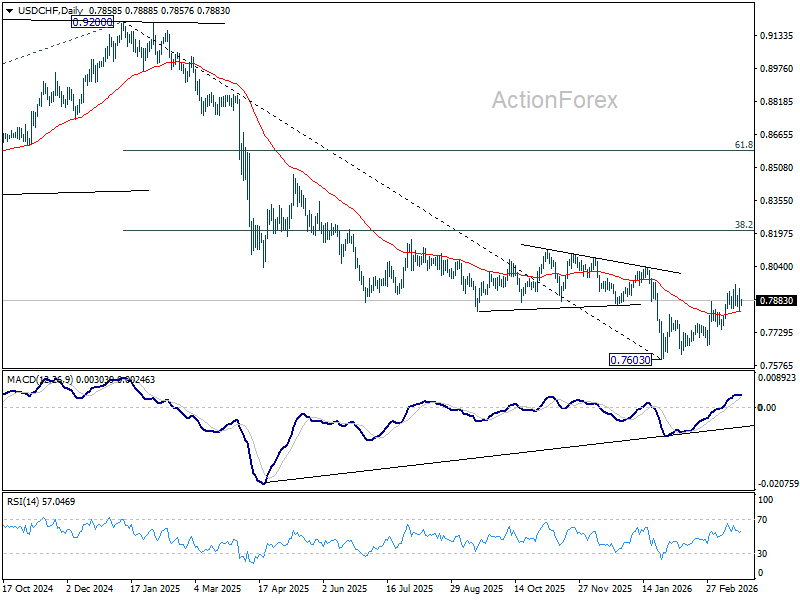
In the bigger picture, a medium term bottom should be in place at 0.7603 on bullish convergence condition in D MACD. Rebound from there is seen as correcting the fall from 0.9200 only. However, decisive break of 55 W EMA (now at 0.8085) will suggest that it's probably correcting the larger scale down trend from 1.0146 (2022 high). On the other hand, rejection by the 55 W EMA will setup down trend resumption to 100% projection of 1.0146 (2022 high) to 0.8332 from 0.9200 at 0.7382 at a later stage.
USD/CAD Daily Outlook
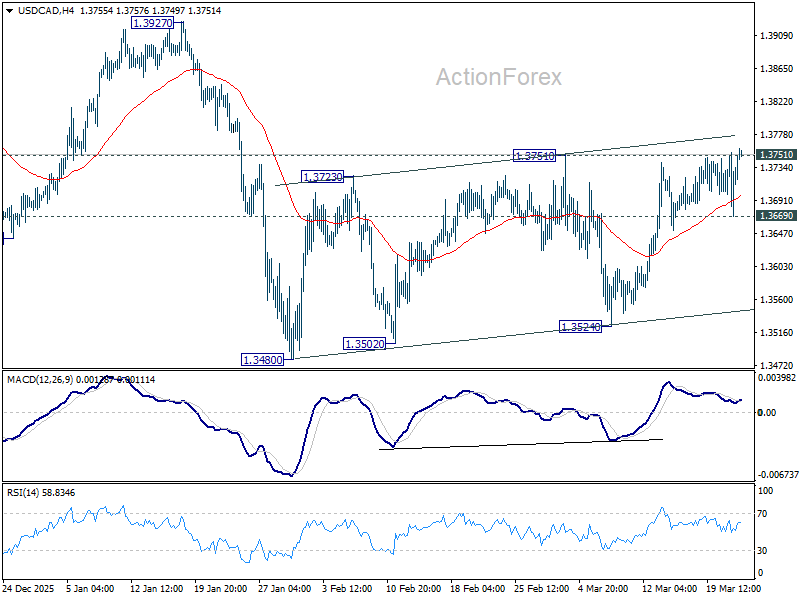
Daily Pivots: (S1) 1.3679; (P) 1.3717; (R1) 1.3765; More...
Immediate focus is now on 1.3751 resistance in USD/CAD. Decisive break there will suggest that stronger rebound is underway, probably as a correction to whole down trend from 1.4791. Further rally should be seen to 1.3927 resistance first. On the downside, below 1.3669 will bring retest of 1.3480/3524 support zone.
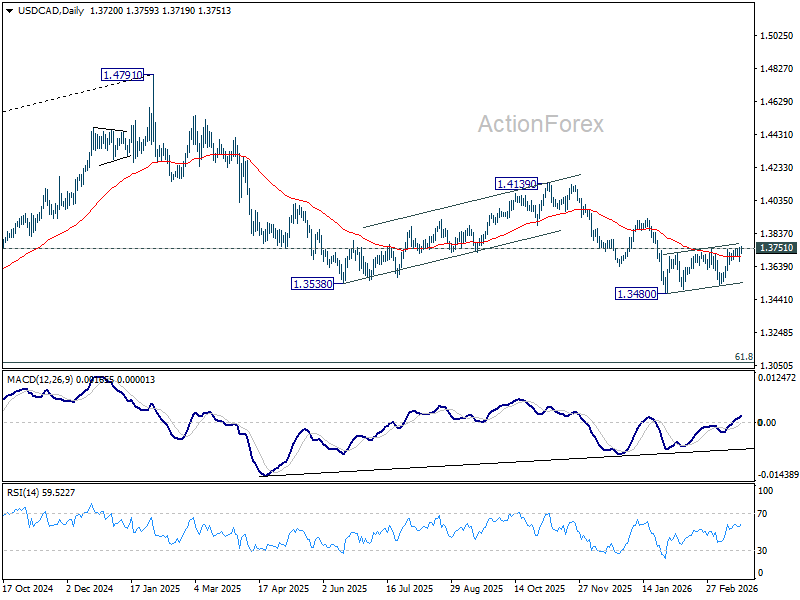
In the bigger picture, price actions from 1.4791 are seen as a corrective pattern to the whole up trend from 1.2005 (2021 low). Deeper fall could be seen, as the pattern extends, to 61.8% retracement of 1.2005 to 1.4791 at 1.3069. However, break of 1.3927 resistance will argue that the correction has completed with three waves down to 1.3480 already.
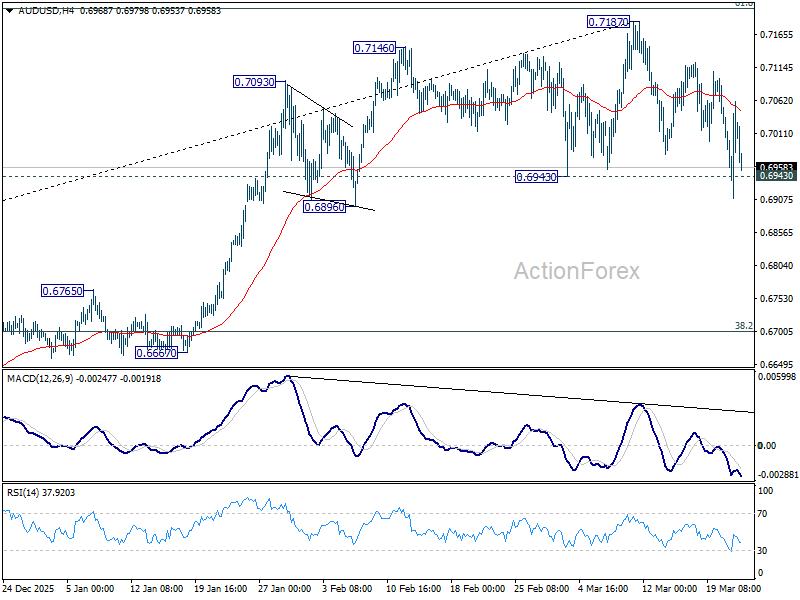
AUD/USD Daily Report
Daily Pivots: (S1) 0.6927; (P) 0.6995; (R1) 0.7079; More...
Focus stays on 0.6943 support in AUD/USD after the volatility in the last 24 hours. Decisive break there should confirm rejection by 0.7206 key fibonacci resistance. That would set up deeper correction to the whole up trend from 0.5913, and target 38.2% retracement of 0.5913 to 0.7187 at 0.6700. Nevertheless, strong rebound from current levels would retain near term bullishness for breakout through 0.7187 at a later stage.
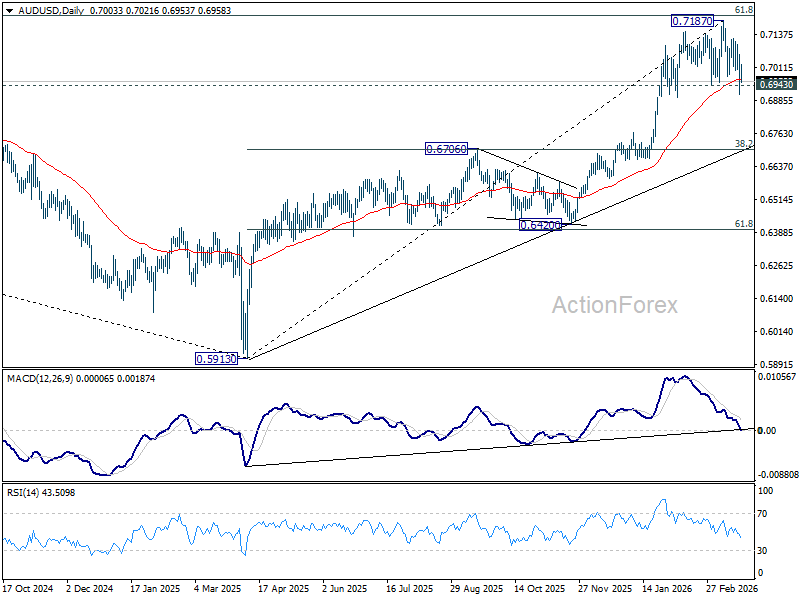
In the bigger picture, current development argues that rise from 0.5913 (2024 low) is reversing whole down trend from 0.8006 (2021 high). Decisive break of 61.8% retracement of 0.8006 to 0.5913 at 0.7206 will pave the way back to 0.8006. This will remain the favored case as long as 0.6706 resistance turned support holds, even in case of deep pullback.
Dollar Resilient as ‘Trust Gap’ Offsets Peace Pivot
Dollar remained resilient as markets attempted to price in a tentative “peace pivot”, but with skepticism over its credibility limiting any sustained risk rally. Asian equities opened higher following the rebound in US markets overnight, but gains were modest, with major indexes recovering only about half of the previous day’s losses.
The initial optimism was driven by US President Donald Trump’s decision to postpone planned strikes on Iranian energy infrastructure for five days after what he described as “very good and productive” conversations. The announcement encouraged markets to unwind some of the extreme escalation risks that had been priced in following the earlier 48-hour ultimatum.
However, this narrative quickly ran into a credibility wall. Tehran dismissed the claims as “fake news” and “psychological warfare,” casting doubt on whether any meaningful diplomatic progress had been made. The conflicting signals have left markets hesitant to fully embrace the idea of de-escalation.
On the ground, developments have reinforced this caution. Reports of explosions over Jerusalem following Iranian missile fire highlight that hostilities remain active despite the rhetoric of talks. This disconnect between words and actions has kept investors wary of a sudden “snap-back” in tensions.
Oil markets reflect this skepticism. Brent crude rebounded back above 100, indicating that traders are not pricing in a lasting resolution. The persistence of elevated oil prices continues to anchor inflation expectations and limit the scope for a broader risk-on move. In equities, the muted rebound underscores the lack of conviction. The market is effectively caught between relief from delayed escalation and concern over unresolved risks.
Currency markets are showing a clearer expression of this dynamic. Dollar is the strongest performer for the day so fart. Yen is also firm on safe-haven demand, while Canadian Dollar benefits from oil strength. In contrast, Australian and New Zealand Dollars remain under pressure, reflecting their sensitivity to global growth and Asia-linked risks. Sterling is also softer, while Euro and Swiss Franc are trading in the middle as markets await clearer direction.
The next 96 hours are critical. The five-day pause is conditional on the “success of ongoing meetings,” leaving open the possibility that the original threat to strike Iranian infrastructure could return if progress stalls. This binary outcome is keeping volatility elevated.
Until there is concrete evidence of de-escalation—either through a joint statement or the reopening of the Strait of Hormuz—markets are likely to remain trapped in a headline-driven cycle. For now, the dominant theme is cautious positioning, with the Dollar’s resilience reflecting a market that is not yet ready to fully price in peace.
Elsewhere, Australia and the European Union formally signed a long-awaited free trade agreement after years of negotiations. The deal removes tariffs on Australian critical minerals, and includes a broader Security and Defense Partnership.
The agreement is being framed as a move toward supply chain diversification at a time of heightened geopolitical risk. By opening European markets further to Australian resources, it reduces reliance on China while strengthening support for the global energy transition, particularly in critical mineral supply chains.
In Asia, at the time of writing, Nikkei is up 0.43%. Hong Kong HSI is up 1.32%. China Shanghai SSE is up 0.64%. Singapore Strait Times is up 0.15%. Japan 10-year JGB yield is down -0.042 at 2.280. Overnight, DOW rose 1.38% S&P 500 rose 1.15%. NASDAQ rose 1.38%. 10-year yield fell -0.057 to 4.334.
Japan core CPI falls to 1.7% in February, as energy costs drag inflation lower
Japan CPI data point to easing inflation momentum driven by energy costs, though core-core inflation suggests underlying pressures remain. Read more.
Japan PMI composite falls to 52.5, war lifts costs and hits sentiment
Japan’s PMI data show growth cooling as input costs surge and business sentiment weakens. The Middle East conflict is lifting energy prices and disrupting supply chains, squeezing margins and raising uncertainty. Read more.
Australia PMI composite falls to 47, cost inflation hits 3-yr high on Middle East conflict
Australia’s PMI data signal a sharp shift into contraction as demand weakens and cost inflation surges to a three-year high. The combination highlights early stagflation risks as the Middle East shock begins to hit growth and prices. Read more.
RBNZ's Breman warns of inflation spike but cautions against overreaction
RBNZ Governor Anna Breman warns the Middle East conflict will lift inflation while weighing on growth, but stresses policy must avoid overreacting to temporary shocks. The focus remains on preventing short-term price spikes from becoming persistent inflation. Read more.
AUD/USD Daily Report
Daily Pivots: (S1) 0.6927; (P) 0.6995; (R1) 0.7079; More...
Focus stays on 0.6943 support in AUD/USD after the volatility in the last 24 hours. Decisive break there should confirm rejection by 0.7206 key fibonacci resistance. That would set up deeper correction to the whole up trend from 0.5913, and target 38.2% retracement of 0.5913 to 0.7187 at 0.6700. Nevertheless, strong rebound from current levels would retain near term bullishness for breakout through 0.7187 at a later stage.
In the bigger picture, current development argues that rise from 0.5913 (2024 low) is reversing whole down trend from 0.8006 (2021 high). Decisive break of 61.8% retracement of 0.8006 to 0.5913 at 0.7206 will pave the way back to 0.8006. This will remain the favored case as long as 0.6706 resistance turned support holds, even in case of deep pullback.