Sample Category Title
Gold Bounces from New 2026 Low on Profit-Taking / Reaction on Trump’s Comments
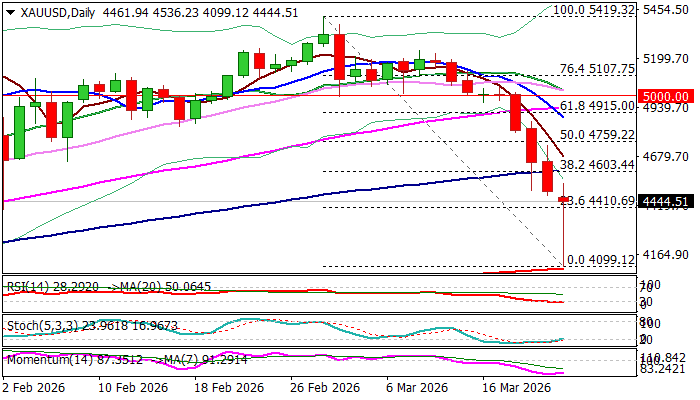
Gold hit the lowest this year ($4100) after falling nearly 8% in the Asian session on Monday.
Persisting negative sentiment, which drove the price for 10% drop last week (the biggest weekly loss in decades) was additionally boosted by growing expectations of rate hikes as strong rise on oil prices fuels inflation in its domino-effect to global economies that keeps major central banks on high alert and makes the metal less attractive for investors.
Gold price fell about 20% from its all-time high of Jan 29 ($5598) and is on track for a record monthly loss in March.
Near term action shows bounce from the session low, where ascending 200DMA provided solid support, with oversold daily studies contributing to profit taking that lifted the price over $4 so far.
But the main driver of gold’s latest jump was the comment from President Trump about postponing military strikes on Iranian infrastructure which boosted optimism about potential de-escalation of the conflict that put the whole region in fire and threatening of huge consequences on global economy.
Recovery eyes key barrier at $4600 (Fibo 38.2% of $5419/$4100 / 100 DMA), violation of which would generate fresh bullish signal and expose net targets at $4759 (50% retracement) and $4800 (round figure).
However, developments on the fundamental side will remain as dominant factor and will be closely watched for fresh direction signal.
Res: 4536; 4600; 4684; 4759
Sup: 4410; 4343; 4223; 4163
Eco Data 3/24/26
| GMT | Ccy | Events | Act | Cons | Prev | Rev |
|---|---|---|---|---|---|---|
| 22:00 | AUD | Manufacturing PMI Mar P | 50.1 | 51 | ||
| 22:00 | AUD | Services PMI Mar P | 46.6 | 52.8 | ||
| 23:30 | JPY | National CPI Y/Y Feb | 1.30% | 1.50% | ||
| 23:30 | JPY | National CPI Core Y/Y Feb | 1.60% | 1.70% | 2.00% | |
| 23:30 | JPY | National CPI Core-Core Y/Y Feb | 2.50% | 2.60% | ||
| 00:30 | JPY | Manufacturing PMI Mar P | 51.4 | 52.9 | 53 | |
| 00:30 | JPY | Services PMI Mar P | 52.8 | 53.8 | ||
| 08:15 | EUR | France Manufacturing PMI Mar P | 50.2 | 49 | 50.1 | |
| 08:15 | EUR | France Services PMI Mar P | 48.3 | 49.2 | 49.6 | |
| 08:30 | EUR | Germany Manufacturing PMI Mar P | 51.7 | 49.8 | 50.9 | |
| 08:30 | EUR | Germany Services PMI Mar P | 51.2 | 52.5 | 53.5 | |
| 09:00 | EUR | Eurozone Manufacturing PMI Mar P | 51.4 | 49.5 | 50.8 | |
| 09:00 | EUR | Eurozone Services PMI Mar P | 50.1 | 50.8 | 51.9 | |
| 09:30 | GBP | Manufacturing PMI Mar P | 51.4 | 51.1 | 51.7 | |
| 09:30 | GBP | Services PMI Mar P | 51.2 | 53 | 53.9 | |
| 12:30 | USD | Nonfarm Productivity Q4 | 1.80% | 2.40% | 2.80% | |
| 12:30 | USD | Unit Labor Costs Q4 | 4.40% | 3.40% | 2.80% | |
| 13:45 | USD | Manufacturing PMI Mar P | 52.4 | 51.5 | 51.6 | |
| 13:45 | USD | Services PMI Mar P | 51.1 | 52 | 51.7 |
| 22:00 | AUD |
| Manufacturing PMI Mar P | |
| Actual | 50.1 |
| Consensus | |
| Previous | 51 |
| 22:00 | AUD |
| Services PMI Mar P | |
| Actual | 46.6 |
| Consensus | |
| Previous | 52.8 |
| 23:30 | JPY |
| National CPI Y/Y Feb | |
| Actual | 1.30% |
| Consensus | |
| Previous | 1.50% |
| 23:30 | JPY |
| National CPI Core Y/Y Feb | |
| Actual | 1.60% |
| Consensus | 1.70% |
| Previous | 2.00% |
| 23:30 | JPY |
| National CPI Core-Core Y/Y Feb | |
| Actual | 2.50% |
| Consensus | |
| Previous | 2.60% |
| 00:30 | JPY |
| Manufacturing PMI Mar P | |
| Actual | 51.4 |
| Consensus | 52.9 |
| Previous | 53 |
| 00:30 | JPY |
| Services PMI Mar P | |
| Actual | 52.8 |
| Consensus | |
| Previous | 53.8 |
| 08:15 | EUR |
| France Manufacturing PMI Mar P | |
| Actual | 50.2 |
| Consensus | 49 |
| Previous | 50.1 |
| 08:15 | EUR |
| France Services PMI Mar P | |
| Actual | 48.3 |
| Consensus | 49.2 |
| Previous | 49.6 |
| 08:30 | EUR |
| Germany Manufacturing PMI Mar P | |
| Actual | 51.7 |
| Consensus | 49.8 |
| Previous | 50.9 |
| 08:30 | EUR |
| Germany Services PMI Mar P | |
| Actual | 51.2 |
| Consensus | 52.5 |
| Previous | 53.5 |
| 09:00 | EUR |
| Eurozone Manufacturing PMI Mar P | |
| Actual | 51.4 |
| Consensus | 49.5 |
| Previous | 50.8 |
| 09:00 | EUR |
| Eurozone Services PMI Mar P | |
| Actual | 50.1 |
| Consensus | 50.8 |
| Previous | 51.9 |
| 09:30 | GBP |
| Manufacturing PMI Mar P | |
| Actual | 51.4 |
| Consensus | 51.1 |
| Previous | 51.7 |
| 09:30 | GBP |
| Services PMI Mar P | |
| Actual | 51.2 |
| Consensus | 53 |
| Previous | 53.9 |
| 12:30 | USD |
| Nonfarm Productivity Q4 | |
| Actual | 1.80% |
| Consensus | 2.40% |
| Previous | 2.80% |
| 12:30 | USD |
| Unit Labor Costs Q4 | |
| Actual | 4.40% |
| Consensus | 3.40% |
| Previous | 2.80% |
| 13:45 | USD |
| Manufacturing PMI Mar P | |
| Actual | 52.4 |
| Consensus | 51.5 |
| Previous | 51.6 |
| 13:45 | USD |
| Services PMI Mar P | |
| Actual | 51.1 |
| Consensus | 52 |
| Previous | 51.7 |
Sunset Market Commentary
Markets
It was again a really hectic day at the start of the fourth week of the conflict in Iran/the Middle East. The ultimatum of US President Trump ‘obliging’ Iran to fully reopen the Strait of Hormuz around midnight this evening (European time) gave markets a nihil obstat to resume the Iran/risk-off/stagflation trade at the start of trading this morning. Brent oil trade above $114 p/b, European equities lost another 2%+. The dollar gained modestly but stayed away from more important resistance levels. Interest rate markets continued to guide central bankers (not the other way around) that their primary contribution to address the current crisis was to avoid this supply shock from translating into a new upward inflation spiral. The curve further bear flattened further with the US 2-y yield at some point rising an additional 11 bps. For German and the UK this was respectively 9 bps and 14 bps. While less affected in the bear flattening move, LT yields were not completely immune with fiscal sustainability considerations playing in the background. In this respect, intra-EMU spreads for the second day in a row winded substantially (e.g. about 10 bps widening of the German-Italian spread).Enter US president Trump, who potentially embarked on some kind of ‘TACO-Iran’ approach. The US president around noon European time, said he ordered the department of war to postpone any and all military strikes against Iranian power plants and energy infrastructure for a five day period, subject to success of ongoing (very good and productive) talks that the president said have taken place over the previous two days. Those constructive contacts were not confirmed by Iran yet. Whatever the status of contacts between the US and Iran, markets saw this as a sign that at least some of the feared for sharp escalation could be avoided, at least in the near term. The next evaluation point is end this week. Some of the recent, more aggressive positioning in the Iran/stagflation trade was unwound. US yields currently have swapped above-mentioned rises to currently trade 6.5 bps (2-y) to 3.5 bps (30-y) lower, admittedly still in very volatile trading. In Bunds the correction/reversal now shows yield declines compared to Friday between -13 bps (2-y) and -4.5 bps (30-y). For the UK, the daily easing stands at 20 bps (2-y) and -8 bps (30-y). Brent oil tumbled to currently trade near $100 p/b. The Eurostoxx 50 gains 2.5%. US indices also show gains of about 2% in a similar Pavlov reaction. The dollar eased about 1% intraday. EUR/USD tries to regain the 1.16 barrier. Is a genuine start on the path of de-escalation? Will it lead to a sustained solution to the disruption of energy supply (or multiple other supply chain distortions) anytime soon? It’s much too early to draw any conclusions. That also applies to the question whether central banks will get more room to assess the impact on inflation, on (lasting) second round effects or inflation expectations as determining factors in their reaction function. For sure a developing story, still at risk to other plot twists. To be continued.
News & Views
Belgian consumer confidence dropped sharply in March, from 1 to -6, the lowest since May 2025. Expectations on the economic situation in Belgium reached their lowest level since 2022 (-45 from -25) with fears of unemployment rising sharply (-3 from -11). On a personal level, households saw slightly gloomier expectations about their own financial situation (-3 from -2), whilst their saving intentions remain unchanged at 22. On Wednesday, the National Bank of Belgium releases its business confidence indicator. The Belgian debt agency conducted a regular OLO auction today. They raised a combined €2.87bn (vs €2.6-3bn target range) by tapping OLO 94 (€0.95bn Jun2032), OLO 106 (€1.08bn Jun2036) and OLO 71 (€0.84bn Jun2045). The auction bid cover was low at 1.26. Following today’s auction, the Belgian debt agency raised €19.17bn in OLO funding YtD vs the 2026 target of €51.6bn (37%).
National Bank of Poland governor Glapinski in an interview with the Wall Street Jorunal said that the central bank does not pre-commit to any future decisions. He emphasized data-dependence and remains fully committed to maintaining medium-term stability. Polish money markets stick with tightening bets over the next 12 months (three hikes discounted), implying a turnaround. The National Bank of Poland used the timing of its March policy meeting (March 4) to cut its policy rate by 25 bps to 3.75% before the developing Middle East conflict completely shut the window. Higher energy prices could add short-term inflationary pressures but also constrain output and activity with Poland being a net commodity importer. Poland enters the energy shock from a position of strength with a stable currency and easing price pressures. The relatively low amount of Polish exports to the US helped insulate the economy from Trump’s tariff policy.
Fed’s Goolsbee sees war as “wrench” in rate cut plans
Chicago Fed President Austan Goolsbee highlighted the growing uncertainty facing policymakers, warning that the evolving Middle East conflict is complicating the outlook for monetary policy. Speaking to CNBC, he said “the most important thing is to figure out the through-line of what is happening,” noting that the situation is “fraught” as no one can confidently assess how long the conflict will last or how it will unfold.
While FOMC projections still point to rate cuts ahead, Goolsbee emphasized that his policy stance will depend heavily on inflation progress. He cautioned against repeating what he described as the “team-transitory mistake” of 2021, when inflation risks were underestimated. The current environment, shaped by an energy-driven shock, makes it more difficult to determine whether inflation will continue trending toward target.
Goolsbee said he remains “fairly optimistic” that rates could move lower by the end of 2026, but stressed that further evidence is needed. “We do need to see progress,” he said, adding that the war “definitely throws a wrench into the plans.”
Fed’s Miran sticks to cut call despite oil shock, cites labor market risks
Fed Governor Stephen Miran reiterated his dovish stance in remarks to Bloomberg TV, arguing that it is premature to reassess the policy outlook in response to surging oil prices. While acknowledging that inflation risks have become “a little more concerning,” Miran emphasized that policymakers should “wait for all the information to come in” before adjusting their baseline expectations.
Miran maintained that central banks should traditionally look through oil price shocks, signaling that his prior policy view remains intact. “It’s just still premature to have a clear view about what this is going to look like as you look 12 months out,” he said. His outlook continues to favor gradual rate cuts despite the recent rise in energy prices.
Importantly, Miran highlighted growing concerns around the labor market, arguing that unemployment risks are rising alongside inflation risks. He noted that the oil shock acts as both a negative supply and demand shock, weighing on economic activity. “The labor market still can use additional support,” Miran said, explaining his dissent at the last FOMC meeting in favor of a 25bps cut and reinforcing his call for further easing.
Crypto Market Reacted Positively to Shift in Sentiment
Market Overview
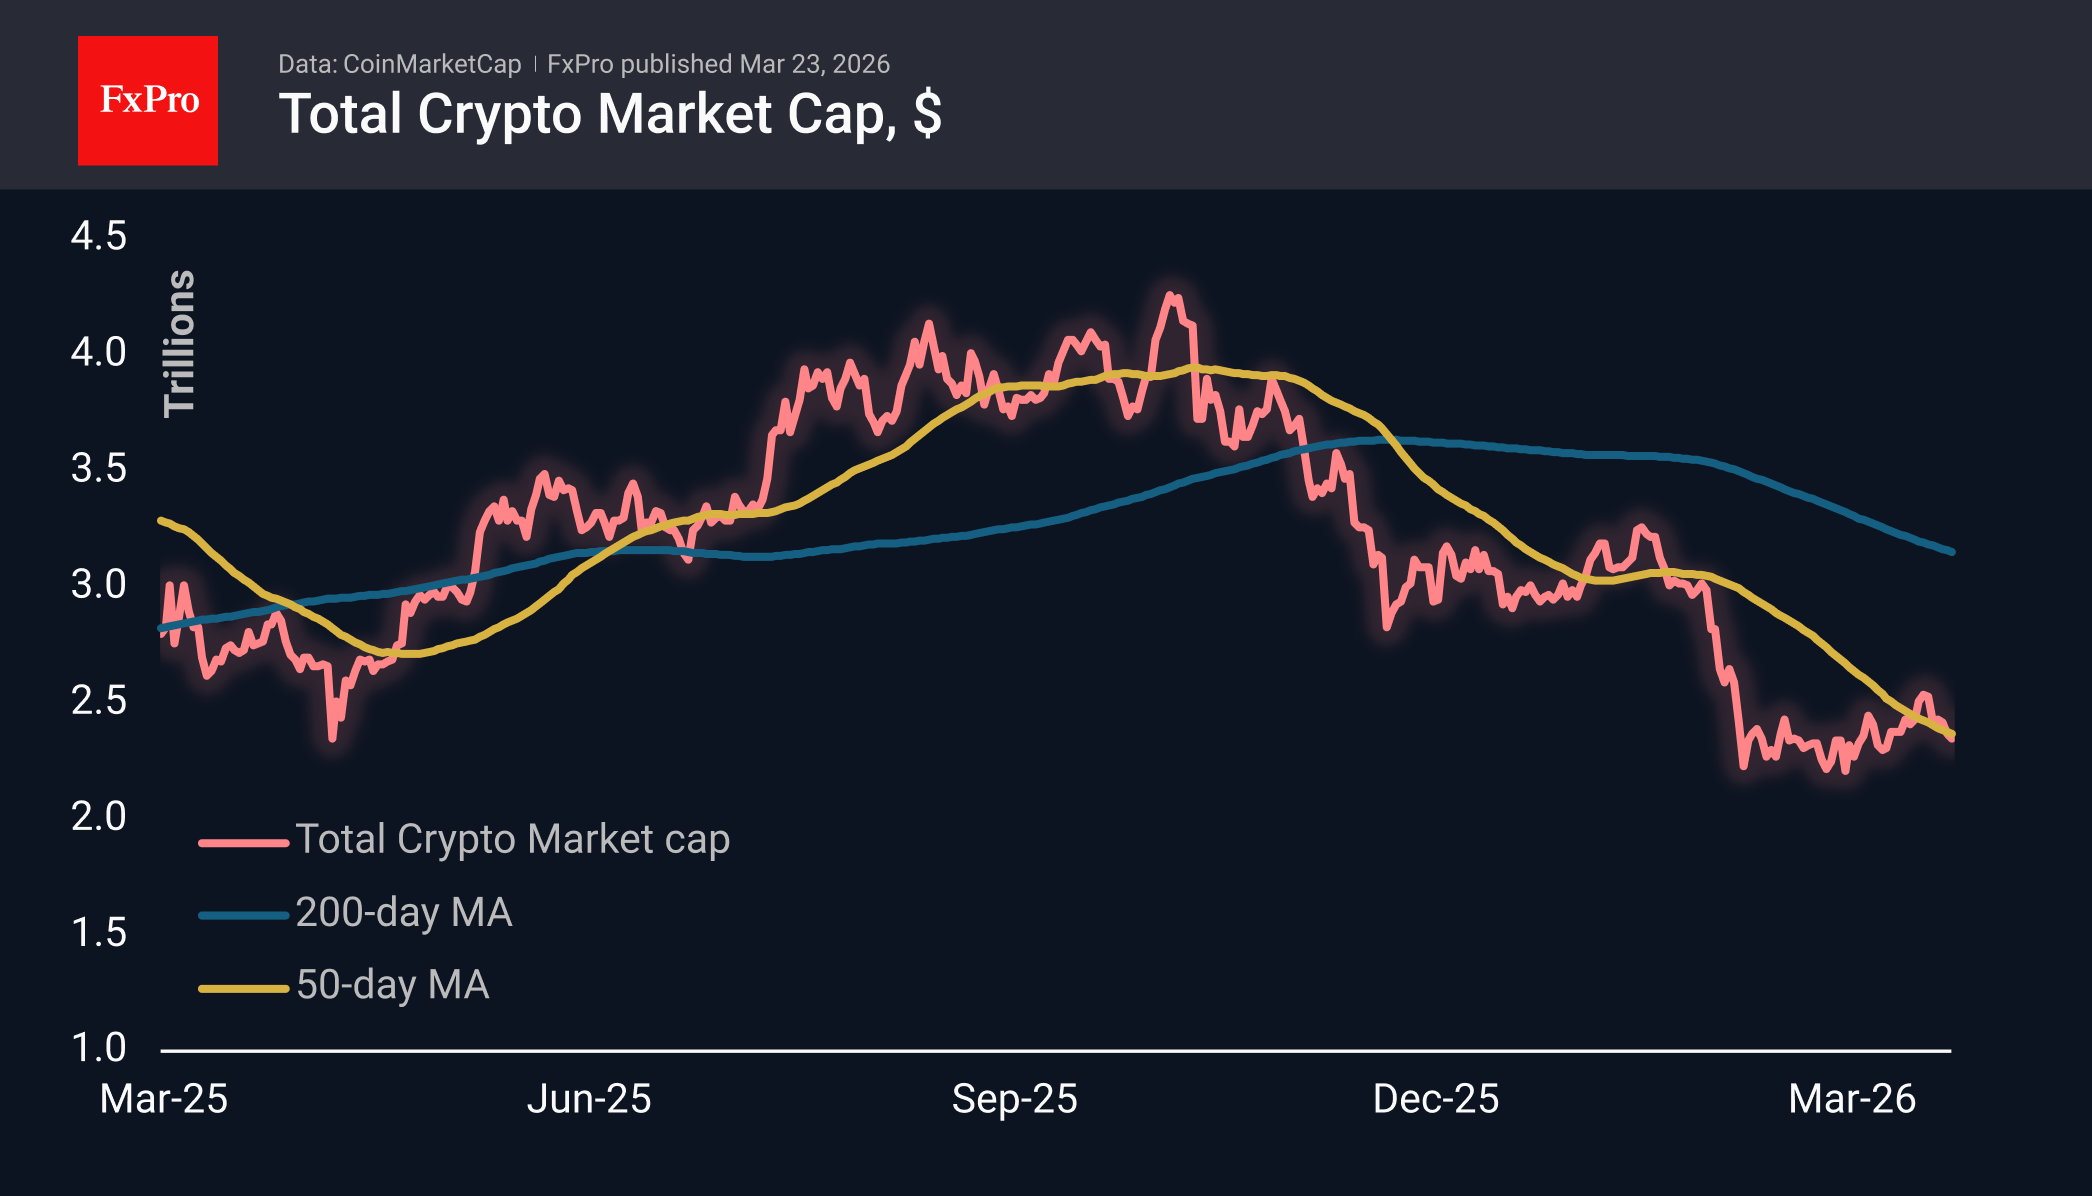
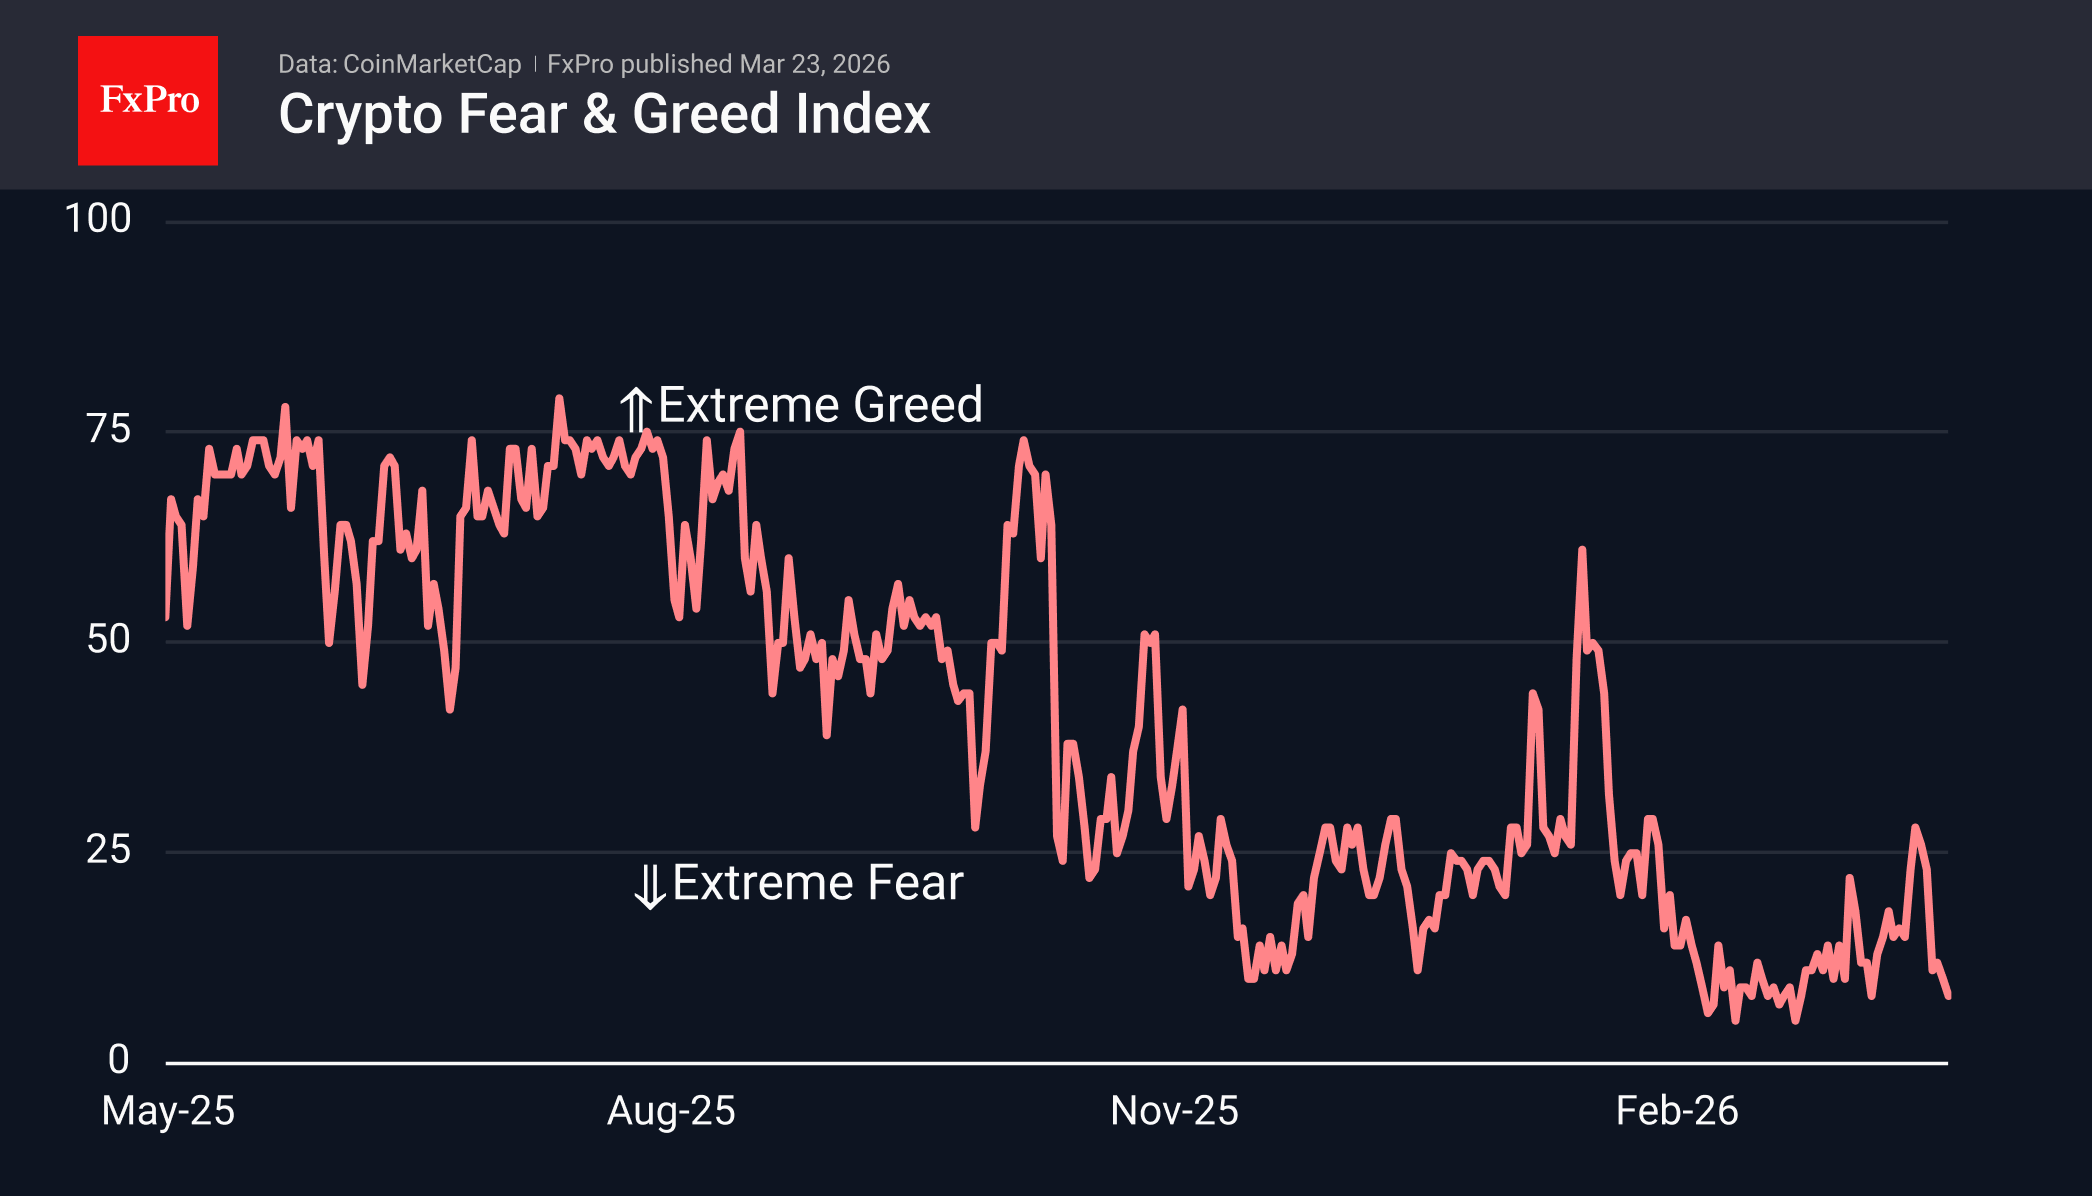
The crypto market continued to slide over the weekend as demand for risky assets decreased. This gloomy tone was reversed by Trump’s announcement that strikes on Iran’s energy sector would be halted, causing a sharp turnaround in market sentiment. It is important to note that, this time, cryptocurrencies are reacting very positively to good news and rather sluggishly to bad news. This change occurred in mid-March; before that, we saw only a moderate response to negative news, while potentially good news went almost unnoticed.
By Monday, the sentiment index had fallen into negative territory, dropping to 8. Currently, the situation in the crypto market does not appear as severe as it did at the end of February, when sentiment was at the same level.
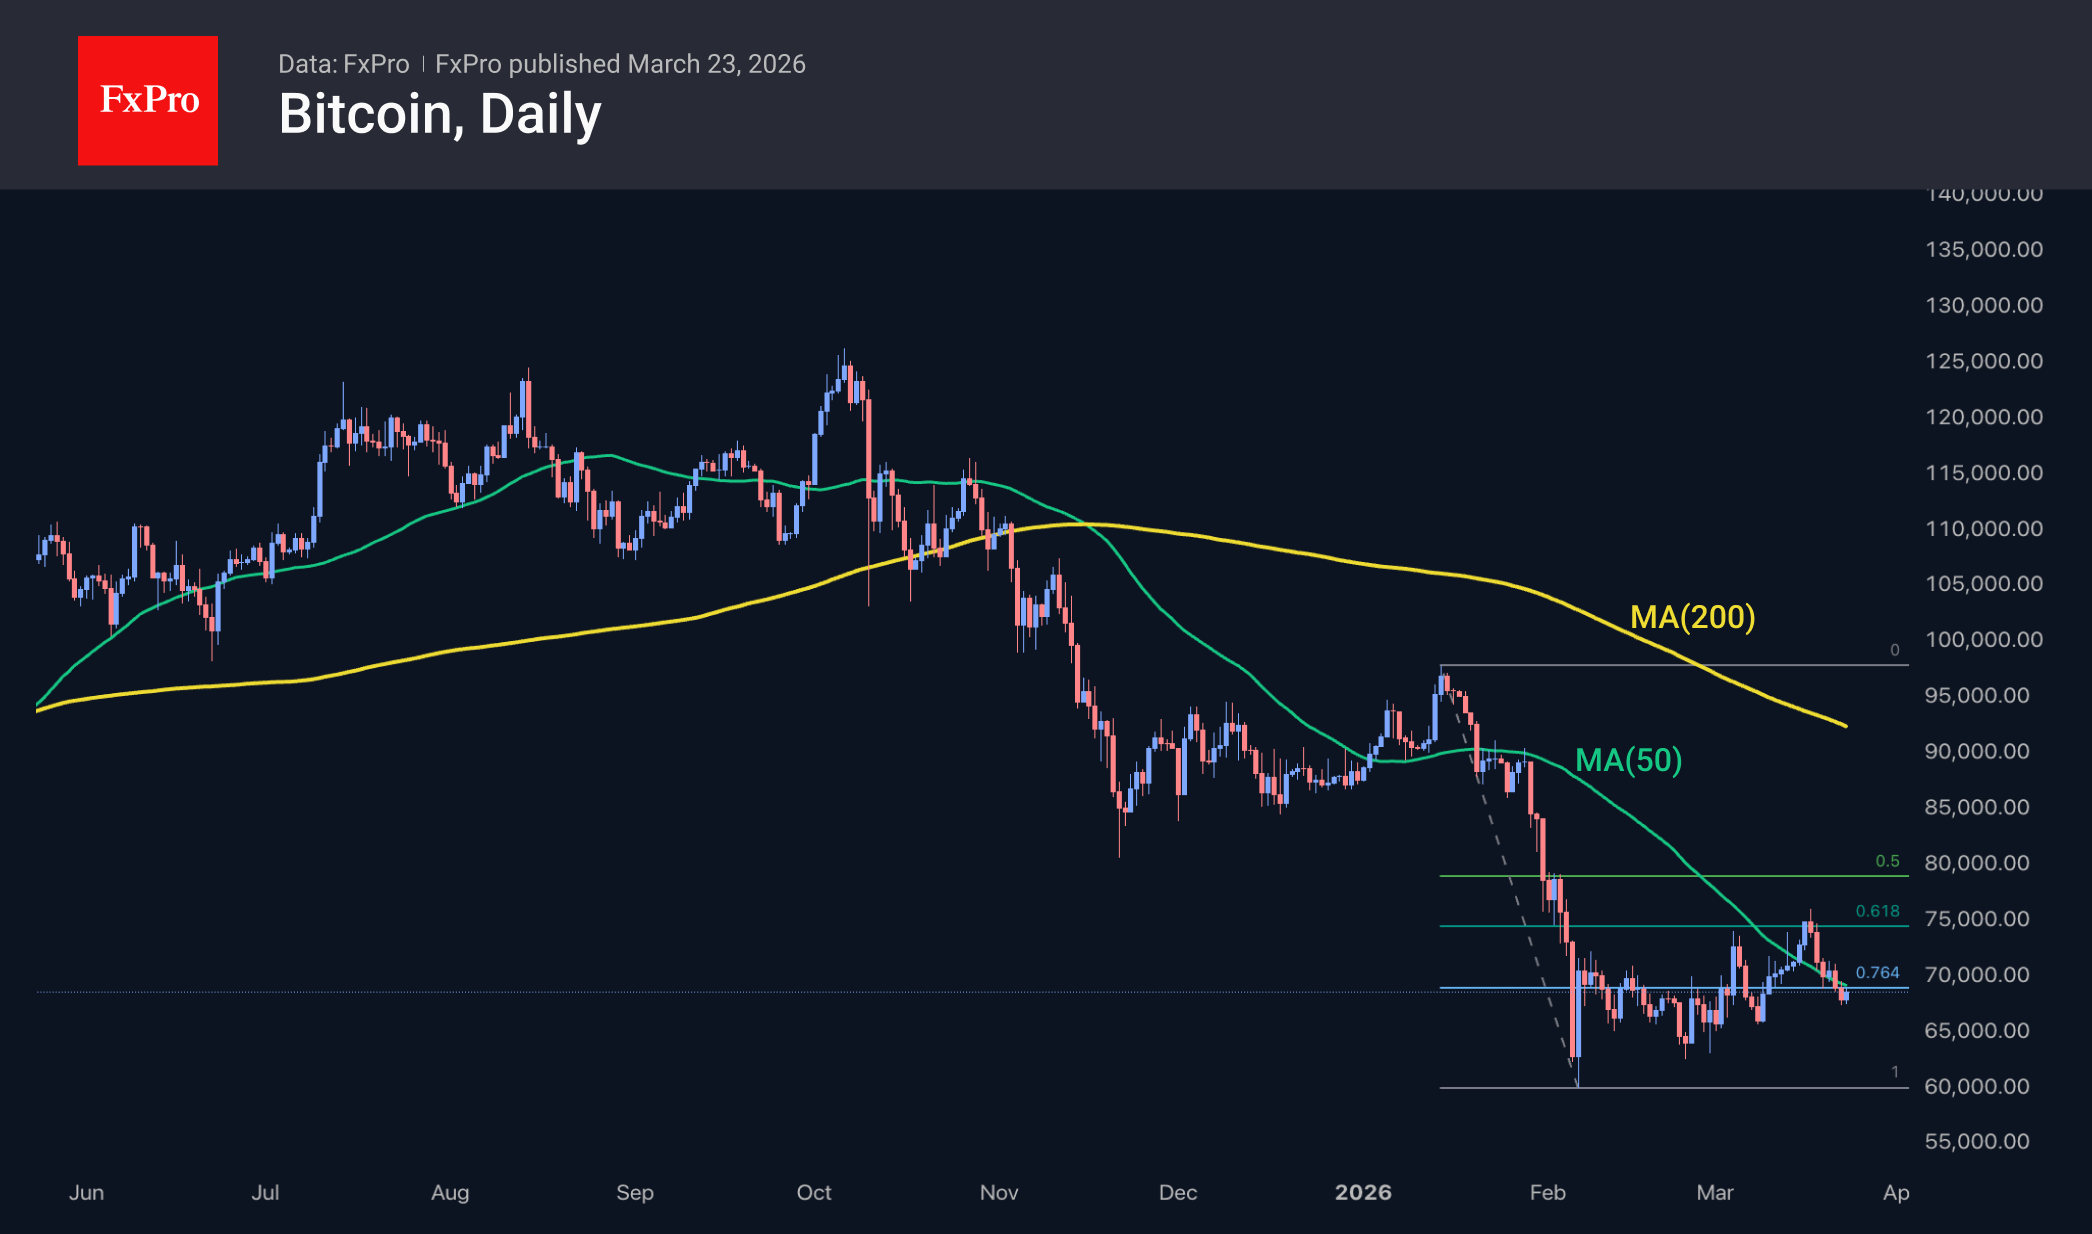
Bitcoin is nearing $71K, having increased nearly 5% since Monday morning. Geopolitical news has been a strong influence, dispelling the gloom of recent days. Although BTC was at these levels not long ago, from a technical analysis standpoint, this marks a notable shift. This time, we are witnessing powerful upward momentum from the key 50-day moving average. A sustained move above it would indicate a trend reversal, supporting the shift in market reaction to news and the dynamics of the sentiment index. It would also signal a return to normality after a prolonged period of oversold conditions. However, cautious traders will likely prefer to wait for the price to stabilise above $75K—the recent peak and an important Fibonacci retracement level.
News Background
Crypto market participants remain cautious, showing no excessive activity, according to VanEck. Selling by long-term holders has slowed. Further market dynamics will depend on central bank policy and overall risk appetite.
CF Benchmarks has calculated that Bitcoin’s fair value is approximately $136,000, taking into account the growth of the global M2 money supply. However, under current conditions, BTC reacts more strongly to high Fed rates and market sentiment than to money supply growth.
Ethereum could reach its lowest point by the end of March, after which the market is expected to enter a recovery phase, according to BitMine CEO Tom Lee. In his view, a significant proportion of short-term traders have already exited the market, whilst long-term holders continue accumulating.
Following recent adjustments, Bitcoin’s mining difficulty dropped nearly 8% to 133.79 T. This is the second-largest decline since the start of the year. According to TheEnergyMag, only two of the 14 largest publicly traded US mining companies are mining BTC profitably.
Daily altcoin trading volumes on Binance, the largest crypto exchange, have fallen by 80% from their October peak, indicating waning investor interest, notes analyst Darkfost. Historically, such periods often present the most attractive entry opportunities.
USD/JPY Mid-Day Outlook
Daily Pivots: (S1) 158.08; (P) 158.74; (R1) 159.88; More...
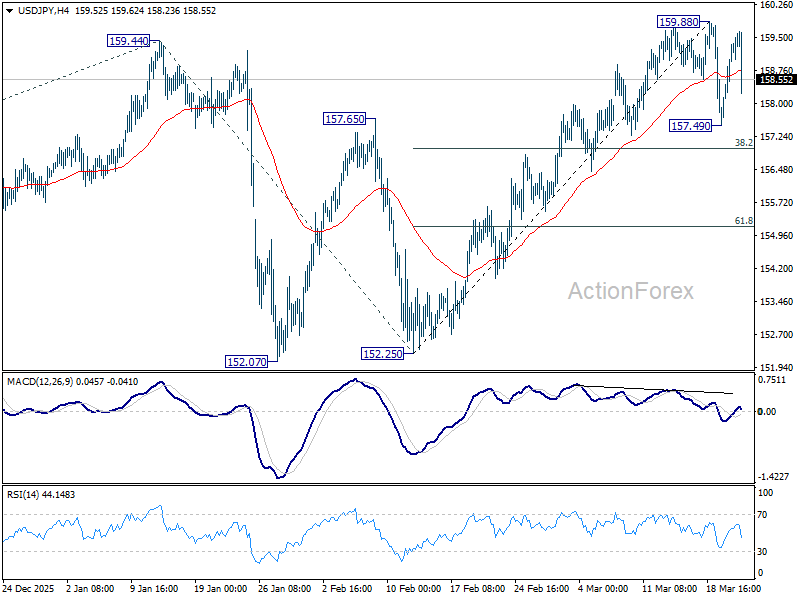
USD/JPY is still extending consolidations below 159.88 and intraday bias stays neutral. Another falling leg could be seen, but downside should be contained by 38.2% retracement of 152.25 to 159.88 at 156.96 to bring rebound. On the upside, break of 159.88 will target a test on 161.94 high.
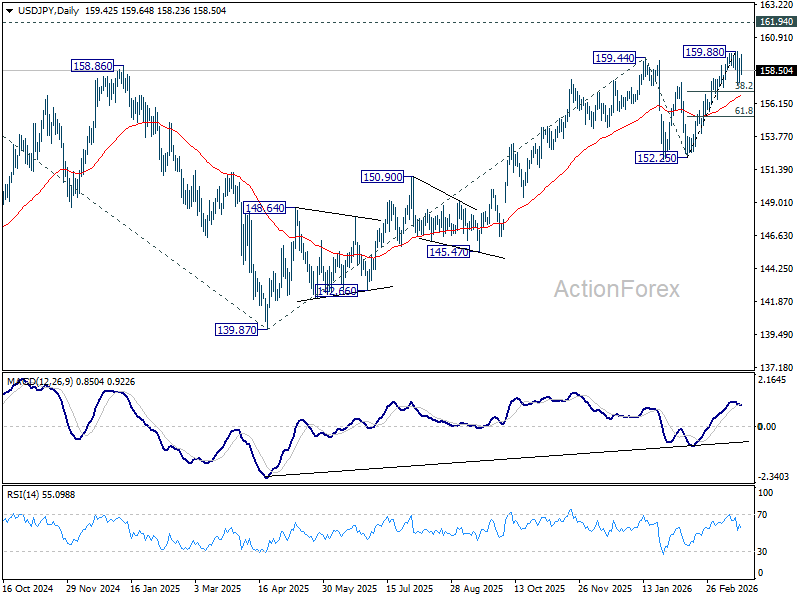
In the bigger picture, outlook is unchanged that corrective pattern from 161.94 (2024 high) should have completed with three waves at 139.87. Larger up trend from 102.58 (2021 low) could be ready to resume through 161.94. This will remain the favored case as long as 55 W EMA (now at 152.70) holds. Firm break of 161.94 will pave the way to 61.8% projection of 102.58 to 161.94 from 139.87 at 176.75.
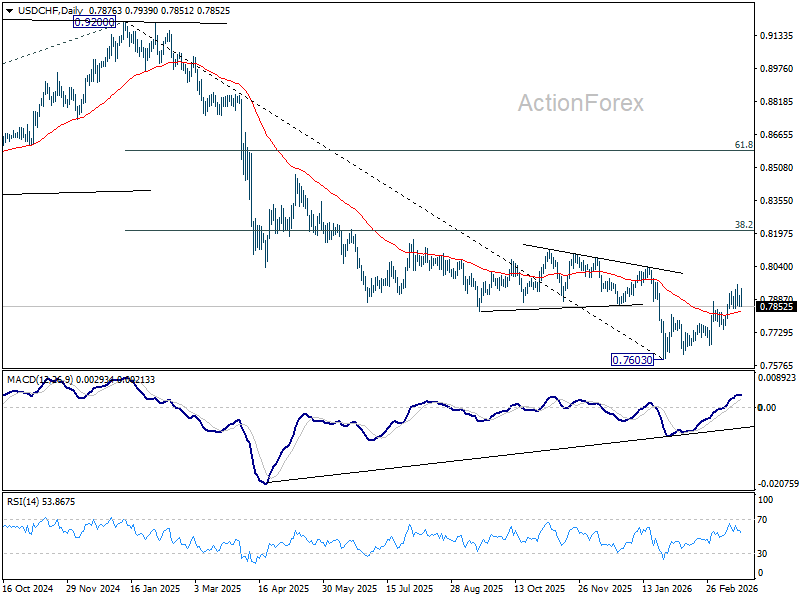
USD/CHF Mid-Day Outlook
Daily Pivots: (S1) 0.7854; (P) 0.7880; (R1) 0.7905; More….
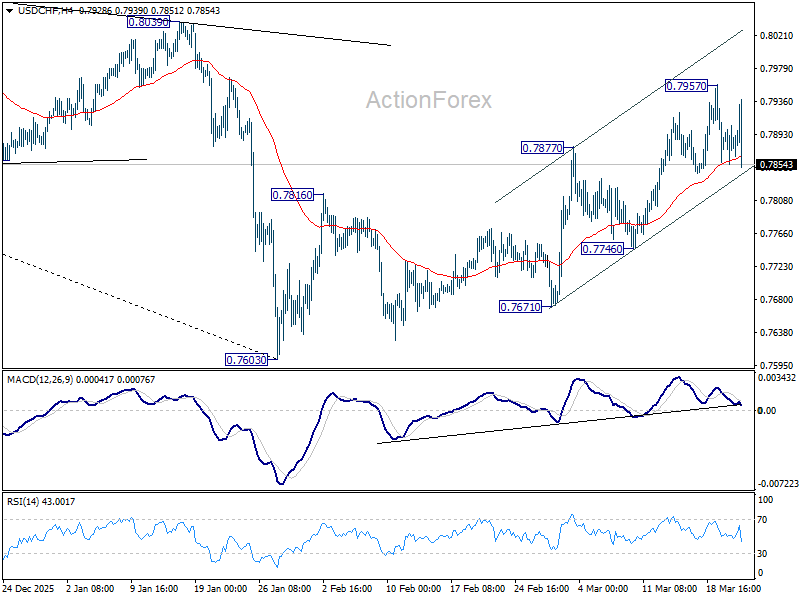
USD/CHF is still bounded in range trading below 0.7957 and intraday bias stays neutral. As noted before, rise from 0.7603 should be correcting whole decline from 0.9200. Above 0.7957 will target 38.2% retracement of 0.9200 to 0.7603 at 0.8213. This will remain the favored case as long as 0.7746 support holds.
In the bigger picture, a medium term bottom should be in place at 0.7603 on bullish convergence condition in D MACD. Rebound from there is seen as correcting the fall from 0.9200 only. However, decisive break of 55 W EMA (now at 0.8085) will suggest that it's probably correcting the larger scale down trend from 1.0146 (2022 high). On the other hand, rejection by the 55 W EMA will setup down trend resumption to 100% projection of 1.0146 (2022 high) to 0.8332 from 0.9200 at 0.7382 at a later stage.
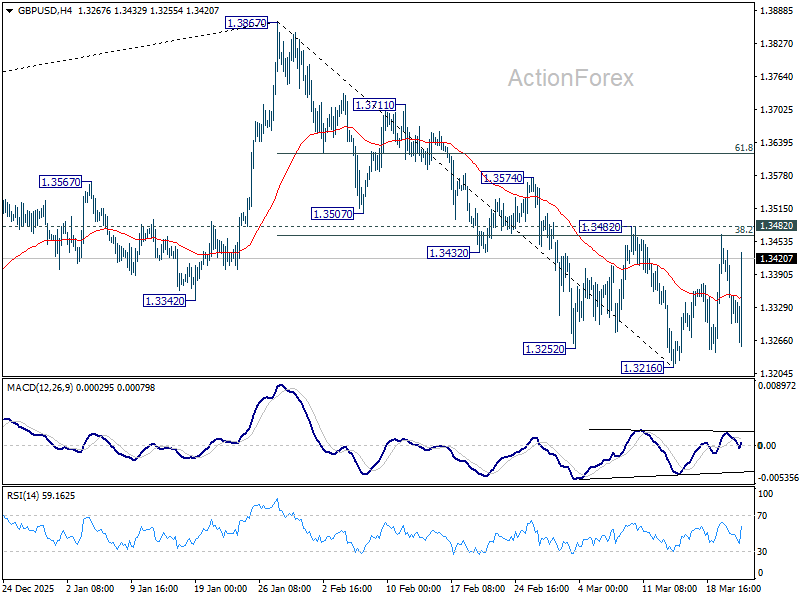
GBP/USD Mid-Day Outlook
Daily Pivots: (S1) 1.3279; (P) 1.3362; (R1) 1.3426; More...
GBP/USD is still bounded in sideway trading and intraday bias stays neutral. Further decline is in favor with 1.3482 resistance intact. On the downside, below 1.3216 will resume the fall from 1.3867 to 1.3008 structural support. However, decisive break of 1.3482 will argue that the fall from 1.3867 has completed, and turn bias back to the upside for 61.8% retracement of 1.3867 to 1.3216 at 1.3618.
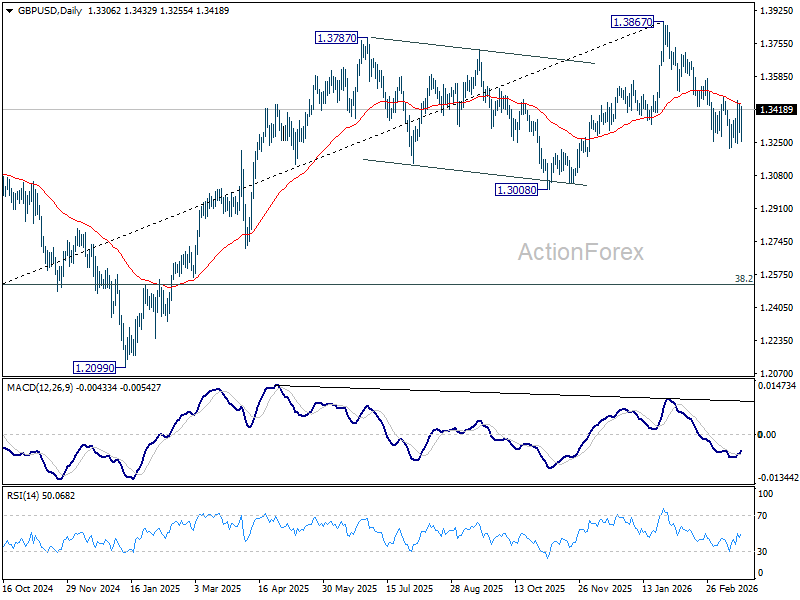
In the bigger picture, considering bearish divergence condition in both D and W MACD, a medium term top should be in place at 1.3867. Firm break of 1.3008 support will argue that fall from 1.3867 is at least correcting the rise from 1.0351 (2022 low) with risk of bearish reversal. That would open up further decline to 38.2% retracement of 1.0351 to 1.3867 at 1.2524. For now, medium term outlook will be neutral at best as long as 1.3867 resistance holds, or until further development.
EUR/USD Mid-Day Outlook
Daily Pivots: (S1) 1.1532; (P) 1.1565; (R1) 1.1605; More….
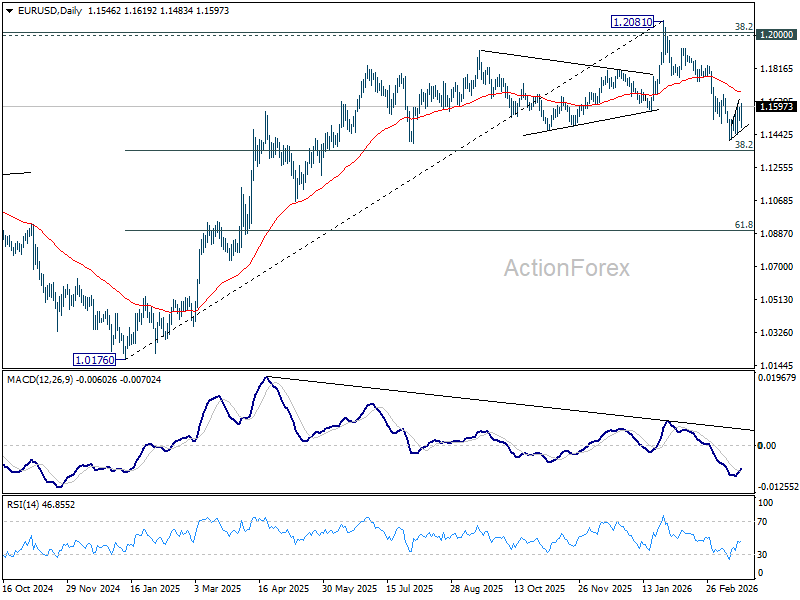
EUR/USD rebound from 1.1408 extended higher today but upside is still capped below 1.1666 cluster resistance (38.2% retracement of 1.2081 to 1.1408 at 1.1665). Intraday bias stays neutral and further decline remains in favor. On the downside, below 1.1408 will resume the fall from 1.2081 to 38.2% retracement of 1.0176 to 1.2081 at 1.1353. However, decisive break of 1.1666 will argue that the fall from 1.2081 has completed, and turn bias back to the upside for 61.8% retracement of 1.2081 to 1.1408 at 1.1824.
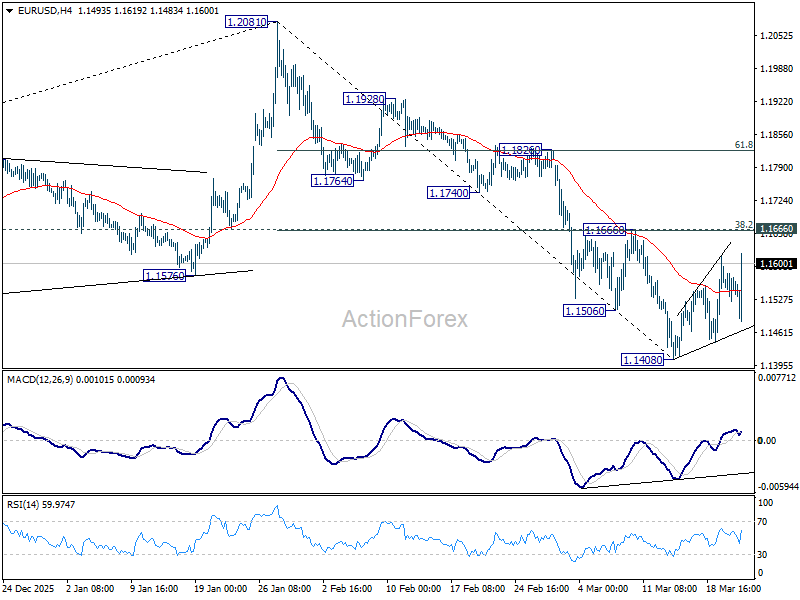
In the bigger picture, prior break of 55 W EMA (now at 1.1501) should confirm rejection by 1.2 key cluster resistance level. The whole up trend from 0.9534 (2022 low) might have completed as a three wave corrective rise too. Deeper fall is expected to long term channel support (now at 1.0528). Meanwhile, risk will stay on the downside as long as 1.2081 holds, even in case of strong rebound.