Sample Category Title
AUD/USD Daily Report
Daily Pivots: (S1) 0.6986; (P) 0.7042; (R1) 0.7080; More...
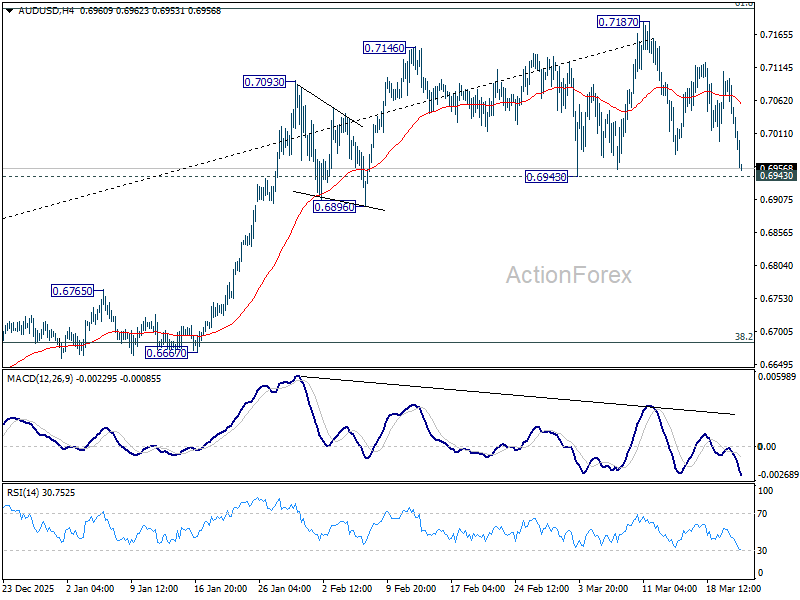
Immediate focus in now on 0.6943 support in AUD/USD. Decisive break there should confirm rejection by 0.7206 key fibonacci resistance. That would set up deeper correction to the whole up trend from 0.5913, and target 38.2% retracement of 0.5913 to 0.7187 at 0.6700. Nevertheless, strong rebound from current levels would retain near term bullishness for breakout through 0.7187 at a later stage.
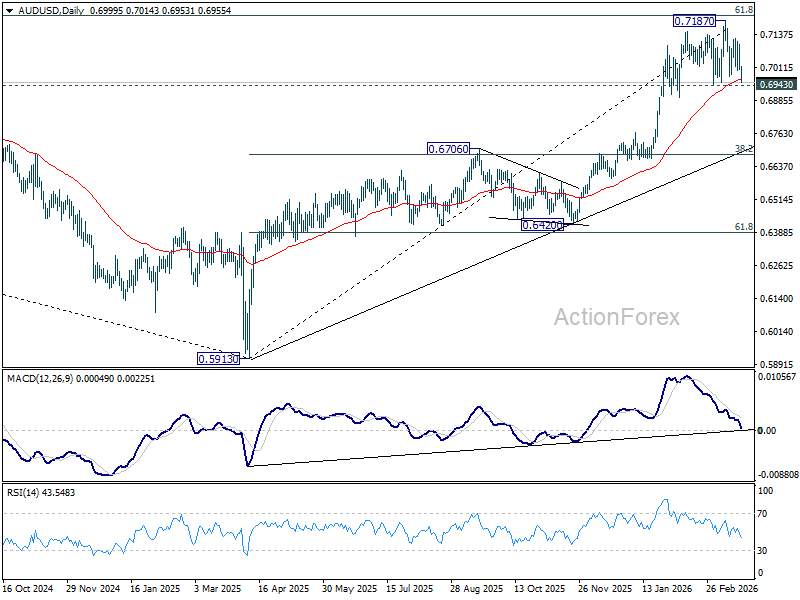
In the bigger picture, current development argues that rise from 0.5913 (2024 low) is reversing whole down trend from 0.8006 (2021 high). Decisive break of 61.8% retracement of 0.8006 to 0.5913 at 0.7206 will pave the way back to 0.8006. This will remain the favored case as long as 0.6706 resistance turned support holds, even in case of deep pullback.
Markets Enter Countdown Mode as US Ultimatum Raises Escalation Risks, AUD Leads FX Losses
Global markets are entering a critical countdown as tensions between the US, Israel, and Iran escalate ahead of a looming deadline. US President Donald Trump’s 48-hour ultimatum has introduced a clear timeline for military action, shifting market dynamics toward event-driven positioning and heightened volatility.
Asian markets have reacted most sharply to the developments. South Korea’s KOSPI dropped more than -6%, while Japan’s Nikkei fell around -4%, reflecting both direct and indirect exposure to the unfolding crisis. US equity futures are also under pressure, though declines remain less severe.
The primary driver remains the risk of a sustained energy shock. With the Strait of Hormuz still constrained, the ultimatum has forced markets to consider the possibility of a prolonged disruption to global oil flows. This has intensified inflation concerns and reinforced expectations of a higher-for-longer interest rate environment.
Iran’s counter-threat has broadened the scope of risks. By signaling possible attacks on energy and water infrastructure across the Gulf, Tehran has raised the prospect of systemic disruption extending beyond oil supply. This introduces a wider range of economic consequences, from energy shortages to industrial slowdowns.
A particularly notable development is the emergence of financial risk as a direct channel. Iran’s warning targeting holders of US Treasuries has unsettled Asian sovereign investors, highlighting vulnerabilities within global capital flows. This has added a extra uncertainty, linking geopolitical escalation to financial stability concerns.
The regional impact is especially pronounced in East Asia. Countries such as Japan and South Korea face dual exposure through energy dependence and financial integration. Even with significant oil reserves, the possibility of a prolonged blockade is driving defensive positioning and accelerating equity market declines.
At the same time, supply chain disruptions are beginning to surface. Delays in critical materials used in semiconductor manufacturing, including helium and etching chemicals, are raising concerns about the continuity of AI-related production. This has contributed to heavy selling in technology sectors across East Asia.
Currency markets are reflecting a similar picture. Australian and New Zealand Dollars are underperforming at the bottom. Meanwhile, Dollar and Canadian Dollar are benefiting from a combination of safe-haven demand and energy-linked support, while Yen and European currencies are sitting in the middle of the performance board.
With the ultimatum set to expire at 23:44 GMT Monday, markets face a binary event risk. A military strike could trigger a sharp escalation and broader market dislocation, while any delay may offer only temporary relief. Until then, investors are likely to remain cautious, with positioning driven by the potential for rapid shifts in both geopolitical and macro conditions.
In Asia, at the time of writing, Nikkei is down -3.47%. Hong Kong HSI is down -3.94%. China Shanghai SSE is down -3.75%. Singapore Strait Times is down -2.29%. Japan 10-year JGB yield is up 0.042 at 2.310.
Silver may find floor at 60, but break risks deeper fall to 50
Silver’s correction is approaching a critical stage as macro pressure builds and key supports come into focus. While 60 may provide a floor supported by industrial demand, a break could trigger a deeper move toward 50, shifting the balance from fundamentals to technical liquidation. Read more.
Stagflation test begins: PMIs to reveal growth shock and rising costs
Markets enter a critical phase as attention shifts from pricing an energy shock to testing its real economic impact. With oil disruptions intensifying, this week’s CPI and global PMIs will determine whether stagflation is already taking hold. The results could reinforce policy divergence—or trigger a broader reassessment of growth risks and central bank paths. Read More.
AUD/USD Daily Report
Daily Pivots: (S1) 0.6986; (P) 0.7042; (R1) 0.7080; More...
Immediate focus in now on 0.6943 support in AUD/USD. Decisive break there should confirm rejection by 0.7206 key fibonacci resistance. That would set up deeper correction to the whole up trend from 0.5913, and target 38.2% retracement of 0.5913 to 0.7187 at 0.6700. Nevertheless, strong rebound from current levels would retain near term bullishness for breakout through 0.7187 at a later stage.
In the bigger picture, current development argues that rise from 0.5913 (2024 low) is reversing whole down trend from 0.8006 (2021 high). Decisive break of 61.8% retracement of 0.8006 to 0.5913 at 0.7206 will pave the way back to 0.8006. This will remain the favored case as long as 0.6706 resistance turned support holds, even in case of deep pullback.
Silver may find floor at 60, but break risks deeper fall to 50
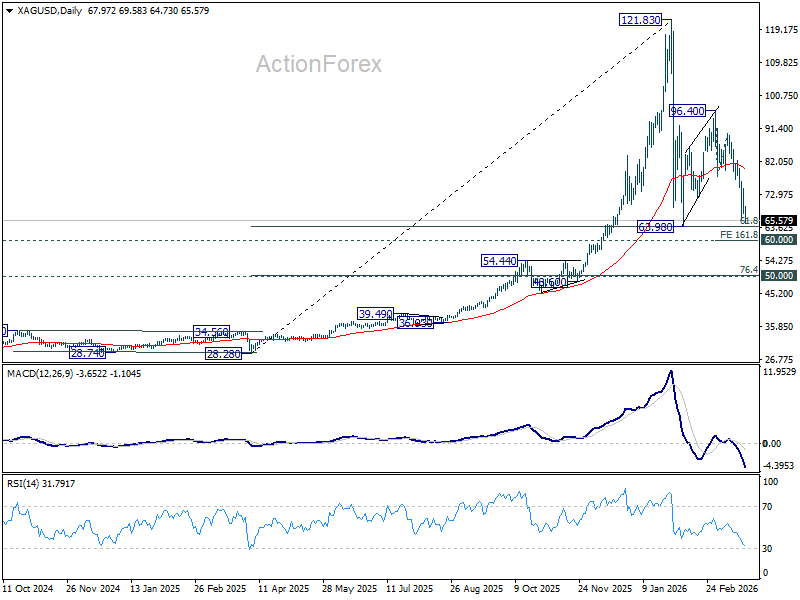
Silver is approaching a critical support zone as its "dual role" as a monetary and industrial asset continues to diverge. Tightening expectations on global central banks, driven by the energy shock, are weighing on its monetary side, leaving the 64 support zone increasingly vulnerable. While industrial demand and persistent physical deficit may offer a floor near 60, the risk is that broader liquidation and "technical forces" could drive a deeper correction toward 50.
The dominant driver at this stage is the repricing of global monetary conditions. Elevated oil prices are lifting inflation expectations, prompting markets to anticipate a more aggressive policy response from central banks. Rising yields and a higher rate outlook are eroding the appeal of non-yielding assets, placing sustained pressure on Silver.
This marks a clear shift in market dynamics. Earlier gains were supported by strong physical demand and tightening supply conditions, but price action is now increasingly dictated by macro positioning. Investors are adjusting exposure as policy expectations evolve, with monetary factors outweighing structural fundamentals in the near term.
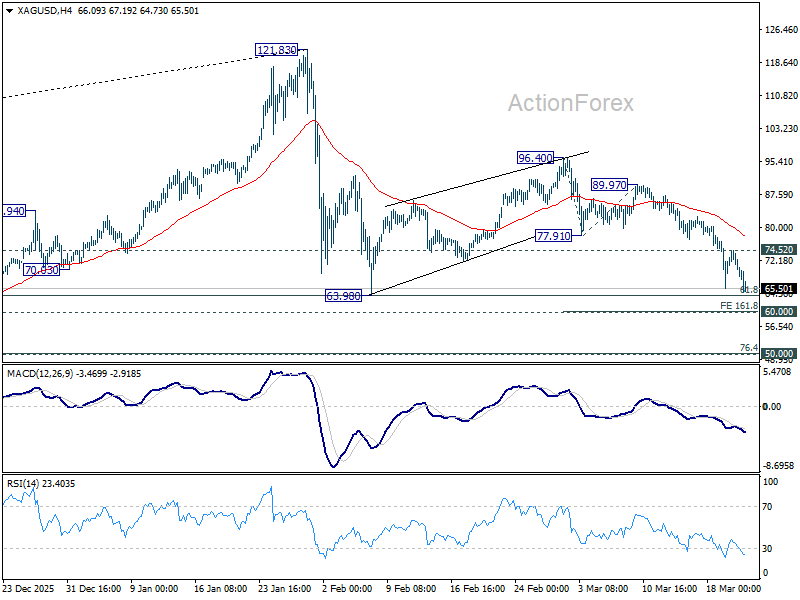
Technically, Silver is now pressing 64 support cluster, which aligns with 61.8% retracement of 28.28 (2025 low) to 121.83 at 64.01. Given the current downward momentum, this level is at risk of giving way, especially if yields continue to rise and risk sentiment deteriorates further.
A break below 64 would shift focus to 60 level, a key psychological and technical support. This zone is where Silver’s "industrial side" may begin to assert itself more clearly, as lower prices attract demand from sectors such as solar and advanced manufacturing.
The physical backdrop remains supportive. The market is facing its sixth consecutive year of supply deficit, and deeper price declines are likely to be met with strategic buying from industrial users. This dynamic could help stabilize prices in the 60 area, at least initially. A strong bounce from 60, followed by break of 74.52 resistance, will be an important sign of stabilization.
However, the risk is that financial flows overwhelm physical demand. In a period of elevated volatility, liquidation driven by margin calls and ETF outflows can dominate price action. In such conditions, Silver may decouple from its underlying fundamentals as "technical forces" take precedence.
If 60 fails to hold, the correction could extend toward the 48.60–54.44 zone, corresponding to the prior Wave 4 consolidation of the up trend from 28.28 to 121.83. That coincides with 76.4% retracement of 28.28 to 121.83 at 50.35.
EUR/USD Upside Stalls, Resistance Zone Blocks Further Recovery
Key Highlights
- EUR/USD started a recovery wave from the 1.1410 level.
- It traded above a key bearish trend line with resistance at 1.1510 on the 4-hour chart.
- GBP/USD failed to clear the 1.3450 resistance zone and trimmed gains.
- Gold prices declined heavily below $5,000 and $4,800.
EUR/USD Technical Analysis
The Euro found support near 1.1410 and started a recovery wave against the US Dollar. EUR/USD climbed above 1.1500 before it faced resistance.
Looking at the 4-hour chart, the pair traded above a key bearish trend line with resistance at 1.1510. The bulls pushed the pair above the 50% Fib retracement level of the downward move from the 1.1667 swing high to the 1.1410 low.
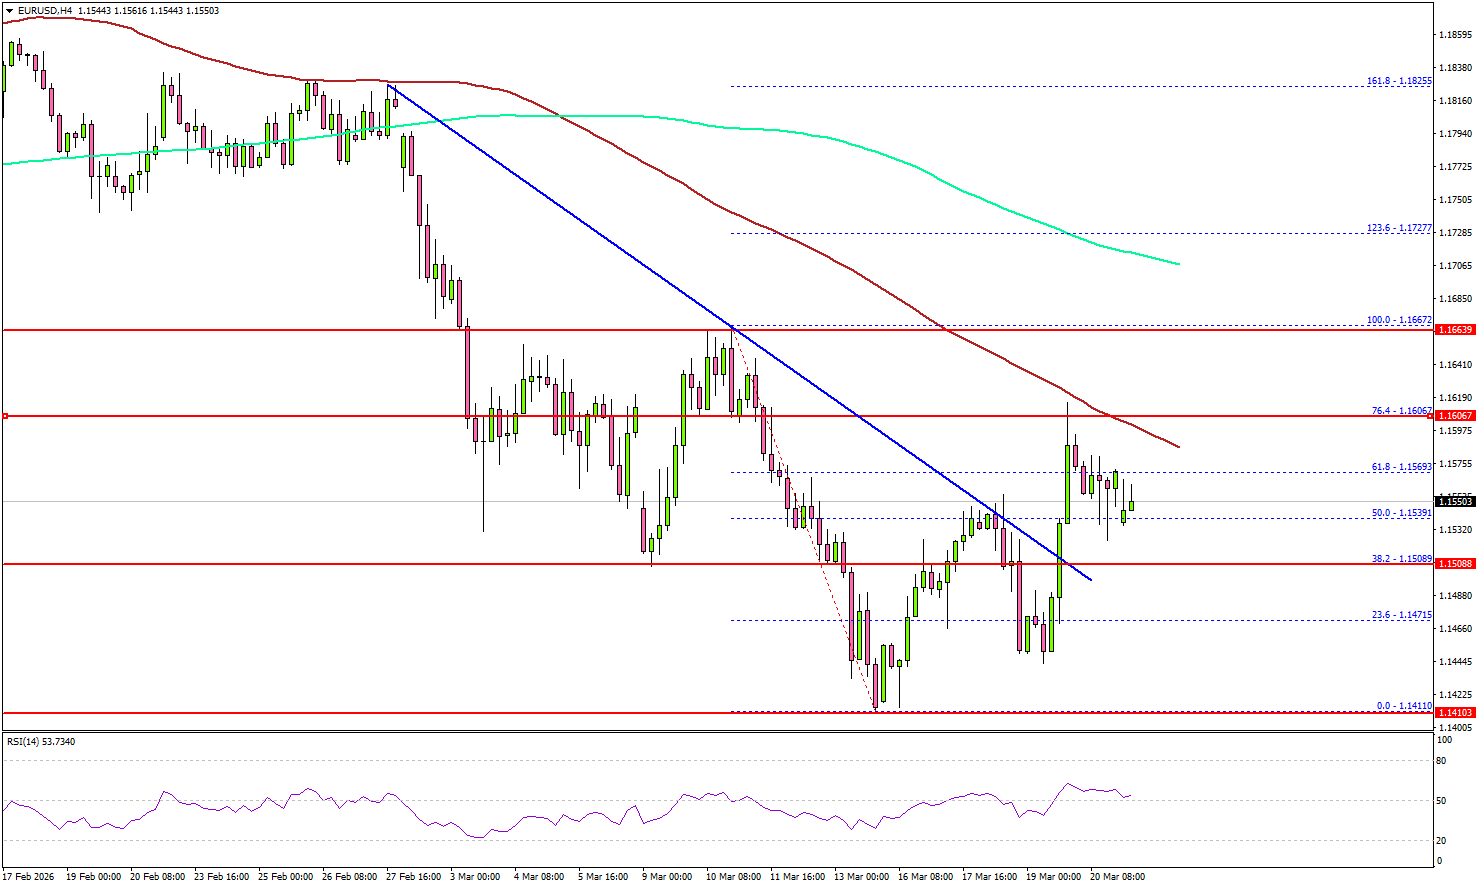
However, the pair faced resistance near 1.1605 and the 100 simple moving average (red, 4-hour). The 76.4% Fib retracement level of the downward move from the 1.1667 swing high to the 1.1410 low also acted as a resistance.
On the upside, the pair is now facing sellers near 1.1600. The first major resistance sits at 1.1620. A close above 1.1620 could open the doors for gains above 1.1640. In the stated case, the bulls could aim for a move to 1.1655.
If there is no upside break above 1.1600, the pair might start a fresh decline. Immediate support is seen near 1.1510. The first key support sits at 1.1450. A close below 1.1450 might call for heavy losses. In the stated case, it could even revisit 1.1410 in the coming days.
Looking at Gold, the price failed to stay above $4,800 and started a sharp decline toward $4,400. The main support sits at $4,200.
Upcoming Key Economic Events:
- ECB's Cipollone speech.
- ECB's Lane speech.
Rising Inflation and Iran Conflict Pressure Markets
The ongoing conflict in Iran and concerns about disruption to the Strait of Hormuz continued to pressure financial markets last week. Oil prices remained highly volatile and tested the $100 level several times as traders focused on supply risks. At the same time, U.S. Producer Price Index (PPI) data came in stronger than expected, adding to concerns that inflation may stay elevated.
Market expectations have started to shift. Instead of expecting interest rate cuts, markets are now pricing in U.S. interest rate increases. U.S. stock markets fell for a fourth straight week as higher inflation and interest rate expectations weighed on sentiment. The Federal Reserve and the Bank of England both kept rates unchanged, in line with expectations.
The Bank of Japan also left rates unchanged, but comments from Governor Ueda were seen as slightly more open to future rate increases, which briefly supported the yen. Gold dropped below $5,000, falling about 10% as speculative selling increased, with the strong U.S. dollar putting pressure on prices.
Markets This Week
U.S. Stocks
As the conflict in Iran continues, equity markets are likely to remain under pressure. Rising inflation expectations in the U.S. and the possibility of interest rate increases are adding further downside risk. For now, focusing on selling opportunities remains the preferred strategy. However, rather than selling into weakness, it is better to wait for a pullback toward the 10-day moving average before entering short positions, as the market is already bearish. Resistance levels are at 46,500, 47,500, and 48,000. Support is seen at 45,000, 44,500, 44,000, and 43,500.
Japanese Stocks
The Nikkei index closed near its yearly lows as higher oil prices and continued weakness in U.S. equities pushed Japanese stocks lower. In addition, signals from the Bank of Japan suggesting possible future interest rate increases have added further pressure on the market. Selling remains the preferred short-term strategy. A break below 51,000 could trigger a sharper move lower, while a pullback toward the 10-day moving average may offer a better opportunity to enter short positions. Resistance is seen at 53,000, 54,750, 56,000, 57,000, and 58,000, while support is at 51,000円, 50,000円, and 49,000円.
USD/JPY
USD/JPY moved higher on the back of strong oil prices, testing resistance near the 160 level, with no clear sign of intervention from the Bank of Japan. Comments from the Bank of Japan regarding the possibility of intervention triggered a brief pullback, but the pair recovered and closed the week above the 10-day moving average, keeping the short-term bias bullish. For now, range trading between 158 and 160 appears to be the best short-term strategy. Resistance is at 160, 162, and 165, while support is seen at 158.50, 158.00, and 156.50.
Gold
Gold’s recent weak performance, despite the conflict in Iran, combined with a stronger U.S. dollar, led to a sharp decline once the $5,000 support level was broken, as speculators exited positions. The market is now clearly oversold, which could provide short-term buying opportunities this week. However, a break below the yearly low around $4,400 could trigger another significant move lower. Resistance is at $4,700, $4,850, $5,000, and $5,100, while support is at $4,400, $4,300, $4,200, $4,100, and $4,000.
Crude Oil
Resistance at $100 has limited further gains as the conflict in Iran continues and concerns about restricted oil supply remain. Despite this, oil has stayed above the 10-day moving average, showing continued strength. As long as the conflict continues and price holds above this level, buying on pullbacks remains the preferred strategy this week. Resistance is at $100, $110, $120, $125, and $130, while support is at $90, $80, $75, $70, and $67.5.
Bitcoin
Bitcoin continued to test resistance near $75,000 as recent price stability encouraged speculative buying. However, weakness in U.S. equities reduced overall risk appetite, causing the market to pull back and close near the middle of the $65,000 to $75,000 range. Range trading remains the preferred short-term strategy. Resistance is at $75,000, $80,000, and $85,000, while support is at $65,000, $60,000, and $55,000.
This Week’s Focus
- Monday: U.S. Construction Spending
- Tuesday: Japan National CPI and S&P Global Services PMI, E.U. HCOB Eurozone Manufacturing PMI, U.K. S&P Global Services PMI, U.S. S&P Global Manufacturing PMI
- Wednesday: Japan Monetary Policy Meeting Minutes, Australia CPI, U.K. CPI, U.S. Current Account
- Thursday: Japan BoJ Core CPI
- Friday: U.K. Retail Sales, U.S. Michigan Consumer Expectations
The main focus this week will be the conflict in Iran, as markets are starting to price in a longer war, despite comments from Trump suggesting the U.S. is close to meeting its objectives. Equity markets have been under steady pressure, and there is still a risk of panic selling if oil prices spike above $100 on further negative news from the region.
There is limited major economic data this week. The key releases include manufacturing PMI data from several countries, Japan’s Monetary Policy Meeting Minutes, and U.S. consumer sentiment data. Markets will be watching closely for any signs of how inflation and growth expectations are evolving.
Natural Gas (NG_F) Nesting, Looking To Break Higher
Natural Gas (NG_F) is poised to continue higher after ending a bearish cycle in February 2026, Now in a nest, the commodity is expected to break higher while the February 2026 low is not breached.
Over the long term, Natural Gas (NG_F) has exhibited a choppy, sideways price pattern. Since 1995, it has failed to sustain a trend of either higher highs or lower lows. The commodity completed a major supercycle rally in December 2005, reaching a record high. Following that peak, a bearish corrective cycle commenced, lasting until March 2024, during which it fell to its pre-1995 lows. From the March 2024 low, a fresh bullish cycle began in a 5-wave structure, concluding in January 2026. A subsequent, highly volatile pullback ensued, ending in February 2026. Since then, the commodity has been in a “nest” formation, awaiting a bullish momentum to initiate a breakout higher.
Natural Gas H4 Elliott Wave Outlook – 22 March, 2026
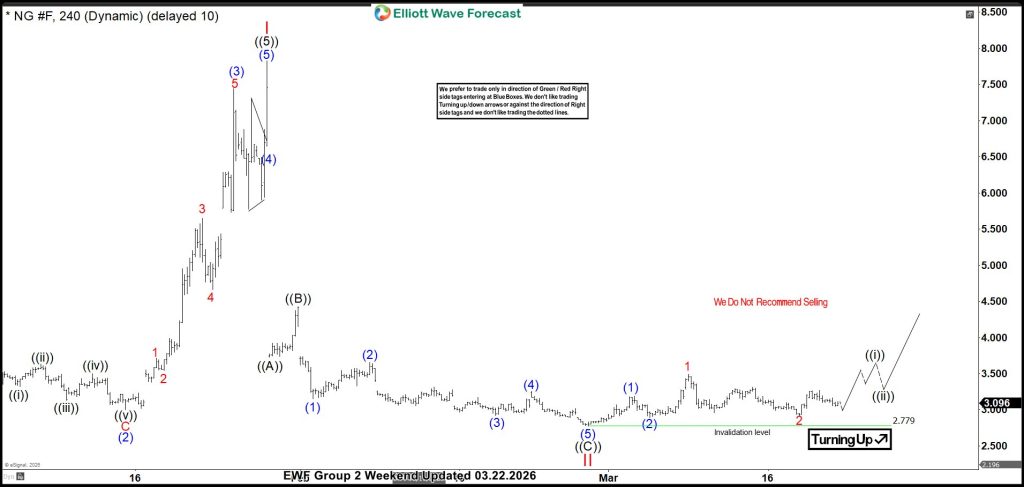
We recently shared the H4 chart with Elliottwave-forecast members. The chart shows a completed impulse structure for cycle degree wave I in January 2026. According to Elliott Wave theory, a 3-wave correction/pullback follows a 5-wave trend/advance. Wave II, within a 3-wave structure, followed and ended in February 2026 at $2.779. From this February 2026 low, we anticipate a bullish impulse or 5-wave reaction to confirm that wave II has ended. The chart above shows a triple nest emerging, suggesting a significant bullish move could soon follow. However, until we see a 5-wave response, new buyers will remain hesitant. As retail traders, it’s better to join a move rather than attempt to initiate it. Let the market show the way, and then we will follow.
In the coming days/weeks, we anticipate a 5-wave advance. Once confirmed, we can confidently buy dips within the blue box. Until then, the reaction from $2.779 is likely a 3-wave bounce. Downside could resume below $2.779, as much as the expected 5-wave upside. We need more data in the coming days/weeks to determine which scenario unfolds. We always advise our members to trade with the market’s direction, whether red or green, and never against it. Currently, we don’t want to sell, but it’s not yet time to buy Natural Gas.
CHFJPY Wave Analysis
CHFJPY : ⬆️ Buy
- CHFJPY reversed from the support zone
- Likely to rise to resistance level 203.60
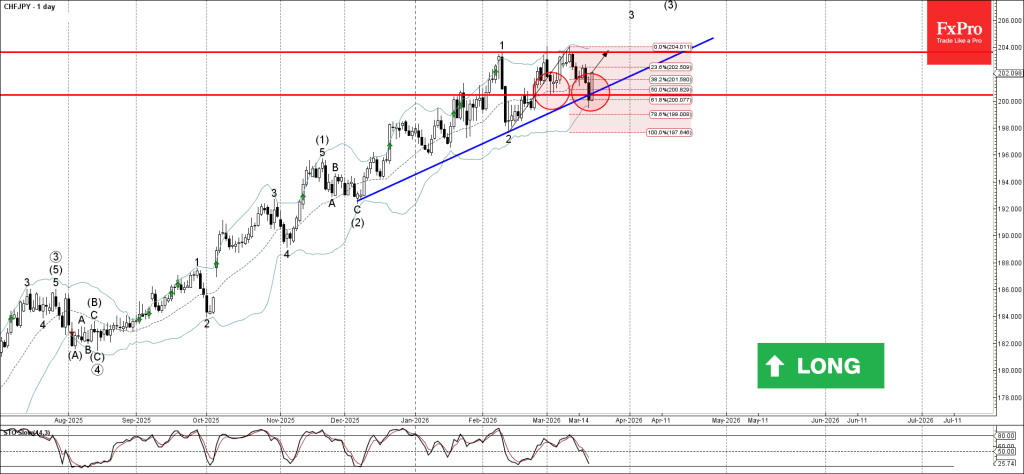
CHFJPY currency pair recently reversed from the support zone between the round support level 200.00 (which has been reversing the price from February), support trendline from December and 61.8% Fibonacci correction of the upward impulse from February.
The upward reversal from this support zone created the daily Japanese candlesticks reversal pattern Bullish Engulfing.
Given the strong daily uptrend, CHFJPY currency pair can be expected to rise to the next resistance level 203.60 (former top of wave 1 from February).
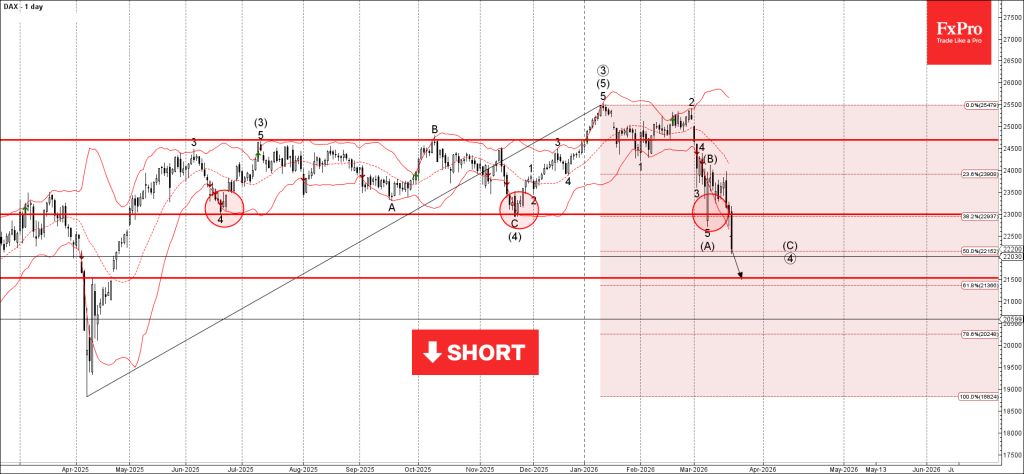
DAX Wave Analysis
DAX: ⬇️ Sell
- DAX broke long-term support level 23000.00
- Likely to fall to support level 21500.00
DAX index recently broke the support zone between the powerful long-term support level 23000.00 (which has been reversing the price from June of 2025) and 38.2% Fibonacci correction of the upward impulse from April.
The breakout of this support zone accelerated the active weekly impulse wave (C) from the start of March.
DAX index can be expected to fall to the next support level 21500.00 (target price for the completion of the active impulse wave (C)).
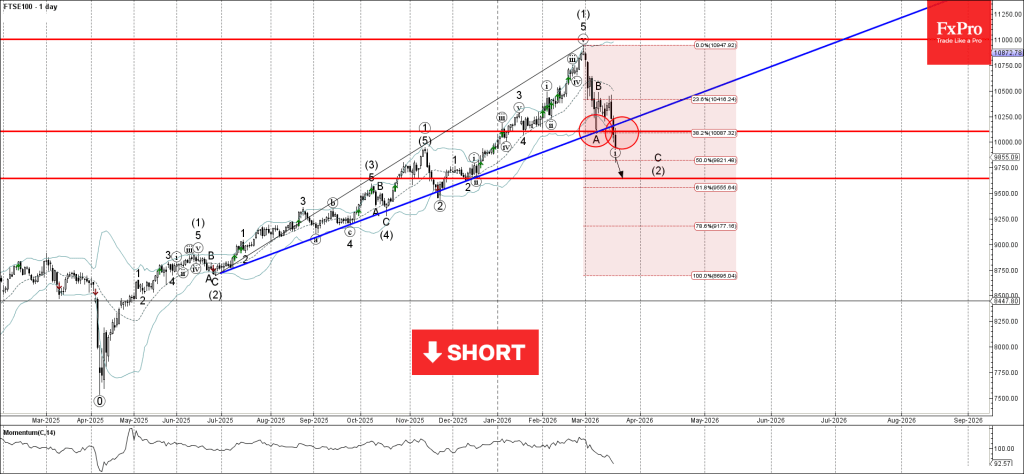
FTSE 100 Wave Analysis
FTSE 100: ⬇️ Sell
- FTSE 100 broke support zone
- Likely to fall to support level 9645.00
FTSE 100 Index recently broke the support zone between the support level 10100.00 (which has been reversing the price from January) and the support level 10000.00, coinciding with the daily up trendline from 2025 and 38.2% Fibonacci correction of the upward impulse from June.
The breakout of this support zone accelerated the active impulse wave C – which belongs to the intermediate ABC correction (2) from February.
FTSE 100 Index can be expected to fall to the next support level 9645.00 (target price for the completion of the active ABC correction (2)).
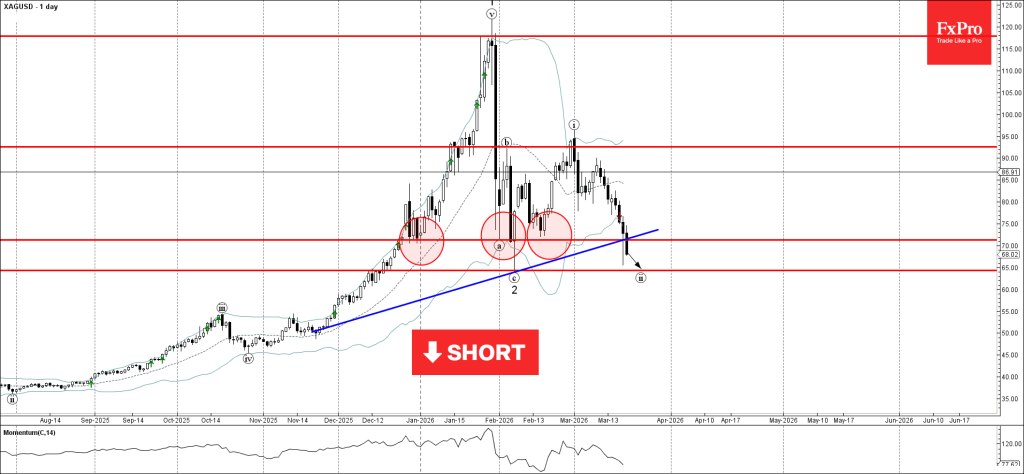
Silver Wave Analysis
Silver: ⬇️ Sell
- Silver broke round support level 70.00
- Likely to fall to support level 65.00
Silver recently broke the support zone between the round support level 70.00 (which has been reversing the price from the end of December) and the support trendline from November.
The breakout of this support zone accelerated the active short-term correction ii – which belongs to the impulse wave 3 from the start of February.
Silver can be expected to fall to the next support level 65.00 (target price for the completion of the active wave ii), which stopped wave 2 at the start of February.