Sample Category Title
Markets Shift to ‘Trust but Verify’ Mode After Trump Pause Meets Iran Denial
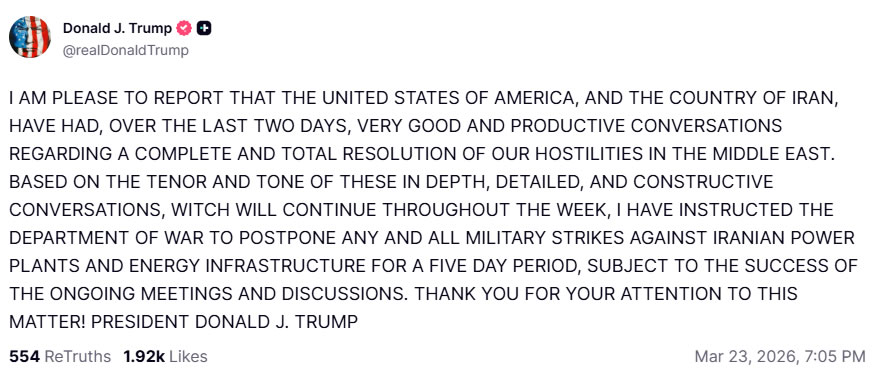
Markets shifted into a “trust but verify” mode as sharp volatility unfolded following a sudden geopolitical pivot. Initial optimism surged after US President Donald Trump announced a pause in planned strikes against Iranian energy infrastructure, but gains were quickly tempered as Iran denied any direct or indirect talks, raising doubts over the credibility of the de-escalation narrative.
The initial trigger for the rally came from Trump’s statement that “very good and productive conversations” had taken place, leading to a decision to postpone “any and all military strikes” for a five-day period. The announcement marked a sharp reversal from the earlier 48-hour ultimatum that had threatened immediate escalation if the Strait of Hormuz was not reopened.
Markets reacted aggressively to the perceived de-escalation. Brent crude briefly plunged to as low as 96, reflecting a rapid unwinding of war risk premium. Gold rebounded sharply to 4,463 after nearly breaking through the key 4,000 psychological level, while US equity futures surged, with DOW futures at one point up around 1,300 points.
However, the relief rally proved short-lived. Iranian media reports quickly pushed back against the US narrative, stating there had been no direct or indirect communication with Washington. This introduced a critical layer of uncertainty, suggesting that the “productive conversations” cited by Trump may have involved only intermediaries rather than a genuine diplomatic breakthrough.
The market reaction to this credibility shock was swift. Oil prices reversed sharply, with Brent climbing back above 105, while equity futures surrendered roughly half of their earlier gains. The rapid reversal highlights how fragile sentiment remains, with positioning highly sensitive to headline risk.
At its core, the market is grappling with a widening credibility gap. While the pause in military action reduces immediate escalation risk, the absence of confirmed dialogue raises questions about whether a meaningful resolution is underway. This has left investors reluctant to fully embrace the relief rally.
Importantly, the underlying structural risks remain unchanged. The Strait of Hormuz continues to face severe disruption, a critical concern given that roughly 20% of global oil flows pass through the chokepoint. Until shipping conditions normalize, the energy shock—and its inflationary consequences—will continue to weigh on global markets.
Meanwhile, governments are already preparing for a prolonged crisis. In the UK, Prime Minister Keir Starmer convened an emergency “Cobra” meeting to address the economic fallout, including rising borrowing costs and cost-of-living pressures. This signals that the conflict is increasingly feeding into domestic policy responses across major economies.
In Asia, the situation is being viewed as a regional crisis. With around 80% of oil shipments through Hormuz destined for Asian markets, economies such as Japan and South Korea remain particularly vulnerable. This helps explain the persistent underperformance of Asia-linked assets and currencies.
In currency markets, the picture remains mixed but consistent with a cautious tone. Australian Dollar continues to lead losses, followed by New Zealand Dollar and Swiss Franc. Yen is the strongest performer, reflecting safe-haven demand, while Sterling and Dollar are also supported. Euro and Canadian Dollar are trading in the middle as markets await clearer signals.
For now, markets remain trapped between optimism and uncertainty. The pause in military action offers temporary relief, but without confirmation of genuine diplomatic progress, sentiment is likely to stay fragile. Until the situation in the Strait of Hormuz is resolved, markets are likely to remain highly reactive, with “trust but verify” defining the near-term outlook.
In Europe, at the time of writing, FTSE is up 0.19%. DAX is up 1.87%. CAC is up 1.43%. UK 10-year yield is down -0.053 at 4.887. Germany 10-year yield is down -0.054 at 2.998. Earlier in Asia, Nikkei fell -3.48%. Hong Kong HSI fell -3.54%. China Shanghai SSE fell -3.63%. Singapore Strait Times fell -2.17%. Japan 10-year JGB yield rose 0.054 to 2.323.
Gold rebounds on TACO-driven de-escalation as 4,000 support holds
Gold’s sharp selloff stalled at the 4000 support zone before rebounding on a sudden policy reversal from Washington. The TACO-driven pause in planned Iran strikes has eased immediate escalation risks, but with yields still elevated, the move may prove to be a temporary stabilization rather than a confirmed bottom. Read more.
EUR/USD Mid-Day Outlook
Daily Pivots: (S1) 1.1532; (P) 1.1565; (R1) 1.1605; More….
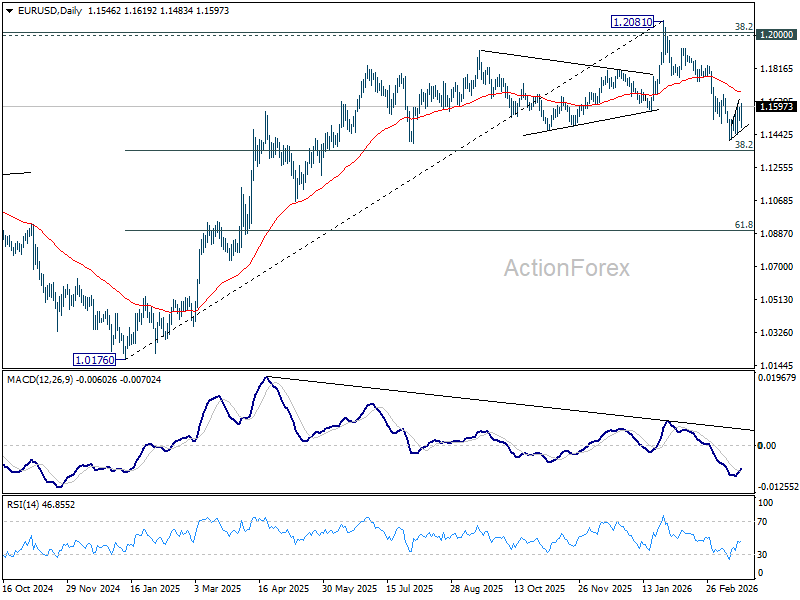
EUR/USD rebound from 1.1408 extended higher today but upside is still capped below 1.1666 cluster resistance (38.2% retracement of 1.2081 to 1.1408 at 1.1665). Intraday bias stays neutral and further decline remains in favor. On the downside, below 1.1408 will resume the fall from 1.2081 to 38.2% retracement of 1.0176 to 1.2081 at 1.1353. However, decisive break of 1.1666 will argue that the fall from 1.2081 has completed, and turn bias back to the upside for 61.8% retracement of 1.2081 to 1.1408 at 1.1824.
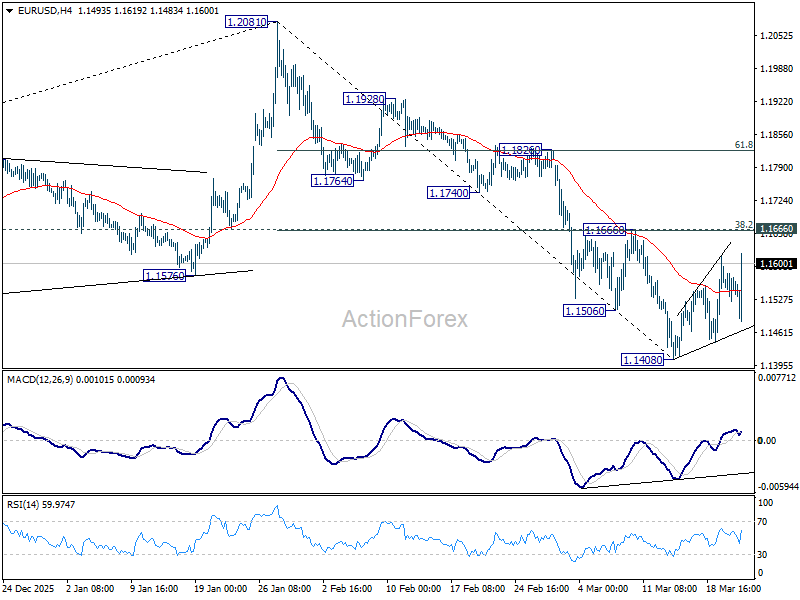
In the bigger picture, prior break of 55 W EMA (now at 1.1501) should confirm rejection by 1.2 key cluster resistance level. The whole up trend from 0.9534 (2022 low) might have completed as a three wave corrective rise too. Deeper fall is expected to long term channel support (now at 1.0528). Meanwhile, risk will stay on the downside as long as 1.2081 holds, even in case of strong rebound.
Gold rebounds on TACO-driven de-escalation as 4,000 support holds
Gold rebounded on a TACO-driven de-escalation after testing key support near 4,000, as a sudden shift in US policy stance halted the sharp selloff. Prices had earlier dropped to 4,098.54, putting the psychological 4,000 level at risk before recovering on headlines pointing to a temporary pause in escalation.
The reversal was triggered by US President Donald Trump’s announcement that the US would postpone military strikes on Iranian energy infrastructure. In a Truth Social post, Trump said the two sides had engaged in “very good and productive conversations” and that he had instructed a delay of “any and all military strikes… for a five day period,” signaling a shift away from immediate confrontation.
This marks a sharp pivot from the 48-hour ultimatum issued just a day earlier, where the US had threatened to “obliterate” Iranian power and energy facilities if the Strait of Hormuz was not reopened. The rapid change in tone—from escalation to negotiation—fits the pattern traders now describe as a “TACO” moment, where sudden policy reversals drive abrupt market moves.
From a macro perspective, the development has temporarily eased immediate geopolitical risk, prompting short covering in Gold. However, the underlying drivers of the recent decline remain intact. Rising yields and expectations of tighter monetary policy, fueled by energy-driven inflation, continue to weigh on non-yielding assets.
Technically, Gold has found support at a critical confluence zone. The 4,000 psychological level aligns closely with the 55 W EMA at 4,001.61, as well as the 38.2% retracement of 1,614.60 (2022 low) to 5,598.38 (Jan high) at 4,076.57. The ability to hold above this region suggests that a near-term bottom may be forming.
However, confirmation of stabilization requires a stronger recovery. A break above 38.2% retracement of 5,419.02 to 4,098.46 at 4,602.90, would indicate that downside momentum has been exhausted and that a more sustained rebound is underway.
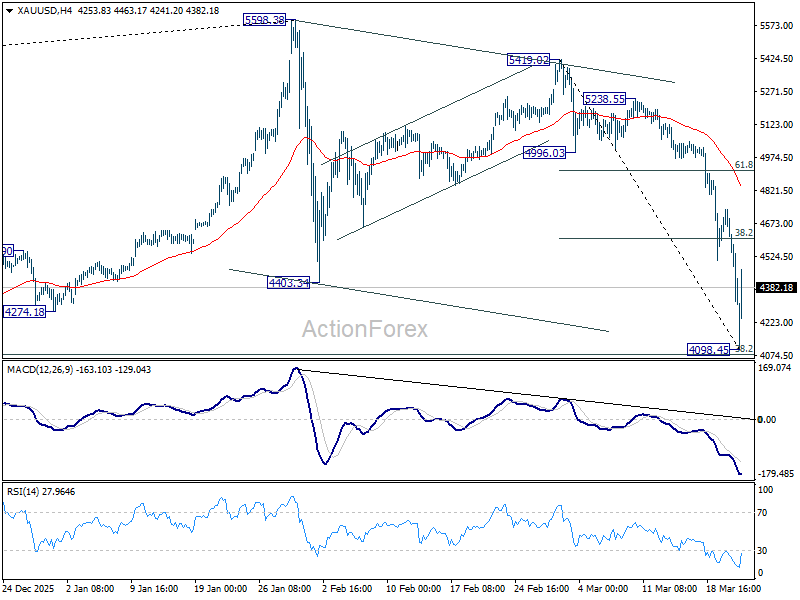
If such a move materializes, Gold could extend gains toward 55 D EMA, currently around 4875.45. This would represent a recovery phase within the broader correction, supported by a stabilization in market sentiment and a pause in liquidation pressures.
Conversely, failure to build on the current rebound would leave Gold vulnerable to renewed downside. A decisive break below 4000 would signal that the correction is not yet complete, exposing deeper losses as macro pressures and positioning dynamics continue to dominate price action.
Gold Has Failed the Test
- Oil prices might be higher for longer.
- The gold bubble has burst.
The US dollar quickly recovered from the blow it took from central banks. The greenback recouped most of its losses against the majors. Despite regulators’ readiness to raise rates, the conflict in the Middle East shows no sign of ending. Donald Trump has issued a 48-hour ultimatum to Iran, threatening to bomb the country’s energy infrastructure if the Strait of Hormuz is not opened. However, Tehran is unlikely to bow to the US president’s demands.
The Middle East is increasingly resembling Ukraine. In February 2022, investors also expected the conflict in Eastern Europe to be short-lived. Their views then changed, and the US dollar rose by 15% over the next three months. Since the start of this war, the USD index has risen by just 2%. The potential for a rally in the US currency is still huge.
Oil prices are rising faster than they were four years ago. Meanwhile, Goldman Sachs has raised its forecast for the average Brent price to $85 per barrel in 2026 for the second time in two weeks. According to the bank, high prices are here to stay. It expects the Strait of Hormuz to maintain its throughput capacity at 5% of pre-war levels for six weeks. After that, it will take a month to restore oil transport volumes to their previous levels.
The US has lifted sanctions on Iranian oil, which, according to the Treasury Department’s estimates, will allow around 140 million barrels to be released onto the market, playing on the side of the bears. Iran is on the bull’s side right now, claiming it does not have as much oil stranded at sea as is commonly believed.
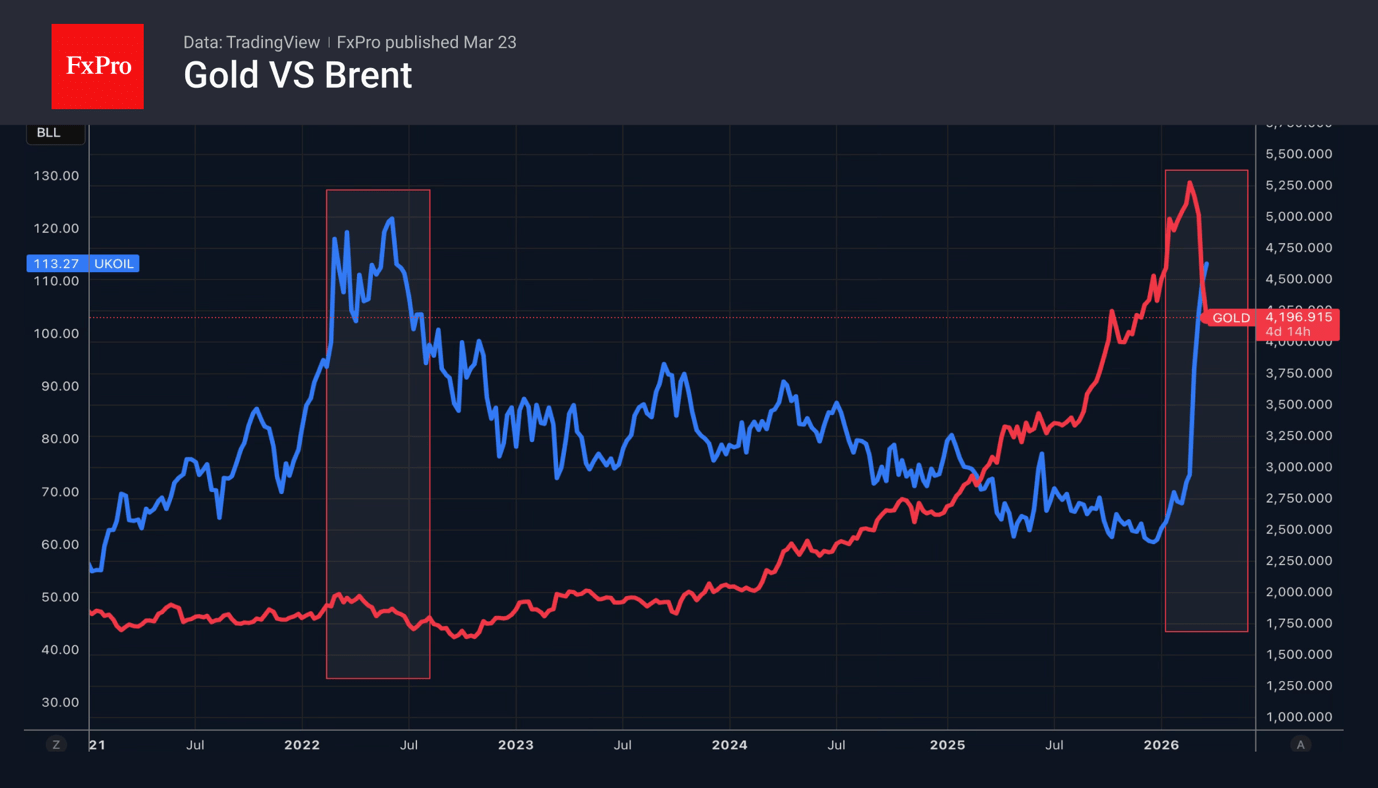
Gold has been the main casualty of the conflict in the Middle East, losing around 14% of its value so far. Gold is considered a safe-haven and a hedge against inflation, but recent geopolitics has increased inflation risks, pushing up the likelihood of rate hikes, not cuts, as before March. From another angle, Gold simply failed to pass the safe-haven test, falling victim to speculative trading. The rapid rise in the precious metal’s price in 2025 and early 2026 led to an overcrowded market, and now the conflict has burst the inflated bubble.
AUD/USD Falls Below Key Support
As the AUD/USD chart indicates, the Australian dollar is showing weakness against the US dollar at the start of the week. Notably, we are seeing a bearish breakout below the lower boundary of an important ascending channel that had been in place since December 2025.
Among the key bearish factors:
- → increased demand for the US dollar as a safe-haven asset amid the United States’ involvement in large-scale military actions against Iran. US President Donald Trump has threatened strikes on Iranian power infrastructure if the Strait of Hormuz remains closed, while Tehran has warned of potential attacks on key US and Israeli facilities;
- → a decline in Asian equity markets, which are sensitive to disruptions in energy supplies from the Middle East. In turn, the value of the Australian dollar is closely tied to commodity exports from Australia to China;
- → traders’ expectations ahead of inflation data due to be released on Wednesday.
Technical Analysis of AUD/USD
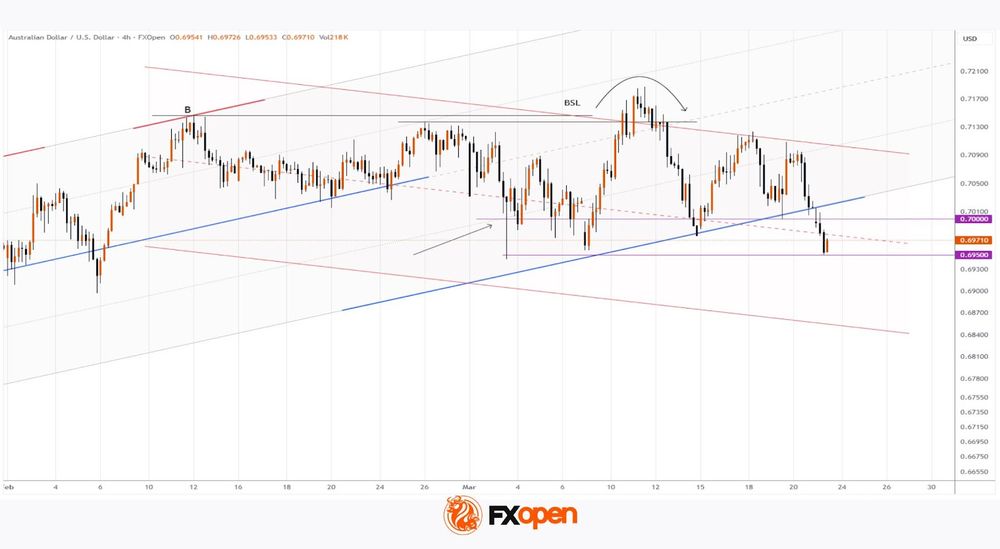
On 24 February, we confirmed the validity of the ascending channel, within which we:
- → identified signs of weakness during the formation of highs A and B;
- → suggested a potential break below the channel median with a move towards the psychological level of 0.7000.
Indeed, the price failed to surpass high B and moved into the lower half of the channel in early March. As shown by the first arrow, on 3 March it briefly dipped below the psychological 0.7000 level before quickly rebounding, signalling strong demand.
However, the underlying weakness near highs A and B persisted. Between 10–12 March, bulls attempted to break through these resistance levels but failed to hold above the new high. From a Smart Money Concept perspective, this resembles a liquidity grab in the buy-side liquidity (BSL) zone — a bearish signal.
In the short term, a rebound from the March low (around 0.6950) is possible. However, when considering a broader outlook, traders should not rule out:
- → the 0.7000 level turning into resistance;
- → further development of a downward trend within an increasingly well-defined descending channel.
Trade over 50 forex markets 24 hours a day with FXOpen. Take advantage of low commissions, deep liquidity, and spreads from 0.0 pips (additional fees may apply). Open your FXOpen account now or learn more about trading forex with FXOpen.
This article represents the opinion of the Companies operating under the FXOpen brand only. It is not to be construed as an offer, solicitation, or recommendation with respect to products and services provided by the Companies operating under the FXOpen brand, nor is it to be considered financial advice.
EUR/USD Declines: All Market Risks Remain Valid
EUR/USD fell to 1.1549 on Monday, with the US dollar extending gains from the previous session amid heightened demand for safe-haven assets as the Middle East conflict escalates.
The confrontation between the US and Israel against Iran has entered its fourth week with no signs of de-escalation. Donald Trump has threatened to strike Iran's energy infrastructure if the Strait of Hormuz is not reopened. Tehran has announced it is prepared to attack key US and Israeli targets in the region in response.
Elevated oil prices continue to fuel inflationary concerns and reduce the likelihood of an imminent Federal Reserve rate cut. Some market participants are even beginning to consider the possibility of a rate hike later this year.
Last week, the Fed held rates steady as expected. Jerome Powell noted that it remains too early to assess the full economic impact of the Iran conflict.
The European Central Bank, the Bank of England, and the Bank of Japan also left rates unchanged but signalled their readiness to tighten policy further should inflationary pressures persist.
Technical Analysis
On the H4 chart, EUR/USD is forming a consolidation range around 1.1526. An upside breakout is expected, with a continuation wave towards 1.1647 as a near-term target. Subsequently, a new downward wave is anticipated to 1.1529. Technically, this scenario is confirmed by the MACD indicator – its signal line is above zero and pointing firmly upwards, reflecting ongoing bullish momentum and the potential for the uptrend to continue.
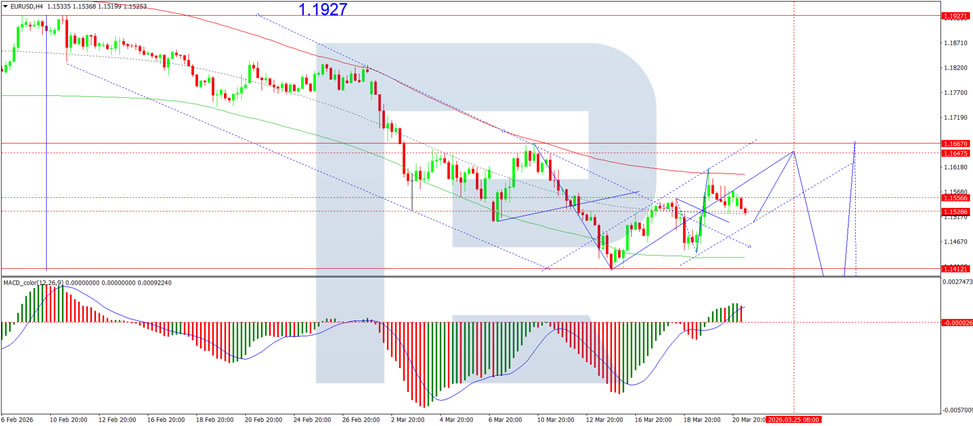
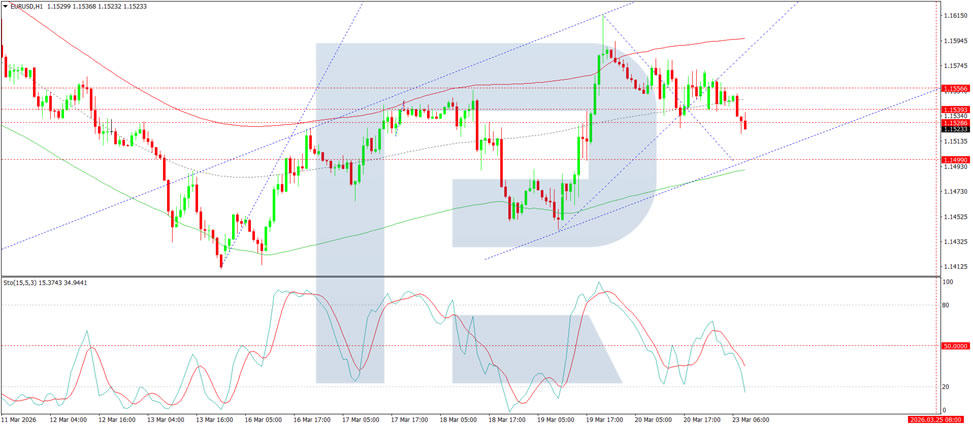
On the H1 chart, the market is forming the structure of the next downward wave towards 1.1499. After reaching this level, a rebound to 1.1556 is expected, with potential for the subsequent growth wave to extend to 1.1647. Technically, this scenario is confirmed by the Stochastic oscillator – its signal line is below 50 and pointing firmly downwards towards 20.
Conclusion
EUR/USD remains under pressure as geopolitical risks in the Middle East continue to drive safe-haven demand for the US dollar. With the conflict entering its fourth week and oil prices remaining elevated, inflationary concerns persist, delaying expectations for Fed rate cuts. Central banks across major economies remain alert, keeping tightening on the table. While technical indicators suggest potential short-term rebound, the broader outlook for the euro remains fragile as market risks show no signs of abating.
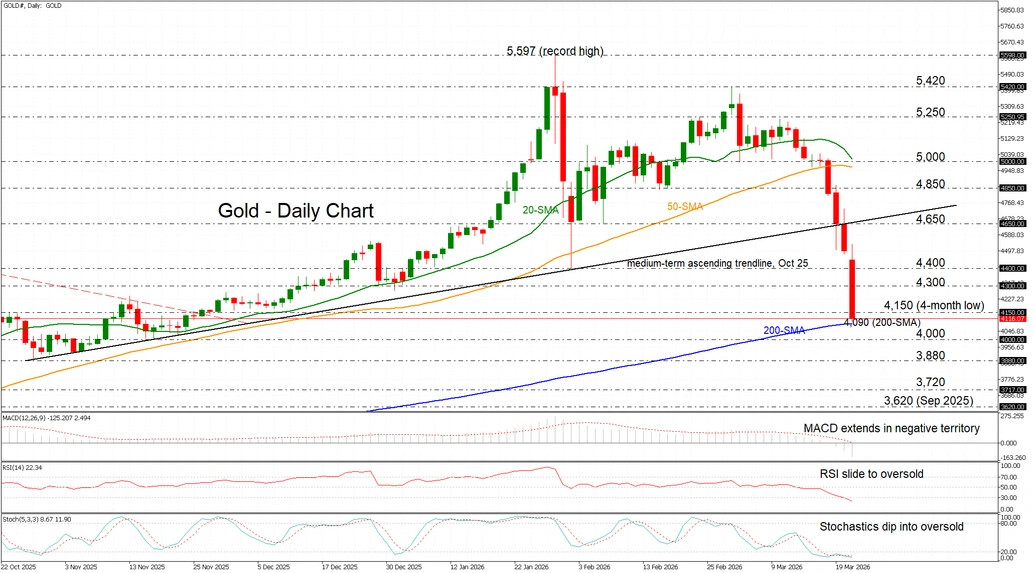
Gold Plunges Over 8% to 4‑Month Lows, Eyes 4,000
- GOLD extends nine‑day losing streak into negative territory; eyes 200-day support.
- Mideast tensions and inflation fears intensify selling pressure.
- Momentum indicators slide further into oversold zones.
Gold is sliding over 8% on Monday, breaching a four‑month low at 4,150, as escalating Middle East tensions fuel inflation concerns and expectations of higher global interest rates.
The precious metal has broken below its medium‑term ascending trendline and extended losses into a ninth consecutive session, slipping under its year‑to‑date low of 4,400 from January 2 and marking its weakest level since November 11, 2025. Last week alone, gold shed more than 10.5%.
The momentum indicators confirm the entrenched bearish tone. The stochastics and RSI are flatlining and firmly in oversold territory, reflecting persistent downside pressure, while the MACD continues to deepen in negative territory, underscoring the force of the selloff.
The 200‑day simple moving average (SMA) near 4,090 is now the key support to watch. A decisive break would reinforce the bearish bias and expose the psychological 4,000 level. Below that, the October and September lows near 3,880, 3,720 and 3,620 become the next downside targets.
On the upside, initial resistance sits in the 4,300-4,400 band, followed by a potential recovery attempt toward the previously supportive uptrend line near 4,650.
Summing up, gold’s downtrend remains firmly in place, with monthly losses now exceeding 21.5% and wiping out year‑to‑date gains. As long as price stays below the broken uptrend line, and especially if it falls through the 200‑day SMA, any rallies are likely to remain shallow and vulnerable to renewed selling for now.
Gold Price Falls to 2026 Low
As the XAU/USD chart indicates, today, shortly after the start of the trading week, gold fell below $4,150 (the low of the year). The last time prices were at this level was in early December 2025, before the rally towards the all-time high.
Why Is Gold Declining?
Gold prices are being pressured by a combination of factors, including:
- → expectations that the Federal Reserve will keep interest rates higher for longer;
- → rising inflation risks driven by elevated oil prices.
In such conditions, market participants may shift capital into bonds, which appear more attractive than gold, as the metal does not generate yield.
Technical Analysis of XAU/USD
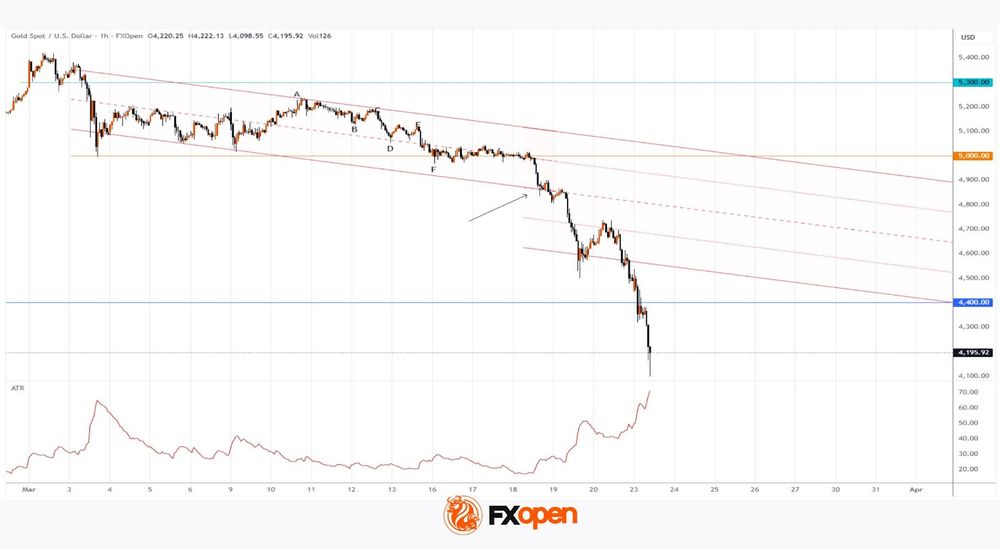
On the morning of 16 March, while analysing gold’s price movements, we identified a sequence of lower highs and lower lows (A–B–C–D–E). In addition:
- → key technical support levels were broken;
- → the outline of a descending channel was established;
- → we suggested that if bears maintained control, the price could move towards the lower boundary of the channel.
As the XAU/USD chart shows, by 18 March a renewed bearish impulse had emerged. Price not only declined towards the lower boundary (as marked by the arrow) but also broke below it, providing grounds to expand the descending channel. However, the lower boundary of the extended channel has so far held against selling pressure.
The current situation appears highly stressed:
- → from the March high, gold has lost around 25%;
- → media reports point to the worst week since 1983;
- → virtually any oscillator indicates strong oversold conditions;
- → the ATR indicator has surged to extremely high levels, which may signal cascading liquidations of long positions.
In this environment, traders should take into account the heightened volatility in gold prices in order to manage risk more effectively. A slowdown in the decline cannot be ruled out, supported by:
- → the proximity of the psychological $4,000 level;
- → an elevated geopolitical backdrop, primarily driven by the ongoing conflict in the Middle East.
Start trading commodity CFDs with tight spreads (additional fees may apply). Open your trading account now or learn more about trading commodity CFDs with FXOpen.
This article represents the opinion of the Companies operating under the FXOpen brand only. It is not to be construed as an offer, solicitation, or recommendation with respect to products and services provided by the Companies operating under the FXOpen brand, nor is it to be considered financial advice.
Gold Hit Hard While WTI Crude Oil Rallies on Intensifying Iran Crisis
Gold price extended losses below $4,500 before the bulls appeared. WTI Crude oil prices are rising and could climb further higher toward $105.00.
Important Takeaways for Gold and WTI Crude Oil Prices Analysis Today
- Gold price failed to clear $5,000 and declined heavily against the US Dollar.
- There is a key bearish trend line forming with resistance at $4,525 on the hourly chart of gold at FXOpen.
- WTI Crude oil prices are moving higher above the $95.00 resistance zone.
- There was a break above a connecting bearish trend line at $97.00 on the hourly chart of XTI/USD at FXOpen.
Gold Price Technical Analysis
On the hourly chart of Gold at FXOpen, the price failed to settle above $5,000 and reacted to the downside, as discussed in the previous analysis. The price traded below $4,800 and $4,650 to enter a bearish zone.
There was a sharp drop below $4,500. The price settled below the 50-hour simple moving average, and RSI dipped below 30. Finally, it tested the $4,320 zone. A low was formed at $4,319, and the price is now consolidating losses.
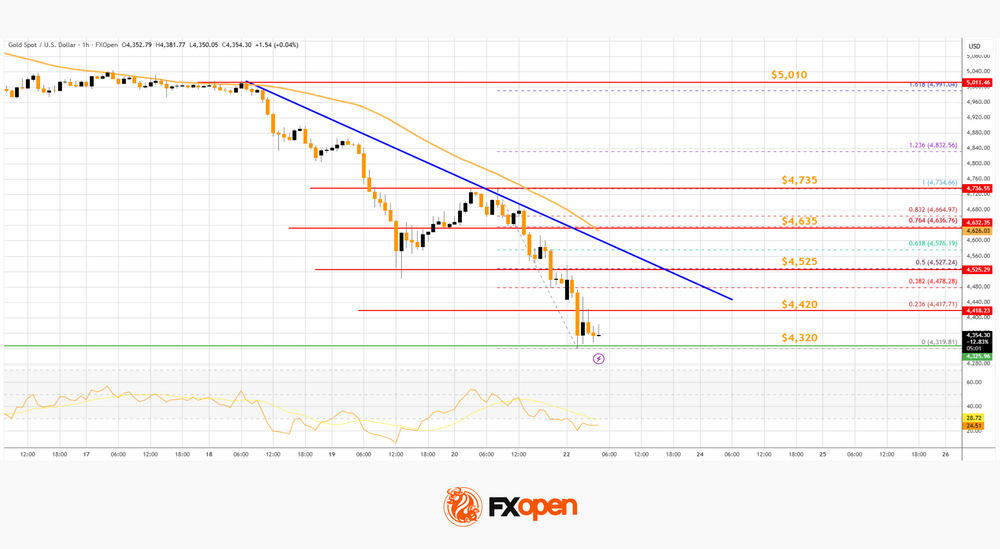
Immediate resistance on the upside is $4,420 or the 23.6% Fib retracement level of the downward move from the $4,734 swing high to the $4,319 low.
The first major hurdle sits at $4,525. There is also a key bearish trend line forming with resistance at $4,525 and the 50% Fib retracement. A close above $4,525 could initiate a recovery wave to $4,635. An upside break above $4,635 could send Gold price toward $4,735. Any more gains may perhaps set the pace for an increase toward $5,010.
If there is no fresh increase, the price could continue to move down. Initial support on the downside is near the $4,320 level. The first key area of interest might be $4,300. If there is a downside break below $4,300, the price might decline further. In the stated case, the price might drop to $4,200.
WTI Crude Oil Price Technical Analysis
On the hourly chart of WTI Crude Oil at FXOpen, the price started a strong increase from $91.80 against the US Dollar. The price gained bullish momentum after it broke $95.00.
There was a sustained upward movement above $95.50 and $98.00. More importantly, there was a break above a connecting bearish trend line at $97.00. The bulls pushed the price above the 50-hour simple moving average, and the RSI climbed toward 60.
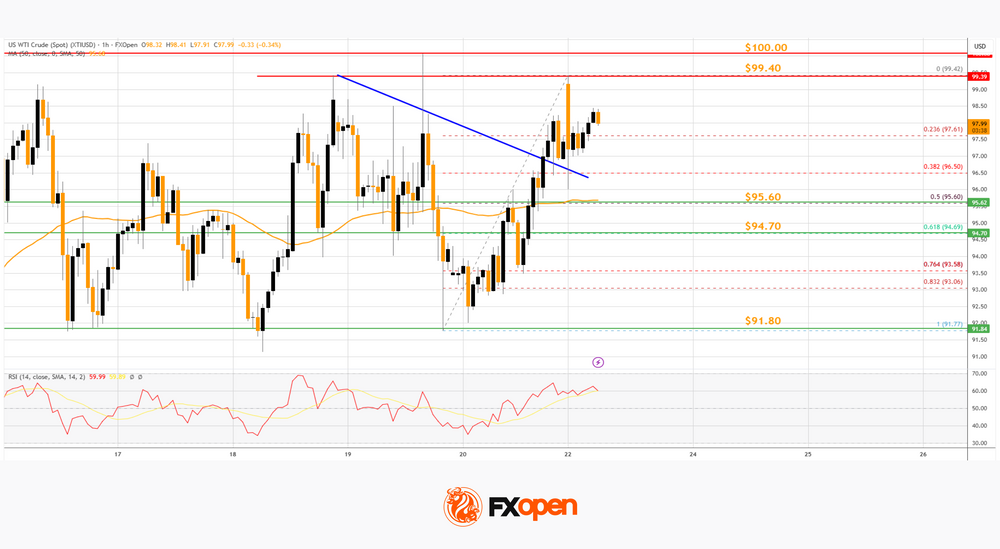
A high was formed near $99.42 before there was a minor pullback. The price declined below the 23.6% Fib retracement level of the upward move from the $91.77 swing low to the $99.42 high.
However, the bulls are active above $95.00. Immediate resistance is $99.40. If the price climbs further, it could face hurdles near $100.00. The next major stop for the bulls might be $102.00. Any more gain might send the price toward $105.00.
Conversely, the price might correct gains and retest the 50-hour simple moving average at $95.60 and the 50% Fib retracement. The next area of interest on the WTI crude oil chart could be $94.70.
If there is a downside break, the price might decline to $91.80. Any more losses may perhaps open the doors for a move toward $85.00.
Start trading commodity CFDs with tight spreads (additional fees may apply). Open your trading account now or learn more about trading commodity CFDs with FXOpen.
This article represents the opinion of the Companies operating under the FXOpen brand only. It is not to be construed as an offer, solicitation, or recommendation with respect to products and services provided by the Companies operating under the FXOpen brand, nor is it to be considered financial advice.
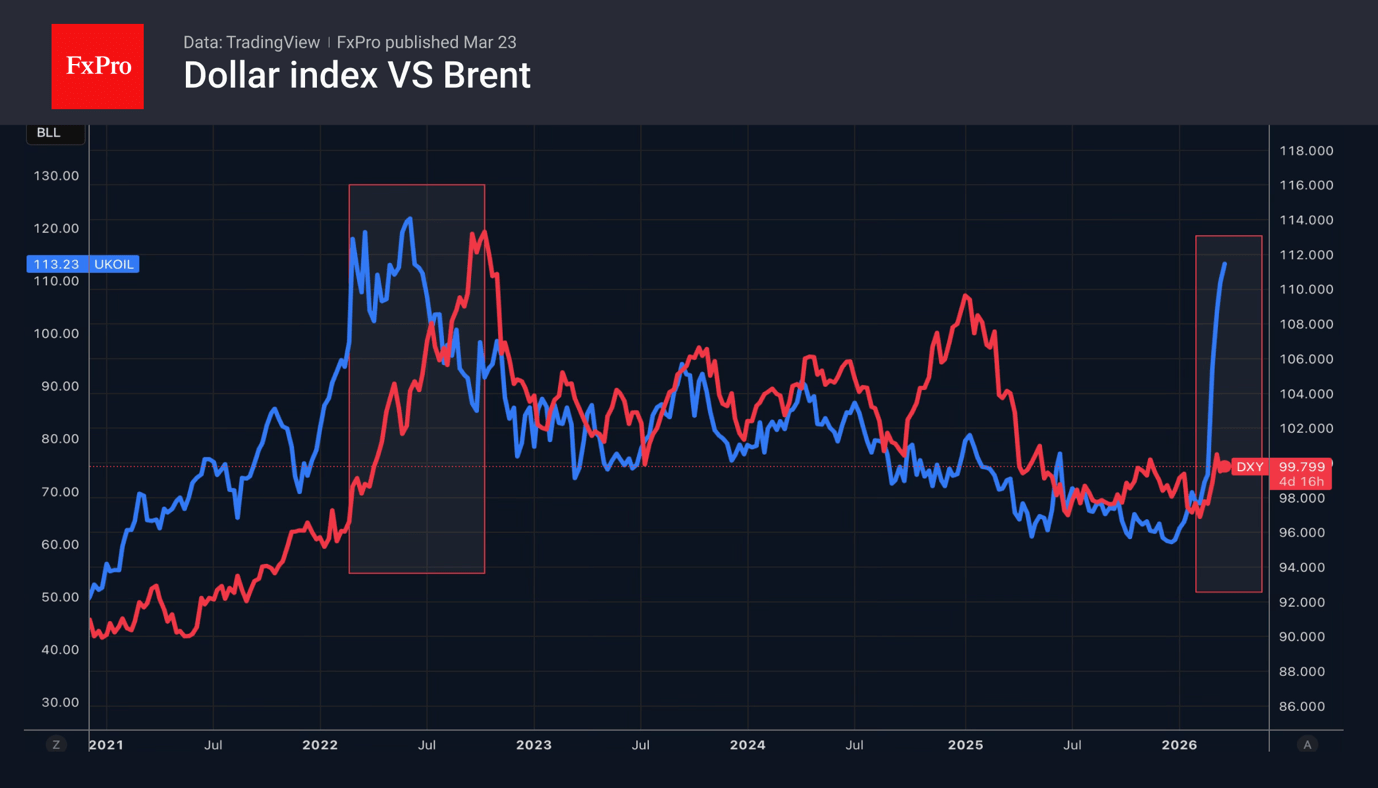
Middle East Conflict Keeps Casting a Shadow Over Financial Markets
Markets
The Middle East conflict keeps casting a shadow over financial markets, affecting literally every asset class. Channels through which are multiple. Risk premia and inflation (expectations) batter long-term government bonds. The impact of significantly higher rates on already fragile public finances acts as an accelerant. The UK last Friday was case in point with a batch of very poor deficit numbers adding more pressure to gilts. The worrying thing is that the February figures pre-date the Iran war, so they are not even taking into account the increased interest rate burden nor the potential fiscal response to higher energy prices. The UK 10-yr yield briefly topped the 5% barrier Friday for the first time since 2008. German yields in the 10-30 yr bucket added 7.3-8.1 bps with the 10-yr closing at the highest level since 2011 (3.04%). Treasuries underperformed by rising 10-13 bps in the same segment. The front end of the curve meanwhile is positioning for rate hikes. The ECB and especially the Bank of England, both scarred by the 2022 energy crisis, showed they are ready and willing. UK short-term rates soared 16 bps. The US and Germany joined the move higher with 11-12 bps and >8bps respectively. Money markets are pricing in more than three hikes this year by the ECB and BoE while any remaining rate cut bets in the US have swapped for a 60% hike chance by end of this year. US president Trump’s 48-hour deadline issued on Saturday is bound to keep core bonds at all maturities under pressure at the start of another potentially explosive week. Trump on Saturday demanded the Strait of Hormuz to be fully open and without threats or Iran would have its power plants bombed. Iran has shown little intention of complying. Oil prices react by moving higher. Brent is currently trading around $113 per barrel. Stagflationary vibes meanwhile are hurting risk assets. The EuroStoxx50 (-2% on Friday) lost key support from the pre-Liberation Day high (5568.2) and the 23.6% retracement on the rally that followed the now infamous April 2. The S&P500 (-1.5%) is at a key technical juncture around 6500. Losses on Asian stock markets this morning are suggesting more pain is inbound. The US dollar is the preferred currency still but truth be told: it isn’t steamrolling its peers either. USD/JPY does close in on the crucial 160 barrier, hovering near the levels that prompted (market) talk of a coordinated US-Japanese FX intervention. EUR/USD lost three big figures from 1.18 since the war erupted but since then traded sideways around the 1.15 lever. For sterling it seems that the significantly widening interest rate differentials are losing relevance as a GBP driving factor. EUR/GBP is bottoming out north of 0.86.
News & Views
Rating agency Standard and Poor’s on Friday raised Ireland’s credit rating to AA+ from AA with a stable outlook. The move was driven by stronger economic and fiscal profiles. Despite rising global trade protectionism, Ireland’s domestic economy has expanded by close to 5% on average for 5 consecutive years. Given the economy's extreme openness (exports equivalent to 144% of GDP), it will remain sensitive to external shocks and decisions of a handful of multinational companies. Even so, S&P assesses that ‘the economy's diversity, the significant fiscal and economic buffers, the sound policy settings, and membership in the EU and the euro area will help authorities shield households and companies from a slowdown in global growth, a withdrawal of foreign direct investment, or deteriorating terms of trade’. The government has taken advantage of recent economic success to rebuild fiscal buffers and S&P sees budget surpluses at an average of 1.3% of gross national income (GNI) over 2026-2029. Net government debt furthermore has fallen to 43% of GNI in 2025 from 96% of GNI in 2020.
In an address at the China Development forum in Beijing on Sunday, Prime Minister Li Qiang addressed the concerns of trading partners on China’s lager trade surplus. He confirmed the country’s intention to further open its economy and to work to promote a more sound and balanced development of trade. In this perspective, he indicated that China would further widen market access for the services sector, and increase imports of medical and health care products, digital technologies and low carbon services to provide more business opportunities for foreign companies. The ‘commitments’ came as China last year posted a record $ 1.2 trillion trade surplus last year. At the same event, PBOC governor Pan Gongsheng put the impact of the large current account surplus into perspective as he said that is allocated to different regions and industries worldwide through foreign investment. In this respect he sees it as underpinning global economic growth and financial stability. The PBOC governor also indicated that China has no intention to gain competitive advantage of a currency depreciation.
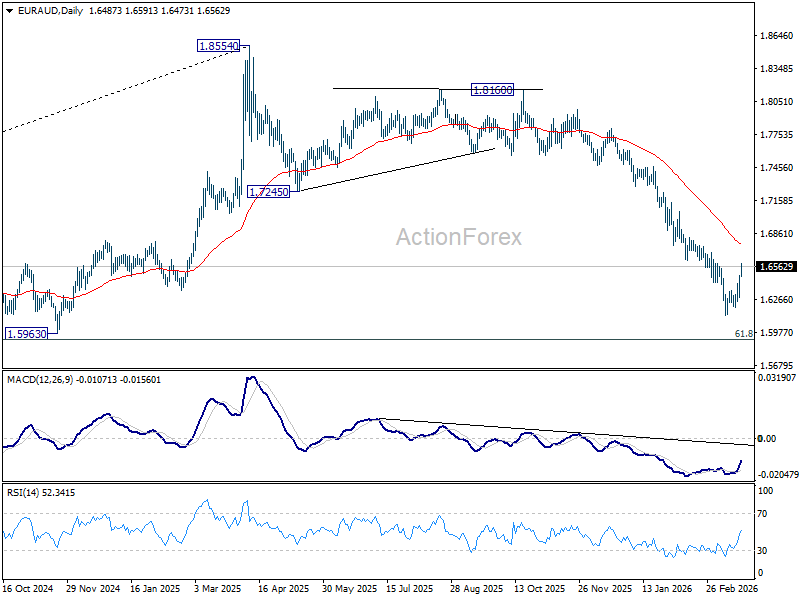
EUR/AUD Daily Outlook
Daily Pivots: (S1) 1.6347; (P) 1.6418; (R1) 1.6546; More...
Intraday bias in EUR/AUD remains neutral with focus on 1.6594 resistance. Firm break there will confirm short term bottoming at 1.6125, and bring stronger rebound to 55 D EMA (now at 1.6769) and above. Nevertheless, below 1.6413 minor support will bring retest of 1.6125 low. Decisive break there will resume larger fall from 1.8554 to 1.5913 fibonacci level next.
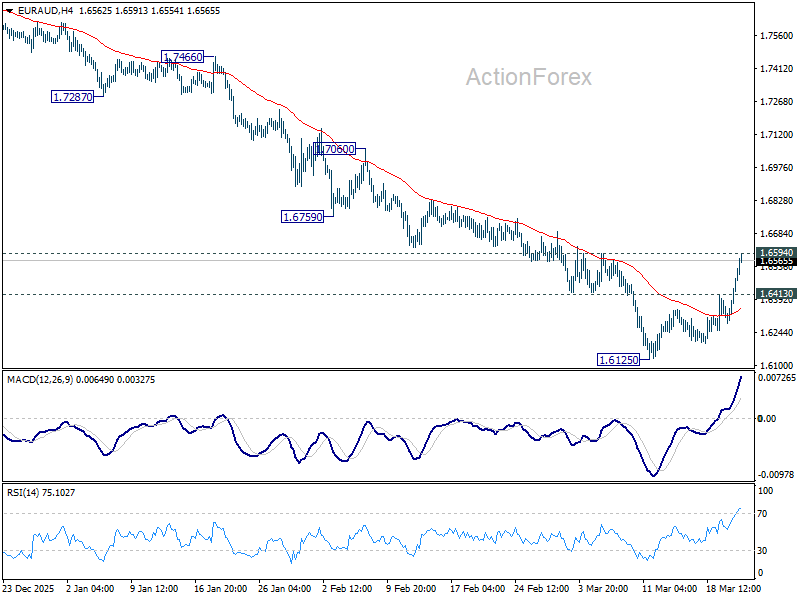
In the bigger picture, fall from 1.8554 medium term top is seen as reversing the whole up trend from 1.4281 (2022 low). Deeper decline should be seen to 61.8% retracement of 1.4281 to 1.8554 at 1.5913, which is slightly below 1.5963 structural support. Decisive break there will pave the way back to 1.4281. For now, risk will stay on the downside as long as 55 W EMA (now at 1.7245) holds, even in case of strong rebound.