Sample Category Title
Japan core CPI falls to 1.7% in February, as energy costs drag inflation lower
Japan’s inflation slowed further in February, with core CPI (ex-fresh food) easing from 2.0% yoy to 1.6% yoy, below expectations of 1.7% yoy. The drop pushed core inflation below the Bank of Japan’s 2% target for the first time in nearly four years, largely reflecting government measures to curb electricity costs.
The decline was driven primarily by falling energy prices. Energy costs dropped -9.1% yoy after -5.2% yoy in January, with gasoline prices plunging -14.9% yoy and electricity bills falling -8.0% yoy. This sharp easing in energy inflation offset still-elevated food prices, where costs excluding fresh items rose 5.7% yoy, albeit moderating from 6.2% yoy previously.
Broader inflation indicators also softened. Core-core CPI (ex-fresh food and energy) edged down from 2.6% yoy to 2.5% yoy. Headline CPI fell from 1.5% yoy to 1.3% yoy, marking the lowest level since March 2022 and a fourth consecutive monthly slowdown.
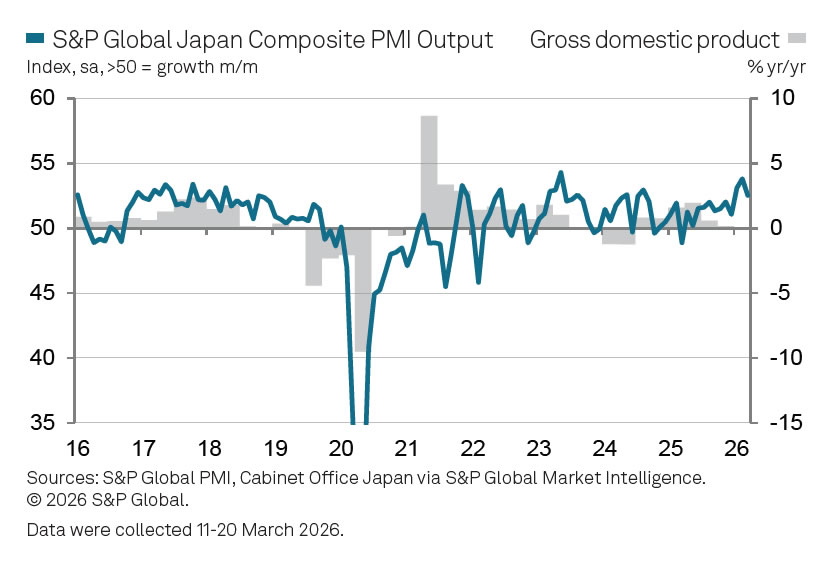
Japan PMI composite falls to 52.5, war lifts costs and hits sentiment
Japan’s private sector growth lost momentum in March as PMI data showed a broad-based slowdown across both manufacturing and services. PMI Manufacturing fell from 53.0 to 51.4, PMI Services eased from 53.8 to 52.8, and PMI Composite declined from 53.9 to 52.5, pointing to softer expansion after a strong start to the year.
The slowdown coincided with a sharp rise in input costs, with inflation accelerating to its fastest pace in nearly a year. According to S&P Global, higher energy prices and supply chain disruptions linked to the Middle East conflict were key drivers, alongside a weaker Yen and rising labor costs. While factory gate prices increased more quickly, service providers raised charges at a slower pace, resulting in a squeeze on margins.
S&P Global’s Annabel Fiddes noted that growth in output, new orders, and employment all moderated, with firms becoming more cautious amid heightened uncertainty. Confidence weakened, particularly in the services sector, as companies grappled with rising costs and unclear demand prospects. While manufacturers remain somewhat optimistic due to global demand in sectors such as AI and semiconductors, the overall outlook has become more uncertain as the war-driven shock feeds through the economy.
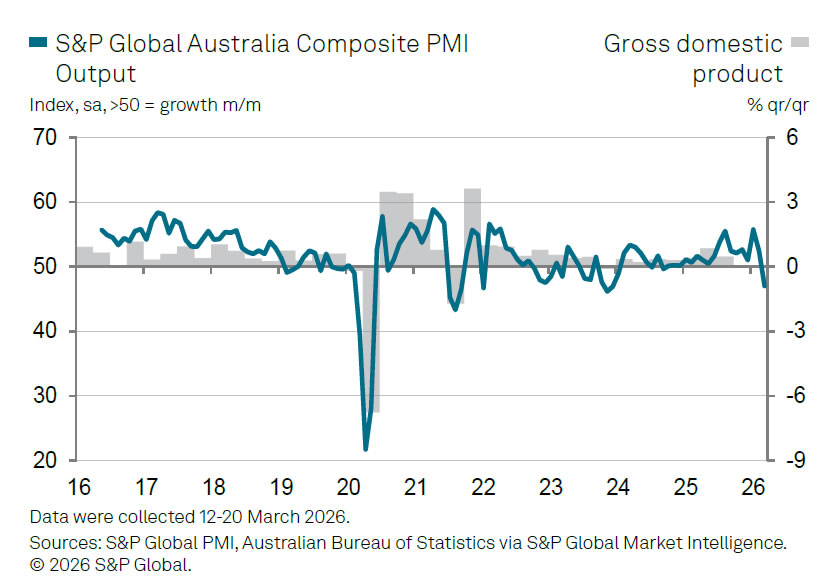
Australia PMI composite falls to 47, cost inflation hits 3-yr high on Middle East conflict
Australia’s private sector slipped into contraction in March as PMI data signaled a sharp deterioration in activity. PMI Manufacturing edged down from 51.0 to 50.1. But the real drag came from services, where PMI Services plunged from 52.8 to 46.6. As a result, PMI Composite dropped from 52.4 to 47.0, marking its weakest level since December 2023.
The data highlight a clear loss of momentum in demand, particularly across the services sector. According to S&P Global’s Eleanor Dennison, business activity contracted for the first time in a year-and-a-half, reflecting a fresh drop in demand for both services and manufactured goods. The deterioration in sentiment suggests that firms are becoming more cautious as external conditions worsen.
At the same time, inflation pressures are intensifying. Input costs rose sharply, with composite cost inflation hitting its highest level in over three years, while output charges climbed to their strongest since August 2023.
Dennison noted that the figures offer an early indication of how the Middle East conflict is feeding through to the global economy, with Australian firms facing rising costs, supply chain disruptions, and weakening demand—pointing to emerging stagflation dynamics.
RBNZ’s Breman warns of inflation spike but cautions against overreaction
RBNZ Governor Anna Breman warned that the Middle East conflict is likely to push New Zealand’s economy into a more challenging environment of higher inflation and weaker growth. Speaking today, she said policymakers expect “higher headline inflation over the near term, and somewhat weaker growth momentum,” highlighting the stagflationary nature of the shock stemming from elevated energy prices and global uncertainty.
Beyond inflation and growth, Breman pointed to "global financial stability risks", noting that global stress could affect funding conditions for New Zealand banks. However, she emphasized that the domestic banking system remains resilient, with strong capital and liquidity buffers. Recent stress tests suggest banks are “well-placed to weather severe geopolitical shocks,” offering some reassurance despite the volatile global backdrop.
On policy, Breman stressed the importance of avoiding a premature response to "temporary inflation spike" that monetary policy cannot directly address, while also guarding against the risk of inflation becoming entrenched. The committee will remain vigilant to ensure that temporary price pressures do not translate into persistent inflation, reaffirming that delivering low and stable inflation over the medium term remains the central objective.
RBNZ Governor Breman Speaks on Middle East War
Governor Breman emphasized that the RBNZ would be focused on medium-term inflation pressures, and that for now there’s little evidence these have lifted to suggest a need for near-term OCR hikes.
In a speech released this morning, Governor Breman emphasized that the RBNZ would be focused on medium-term inflation pressures, and that for now there’s little evidence these have lifted to suggest a need for near-term OCR hikes. The duration of the Iran war will be key.
Sticking to the playbook
As foreshadowed last week, this morning the RBNZ released the speech that Governor Breman will deliver to a business audience at 2pm today, and which will be discussed in scheduled meetings with economists and the media over the course of the day. The speech set out the RBNZ’s preliminary thoughts on the likely impact of the Middle East war on the New Zealand economy.
The key takeout is the RBNZ will look through the near-term first round impact of the oil shock on inflation and is therefore very unlikely to quickly jump to rate hikes. Rather, rate hikes will only be brought forward should there be an accumulation of evidence suggesting that the oil shock is generating second-round pressures on wages and prices, leading to higher inflation over the medium term. Those second-round effects – which are more likely to occur if the conflict is prolonged – are unlikely to be evident for some time.
As we discussed in an article released at the onset of the conflict, the RBNZ faces two-sided risks, rather than the one-sided risk that has been contemplated by markets. Key quotes from the speech that illustrate this point are:
- “We should try to avoid reacting too early to near-term inflation pressures that monetary policy can do little about – or reacting too late if above-target inflation becomes embedded in the economy.”
- “As a forward-looking Committee, we tend to look through first round direct and indirect effects and focus on medium-term second round effects.”
- “Higher production costs often result in squeezed margins and lower real incomes, and tend to dampen economic growth. A slowdown in growth may in turn dampen inflationary pressures over the medium term.”
- “Recent events do have some similarities with the last time we saw consumer prices increase quickly, such as regional conflicts, global oil price increases, and shipping disruptions in the Middle East. But there are also some important differences that could impact our outlook for medium term price pressures.”
- “….while the recovery has broadened, it is still in its early stages, and the New Zealand economy continues to operate below capacity. Household and business balance sheets are also more fragile, with less scope to absorb significant price increases. This means it may be harder for businesses to increase prices, and it could be less likely that short-term price pressures driven by supply-side shortages will become embedded in medium-term inflation.”
- “A short-lived disruption and a temporary increase in petrol prices can – and should – be looked through from a monetary policy perspective if it is unlikely to have an impact on medium-term inflation outcomes….The picture changes if this disruption is longer lasting; if there are longer-lasting impacts on global productive capacity or domestic demand; or if there is a greater risk of heightened oil and other import prices feeding into higher inflation expectations and inflationary wage- and price-setting behaviour.”
The RBNZ is very much sticking by the playbook here by noting a bias to looking through what is currently judged to be a short-term supply shock. Monetary policy is poorly positioned to offset the short-term inflation impacts coming from the Iran war’s increase in oil prices and related supply chain impacts. The RBNZ’s focus on medium-term inflation pressures is entirely conventional, and the reality is that no one knows much about those right now.
What is known is that this shock has come at a time when the economy was at an early stage of the recovery and excess capacity remains high. Hence the situation is very different from 2022 when the Russian war impact on inflation added further medium-term inflationary fire to an already hot economy. Breman appropriately notes this as something that gives the RBNZ some space to assess whether these short-term pressures will translate to medium term pressures.
It’s unlikely the RBNZ will be raising rates in the next 6 months. It’s going to take time to work out how long this shock lasts, the impact on the economy and excess capacity and the implications for medium-term inflation pressures. OCR cuts similarly look unlikely while this assessment is being made.
The reaction of the exchange rate may well be influential in determining what happens next. The New Zealand dollar could be very vulnerable in this environment given our weak growth, low interest rates and supply chain vulnerabilities. Should the NZD trend lower (as would be conventional for this type of supply shock) then the medium-term calculus may change. Real interest rates will be negative for quite a bit for a while – hence our view of OCR hikes over 2027 remain very valid. Global interest rates might well also be rising that year.
The RBNZ will have more to say about the impact of the conflict on the economic outlook at the 8 April OCR Review which, as announced last week, will also be followed by a post-meeting press conference. It remains to be seen whether developments in the Middle East over the coming three weeks provide any additional clarity.
USD/CAD: Cautiously Bullish, Waiting for a Decisive Break Above 1.3730
- USD/CAD experienced high volatility after the US postponed military strikes on Iran, leading to a "risk-on" sentiment shift.
- The resulting weakness in the US Dollar was offset by a massive ~7.5% drop in WTI crude oil, which prevented the commodity-linked CAD from making gains and left the pair flat near 1.3715.
- The bias is cautiously bullish, requiring a decisive break above the key technical level of 1.3730
- The pair's movement will be governed by the 5-day US/Iran discussion window, further WTI price swings, and the potential for new US tariffs on EU goods.
USD/CAD had a wild ride today much like markets as a whole. Early in the session, the pair reached a fresh high of 1.3755, testing the peak set in January.
Following a major geopolitical headline, the pair plummeted to an intraday low of 1.3683, testing critical technical support. By the afternoon, the pair settled into a flat, rotational pattern near 1.3715, as the market balanced a weaker US Dollar against falling oil prices.
The Trump seesaw continues
The defining driver was President Trump’s announcement to postpone planned military strikes on Iranian energy infrastructure for five days. This triggered a "risk-on" sentiment shift, reducing the "war premium" and safe-haven demand that had been propping up the US Dollar.
Crude oil (WTI) fell nearly 12% immediately following the news, eventually stabilizing near $90 (a 7.5% intraday drop). Since the Canadian Dollar is a commodity-linked currency, the massive drop in oil prices offset the US Dollar's weakness, preventing the CAD from making significant gains and leaving the pair "flat."
Remarks from Fed officials provided a backdrop of caution. Governor Stephen Miran urged policy-making based on long-term trends rather than "short-term headlines," while Chicago Fed President Austan Goolsbee warned that oil shocks remain "stagflationary," suggesting rate cuts might not happen until late 2026.
Factors affecting USD/CAD moving forward
Moving forward, the pair will likely be influenced by several high-impact variables:
The five-day "window" established by the US for discussions with Iran will keep markets on edge. Any breakdown in talks or a resumption of strike threats would likely spike the USD and oil prices simultaneously.
As Canada is a major crude exporter, the CAD remains highly sensitive to WTI price swings. If oil recovers on supply concerns, the CAD could strengthen; if de-escalation continues, oil may fall further, weakening the Loonie.
Markets are closely watching for "proof of inflation" from the Fed. A hawkish stance from the Fed compared to a potentially more dovish Bank of Canada (BoC) would provide long-term upward pressure on USD/CAD.
Reports of potential 15–20% minimum tariffs on EU goods by the Trump administration suggest a continuing protectionist stance that could bolster the USD through trade-war risk appetite.
Technical Analysis - USD/CAD
Back to the technicals though and USD/CAD continues to test the 1.3730 key level.
The daily chart shows USD/CAD is struggling to gain acceptance and record a daily candle close above the 1.3730 key level.
If the pair does gain acceptance above this key level, there is a confluence area just beyond that where the 100-day (black) and 200-day (orange) MAs are converging near the 1.3800 handle.
The 200-day MA at 1.3803 represents a "line in the sand", a break above this would signal a return to a long-term bullish bias.
Significant long-term support remains at 1.3501.
The Relative Strength Index (RSI) is sitting at 55.66, suggesting there is still room for further upside before the pair becomes overbought with momentum favoring bulls.
The bias is cautiously bullish but lacks conviction. A decisive break and hold above 1.3730 would likely trigger a run toward the 1.3800 handle. Conversely, if the pair drops below the moving average cluster at 1.3650, expect a move back toward the 1.3580 support zone.
USD/CAD Daily Chart, March 23, 2025
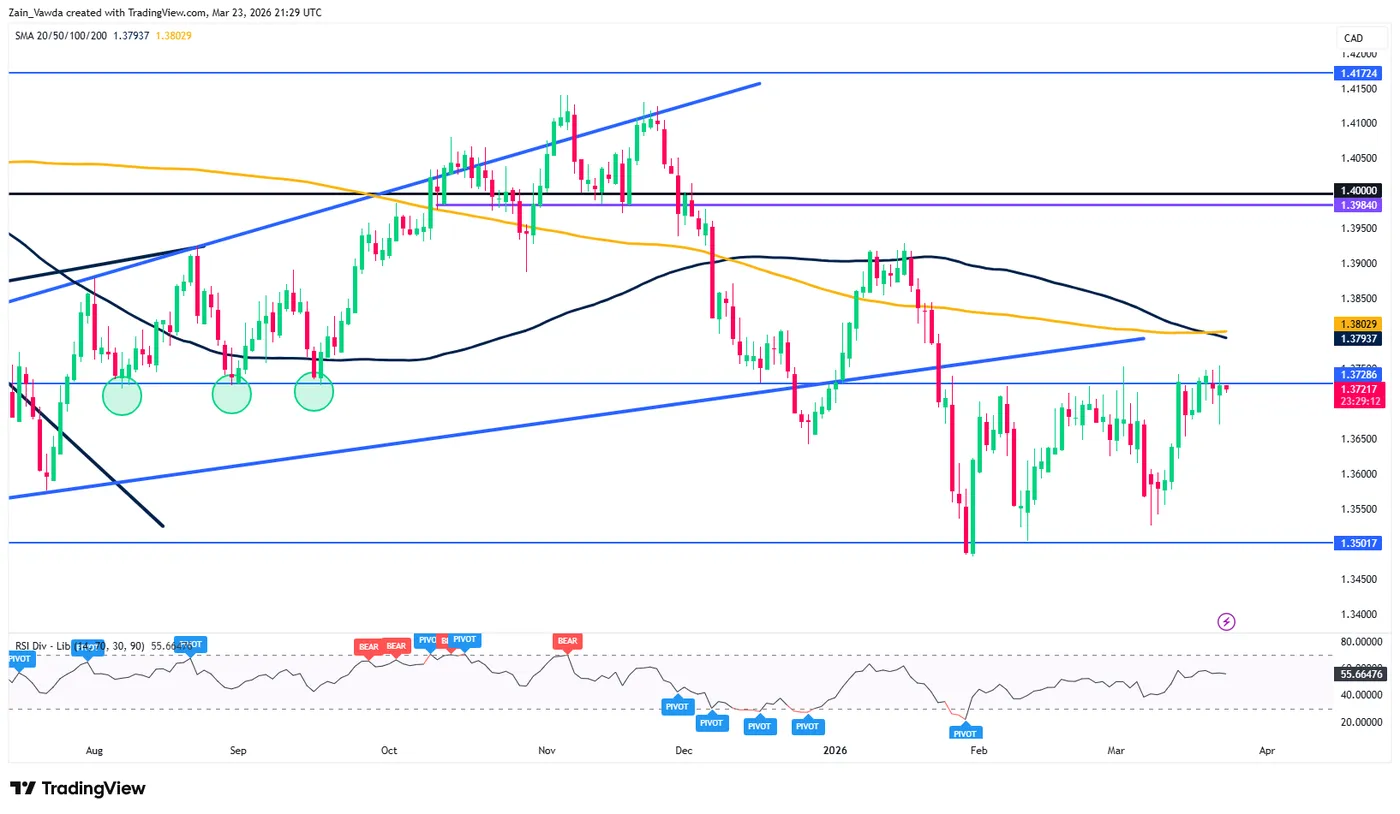
Source: TradingView.com (click to enlarge)
Gold Wave Analysis
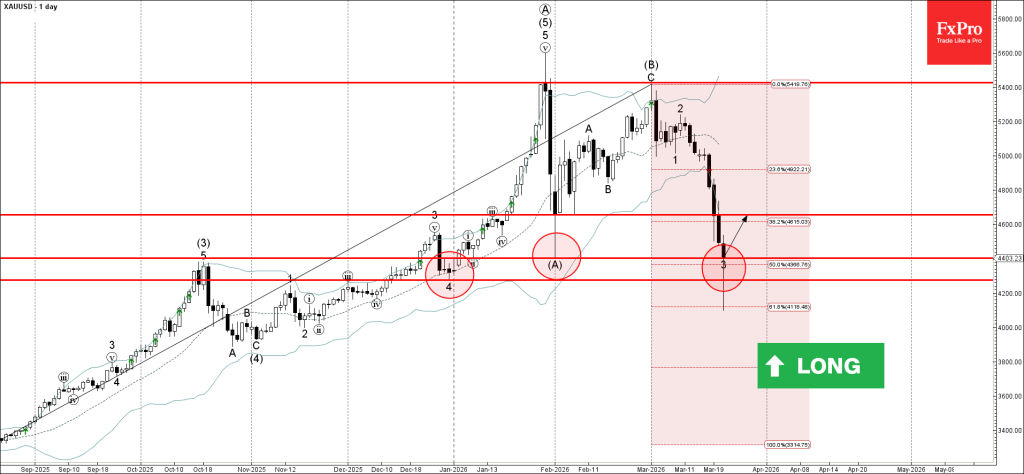
Gold: ⬆️ Buy
- Gold reversed from support zone
- Likely to rise to resistance level 4655.00
Gold today reversed up from the support zone between the support levels 4400.00 (low of wave (A) from February)), 4275.00 (low of wave 4 from December) and 50% Fibonacci correction of the upward impulse from last year.
The upward reversal from this support zone is currently forming daily Japanese candlesticks reversal pattern Hammer.
Given the strong daily uptrend, Gold can be expected to rise toward the next resistance level 4655.00 (former support from February).
GBPAUD Wave Analysis
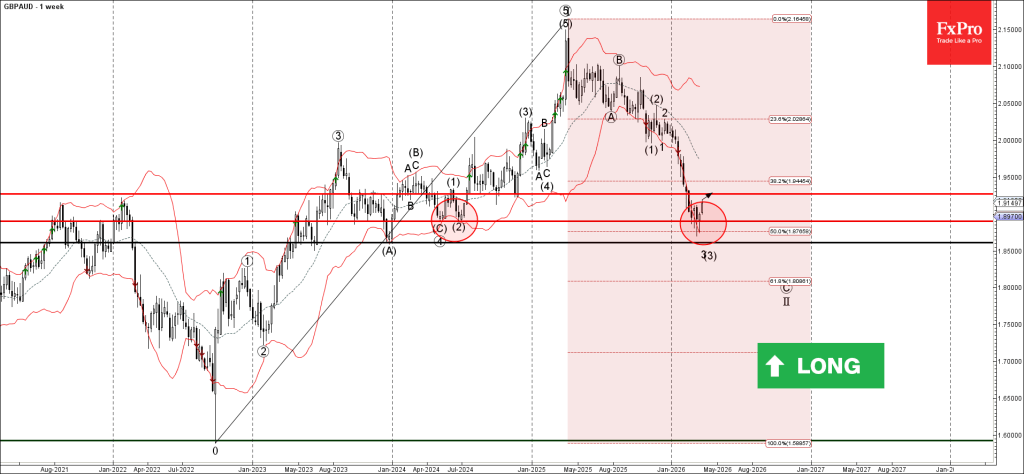
GBPAUD: ⬆️ Buy
- GBPAUD reversed from support zone
- Likely to rise to resistance level 1.9270
GBPAUD currency pair recently reversed from the support zone between the key support level 1.8900 (former double bottom from 2024), lower weekly Bollinger Band and 50% Fibonacci correction of the upward impulse from July.
The upward reversal from this support zone created the weekly Japanese candlesticks reversal pattern Hammer.
Given the strength of the nearby support level 1.8900, GBPAUD currency pair can be expected to rise to the next resistance level 1.9270 (former strong support form 2024).
AUDNZD Wave Analysis
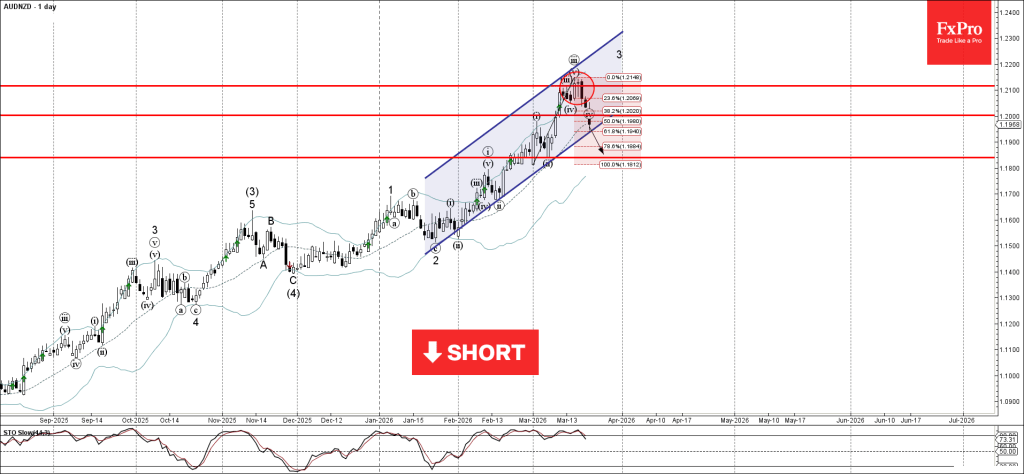
AUDNZD: ⬇️ Sell
- AUDNZD broke support zone
- Likely to fall to support level 1.1840
AUDNZD currency pair recently broke the support zone between the support level 1.2000 and 38.2% Fibonacci correction of the upward impulse from March.
The breakout of this support zone accelerated the active minor correction iv – which belongs to wave 3 from January.
The price is currently approaching the daily up channel from January – which if broken can lead to further losses toward the next support level 1.1840 (low of the previous correction ii).
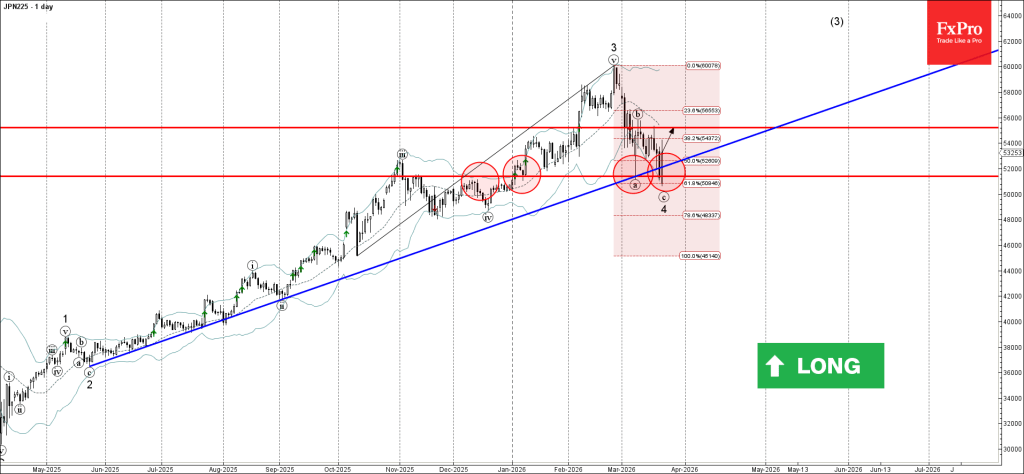
Nikkei 225 Wave Analysis
Nikkei 225: ⬆️ Buy
- Nikkei 225 reversed from support zone
- Likely to rise to resistance level 55200.00
Nikkei 225 index recently reversed up from the support zone between the support level 51400.00 (which has been reversing the price from January), support trendline from May of 2025 and 61.8% Fibonacci correction of the upward impulse from October.
The upward reversal from this support zone created the weekly Japanese candlesticks reversal pattern Bullish Engulfing.
Given the clear daily uptrend, Nikkei 225 index can be expected to rise toward the next resistance level 55200.00 (top of the previous correction (b)).